
 Submit a Paper
 Propose a Special lssue
 Open Access
ARTICLE
Robust Real-Time Analysis of Cow Behaviors Using Accelerometer Sensors and Decision Trees with Short Data Windows and Misalignment Compensation
1 Institute of Information Technology, Vietnam Academy of Science and Technology, Hanoi City, 100000, Vietnam
2 Graduate University of Sciences and Technology, Vietnam Academy of Science and Technology, Hanoi City, 100000, Vietnam
3 Faculty of Electrical and Electronic Engineering, Phenikaa University, Hanoi City, 100000, Vietnam
* Corresponding Authors: Manh-Tuyen Vi. Email: ; Duc-Tan Tran. Email:
Computers, Materials & Continua 2025, 83(2), 2525-2553. https://doi.org/10.32604/cmc.2025.062590
Received 22 December 2024; Accepted 05 March 2025; Issue published 16 April 2025
 View Full Text
 Download PDF
Abstract
This study focuses on the design and validation of a behavior classification system for cattle using behavioral data collected through accelerometer sensors. Data collection and behavioral analysis are achieved using machine learning (ML) algorithms through accelerometer sensors. However, behavioral analysis poses challenges due to the complexity of cow activities. The task becomes more challenging in a real-time behavioral analysis system with the requirement for shorter data windows and energy constraints. Shorter windows may lack sufficient information, reducing algorithm performance. Additionally, the sensor’s position on the cows may shift during practical use, altering the collected accelerometer data. This study addresses these challenges by employing a 3-s data window to analyze cow behaviors, specifically Feeding, Lying, Standing, and Walking. Data synchronization between accelerometer sensors placed on the neck and leg compensates for the lack of information in short data windows. Features such as the Vector of Dynamic Body Acceleration (VeDBA), Mean, Variance, and Kurtosis are utilized alongside the Decision Tree (DT) algorithm to address energy efficiency and ensure computational effectiveness. This study also evaluates the impact of sensor misalignment on behavior classification. Simulated datasets with varying levels of sensor misalignment were created, and the system’s classification accuracy exceeded 0.95 for the four behaviors across all datasets (including original and simulated misalignment datasets). Sensitivity (Sen) and PPV for all datasets were above 0.9. The study provides farmers and the dairy industry with a practical, energy-efficient system for continuously monitoring cattle behavior to enhance herd productivity while reducing labor costs.Keywords
The livestock sector is one of the key pillars of agriculture, playing an important role in providing food and raw materials for production [1–4]. Cow farming is a key component of livestock production, providing meat, milk, and leather. It contributes significantly to the agricultural value chain and plays a crucial role in supporting related industries. With the continuous advancement of science and technology, cow farming has made remarkable progress, from applying high-tech solutions in cow management and care to improving productivity and product quality [5–7].
Cow behavior plays a crucial role in managing, monitoring, and understanding livestock activity patterns, enabling farmers to detect changes that may indicate abnormal conditions [5]. Behaviors such as Feeding, Resting, Standing-up, Lying-down, and Moving provide valuable information about cattle activity and welfare. Therefore, monitoring cow behavior is essential for optimizing herd management, improving productivity, and ensuring animal well-being [8]. While behavior classification does not directly assess cow health, prolonged or unusual behavior patterns may serve as early indicators of potential issues, offering a non-invasive, practical approach for supporting farm management decisions [9]. This study focuses primarily on the classification of these key behaviors to provide a reliable foundation for behavior-based monitoring systems.
Behavior recognition systems and other identification technologies are being rapidly researched, developed, and adopted to enhance farm management efficiency [5–7], offering optimal solutions for livestock monitoring. These systems significantly reduce the labor requirements for monitoring and management, particularly in intensive farming systems with large-scale operations and high numbers of animals. With the advancement of the IoT and increasingly sophisticated sensor technologies, cow behavior monitoring can now be fully automated [10,11]. To maximize cost-effectiveness and minimize disruption to animals’ daily activities, these systems must be designed to be affordable and non-invasive.
There are two main types of behavior monitoring systems: those that rely on wearable devices [12–16] and those that do not [17–19]. Several studies [20,21] have focused on classifying animal behavior using cameras and non-wearable sensor systems. Camera-based monitoring systems combined with computer vision techniques provide high accuracy in behavior classification and can even classify multiple objects simultaneously [20,21]. However, their implementation is often complex and expensive. On the other hand, wearable device-based systems, often incorporating sensor technology, are more cost-effective. Several existing behavior monitoring systems using accelerometer technology have been developed to automatically analyze cow behavior [22,23].
Accelerometers have proven effective in collecting motion data and monitoring cow behavior [2]. The effectiveness of behavior monitoring depends on the placement of the accelerometer on the animal’s body [7]. Studies [2,3] using accelerometers mounted on the neck have demonstrated high accuracy in classifying Eating and Drinking behaviors. Meanwhile, studies [16,18,19] using accelerometers attached to the legs achieved better results in monitoring Standing and Lying behaviors. Although accelerometer-based systems have shown potential in accurately classifying cow behaviors [24], systems that rely on a single accelerometer often face limitations in classification accuracy and can only recognize a narrow range of behaviors [25]. Integrating data from multiple accelerometers, such as devices placed on both the neck and legs, has been proposed in research to improve performance; however, this method requires further study to validate its effectiveness.
Behavior classification systems using accelerometer sensors have achieved high performance, significantly aided by advancements in ML algorithms [26]. These ML algorithms are categorized into two types: (i) supervised, and (ii) unsupervised. Studies [27–29] have applied various ML algorithms to monitor behavior, yielding impressive results. Wang et al. in their studies [21,22] used AdaBoost for classifying cattle behavior, achieving classification accuracy exceeding 0.9 across all behaviors. Similarly, Phung et al. applied Gradient Boosted Decision Trees (GBDT) in their research [23], achieving overall performance metrics with macro-average at 0.96 and micro-average at 0.97. Additionally, the study by Tran et al. [5] utilized Random Forest (RF) and achieved high classification accuracy. However, energy consumption of the devices remains a critical factor in behavior classification tasks. Energy efficiency is a key concern in the design of real-time IoT systems [5]. The high computational complexity in behavior classification algorithms leads to significant energy consumption, which reduces the operational lifespan of devices and increases the frequency of maintenance or battery replacement. This is impractical for large-scale cattle herds [5]. In study [30], García-Martín et al. highlighted the significant energy consumption of ML algorithms, particularly deep learning.
The time window is a key factor in behavior classification, crucial for accurately extracting features from data. Selecting an appropriate window size impacts model performance and enables more accurate behavior recognition, particularly when handling rapidly changing signals over time. Studies [5,21] that require comprehensive information for better classification performance often use long data windows, sometimes up to 60 s. Optimizing the data window remains a challenge, as both overly short and overly long windows can reduce classification accuracy. In practice, using long data windows may result in behavior classification errors, as these windows can encompass multiple activities within a single data segment.
Additionally, device misalignment relative to its initial position cannot be overlooked during behavior classification. Cattle activities can cause sensor misalignment. Using three-axis (x, y, z) to collect acceleration data, any misalignment of the sensor alters the collected data, affecting classification performance [5]. Arcidiacono et al. [3] proposed a classifier using acceleration thresholds on accelerometer axis to classify Standing and Feeding behaviors. While such systems are computationally simple, sensor rotation can severely impact classification performance. Therefore, evaluating the effects of sensor misalignment on behavior classification errors is a critical aspect of this research.
The work of this paper focuses on evaluating the behavior classification capability of the proposed system using an accelerometer worn on cows. Additionally, it examines the impact of device misalignment on behavior classification results. Below are the main challenges encountered during the research on the behavior monitoring system:
– Challenge 1: Limited classification accuracy when using accelerometers. Systems with a single accelerometer can only accurately recognize a limited number of behaviors.
– Challenge 2: Energy issues in designing real-time IoT systems. Algorithms with high computational complexity significantly increase energy consumption, directly affecting the device’s operational time.
– Challenge 3: Optimizing the data window (shortening it). Insufficient or excessive data related to animal behavior when using a data window leads to poor behavior classification performance.
– Challenge 4: Device misalignment on the animal. When collecting accelerometer data along the x-axis, y-axis, z-axis, any misalignment of the sensor changes the collected data, adversely affecting classification performance.
This study proposes the design of an IoT-based behavior classification system to identify cow behaviors in a real-time scenario. The evaluation of sensor misalignment during cow behavior execution is also considered to assess the system’s feasibility in practical applications. The main contributions of this research are summarized as follows:
– Contribution 1: We integrate data from accelerometers attached to the neck and leg of the cow in the behavior monitoring system. By utilizing data from both accelerometers, the behavioral patterns are more clearly represented. The proposed system can predict a wider range of behaviors with higher accuracy.
– Contribution 2: We address the energy challenges of the system by employing a classification algorithm with low computational complexity. DT does not require data normalization and can handle both numerical and categorical data, making it an excellent choice. Fortunately, with accelerometer data, DT can be easily implemented in real-time with low computational costs. Combined with features such as VeDBA, Mean, Variance, and Kurtosis, the proposed approach delivers excellent classification performance.
– Contribution 3: We evaluate the classification performance of the system across various window sizes (3, 6, 9, 12, and 15 s). The proposed system achieves consistent classification performance across different window sizes. Therefore, it is well-suited for a 3-s window, aligning perfectly with the study’s objectives.
– Contribution 4: Using the data collected, we simulate sensor misalignment to assess its impact on behavior classification results. The comparison with cases where the sensor is correctly aligned shows minimal differences. This demonstrates that, with the proposed system, sensor misalignment does not significantly affect classification performance.
The remainder of the paper is organized as follows: Section 1: Discusses related works and identifies key research challenges. Section 2: Presents the behavior recognition system using accelerometers attached to the neck and leg, with a short data window. The proposed method utilizes VeDBA, Mean, Variance, and Kurtosis features, and the DT algorithm is employed for classification. A sensor misalignment simulation is also introduced to evaluate its impact on behavior classification results. Section 3: Evaluates the performance of the proposed system for four primary cow behaviors: Feeding, Lying, Standing, Walking. Section 4: Provides discussions and comparisons with related works. Section 5: Concludes the study.
2.1 IOT System Monitors Behavior
An IoT-based livestock behavior monitoring system can provide early warnings of abnormal health conditions in animals to farmers. Fig. 1 illustrates the IoT system used for monitoring behavior, where accelerometer-equipped devices are attached to the cow’s neck and legs to measure motion data, and a surveillance camera is used to record video footage of the cow’s behavior. Using image data from the camera, behavioral labels can be accurately assigned to the motion data collected from the accelerometers [31].
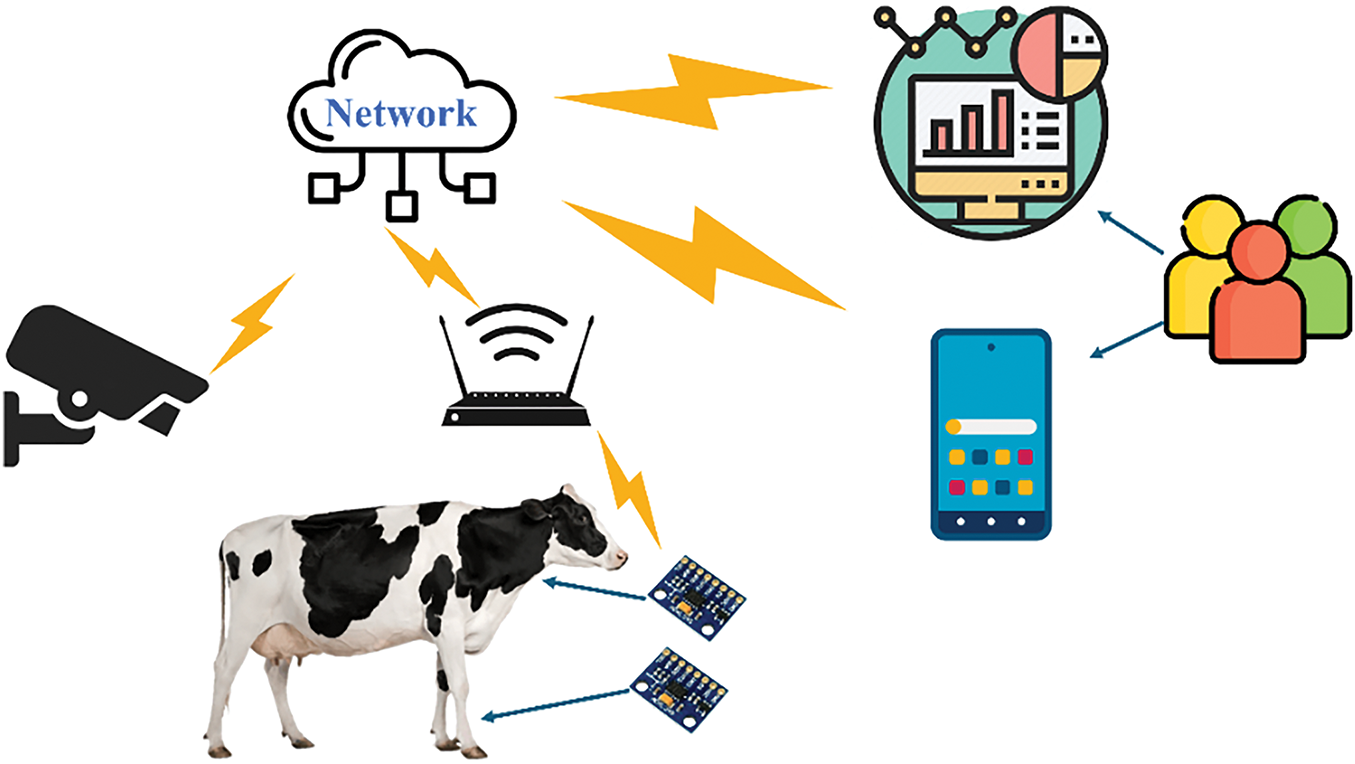
Figure 1: IoT system monitors behavior
The cows in the study are raised and grazed under the climate conditions of the Northern Vietnam Plain. The climate is characterized by a tropical monsoon, with hot and humid summers and cold, dry winters. The average temperature in summer ranges from 28°C to 35°C, while in winter it ranges from 10°C to 15°C. All the cows selected for the study were adult cows, aged between 24 and 36 months. They were all in good health, with no diseases or injuries that could affect their natural behavior. Their weight ranged from 200 to 250 kg. Two ADXL345 accelerometers [32] were used to measure motion data for each cow (Fig. 2). The ADXL345 is capable of measuring acceleration along three-axis in Cartesian coordinates. With a measurement range of ±2, ±4, ±8, and ±16 g, the ADXL345 is well-suited for motion recognition, tilt measurement, and real-time activity tracking. Operating within a temperature range of −40°C to +85°C, the ADXL345 ensures reliable performance even in extreme environmental conditions. Since raw data from the ADXL345 typically contains noise, the accelerometers used in this study were equipped with Kalman filters to denoise the signal and improve accuracy.
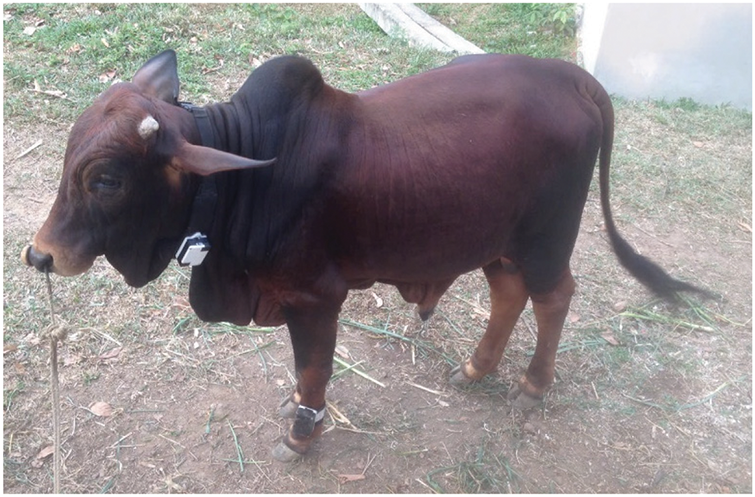
Figure 2: The cows in the study area were equipped with devices on their necks and legs
The motion data collected from the two accelerometers attached to the cow were transmitted to two ATmega328 microcontrollers [33]. Leveraging its advanced RISC architecture, the ATmega328 executes most instructions in a single clock cycle, offering superior processing efficiency. The ATmega328 also supports an operating voltage range of 1.8 to 5.5 V and a temperature range of −40°C to +85°C, ensuring robust performance under harsh environmental conditions.
Once the accelerometer data was transmitted to the microcontroller, it underwent preprocessing to remove high-frequency noise using a low-pass filter. This step retained low-frequency components containing key information. Subsequently, the processed data were framed at the microcontroller, which featured an integrated LoRa communication module for data transmission. Fig. 3 shows the device worn on the cow’s neck and legs.
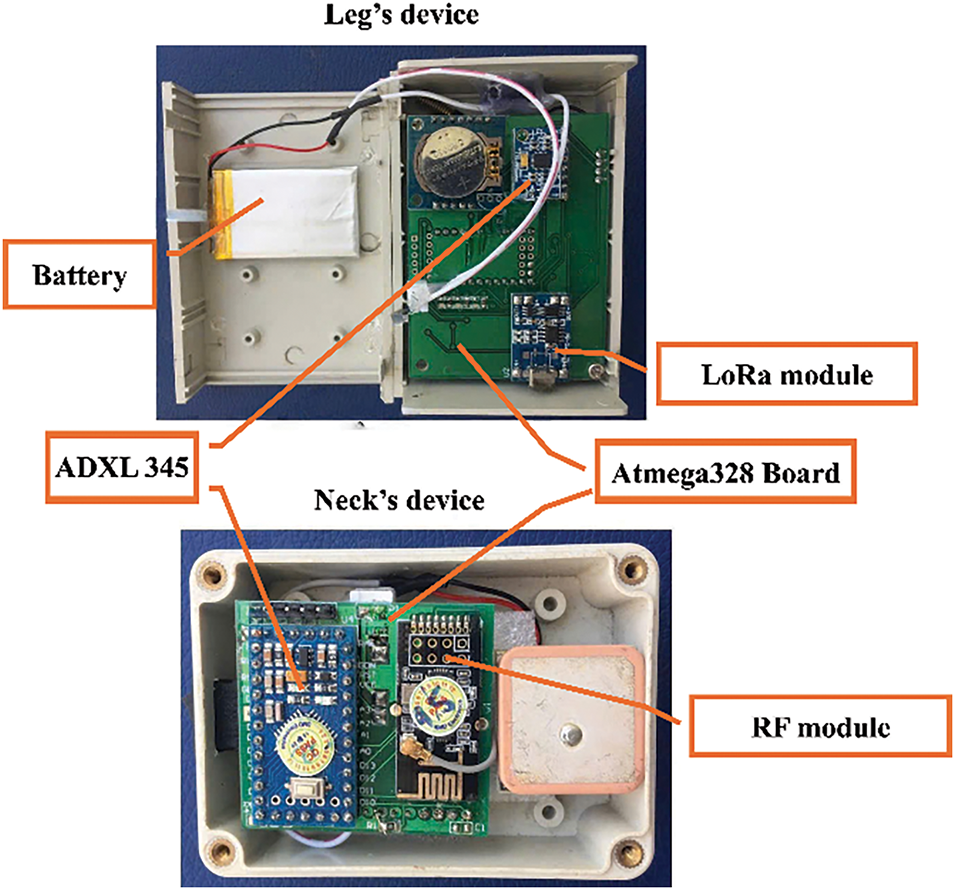
Figure 3: Device on the cow’s neck and legs
The labeling of cow behaviors was conducted directly on the farm. Table 1 provides a detailed description of the behaviors observed and labeled in this study. Visual observations were utilized to accurately synchronize the behavior labels with the accelerometer data collected from the sensors attached to the cow’s neck and legs. This process ensured precise alignment between the real-world activities of the cows and the corresponding motion data, enabling high-quality annotations for subsequent analysis.

Energy consumption is a critical aspect of the system design. To evaluate power consumption, several parameters were analyzed, including available bandwidth and the power requirements of the ADXL345, ATmega328, and other devices. With an available bandwidth ranging from 100 to 500 kHz, the estimated battery life of the wearable devices on the cows was approximately 400 h (about 16 days). Table 2 presents the energy consumption of the system in different operating modes.

The primary factors affecting battery life in the proposed system are the power demands of active components, operational modes, and environmental conditions. The LoRa module contributes significantly to energy consumption, accounting for 50%–55% during data transmission, while the ADXL345 accelerometer and ATmega328 microcontroller collectively consume 25%–30% during sensing and processing. Operational modes, such as high-activity states, increase power usage due to frequent sensing and data transmission, reducing battery life to 300–350 h. Conversely, low-activity states and optimized transmission intervals extend battery life to 450–500 h.
Extreme weather conditions can further impact device performance and energy consumption. High temperatures may accelerate battery degradation, reducing capacity by 5%–10% for every 10°C above 25°C. Battery capacity may decrease by 5%–10% for every 10°C rise above 25°C, potentially reducing the expected lifespan from 400 h to approximately 360–370 h in regions where daily temperatures regularly exceed 35°C. Low temperatures slow chemical reactions, potentially decreasing capacity by 10%–15% when temperatures fall below 0°C. High humidity and heavy rainfall can cause sensor drift and corrosion, leading to 3%–5% accuracy loss after 48 h of exposure to humidity levels exceeding 90%. Additionally, strong winds and rain may disrupt data transmission when bandwidth usage reaches the 500 kHz limit.
Seven cows in our experiment were assigned seven corresponding ID (ID1, ID2, ID3, ID4, ID5, ID6 and ID7). The ADXL345 accelerometer sensor on the wearable device attached to a cow’s leg measures leg movements during various behaviors. The movement data is sampled at a rate of ten samples per axis per second. With data captured along three-axis (x, y, z), the sensor collects 30 samples per second. This data is transmitted to the Atmega328 microcontroller. Subsequently, the ten samples collected for each axis are averaged to produce one sample per second. This averaging method ensures that one final sample per second is obtained, even if a few of the ten previous samples are lost. This design balances data reliability and power efficiency, as the averaging reduces noise while minimizing computational demand on the microcontroller. Additionally, this approach ensures the system’s robustness in real-world environments, where brief transmission failures or sensor fluctuations may occur. The Atmega328 microcontroller frames these averaged values for each axis and transmits the data frames to the device on the cow’s neck via an RF module. The RF module enables wireless data transmission between the leg and neck devices, maintaining a stable connection within a 50-m range in typical pasture conditions.
The Atmega328 microcontroller on the neck-worn device receives the transmitted data from the leg-worn device. Similarly to the leg device, the neck device also includes a second ADXL345 sensor to measure movement data. The number of samples and the data processing methods for the neck device are the same as those for the leg device. After processing, the Atmega328 microcontroller on the neck device frames the data, including GPS information, accelerometer data, battery percentage, and timestamps. GPS information is updated at one-second intervals to synchronize with the accelerometer data, enabling spatial analysis of behaviors. The inclusion of battery percentage in the data frames facilitates monitoring of device performance during extended field deployments, ensuring timely maintenance and minimizing data loss due to power depletion. Timestamping across devices ensures that the synchronized datasets can be precisely analyzed for temporal relationships between leg and neck movements.
An example of data collected from accelerometers worn on the legs and necks of seven cows in the study is shown in Table 3. During data collection, the potential impact of the wearable devices on cow behavior was carefully considered. Observations of cows wearing the devices and those without devices were conducted. It was found that behavioral differences between individuals with and without wearables were negligible. This finding is supported by another study on cow wearables [34].

The accelerometer data from the neck and leg devices were synchronized to construct datasets. Datasets with window lengths of 3, 6, 9, 12, and 15 s were generated. Tables 4 and 5 respectively show the number of behavior observations for each cow with a 3-s data window size in the Training dataset and the Testing dataset.


It can be observed that the number of walking behavior samples is lower compared to other behaviors. The study measured this behavior for an average duration of about 10 min per cow. Walking is highly repetitive and stable, with no significant complex changes over time. Therefore, a short period of time is sufficient to collect representative data samples, including acceleration fluctuations on the x, y, and z-axis [5]. However, Walking is also very important as it is one of the main behaviors used to assess the condition of cattle. In future studies, it is necessary to increase the data collection time for Walking.
Feature extraction is a critical step in classification problems [24], especially when working with sensor data. It helps reduce data dimensionality, improve model accuracy, and optimize computational performance. Mean is a simple yet effective feature that reflects the average activity level of cattle over a period. This value allows for clear distinctions between behaviors such as Walking, Standing still, or Resting.
In this study, two accelerometers attached to the neck and leg are applied with the Mean feature on each axis. The formula for Mean is presented as follows:
and
where:
–
–
–
–
– N is the total number of samples in the time window.
However, to achieve higher classification performance, the Mean should be combined with other features to capture more complex behavioral changes. To better capture complex behaviors, the Mean can be combined with VeDBA. VeDBA is a feature that measures the level of kinetic energy expenditure, reflecting the intensity of an animal’s activity [12]. This combination improves classification performance and enhances the identification of states with rapid activity changes, such as transitioning from Walking to Running or from movement to Standing still. In this study, VeDBA is calculated as follows:
First, the Dynamic Body Acceleration (DBA) is required:
and
Once the DBA is obtained, VeDBA can be calculated as follows:
and
In these equations:
–
–
–
–
Additionally, to measure the degree of variation (dispersion) of the acceleration data and to assess the sharpness or flatness of the acceleration data distribution, Variance and Kurtosis are used. The Variance of the accelerometer data along each axis is calculated as:
and
where:
–
–
–
–
– N is the total number of samples in the time window.
The Kurtosis of the accelerometer data along each axis is calculated as:
and
where:
–
–
–
–
– N is the total number of samples in the time window.
The features Mean, Variance, VeDBA, and Kurtosis are used to identify cattle behaviors, including Feeding, Lying, Standing, and Walking Mean reflect the average value of acceleration data and helps distinguish static behaviors like Lying and Standing. Static behaviors, like Lying and Standing, exhibit consistently low mean values due to minimal movement. In contrast, dynamic behaviors, such as Feeding and Walking, have higher mean values because of more active motion patterns. Variance, which measures the degree of dispersion in the acceleration data, is particularly useful for differentiating behaviors with varying movement intensity. For instance, Walking displays high variance due to the alternating gait pattern, while Feeding has moderate variance owing to head movements during eating. In contrast, Lying and Standing show low variance due to their stationary nature. VeDBA captures the overall movement intensity and effectively differentiates Walking—which exhibits high VeDBA due to continuous, rhythmic motion—from Feeding, which shows moderate VeDBA due to periodic head movements. Finally, Kurtosis measures the peakedness of the data distribution, making it a key feature for identifying behaviors with sudden, irregular movements like Feeding, where abrupt changes in acceleration occur as cows reach or chew food. In contrast, Lying and Standing demonstrate lower kurtosis due to their more uniform motion patterns. The combination of these features provides a comprehensive perspective on cattle behavior, where Mean and Variance are essential for differentiating static and dynamic behaviors, VeDBA serves as a reliable indicator of movement intensity, and Kurtosis helps capture behaviors with abrupt changes. Fig. 4 illustrates the importance of features using acceleration data on the y-axis.
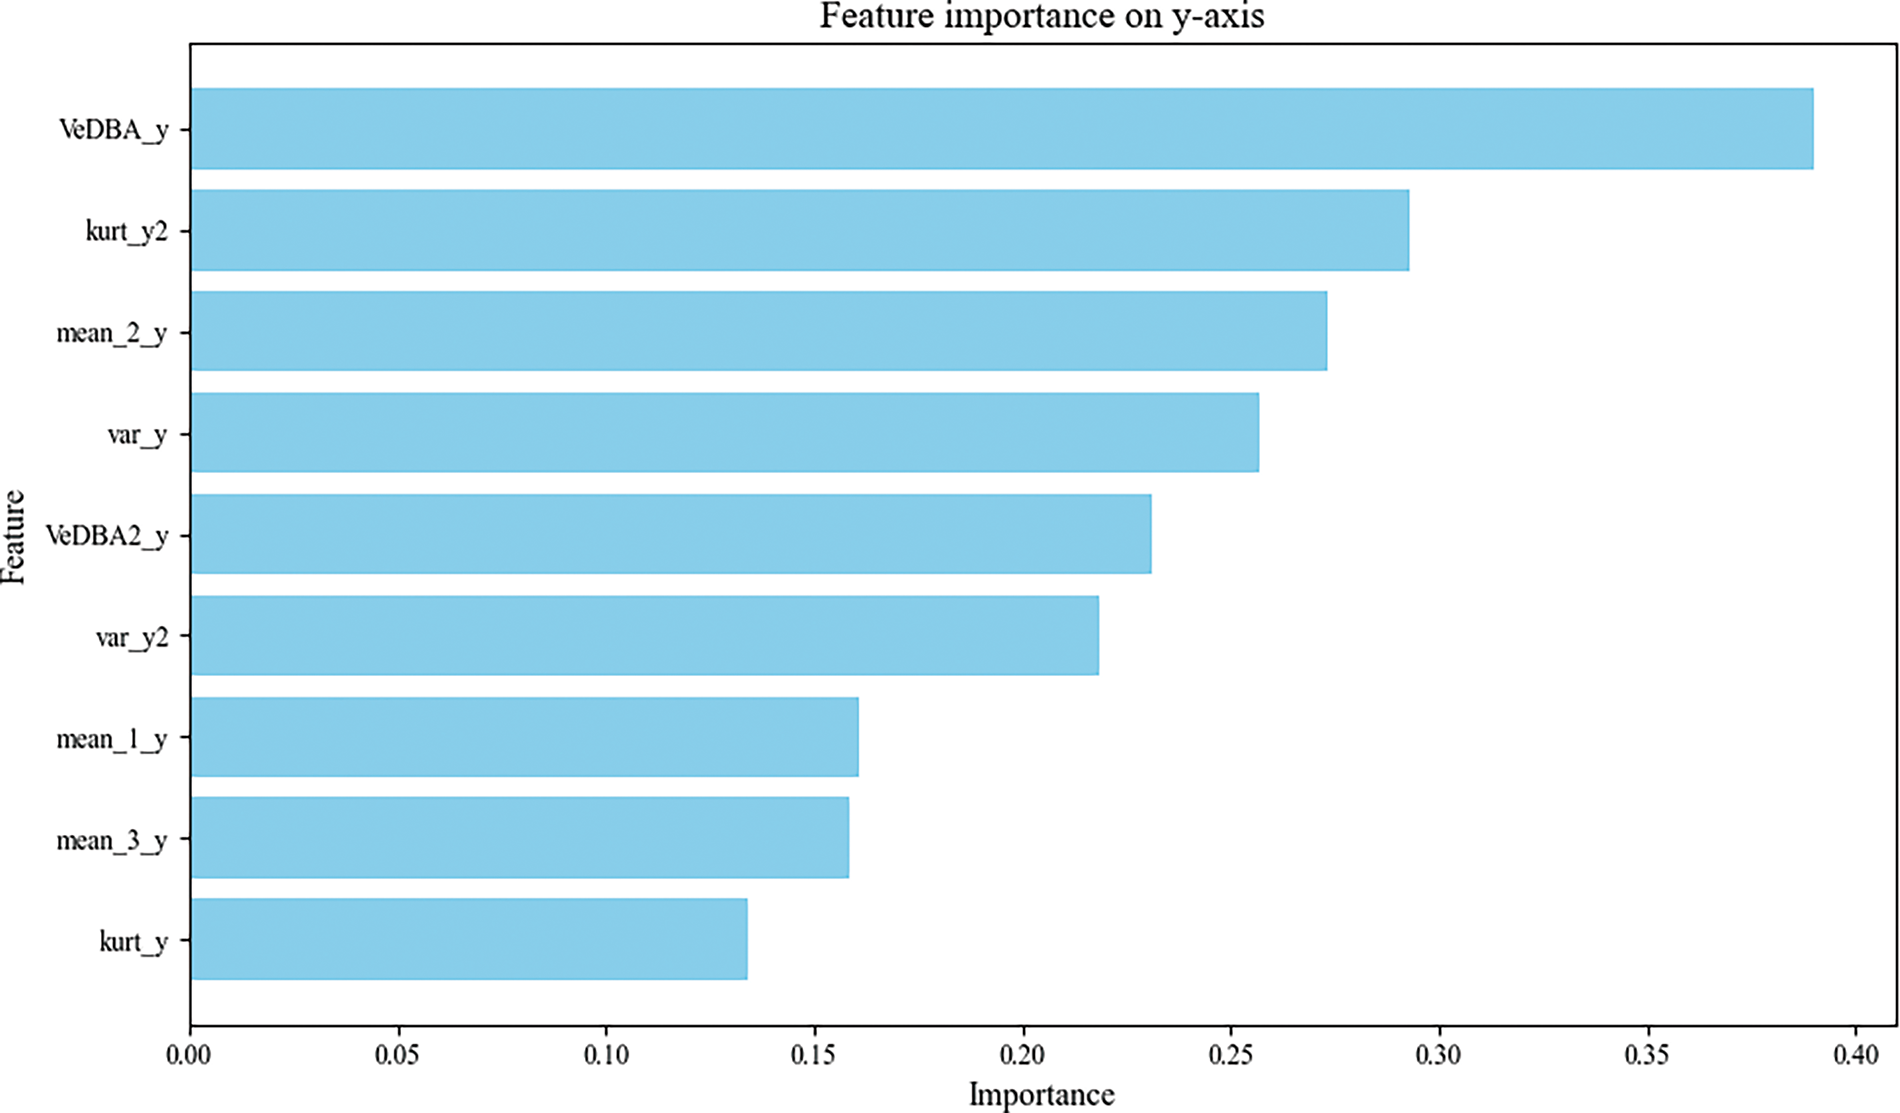
Figure 4: Feature importance on y-axis
2.4 Deflection Sensor Modeling
When accelerometers are used to monitor cow behavior, their orientation is crucial for accurate data collection. In the standard configuration, the sensor mounted on the neck collar assumes an initial alignment where the z-axis points downward toward the ground, the y-axis aligns with the forward-backward motion of the cow, and the x-axis aligns with the lateral movement. This setup ensures that the recorded acceleration values correspond directly to the physical movements of the animal.
In this study, the x-axis of the sensor, representing lateral movement, was excluded from the misalignment experiment due to its negligible impact on distinguishing the behaviors of Feeding, Lying, Standing, and Walking. Specifically, the Feeding behavior is primarily identified through vertical oscillations (z-axis) and movement in and out of the feed trough (y-axis), while the x-axis does not exhibit distinct characteristics. For the Lying behavior, cattle exhibit almost no lateral movement once they are lying down, meaning the x-axis does not provide additional distinguishing information compared to the data from the z-axis. Similarly, the standing behavior is determined by the stability of the z-axis without requiring data from the x-axis, as the cow remains stationary without lateral movement. Even in the case of Walking, although the x-axis captures some lateral movement when the cow moves, the characteristic patterns of this behavior are already fully represented by the y-axis (forward/backward motion) and the z-axis (vertical oscillations). Practical experiments indicate that including the x-axis does not significantly improve classification accuracy while increasing computational costs. Therefore, the x-axis was excluded to optimize processing efficiency while ensuring the system’s accuracy remains unaffected.
When the cow rotates its head or if the sensor is not properly attached, the accelerometer’s orientation can shift. Such misalignment causes the sensor-axis to deviate from their original reference positions. Fig. 5 illustrates the rotation angles of the accelerometer axes in cases of no deviation and with deviation. For instance, during a head turn, the sensor rotates around the z-axis, leading to significant changes in the x-axis and y-axis readings, even if the cow is stationary. This misalignment results in data distortion, complicating the differentiation of behaviors, especially those involving subtle movements.
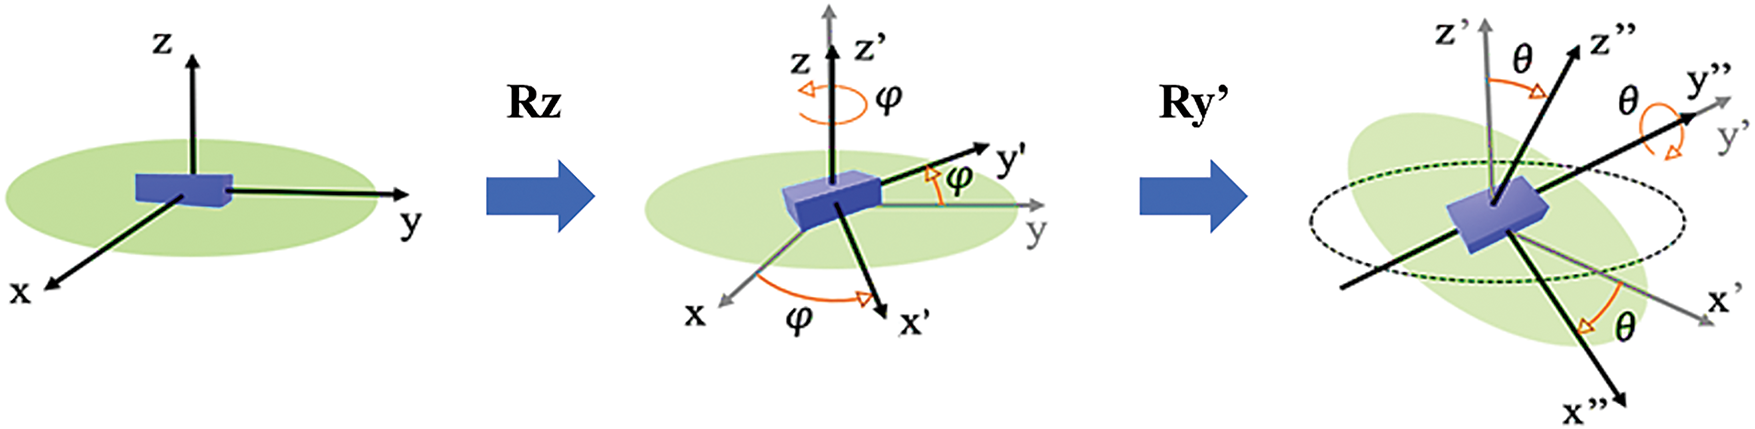
Figure 5: Simulation of the deviation of the sensor worn on the cow’s neck along the x, y, and z-axis
The impact of this misalignment becomes particularly evident in dynamic behaviors like Walking or Feeding, where acceleration patterns are complex. Without accounting for these changes, classification models may misinterpret the behavior or overestimate movement intensity, reducing the system’s overall accuracy.
This indicates that when the z-axis of the accelerometer is rotated by an angle φ, the x-axis and y-axis are also rotated by the same angle φ. Here, φ represents the rotation about the z-axis, and x′, y′, z′ denote the new directions of the x, y, z-axis after the rotation about the z-axis. The new coordinates x′, y′, z′ can be calculated from the original coordinates x, y, z using the following transformation:
When the y′-axis of the accelerometer is further rotated by an angle θ, the x′-axis and z′-axis are also rotated by the same angle θ. This rotation is performed about the y′-axis, represented by the rotation matrix Ry’, and the new coordinates x″, y″, z″ can be calculated from x′, y′, z′ as follows:
These transformations allow us to compute the sensor readings in the new orientation after consecutive rotations around the z-axis and the y′-axis, ensuring that the accelerometer data remains consistent despite changes in the sensor’s position.
The selection of the deviation angles of φ = 2°, φ = 10°, and φ = 20° in the sensor deviation experiment is based on practical tests, analysis of cattle movement characteristics, and the need to represent common deviations in the experimental environment. Through real-world testing, sensors attached to cattle movement measurement devices are often displaced due to behaviors such as head lowering, vigorous movements, or collisions during movement, with observed deviations primarily ranging from φ = 0° to φ = 20°. Based on this, the deviation angles were categorized into three levels: φ = 2°, φ = 10°, and φ = 20°, corresponding to small, medium, and large deviations, respectively. The φ = 2° angle simulates minor deviations that frequently occur when cattle engage in normal behaviors like chewing or lowering their heads while eating. The φ = 10° angle represents more common deviations, which happen when cattle rub their necks or when collars shift naturally during movement. Meanwhile, the φ = 20° angle was chosen to evaluate the impact of large deviations, typically occurring when the collar becomes loose, or the sensor experiences strong impacts.
Simulation tests indicated that the system maintained high accuracy with deviations of φ = 2° and φ = 10°, while accuracy significantly decreased with a φ = 20° deviation, particularly for behaviors involving minimal movement, such as lying and standing. However, the results remained within acceptable limits. Angles greater than φ = 20° were not selected because tests showed that such deviations rarely occur in practice and do not provide additional useful information while increasing computational costs.
2.5 Classification of Cow Behavior Using Decision Tree Algorithm
Fig. 6 illustrates the process of cow behavior recognition in the proposed system. Accelerometer data attached to the legs and neck of the cattle are synchronized and used to extract features for data record windows through VeDBA, Mean, Variance, and Kurtosis. For data where sensor misalignment occurs, recalculations and simulations are performed under various scenarios. Similar to regular data, simulated data also uses VeDBA, Mean, Variance, and Kurtosis features to form feature vectors for the data record windows. The behaviors labeled in this study include Feeding, Standing, Lying, and Walking.
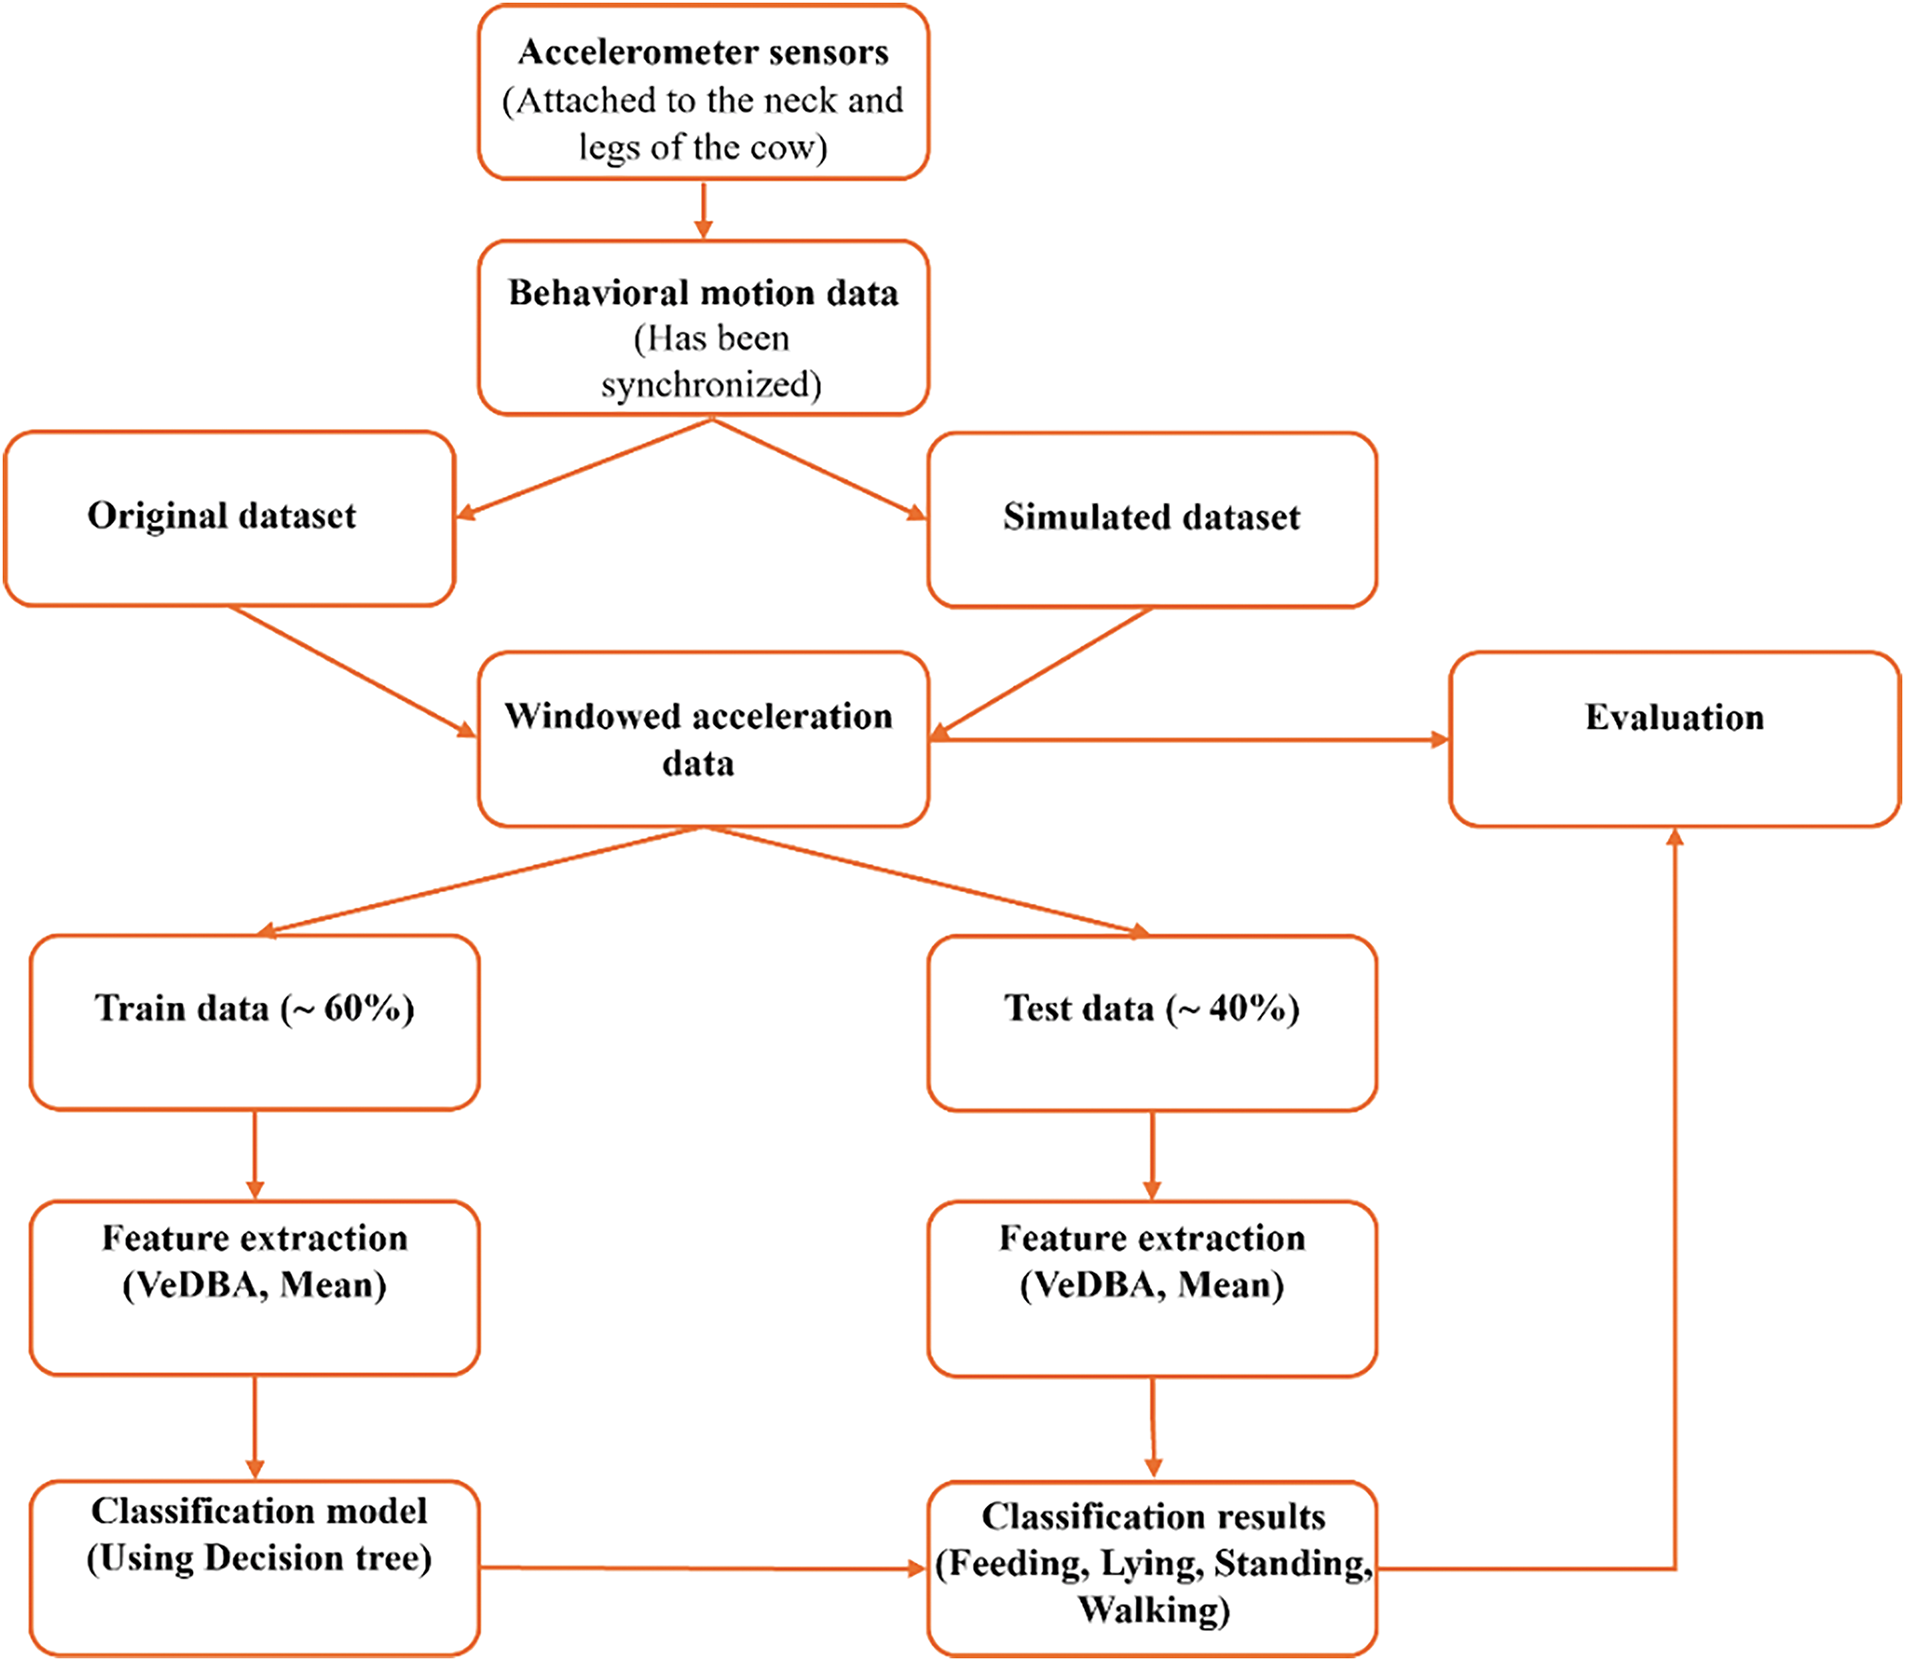
Figure 6: The process of cow behavior recognition in the proposed system
The dataset collected in this study is divided into two sets: Train and Test. With a ratio of 60% Train data and 40% Test data, the split ensures effective behavior classification [5,21,22]. For example, in the case of the 3 s dataset, 26,774 samples were used for training while the next 17,843 were used for testing (Tables 4 and 5). Based on VeDBA, Mean, Variance, and Kurtosis features with Train data (labeled data) combined with ML algorithms, the model is trained to automatically label new data. The automatically labeled data is verified based on real-world observations and recorded images from cameras to ensure accuracy.
The DT algorithm, a supervised ML technique, is often used for classification and regression problems. In this study, DT is suitable for behavior classification due to its intuitiveness, ability to handle nonlinear data, and ease of result interpretation.
DT divides data based on attributes (features) to reduce impurity or increase purity at nodes. Each node in the tree represents an attribute, and branches represent the values or ranges of the attribute. The tree construction process ends when a stopping condition is met (e.g., no more attributes to split or achieving a certain level of purity).
Basic terminology in DT:
– Root Node: The starting point of the tree, representing the entire dataset.
– Internal Node: Represents an attribute selected to split the data.
– Leaf Node: The final nodes in the tree, representing specific classification classes.
– Branch: Indicates the outcome of a condition check on the attribute at the node.
For behavior classification, several ML algorithms can perform well [2–5]. In this study, behavior classification needs to be both accurate and suitable for real-time applications. DT has been proven to be an appropriate algorithm, as its energy consumption per behavior is highly efficient [29].
Energy consumption was measured by monitoring the power usage of the classification system during operation. The total energy used was recorded over a fixed time period while the system processed a large batch of behavior classifications. The per-classification energy consumption was then calculated by dividing the total energy consumed by the number of classifications performed. This approach ensures a fair comparison of computational efficiency among different algorithms. Lower values indicate higher energy efficiency, which is particularly important for battery-powered behavior monitoring systems.
The study compared the execution time and energy consumption of DT with GBDT, Support Vector Machines (SVM), RF, and K-Nearest Neighbors (KNN). DT achieved an execution time of approximately 0.005 s per activity and an energy consumption of about 0.0025 J per activity, which were lower than those of GBDT (0.0072 s, 0.00383 J), SVM (0.053 s, 0.02819 J), RF (0.03 s, 0.01595 J), and KNN (0.019 s, 0.0101 J).
DT demonstrated a 65% lower energy consumption compared to RF and 34.7% lower compared to GBDT, highlighting its efficiency in energy-limited environments. The significantly higher energy consumption of SVM and KNN indicates that these algorithms may not be optimal for real-time deployment on battery-powered or resource-constrained devices. Additionally, DT outperformed RF and GBDT in execution time, reducing processing latency by approximately 83.3% compared to SVM, 73.3% compared to RF, and 30.6% compared to GBDT.
These results confirm that DT aligns well with the research objective of achieving fast execution and low energy consumption, making it a particularly advantageous choice for real-time applications where computational efficiency is critical. Furthermore, DT works and adapts well with numerical data [17,19].
Python 3.5 was used for the tasks in this study.
To evaluate the classification performance of the model, the classification results are presented in the form of a confusion matrix, which demonstrates the accuracy of behavior classification, with the following possibilities:
– True Positive (TP): The system correctly predicts the behavior that the cow is performing.
– False Positive (FP): The system incorrectly predicts that a behavior is occurring when it is not.
– False Negative (FN): The system fails to recognize a behavior that is occurring and predicts it as a different behavior.
– True Negative (TN): The system correctly does not predict a behavior that is not occurring.
The metrics Accuracy (Acc), Sensitivity (Sen), Positive Predictive Value (PPV) and F1-Score (F1) are calculated using the following formulas:
3.1 Performance over Short Windows
The study evaluated the classification performance of cattle behavior classification using short window sizes and the DT algorithm. Based on data collected from sensors worn by cattle, the VeDBA, Mean, Variance, and Kurtosis features were applied along with time windows of 3, 6, 9, 12, and 15 s. The behaviors of interest were Feeding, Lying, Standing, and Walking. The evaluation metrics used were Acc, Sen, PPV and F1 (Formulas (13)–(16)).
Fig. 7a–d illustrates the classification Acc of the behaviors based on window sizes of 3, 6, 9, 12, and 15 s using the DT algorithm with the VeDBA, Mean, Variance, and Kurtosis features. The cows in the study were assigned unique IDs from 1 to 7 (ID1–7).
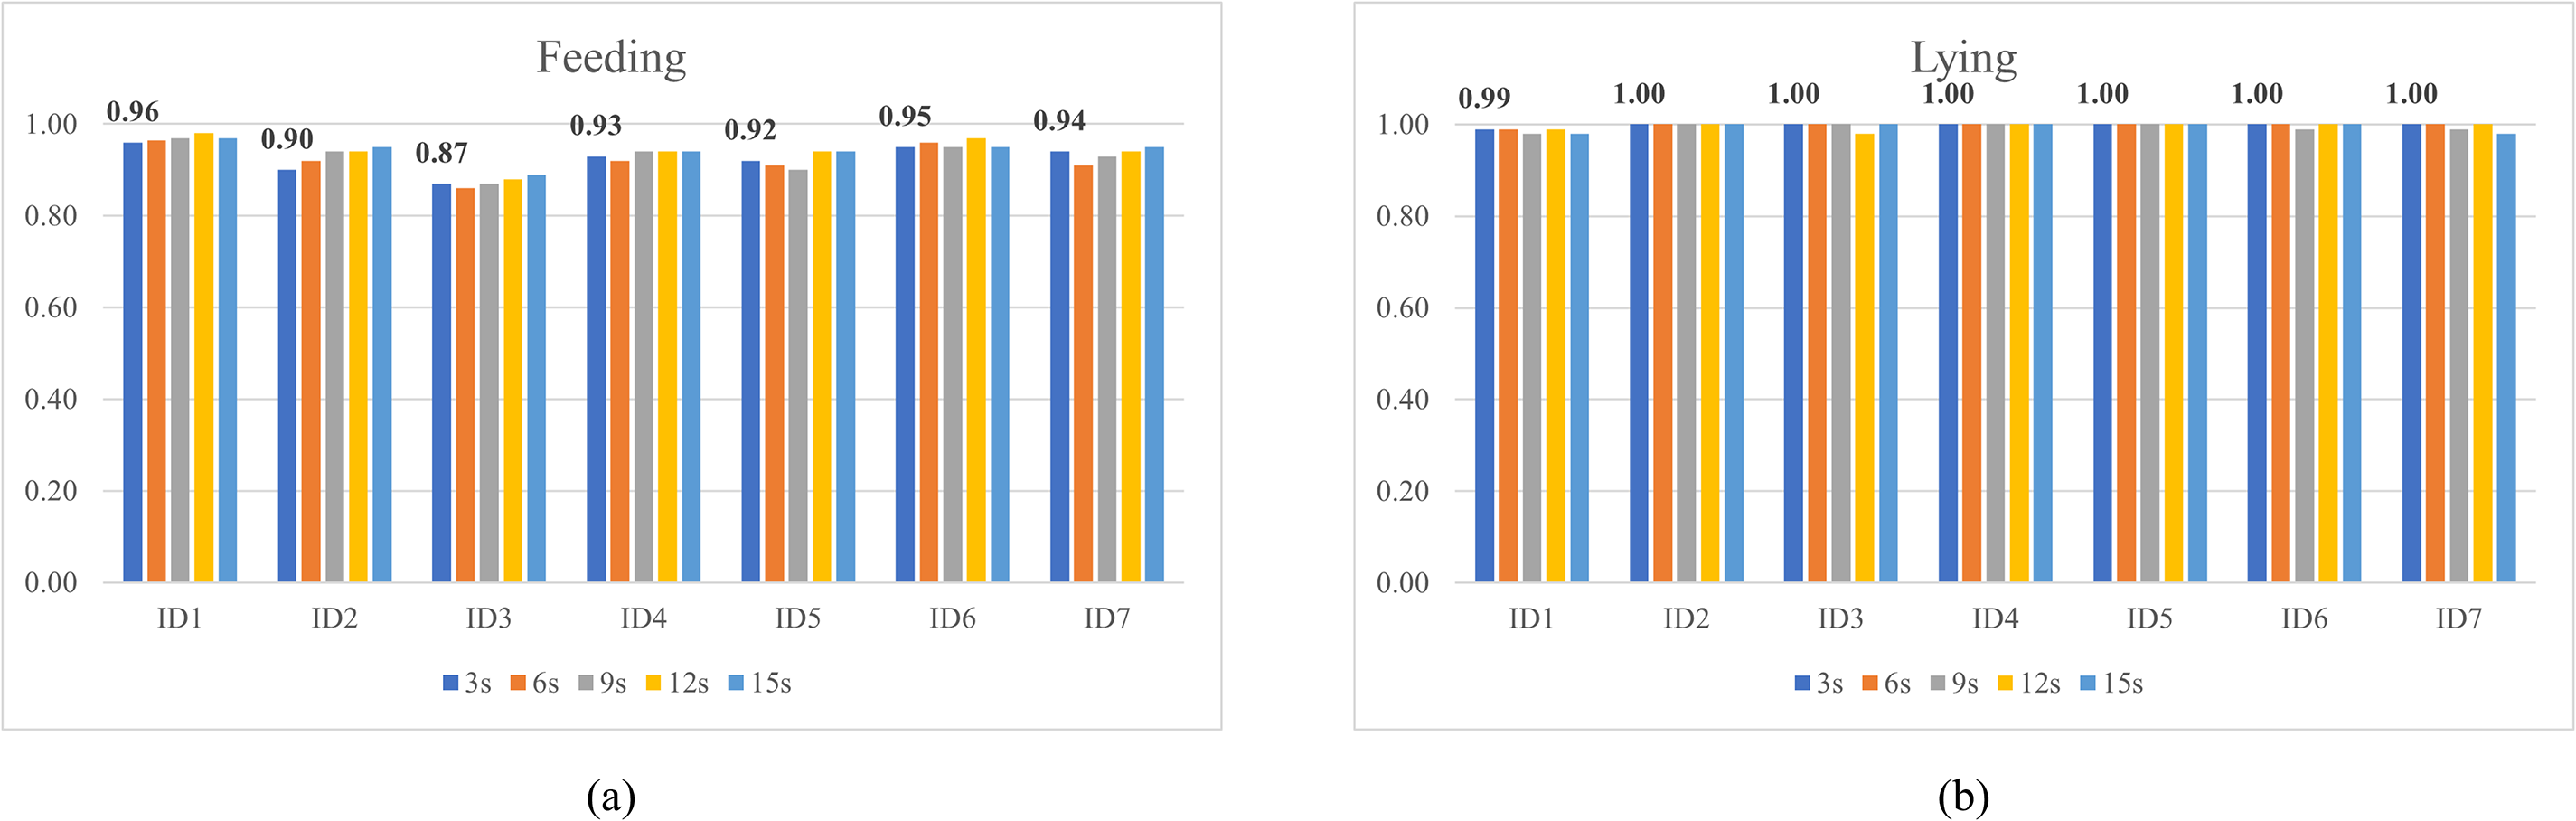
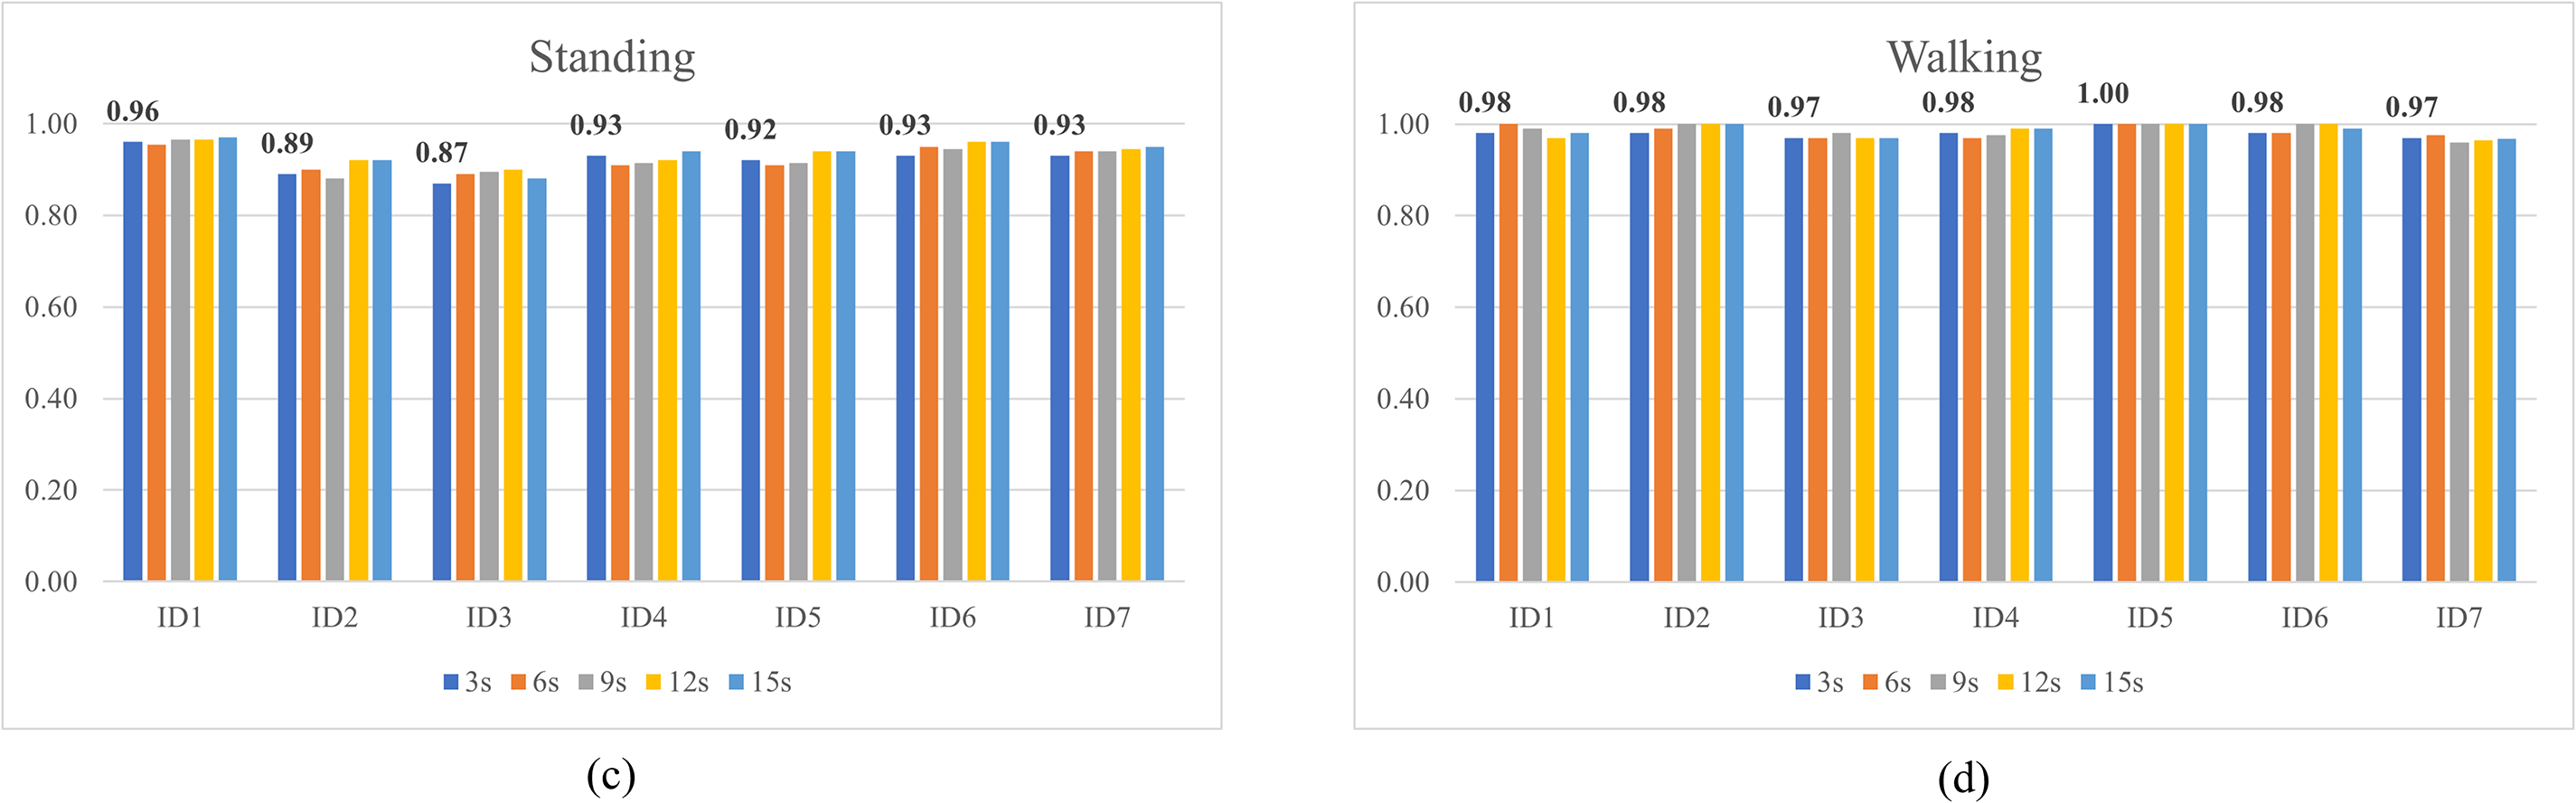
Figure 7: Classification accuracy for behaviors with data window lengths of 3, 6, 9, 12, and 15 s
For ID1, the Acc in classifying Feeding behavior shows slight variations across different time window sizes. With a 3-s window, Acc reaches 0.96, as the short sampling period is insufficient to fully capture the Feeding behavior, resulting in fragmented or unstable signals. With 6 and 9-s windows, Acc increases to 0.97, as enough data is accumulated in each segment, enabling the model to better identify the behavior. When the window size is extended to 12 s, Acc peaks at 0.98, as the Feeding signal becomes clearer and less noisy, providing comprehensive information for precise classification. However, with a 15-s window, Acc slightly decreases to 0.97, potentially due to the inclusion of multiple behaviors within the longer timeframe, making it harder for the model to classify accurately.
For the remaining IDs (ID2–ID7), the trend across window sizes is similar. Acc improves as the window increases from 3 to 12 s, with the best results often achieved at the 12-s window (e.g., ID2, ID4, and ID6 reaching 0.94–0.97). Some IDs, such as ID5 and ID7, maintain stable high Acc (0.94–0.95) even with larger windows, whereas ID3 shows lower Acc compared to the others, ranging from 0.86 to 0.89, but still exhibits gradual improvement with increasing window size. Overall, most IDs indicate that windows between 9 and 12 s are optimal for balancing stability and Acc in identifying Feeding behavior. For other behaviors, a similar trend is observed. Notably, Lying and Walking behaviors, due to their distinct accelerometer data patterns, achieve near-perfect Acc across all window sizes.
Fig. 8a–d compares the classification performance of behaviors across the seven datasets collected from ID1 to ID7. The classification performance across the seven datasets (ID1–ID7) with window sizes of 3, 6, 9, 12, and 15 s shows significant improvement as the window duration increases, particularly for the behaviors Feeding and Standing. Acc for Feeding improved from 0.925 at a 3-s window to 0.950 at 12 and 15-s windows, while Standing improved from 0.917 (3 s) to a peak of 0.940 at 12 s before slightly decreasing to 0.934 at 15 s. Lying maintained perfect Acc (1.000) across most windows starting from 6 s, demonstrating that this behavior is the easiest to recognize regardless of window size. Similarly, Walking achieved its highest Acc (0.990) at 6 and 9-s windows, with a slight decline at longer windows (12 s: 0.980, 15 s: 0.978). In terms of Sen, Feeding and Standing showed steady improvement with longer windows, while Walking reached its highest Sen (0.970) at a 15-s window. The PPV for Feeding behavior ranges from 0.811 at a 3-s window to 0.820 at a 15-s window, reflecting an improvement in prediction Acc as the window size increases. Standing shows a steady increase in PPV, improving from 0.937 (3 s) to 0.960 (15 s), demonstrating better precision in identifying this behavior with longer windows. In contrast, Walking maintains consistently high PPV values (0.939–0.943) across all window sizes, indicating stable and reliable precision regardless of the window duration. These results suggest that longer windows generally enhance prediction Acc for Feeding and Standing, while Walking remains robustly predictable even with shorter windows. However, the F1 for all behaviors indicate that the differences across window sizes are not very large, with stable performance even for shorter windows.
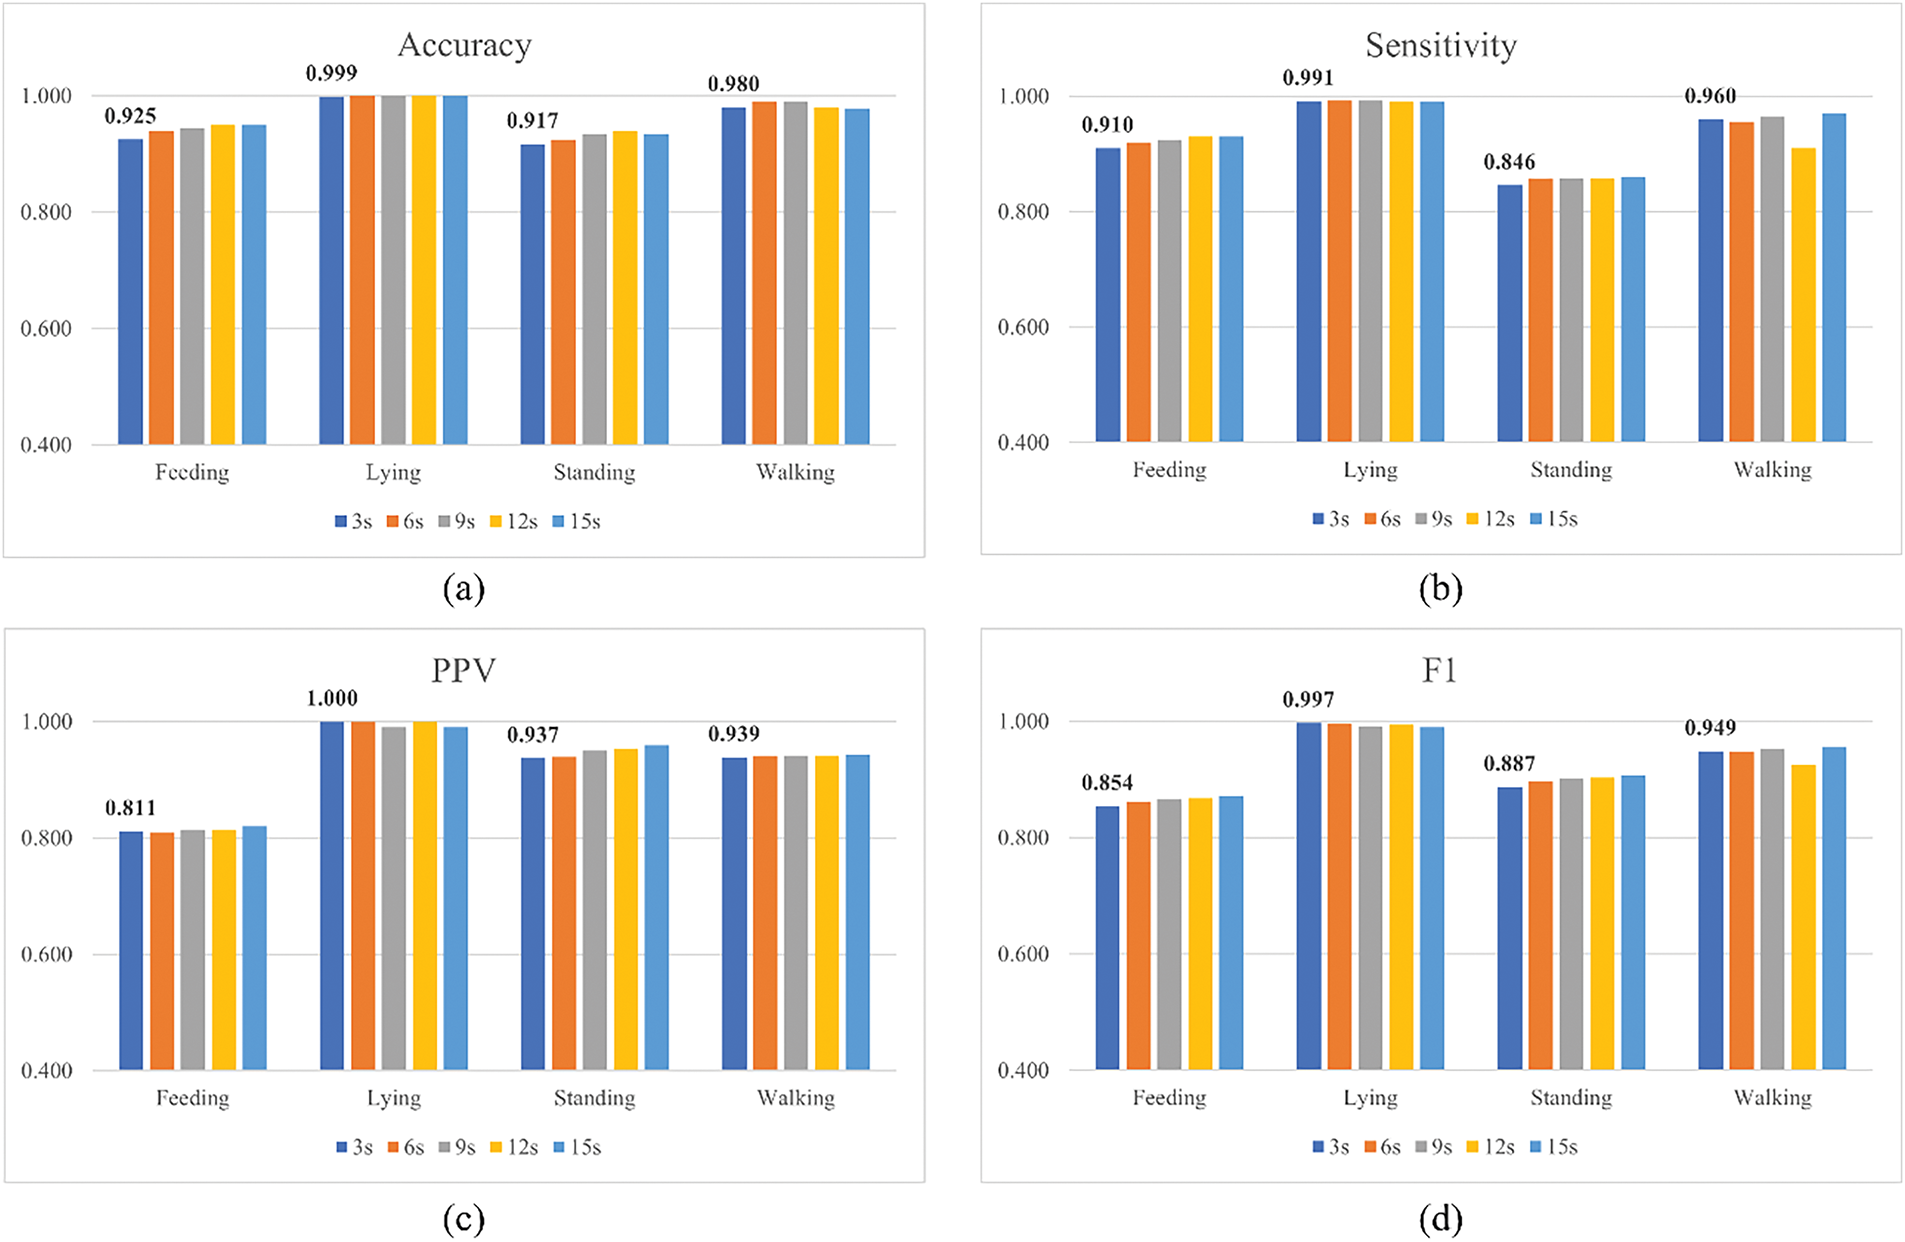
Figure 8: Classification performance of behaviors across seven datasets with data window lengths of 3, 6, 9, 12, and 15 s
Notably, using a 3-s window, although slightly lower in Acc and Sen compared to longer windows, does not significantly compromise overall classification performance. This shorter window size strikes a balance between processing speed and Acc, making it suitable for real-time applications where rapid data analysis is critical.
Balancing the size of the data window and classification performance is a common challenge in behavior classification problems [5]. It is essential to ensure that the information provided by the data window is sufficient to achieve high classification performance. Fortunately, using the DT algorithm with the VeDBA, Mean, Variance, and Kurtosis features produced strong classification results, even with a short 3-s window. Therefore, the proposed system selects a 3-s data window for further study.
After selecting a 3-s data window for the classification task of cattle behavior, focusing on four behaviors of interest—Feeding, Lying, Standing, and Walking—the study conducted experiments using simulated data for scenarios with sensor misalignment in real-world conditions. The datasets used include:
– DT01: Original dataset (no sensor misalignment).
– DT02: Dataset with a 2-degree sensor misalignment, comprising 10% misaligned data.
– DT03: Dataset with a 2-degree sensor misalignment, comprising 50% misaligned data.
– DT04: Dataset with a 10-degree sensor misalignment, comprising 10% misaligned data.
– DT05: Dataset with a 10-degree sensor misalignment, comprising 50% misaligned data.
– DT06: Dataset with a 20-degree sensor misalignment, comprising 50% misaligned data.
The datasets were evaluated using the same method, and the changes in classification performance for each dataset were compared.
Figs. 9 and 10 depict the confusion matrices when using the DT algorithm with VeDBA, Mean, Variance, and Kurtosis features on the datasets with the most significant differences in results, DT01 and DT05. For other datasets, the study also calculated and collected results; however, these results showed negligible differences and are not visually presented in this study. All detailed results were obtained using a window size of 3 s.
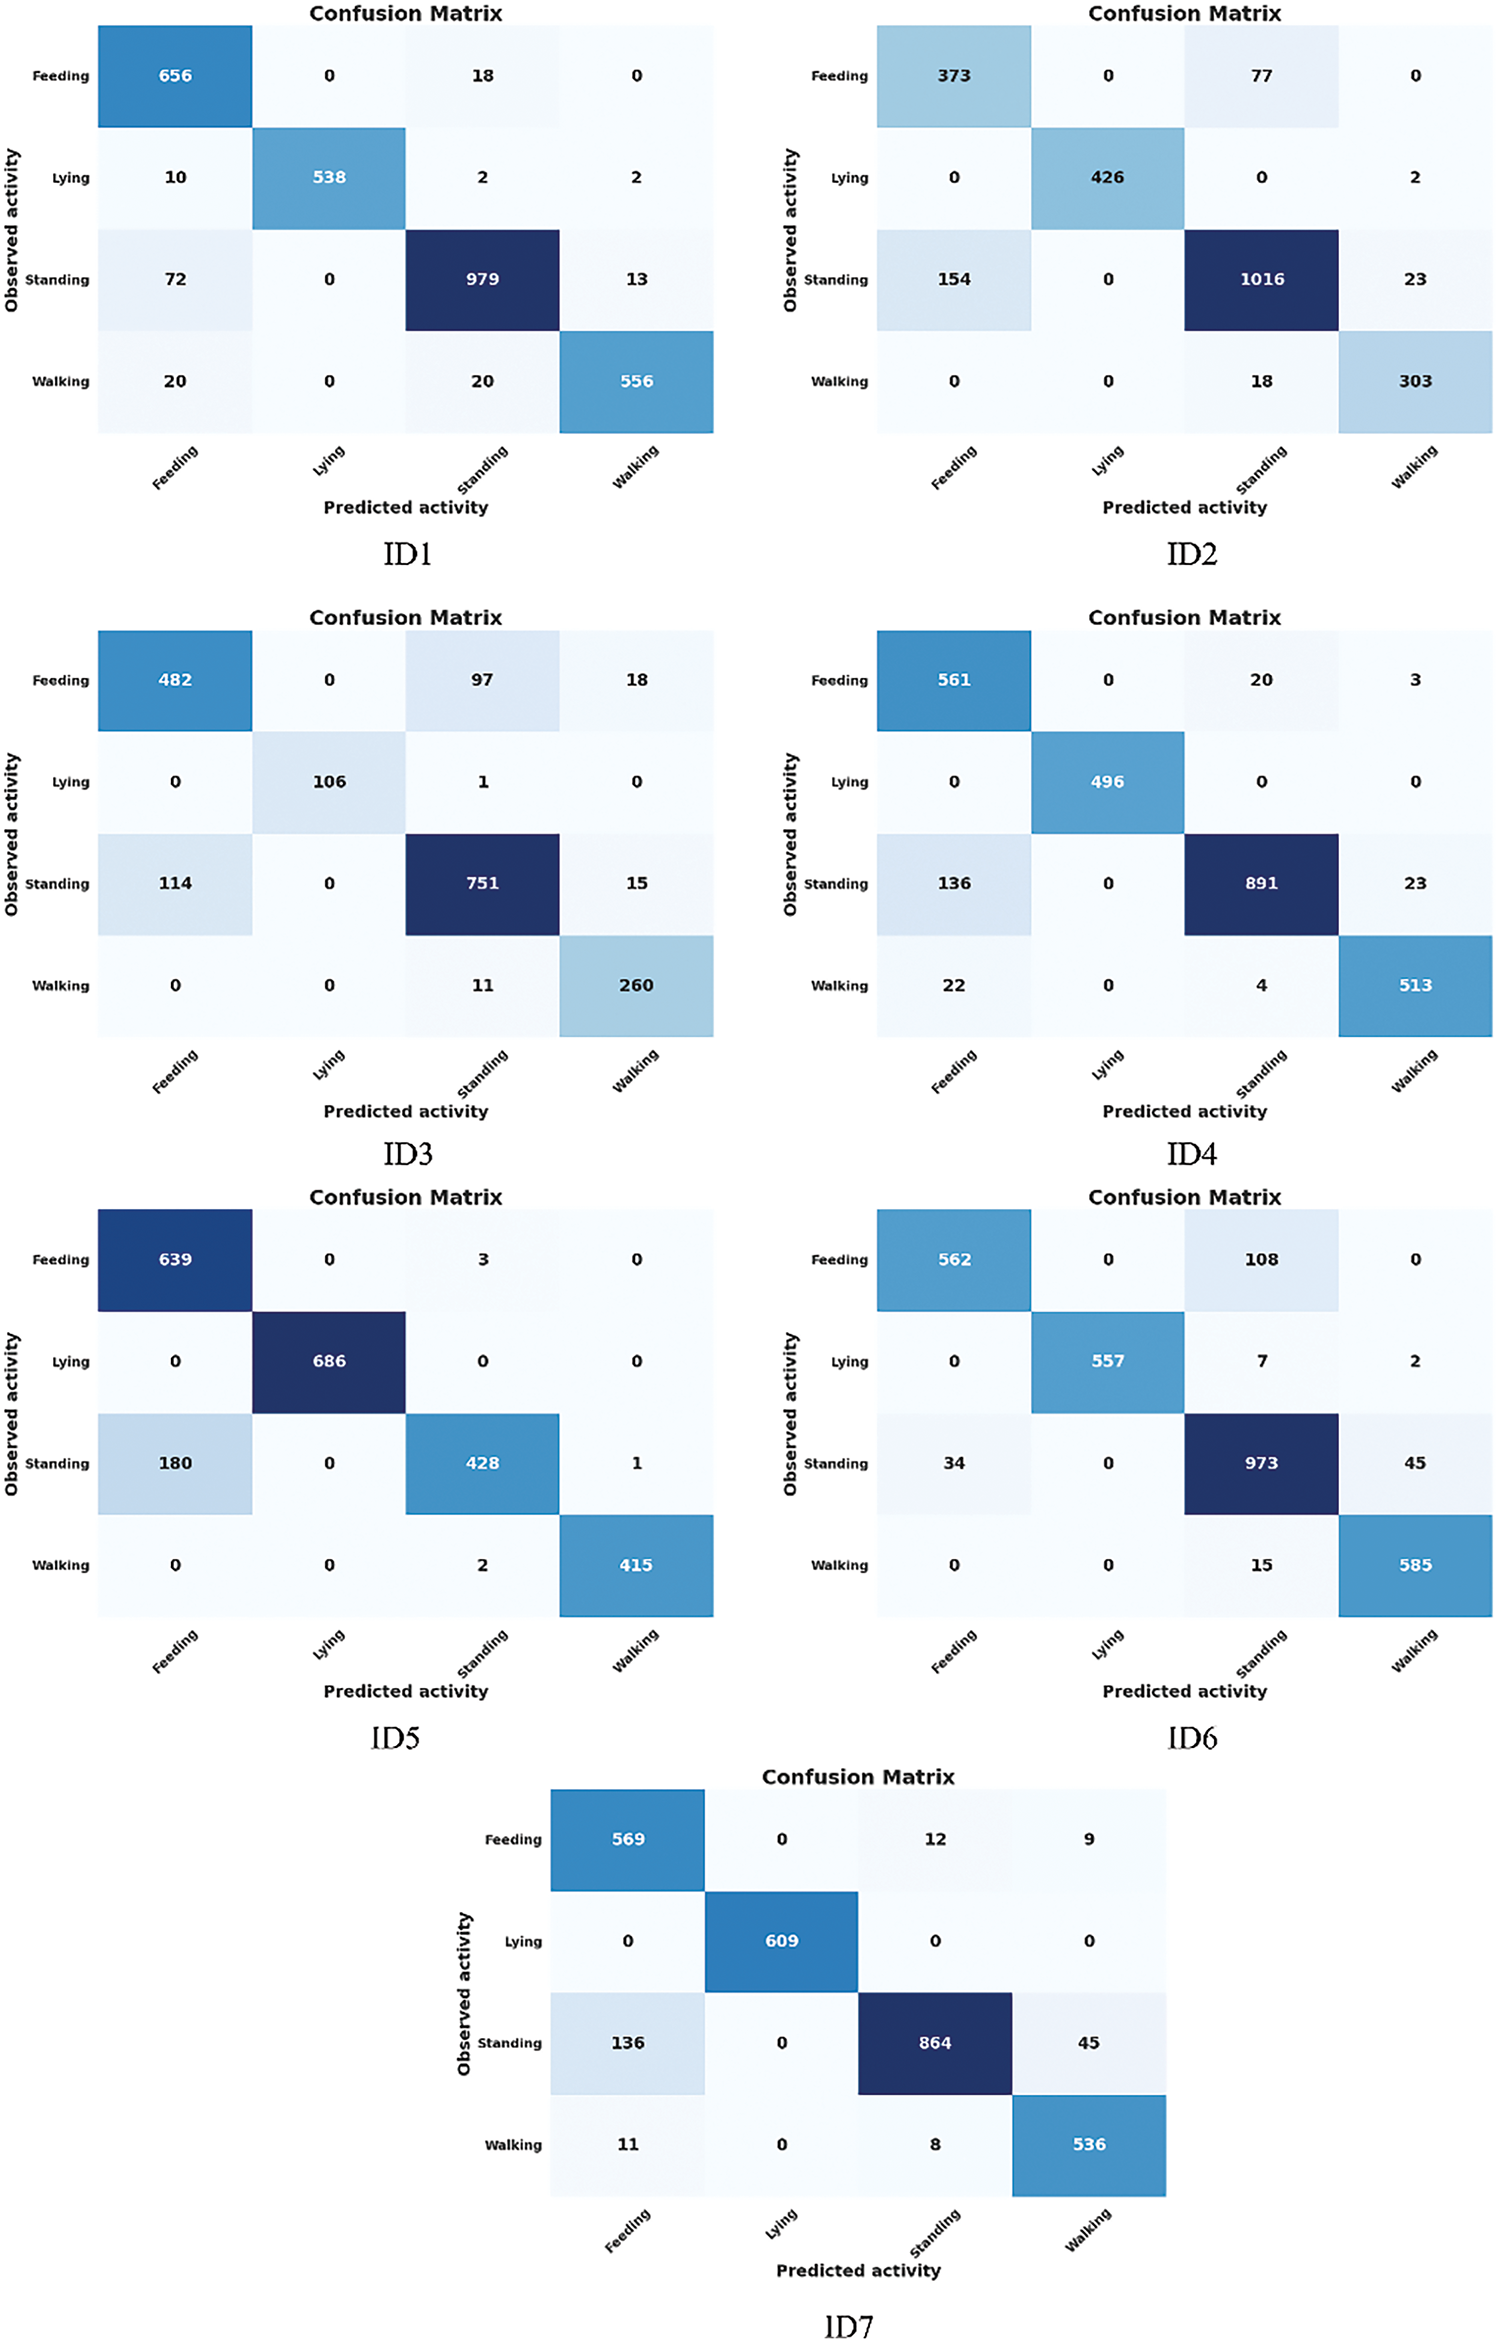
Figure 9: Confusion matrix of the DT algorithm on the DT01 dataset
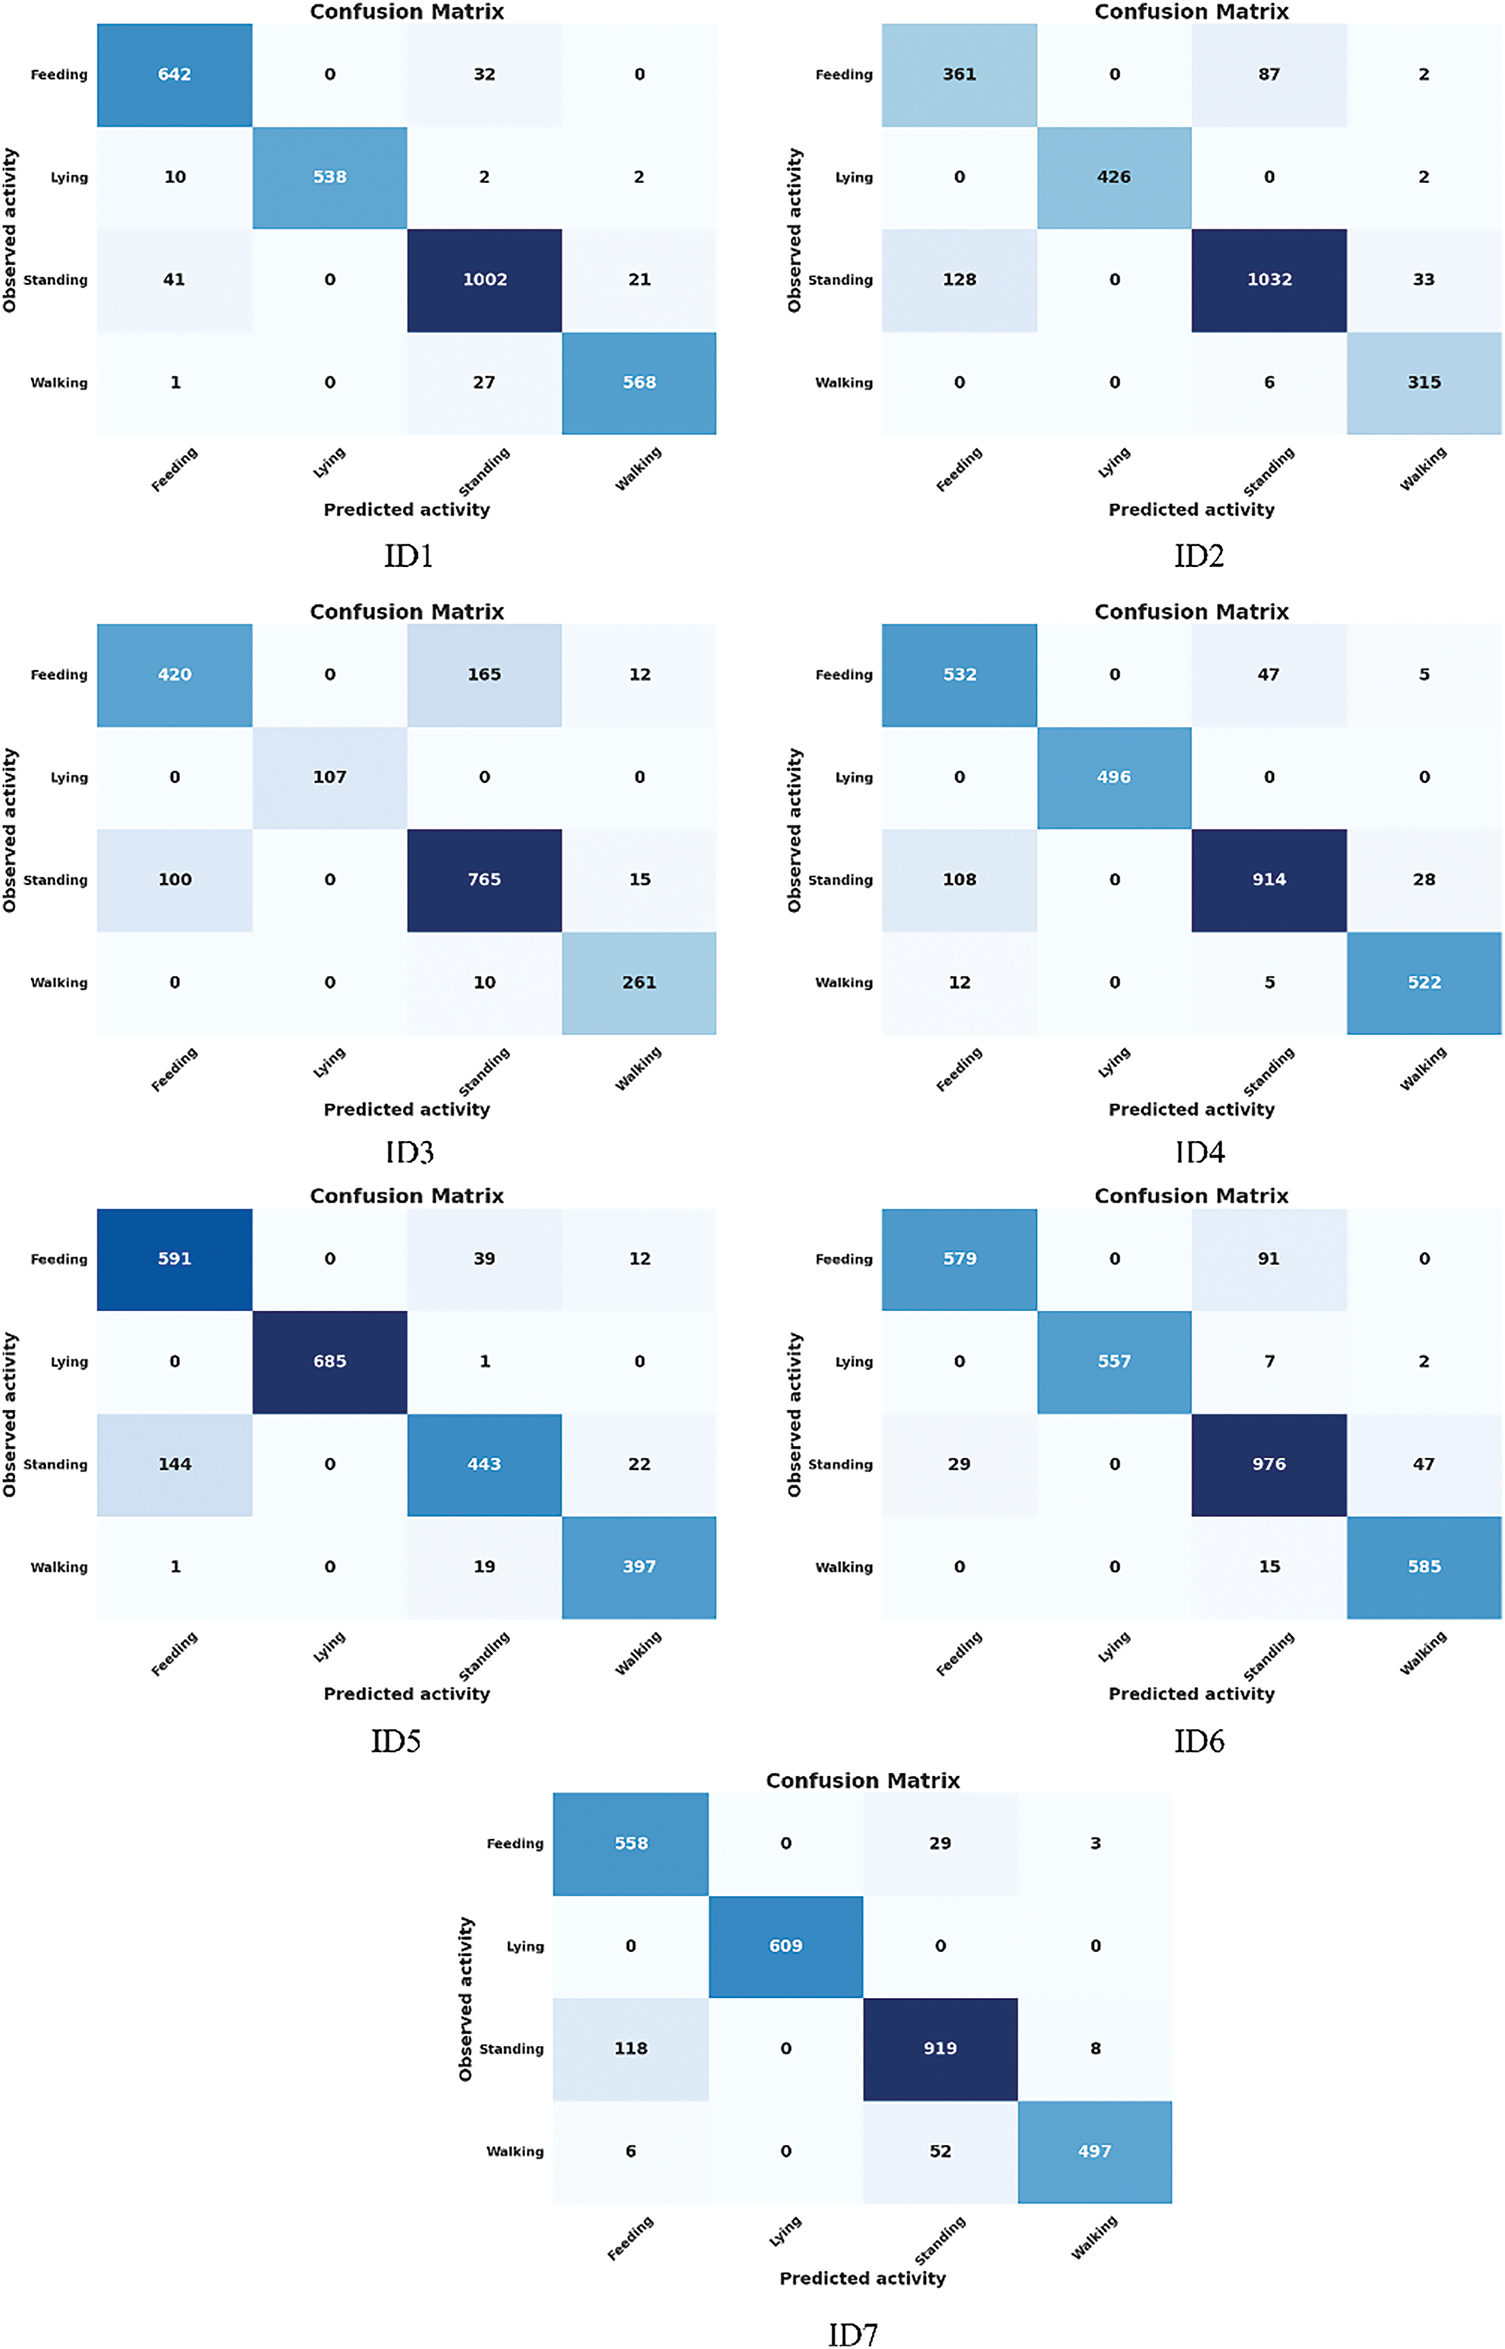
Figure 10: Confusion matrix of the DT algorithm on the DT05 dataset
The confusion matrices from datasets DT01 and DT05 highlight some changes in behavior classification performance, particularly between Feeding and Standing, due to sensor misalignment. Despite specific instances of increased misclassification, the overall classification performance remains robust. For instance, in ID3, misclassification from Feeding to Standing increased from 97 (DT01) to 165 (DT05), and in ID5, it rose from 3 to 39. However, the correct classifications for Feeding remained high, as seen in ID1, where the count only slightly decreased from 656 (DT01) to 642 (DT05). This indicates that the machine learning model effectively leverages stable features in the data that are less affected by sensor misalignment, maintaining strong classification performance.
Similarly, standing behavior experienced some changes due to misalignment. For example, in ID2, correct classifications increased from 1016 (DT01) to 1032 (DT05), but misclassifications with Walking rose from 23 to 33. This may be attributed to sensor misalignment causing Standing signals to overlap with the subtle movements of Walking. However, in IDs like ID6, the correct classifications for Standing remained nearly unchanged, increasing only slightly from 973 (DT01) to 976 (DT05). Walking behavior demonstrated resilience to sensor misalignment, as the number of correct classifications remained stable across most IDs. For instance, in ID6, the correct classifications stayed consistent at 585 in both datasets. This highlights the distinct and dynamic features of Walking that allow it to be reliably identified even with misalignment. Lying behavior proved to be the least affected by sensor misalignment. For example, in IDs like ID4 and ID6, correct classifications remained constant at 496 and 557, respectively, across both datasets. This is because the static nature of Lying minimizes the impact of sensor misalignment, resulting in highly stable and easily identifiable signals.
Overall, while sensor misalignment led to increased misclassifications between similar behaviors, particularly between Feeding and Standing, the overall classification performance was not significantly impacted. The number of correct classifications across all behaviors and IDs remained consistently high, demonstrating the system’s resilience to sensor misalignment. This underscores the model’s ability to utilize robust and distinctive features, ensuring reliable performance under real-world conditions.
To further clarify the comparison across datasets, Table 6 presents the classification performance for all individuals (ID1 to ID7) using datasets DT01 and DT05. For all behaviors examined in this study, the results show negligible differences in performance across the different datasets.
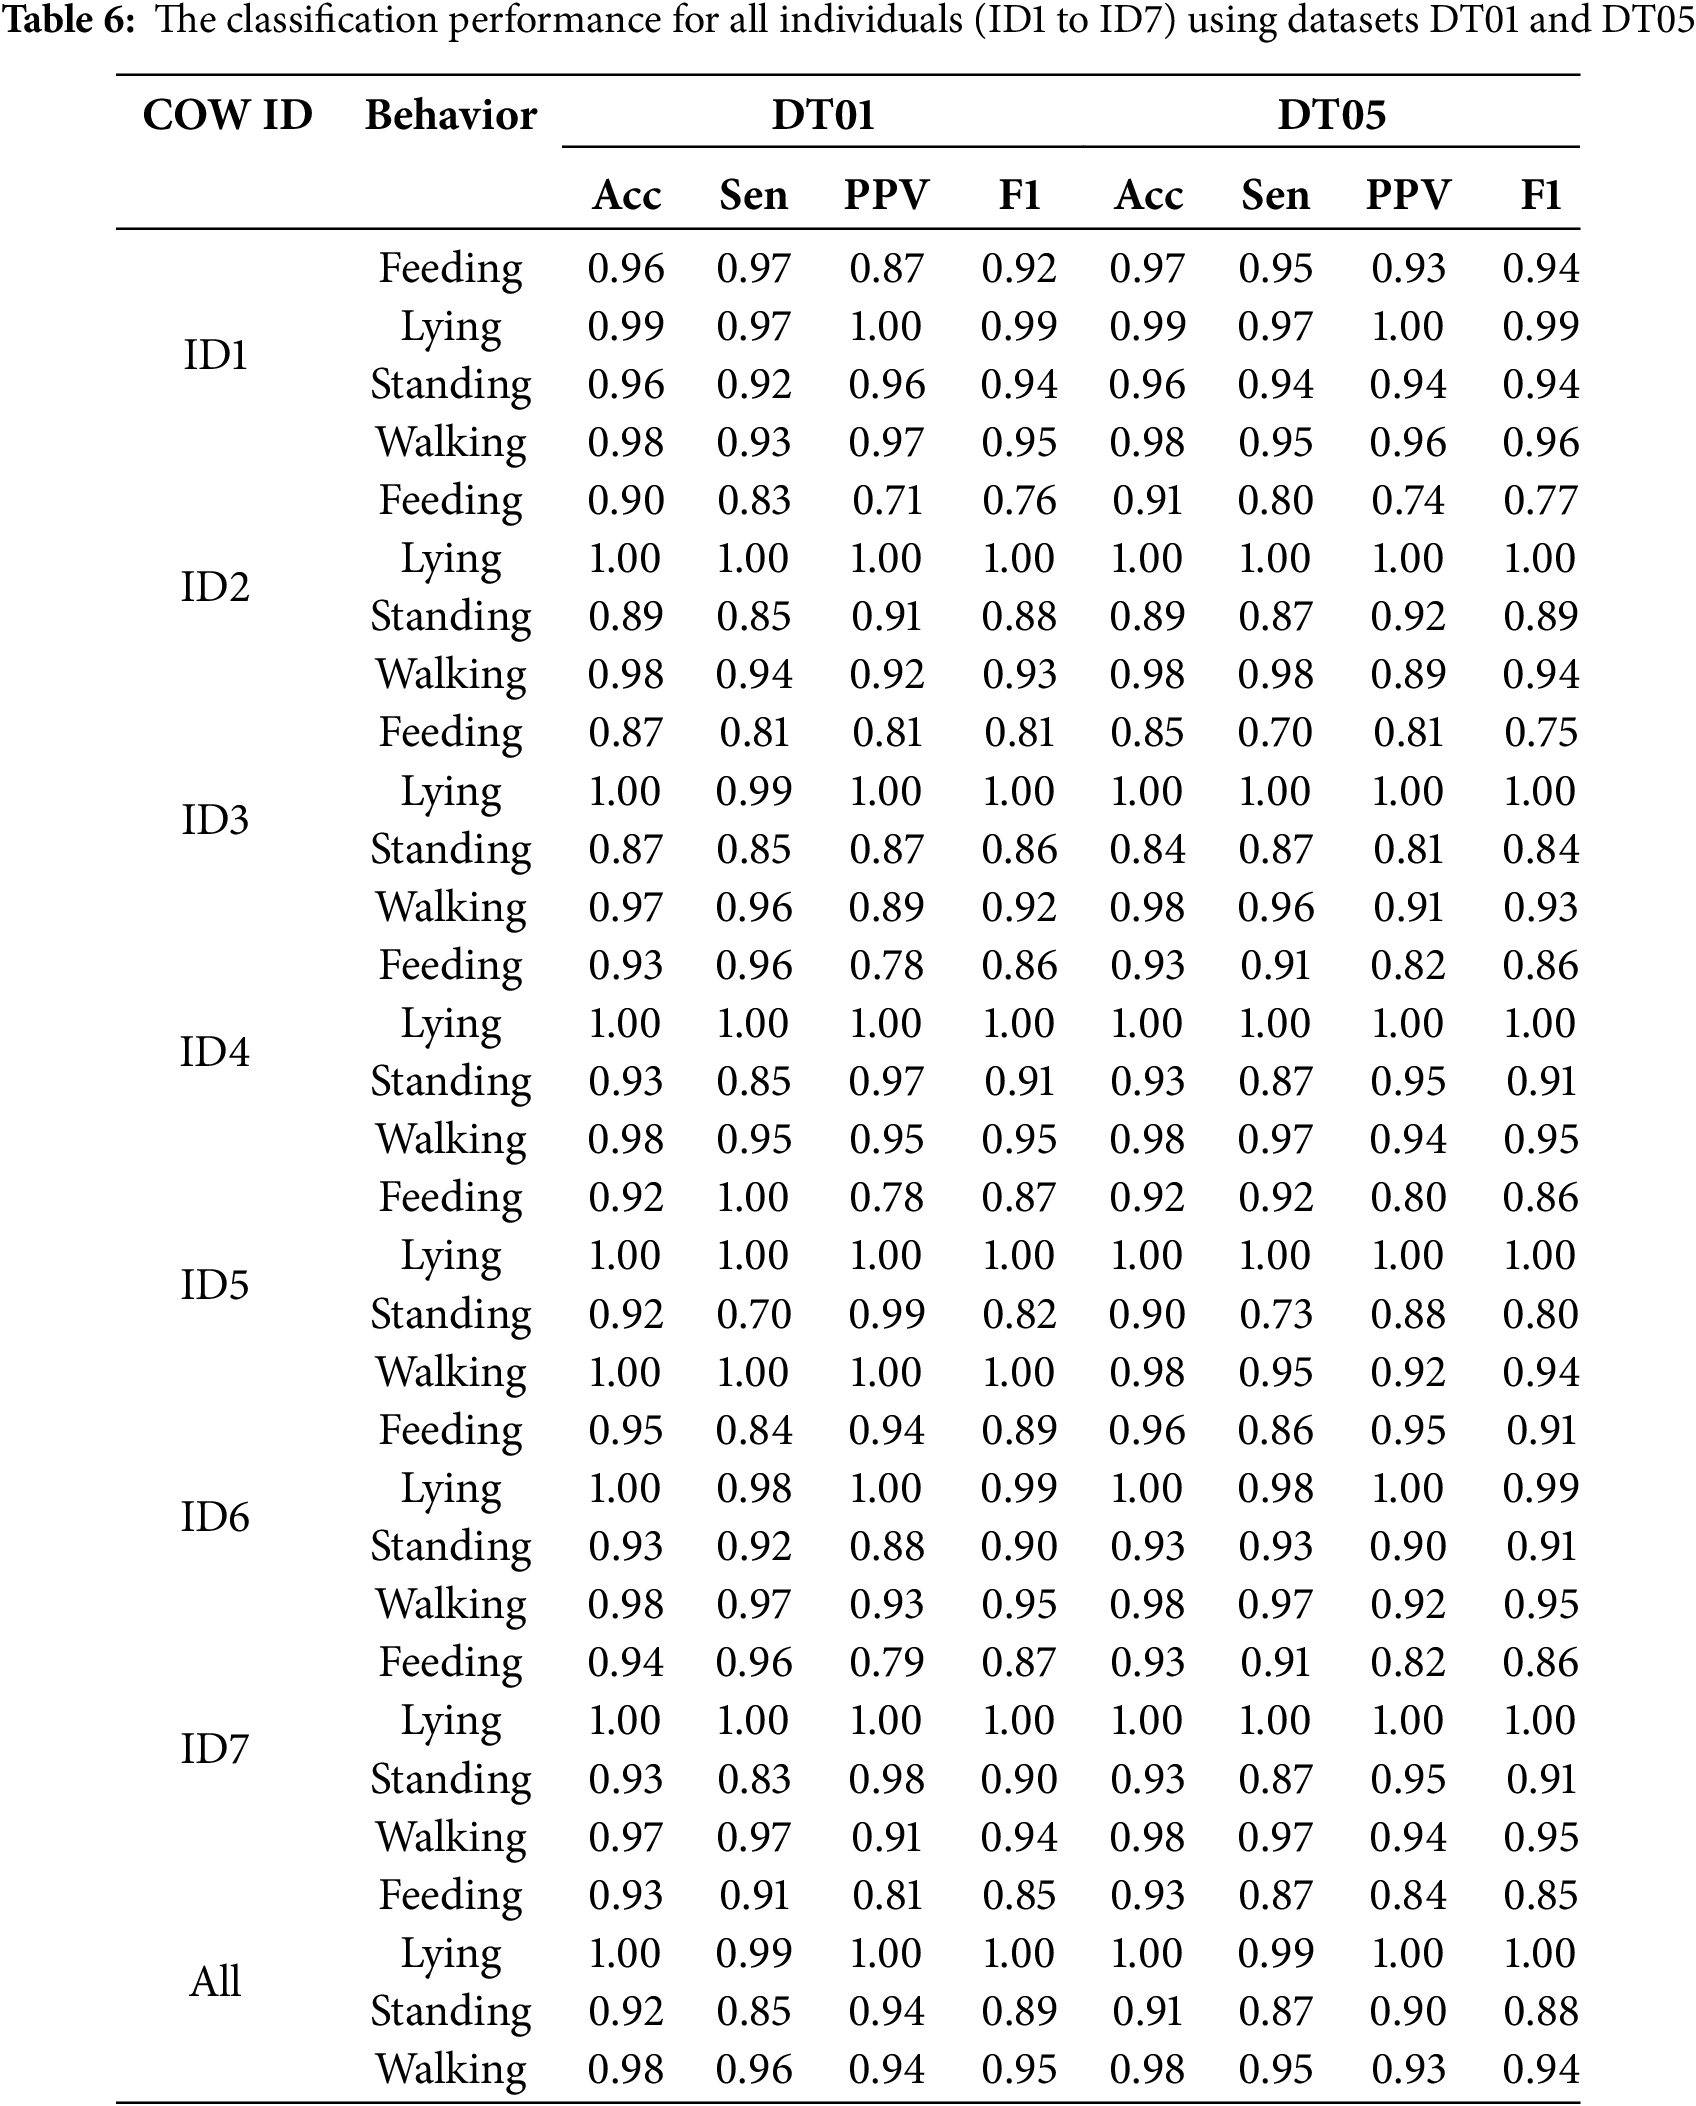
The results show that, despite some minor differences, the overall classification performance is not significantly impacted by sensor misalignment, especially when considering metrics such as Acc, Sen, PPV, and F1. For Feeding, the overall performance remains stable, with Acc maintained at 0.93 across both datasets, despite slight decreases in Sen (from 0.91 in DT01 to 0.87 in DT05) and PPV (from 0.81 to 0.84). For individuals such as ID3, Sen dropped from 0.81 to 0.70, reflecting the impact of sensor misalignment, but overall performance remained high (F1 decreased only from 0.81 to 0.75). Lying is the most stable behavior, with all metrics (Acc, Sen, PPV, F1) maintained at 1.00 or very close to 1.00 across all IDs in both datasets. This is due to the static and clearly distinguishable nature of Lying, which is minimally affected by sensor misalignment. For Standing, slight differences were observed between the two datasets. In DT01, the overall performance reached an Acc of 0.92 and an F1 of 0.89, while in DT05, these metrics slightly decreased to 0.91 and 0.88, respectively. Some individuals, such as ID5 and ID3, were more affected, with Sen decreasing from 0.70 to 0.73 for ID5 and from 0.85 to 0.87 for ID3, but PPV and F1 values remained stable. Walking also exhibited similar stability, with overall Acc remaining at 0.98 across both datasets, and the F1 showing only a minor drop from 0.95 to 0.94. Certain IDs, such as ID6 and ID7, showed no changes or even slight improvements in some metrics, such as the Sen of ID2, which increased from 0.94 to 0.98. This indicates that sensor misalignment has little impact on behaviors with strong kinematic characteristics, such as Walking.
Evaluating the overall performance of the model should be conducted using two main approaches: macro-average and micro-average. Macro-average calculates the unweighted average of performance metrics Acc, Sen, PPV, and F1 across each class. This approach provides a fair assessment of the model for all behaviors, including rare ones. It is particularly crucial for imbalanced datasets, as classes with less data are given equal consideration as those with more data. Micro-average, on the other hand, computes metrics based on the total number of true and false predictions across all classes. This approach focuses on the overall performance of the model on the entire dataset, making it especially suitable for scenarios where class distributions are uneven. By combining these two approaches, a comprehensive evaluation of the model’s performance can be achieved.
Tables 7 and 8 show that the model achieves high performance across all six datasets, with the macro-average always being greater than the micro-average for all metrics.
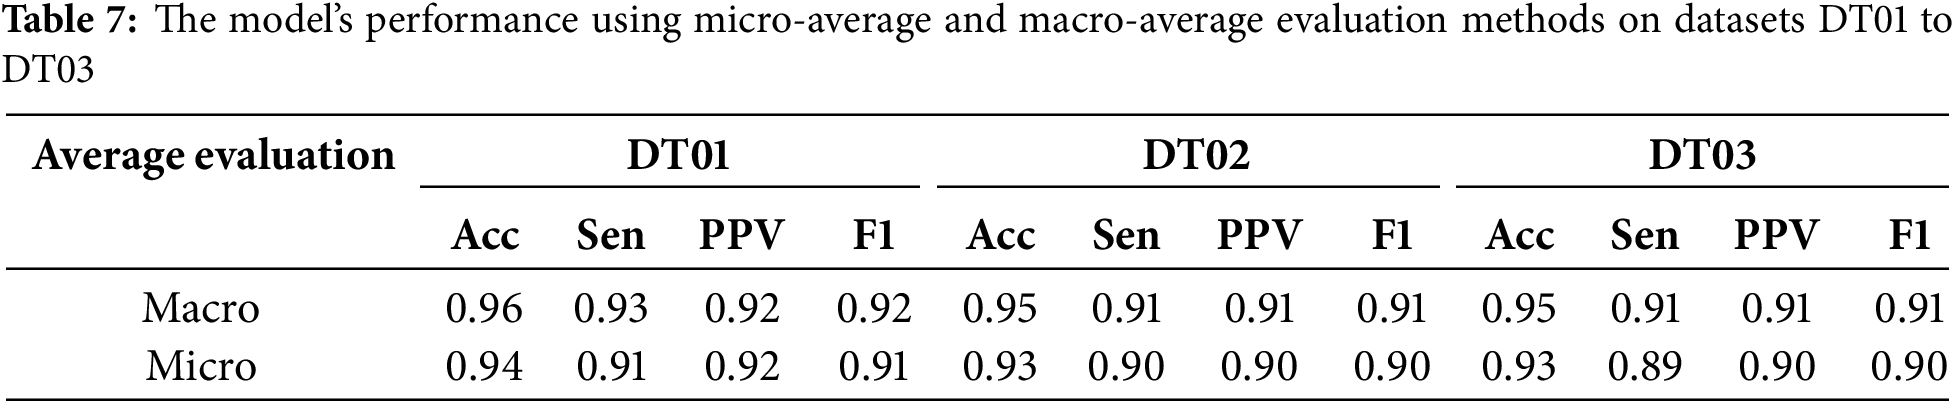
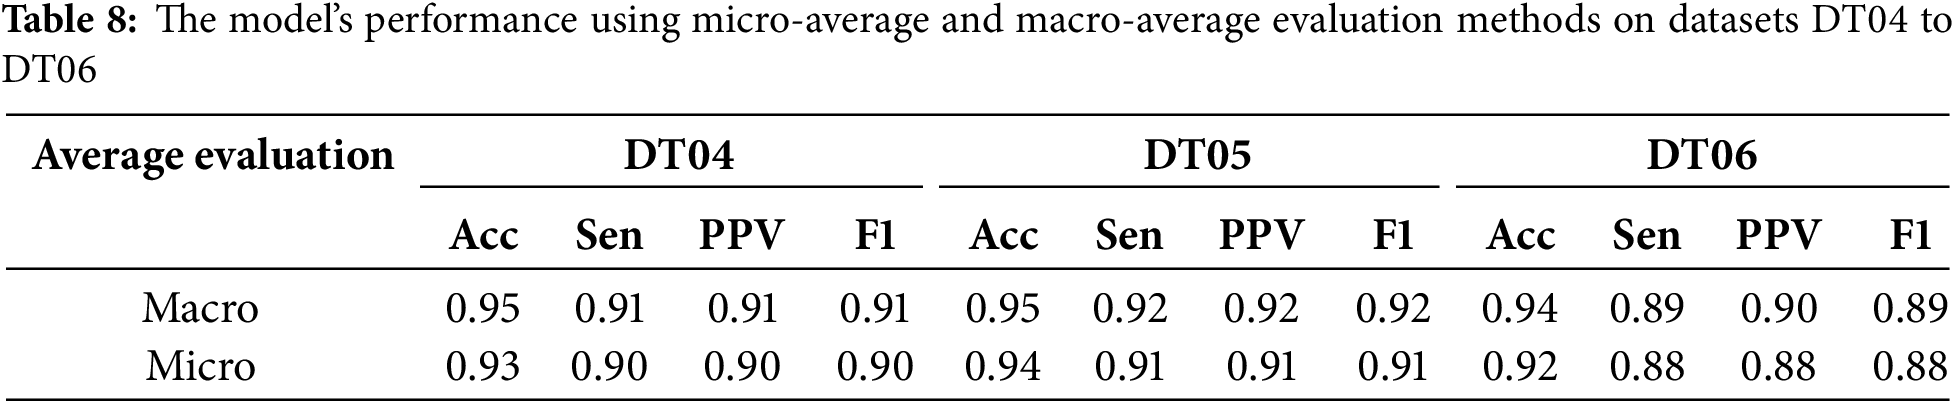
The results in the two tables demonstrate that the model’s performance across datasets DT01 to DT06 remains stable, with a gradual decline as the level of sensor misalignment and the proportion of misaligned data increase, but without significantly impacting overall performance. In DT01, the model achieves its highest performance with an Acc of 0.96, Sen of 0.93, PPV of 0.92, and F1 of 0.92 in macro evaluation. When moving to DT02, the metrics slightly decrease to an Acc of 0.95 and Sen of 0.91, while in DT03, Acc and Sen remain consistent at 0.95 and 0.91, respectively, indicating that minor misalignment does not significantly affect the model’s performance. For DT04 and DT05, performance remains stable. In DT04, the model achieves an Acc of 0.95 and Sen of 0.91, while in DT05, there is a slight improvement, with an Acc of 0.95 and Sen of 0.92. However, in DT06, performance decreases noticeably, with Acc dropping to 0.94 and Sen declining to 0.89, reflecting the impact of greater misalignment and a higher proportion of misaligned data.
Despite this decline, the model maintains an Acc above 0.92 across all datasets, and the F1 does not drop significantly, demonstrating the model’s strong generalization ability and stability when faced with sensor misalignment.
In this study, a real-time cattle behavior classification system was designed, focusing on four behaviors: Feeding, Lying, Standing, and Walking. These basic behaviors can provide insights into cattle health. Behavioral data were collected using accelerometer sensors mounted on the neck and legs. The DT algorithm was applied, and the features VeDBA, Mean, Variance, and Kurtosis were found to be effective with a short time window. Using a 3-s time window, the classification performance remained consistent even when the sensors were misaligned due to cattle movement. The study demonstrated that the proposed system operates effectively when deployed in real-world scenarios.
The system achieved an Acc ranging from 0.93 to 0.96 and an F1 ranging from 0.88 to 0.92 for the four behaviors across all datasets (DT01 to DT06), with Sen varying between 0.88 and 0.93 and PPV ranging from 0.88 to 0.92, demonstrating stable performance even under various levels of sensor misalignment. The results indicate that combining neck- and leg-mounted accelerometers provides better classification performance compared to using a single sensor [21–23]. During data collection, if only the leg-mounted sensor is used, the behaviors “Feeding” and “Standing” are the most challenging to distinguish due to their similar acceleration patterns [5,21]. Similarly, using only the neck-mounted sensor leads to misclassification between “Standing” and “Lying” for the behaviors in this study [5,21]. Based on the obtained results and corroborating research [5], the combination of two sensors yields significantly improved classification performance. However, a limitation of the study is that the data collection period for certain behaviors was not long enough to fully capture behavioral patterns. For Walking, the study results indicate relatively stable assessments, but short data collection periods may reduce the ability to detect changes in behavior. Extending the data collection period would provide more detailed insights into behavioral movements. Therefore, future studies should extend the data collection period.
The choice of algorithms and features plays a significant role in the classification performance of the system. Classification algorithms must ensure high Acc while being optimized for processing time and deployment on resource-constrained hardware [5,21,22]. The study by Mekruksavanich et al. [35] employed a ResNeXt deep residual network, achieving an Acc of approximately 0.95 and an F1 of 0.92 for cattle behavior classification. Similarly, Balasso et al. [36] utilized CNNs, reaching an Acc of 0.89 and an F1 of 0.82. While both studies demonstrated strong classification performance, their reliance on complex deep learning models significantly increases computational demands and extends deployment time.
The features extracted from the data must have high discriminatory power, be computationally efficient, and align with the nature of the activity data. Wang et al. [21,22] employed AdaBoost for behavior classification, while Phung et al. [23] used GBDT, with both studies achieving classification accuracies above 0.9 for all behaviors. Additionally, RF has also been utilized for classification in other studies [5,37]. These algorithms are well-suited for behavior classification tasks similar to those in this study.
However, maintaining real-time operation over extended periods is critical, and the algorithms are less feasible due to their higher computational complexity and energy consumption. The DT algorithm, with its proven low energy consumption per behavior, emerges as a suitable choice. Combined with the VeDBA, Mean, Variance, and Kurtosis features, the proposed system demonstrates effective classification performance with a short 3-s window size.
The length of the data window is a crucial factor that directly impacts classification performance [23]. A window that is too short may fail to capture the distinctive features of an activity, resulting in poor classification Acc. Conversely, a window that is too long increases computational complexity and reduces the system’s real-time responsiveness [5,26]. Arcidiacono et al. [3] used a 5-s window to classify standing and Feeding behaviors in cattle, achieving 0.93 Acc. Other studies [2,21,22] employed even larger window sizes to provide sufficient information for classification models. Martono et al. [37] utilized collar-mounted tri-axial accelerometers and machine learning algorithms such as RF and DT, to classify feeding and ruminating behaviors in cattle. While they achieved high Sen and specificity for feeding behavior, their reliance on longer data (10, 30, 60, and 180 s) segmentation intervals reduced the system’s real-time applicability.
This study aimed to further optimize window size by adopting a 3-s data window. This shorter window size significantly reduces the likelihood of capturing multiple activities within a single window. Additionally, it lowers computational demands and energy consumption. However, the challenge lies in the limited behavioral data within such a short window. The study addresses this challenge by combining neck- and leg-mounted sensors. With a 3-s window, the classification performance was found to be comparable to that of larger window sizes, demonstrating the system’s efficiency and effectiveness.
The parameters and behavior of individual cows can influence the classification performance of the system [12]. Variations may stem from biological characteristics, activity patterns, or environmental conditions, leading to non-uniform sensor data. Larger or heavier cattle may produce less variable acceleration signals during movement compared to smaller or lighter ones, which can affect feature extraction. Some cattle exhibit more active behaviors (e.g., Frequent walking or Vigorous movements), while others tend to be less active. Behaviors such as Running, sudden movements, or Strong shaking can cause sensor misalignment, resulting in misclassification [4]. Versluijs et al. [38] achieved high classification Acc for free-ranging cattle behaviors using 10 Hz accelerometer data but did not address sensor misalignment challenges. Our study simulated various misalignment scenarios and demonstrated consistent performance, maintaining Acc of 0.93 to 0.96 even with 50% misaligned data. This strengthens the conclusion that the proposed classification system, utilizing the DT algorithm with VeDBA, Mean, Variance, and Kurtosis features and a short 3-s window, performs effectively in real-world conditions.
The system uses ADXL345 accelerometers and an Atmega328 microcontroller, which operates within a wide temperature range of −40°C to +85°C, ensuring functionality under diverse conditions. The device has a lifespan of approximately 400 h, making it suitable for practical remote monitoring applications. While data transmission frequency can be adjusted, it directly impacts battery life, which plays a crucial role in system deployment. Optimizing device components, choosing appropriate signal transmission methods, and efficient classification algorithms can further enhance battery performance.
With adjustable parameters, the proposed system is adaptable to various livestock species and scalable for use in large farms. It can simultaneously collect data and classify behaviors from multiple animals. Future studies should incorporate data from a broader range of livestock to validate this capability. The current study focuses on four basic behaviors, sufficient for assessing cattle health and providing early alerts to farmers. Based on the promising results, it is anticipated that the system’s accuracy will remain consistent or improve when additional behaviors are included. Subsequent research should address this expansion.
The motion data of the proposed system is further supported by images from surveillance cameras to accurate label behaviors. Motion data from two ADXL345 accelerometers is transmitted to an ATmega328 microcontroller, leveraging its advanced RISC architecture for efficient local processing. This design allows each individual cow to function as a network node and enables easy monitoring at the group level. By integrating multiple groups of cows, the system’s operational scale can be rapidly expanded, making it suitable for large farms. The system minimizes the server’s workload by offloading initial data processing to the microcontroller and offers a cost-effective solution using readily available components.
The available bandwidth during operation ranged from 100 to 500 kHz. This adaptive bandwidth usage ensures efficient communication between devices without excessive power consumption. The bandwidth capacity was determined based on the transmission requirements of the LoRa module, which communicates motion data from the neck- and leg-mounted sensors to the central processing unit. During periods of low activity, such as when cattle are resting, bandwidth utilization remained at the lower end of the spectrum (100–150 kHz). However, during peak periods when multiple animals were actively feeding or walking, bandwidth usage increased toward 500 kHz to handle the higher volume of data packets.
Latency measurements indicated an average processing delay of 120 ms, with peak delays reaching up to 200 ms during periods of high data traffic, such as when multiple animals were active simultaneously. Despite these peaks, latency remained below the 250-ms threshold necessary for real-time behavior monitoring, ensuring timely and accurate health assessments. The energy consumption associated with these parameters was also assessed, revealing that the LoRa module, which handles data transmission, consumes 50%–55% of system power during high-bandwidth operation. This increase in power consumption shortens battery life to approximately 300–350 h under continuous high-activity conditions, compared to 450–500 h during low-activity periods when bandwidth usage and transmission frequency decrease. The efficient management of these parameters, together with the adaptive performance of the ADXL345 accelerometer, ATmega328 microcontroller and LoRa module, makes it possible to apply the system at large scale in real farm environments.
However, scalability challenges may arise in large-scale implementations. Simultaneous data transmission from multiple devices can cause network congestion, particularly in scenarios involving hundreds of cows. The centralized server’s capacity to process aggregated data at scale requires careful evaluation to prevent system delays. Deployment costs can also increase significantly due to the need for extensive network infrastructure, additional microcontrollers, and monitoring systems. Furthermore, practical challenges such as ensuring the durability of accelerometers in harsh farm environments, maintaining adequate power supply for the devices, and synchronizing motion data with video footage across vast areas must be addressed. Issues related to processing latency on the devices should also be carefully assessed when expanding the system’s coverage. Future studies should focus on these issues to enhance the system’s effectiveness.
Based on the climatic conditions of the study area, characterized by hot and humid summers and cold, dry winters, with temperatures ranging from 28°C to 35°C in summer and 10°C to 15°C in winter, the system maintenance cost during the 3-month trial period is estimated to account for approximately 5%–7% of the total equipment value. This includes cleaning, inspection, and replacement of components affected by high humidity, harsh temperatures, or dust in the grazing environment.
Additionally, the proposed system has not yet been tested in regions with extreme weather conditions such as snow, ice, or high temperatures. In cold climates, livestock may reduce movement, focus on maintaining body temperature, and require increased energy intake, whereas high temperatures cause livestock to reduce food consumption, increase water intake, and experience decreased productivity. With changing climatic conditions, livestock behavior data is likely to vary accordingly. Future studies could expand to include changing climatic conditions.
This study proposed an IoT system for classifying cattle behavior. Data for four basic behaviors—Feeding, Lying, Standing, and Walking—were collected using neck-mounted and leg-mounted accelerometer sensors. The features VeDBA, Mean, Variance, and Kurtosis, combined with the DT algorithm, proved highly suitable for classifying these four behaviors. The system offers advantages such as non-intrusive behavior classification, ease of parameter setup, low energy consumption, and affordability.
Extensive experiments and comparisons of different scenarios were conducted to determine the most optimal parameters for real-time cattle behavior classification. The study used various data window durations—3, 6, 9, 12, and 15 s—and demonstrated that the system performed effectively with a 3-s window. Notably, there was no data overlap across windows. Sensor misalignment during classification was also considered, using datasets that simulated various degrees and percentages of misalignment. The findings showed that with the DT algorithm, VeDBA, Mean, Variance, and Kurtosis features, and a short 3-s window, the results remained robust even with significant sensor misalignment, where up to 50% of the data was affected. The system achieved an Acc of 0.93 to 0.96 for all four behaviors across all datasets (including the original and misaligned datasets), with Sen and PPV approximately 0.9, and F1 consistently ranging from 0.88 to 0.92.
The proposed system is expected to expand to cover various livestock types and additional behaviors. Energy efficiency will be prioritized to extend device usage time. Ultimately, this system is well-suited for large-scale farms and can provide early health alerts for farmers regarding cattle conditions.
Acknowledgement: Thanks to Institute of Information Technology (IoIT-VAST) for supporting this research and allowing us to use the “IoT and Robot intensive laboratory” equipment, under code CSCL02.02/24-25.
Funding Statement: This research is funded by Vietnam National Foundation for Science and Technology Development (NAFOSTED) under grant number: 02/2022/TN.
Author Contributions: Manh-Tuyen Vi and Viet-Manh Do conducted data analysis, implemented machine-learning techniques and complete the manuscript. Duc-Tan Tran and Viet-Manh Do provided expert guidance on the application of machine learning methods. Duc-Nghia Tran collected data, offered modelling processes and wrote the original draft of the study. Duc-Tan Tran and Manh-Tuyen Vi, the corresponding authors, conceived the study and contributed to its investigation, development, and coordination. All authors reviewed the results and approved the final version of the manuscript.
Availability of Data and Materials: The dataset that support the findings of this study are available from the corresponding author, Duc-Tan Tran.
Ethics Approval: Not applicable.
Conflicts of Interest: The authors declare no conflicts of interest to report regarding the present study.
References
1. Luo W, Zhang G, Yuan Q, Zhao Y, Chen H, Zhou J, et al. High-precision tracking and positioning for monitoring Holstein cattle. PLoS One. 2024;19(5):e0302277. doi:10.1371/journal.pone.0302277. [Google Scholar] [CrossRef]
2. Arcidiacono C, Porto SM, Mancino M, Cascone G. A threshold-based algorithm for the development of inertial sensor-based systems to perform real-time cow step counting in free-stall barns. Biosyst Eng. 2016;153:99–109. doi:10.1016/j.biosystemseng.2016.11.003. [Google Scholar] [CrossRef]
3. Arcidiacono C, Porto SM, Mancino M, Cascone G. Development of a threshold-based classifier for real-time recognition of cow feeding and standing behavioral activities from accelerometer data. Comput Electron Agric. 2017;134:124–34. doi:10.1016/j.compag.2017.01.021. [Google Scholar] [CrossRef]
4. Pereira GM, Bradley JH, Marcia IE. Validation of an eartag accelerometer sensor to determine rumination, eating, and activity behaviors of grazing dairy cattle. J Dairy Sci. 2019;101:2492–5. doi:10.3168/jds.2016-12534. [Google Scholar] [CrossRef]
5. Tran DN, Nguyen TN, Khanh PCP, Tran DT. An IoT-based design using accelerometers in animal behavior recognition systems. IEEE Sens J. 2022;22(18):17515–28. doi:10.1109/JSEN.2021.3051194. [Google Scholar] [CrossRef]
6. Jarchi D, Kaler J, Sanei S. Lameness detection in cows using hierarchical deep learning and synchrosqueezed wavelet transform. IEEE Sens J. 2021;21(7):9349–58. doi:10.1109/JSEN.2021.3054718. [Google Scholar] [CrossRef]
7. Kumar S, Singh SK, Dutta T, Gupta HP. Poster: a real-time cattle recognition system using wireless multimedia networks. In: Proceedings of the 14th Annual International Conference on Mobile Systems, Applications, and Services; 2016 Jun 26–30; Singapore. [Google Scholar]
8. Oudshoorn FW, Cornou C, Hellwing ALF, Hansen HH, Munksgaard L, Lund P, et al. Estimation of grass intake on pasture for dairy cows using tightly and loosely mounted di- and tri-axial accelerometers combined with bite count. Comput Electron Agric. 2013;99(4):227–35. doi:10.1016/j.compag.2013.09.013. [Google Scholar] [CrossRef]
9. Porto SMC, Arcidiacono C. Localization and identification performances of a real-time system based on ultra-wideband technology for monitoring and tracking dairy cow behavior in a semi-open free-stall barn. Comput Electron Agric. 2014;108:221–9. doi:10.1016/j.compag.2014.08.001. [Google Scholar] [CrossRef]
10. Alsaaod M, Dürr S, Iten D, Buescher W, Steiner A. Locomotion behavior of dairy cows on traditional summer mountain farms in comparison with modern cubicle housing without access to pasture. PLoS One. 2022;17(3):e0264320. doi:10.1371/journal.pone.0264320. [Google Scholar] [CrossRef]
11. Maina CW. IoT at the grassroots–exploring the use of sensors for livestock monitoring. In: IST-Africa Week Conference; 2017 May 30–Jun 2; Windhoek, Namibia. [Google Scholar]
12. Diosdado JAV, Barker ZE. Classification of behavior in housed dairy cows using an accelerometer-based activity monitoring system. Anim Biotelem. 2015;3:1–14. doi:10.1186/s40317-015-0045-8. [Google Scholar] [CrossRef]
13. Pichlbauer B, Chapa Gonzalez JM, Bobal M, Guse C, Iwersen M, Drillich M. Evaluation of different sensor systems for classifying the behavior of dairy cows on pasture. Sensors. 2024;24(23):7739. doi:10.3390/s24237739. [Google Scholar] [CrossRef]
14. Smith D, Little B, Greenwood PI, Valencia P, Rahman A, Ingham A, et al. A study of sensor-derived features in cattle behaviour classification models. In: 2015 IEEE SENSORS; 2015 Nov 1–4; Busan, Republic of Korea. p. 1–4. doi:10.1109/ICSENS.2015.7370529. [Google Scholar] [CrossRef]
15. Shahriar MS, Smith D. Detecting heat events in dairy cows using accelerometers and unsupervised learning. Comput Electron Agric. 2016;128(1):20–6. doi:10.1016/j.compag.2016.08.009. [Google Scholar] [CrossRef]
16. Talavera JM, Tobón LE, Gómez JA, Culman MA, Aranda JM, Parra DT, et al. Review of IoT applications in agro-industrial and environmental fields. Comput Electron Agric. 2017;142:283–97. doi:10.1016/j.compag.2017.09.015. [Google Scholar] [CrossRef]
17. Viazzi S,Bahr C, Van Hertem T, Romanini CEB, Pluk A, Halachmi I, et al. Analysis of individual classification of lameness using automatic measurement of back posture in dairy cattle. J Dairy Sci. 2013;96(1):2893–902. doi:10.3168/jds.2012-5806. [Google Scholar] [CrossRef]
18. Viazzi S, Bahr C, Van Hertem T, Schlageter-Tello A, Romanini CEB, Halachmi I, et al. Comparison of a three-dimensional and two-dimensional camera system for automated measurement of back posture in dairy cows. Comput Electron Agric. 2014;100(1):139–47. doi:10.1016/j.compag.2013.11.005. [Google Scholar] [CrossRef]
19. Porto SMC, Arcidiacono C, Anguzza U, Cascone G. The automatic detection of dairy cow feeding and standing behaviours in free-stall barns by a computer vision-based system. Biosyst Eng. 2015;133(e42):46–55. doi:10.1016/j.biosystemseng.2015.02.012. [Google Scholar] [CrossRef]
20. Jung W, Kim S, Hong S, Seo J. An AIoT monitoring system for multi-object tracking and alerting. Comput Mater Contin. 2021;67(1):337–48. doi:10.32604/cmc.2021.014561. [Google Scholar] [CrossRef]
21. Wang J, He Z, Zheng G, Gao S, Zhao K. Development and validation of an ensemble classifier for real-time recognition of cow behavior patterns from accelerometer data and location data. PLoS One. 2018;13(9):e0203546. doi:10.1371/journal.pone.0203546. [Google Scholar] [CrossRef]
22. Wang J, He Z, Ji J, Zhao K, Zhang H. IoT-based measurement system for classifying cow behavior from tri-axial accelerometer. Cienc Rural. 2019;49(6):1–13. doi:10.1590/0103-8478cr20180627. [Google Scholar] [CrossRef]
23. Phung CPK, Tran DT, Duong VT, Nguyen HT, Tran DN. The new design of cows’ behavior classifier based on acceleration data and proposed feature set. Math Biosci Eng. 2020;17(4):2760–80. doi:10.3934/mbe.2020151. [Google Scholar] [CrossRef]
24. Shen W, Zhang A, Zhang Y, Wei X, Sun J. Rumination recognition method of dairy cows based on the change of noseband pressure. Inf Process Agric. 2020;7(4):479–90. doi:10.1016/j.inpa.2020.01.005. [Google Scholar] [CrossRef]
25. Pavlovic D, Davison C, Hamilton A, Marko O, Atkinson R, Michie C, et al. Classification of cattle behaviours using neck-mounted accelerometer-equipped collars and convolutional neural networks. Sensors. 2021;21(12):4050. doi:10.3390/s21124050. [Google Scholar] [CrossRef]
26. Twomey N, Diethe T. A comprehensive study of activity recognition using accelerometers. Informatics. 2018;5(2):1–37. doi:10.3390/informatics5020027. [Google Scholar] [CrossRef]
27. Guo Y, Corke P, Poulton G, Wark T, Bishop-Hurley G, Swain D. Animal behaviour understanding using wireless sensor networks. In: Proceedings of the 31st IEEE Conference on Local Computer Networks; 2006 Nov 14–16; Tampa, FL, USA. p. 607–14. [Google Scholar]
28. Brahim A, Malika B, Rachida A, Mourad L. Unsupervised automated monitoring of dairy cows’ behavior based on Inertial Measurement Unit attached to their back. Comput Electron Agric. 2019;167(9):105068. doi:10.1016/j.compag.2019.105068. [Google Scholar] [CrossRef]
29. Le TT, Rin N, Masashi T, Huynh TTB, Hironori N. Cow estrus detection via discrete wavelet transformation and unsupervised clustering. In: Proceedings of the 9th International Symposium on Information and Communication Technology; 2018 Dec 6–7; Danang City, Vietnam. p. 305–12. [Google Scholar]
30. García-Martín E, Rodrigues CF, Riley G, Grahn H. Estimation of energy consumption in machine learning. J Parallel Distrib Comput. 2019;134(3):75–88. doi:10.1016/j.jpdc.2019.07.007. [Google Scholar] [CrossRef]
31. Bezen R, Edan Y, Halachmi I. Computer vision system for measuring individual cow feed intake using RGB-D camera and deep learning algorithms. Comput Electron Agric. 2020;172:105345. doi:10.1016/j.compag.2020.105345. [Google Scholar] [CrossRef]
32. Analog Devices, Inc. ADXL345 Datasheet: Digital Accelerometer. Norwood, MA, USA: Analog Devices, Inc. [cited 2025 Jan 1]. Available from: https://www.analog.com/media/en/technical-documentation/data-sheets/ADXL345.pdf. [Google Scholar]
33. Microchip Technology Inc. ATmega328P Datasheet: 8-bit AVR Microcontroller. Chandler, AZ: Microchip Technology Inc. 2018 [cited 2025 Jan 1]. Available from: https://ww1.microchip.com/downloads/en/DeviceDoc/Atmel-7810-Automotive-Microcontrollers-ATmega328P_Datasheet.pdf. [Google Scholar]
34. Tian F, Wang J, Xiong B, Jiang L, Song Z, Li F. Real-time behavioral recognition in dairy cows based on geomagnetism and acceleration information. IEEE Access. 2021;9:109497–509. doi:10.1109/ACCESS.2021.3099212. [Google Scholar] [CrossRef]
35. Mekruksavanich S, Jantawong P, Tancharoen D, Jitpattanakul A. Sensor-based cattle behavior classification using deep learning approaches. In: 2023 International Technical Conference on Circuits/Systems, Computers, and Communications (ITC-CSCC); 2023 Jun 25–28; Jeju, Republic of Korea. p. 1–4. doi:10.1109/ITC-CSCC58803.2023.10212958. [Google Scholar] [CrossRef]
36. Balasso P, Taccioli C, Serva L, Magrin L, Andrighetto I, Marchesini G. Uncovering patterns in dairy cow behaviour: a deep learning approach with tri-axial accelerometer data. Animals. 2023;13(11):1886. doi:10.3390/ani13111886. [Google Scholar] [CrossRef]
37. Martono NP, Sawado R, Nonaka I, Terada F, Ohwada H. Automated cattle behavior classification using wearable sensors and machine learning approach. In: Wu S, Yang W, Amin MB, Kang BH, Xu G, editors. Knowledge management and acquisition for intelligent systems. Singapore: Springer; 2023. doi:10.1007/978-981-99-7855-7_5. [Google Scholar] [CrossRef]
38. Versluijs E, Niccolai LJ, Spedener M, Zimmermann B, Hessle A, Tofastrud M, et al. Classification of behaviors of free-ranging cattle using accelerometry signatures collected by virtual fence collars. Front Anim Sci. 2023;4:1083272. doi:10.3389/fanim.2023.1083272. [Google Scholar] [CrossRef]
Cite This Article
 Copyright © 2025 The Author(s). Published by Tech Science Press.
This work is licensed under a Creative Commons Attribution 4.0 International License , which permits unrestricted use, distribution, and reproduction in any medium, provided the original work is properly cited.
 Downloads
 Citation Tools