 Open Access
ARTICLE
Steel Ball Defect Detection System Using Automatic Vertical Rotating Mechanism and Convolutional Neural Network
Department of Mechanical Engineering, National Chung Hsing University, Taichung, 402202, Taiwan
* Corresponding Author: Yi-Cheng Huang. Email:
(This article belongs to the Special Issue: Selected Papers from the International Multi-Conference on Engineering and Technology Innovation 2024 (IMETI2024))
Computers, Materials & Continua 2025, 83(1), 97-114. https://doi.org/10.32604/cmc.2025.063441
Received 14 January 2025; Accepted 26 February 2025; Issue published 26 March 2025
Abstract
Precision steel balls are critical components in precision bearings. Surface defects on the steel balls will significantly reduce their useful life and cause linear or rotational transmission errors. Human visual inspection of precision steel balls demands significant labor work. Besides, human inspection cannot maintain consistent quality assurance. To address these limitations and reduce inspection time, a convolutional neural network (CNN) based optical inspection system has been developed that automatically detects steel ball defects using a novel designated vertical mechanism. During image detection processing, two key challenges were addressed and resolved. They are the reflection caused by the coaxial light onto the ball center and the image deformation appearing at the edge of the steel balls. The special vertical rotating mechanism utilizing a spinning rod along with a spiral track was developed to enable successful and reliable full steel ball surface inspection during the rod rotation. The combination of the spinning rod and the spiral rotating component effectively rotates the steel ball to facilitate capturing complete surface images. Geometric calculations demonstrate that the steel balls can be completely inspected through specific rotation degrees, with the surface fully captured in 12 photo shots. These images are then analyzed by a CNN to determine surface quality defects. This study presents a new inspection method that enables the entire examination of steel ball surfaces. The successful development of this innovative automated optical inspection system with CNN represents a significant advancement in inspection quality control for precision steel balls.Keywords
The applications of precision steel balls are extensive, spanning aerospace, slide rails, and precision bearings. Their primary functions include reducing friction and serving as transmission supports, making them essential components in various mechanical systems. The quality of precision steel balls directly impacts the operational stability, precision, and lifespan of machinery. Consequently, ensuring high-quality manufacturing of steel balls is crucial, as only superior steel balls can meet the stringent requirements for precision, strength, and reliability.
In the literature review on steel ball inspection [1], the comprehensive manufacturing process of steel balls is detailed from multiple sources. Initially, raw materials are drawn into wire form and undergo cold heading to shape them into preliminary ball blanks. Flashing is then performed to remove burrs and further refine their shape. The balls subsequently undergo heat treatment, including carburizing, quenching, and tempering, to enhance mechanical properties, specifically to increase strength and hardness. The peening process follows, improving surface stress distribution to boost fatigue strength. The final steps involve refining the size and surface finish of the balls, using lapping and grinding to achieve precise shape and dimensions, while polishing enhances surface smoothness.
Throughout this intricate manufacturing process, various residual stresses, wear marks, or scratches can emerge on the steel balls. Although these imperfections might be minuscule, they can significantly affect performance, especially for steel balls used under high loads and high speeds. Therefore, rigorous inspection tests, traditionally performed manually, are essential.
In terms of surface inspection, most steel ball manufacturers still rely on visual sampling by trained inspectors, a method heavily dependent on the experience of the personnel and lacking in standardized, objective criteria. Transferring technical expertise for this inspection is challenging, and the sampling approach reduces reliability as it cannot guarantee that every steel ball with surface defects will be identified. Furthermore, manual inspection is time-consuming and labor-intensive, leading to high costs. To address these issues, high-efficiency, consistent, and automated surface defect detection systems for steel balls are essential on fast-paced production lines.
Automated surface inspection of steel balls faces numerous challenges, the most problematic of which are the high reflectivity of curved surfaces and the need for full surface coverage of the sphere. Visual inspection methods require intense lighting to reveal small surface defects, yet the high reflectivity of curved surfaces can cause excessive reflection and overexposure, obscuring details on the ball’s surface. Additionally, achieving full surface coverage of the spherical shape poses a significant hurdle, necessitating multiple scans from various angles to ensure complete inspection of the spherical surface.
To address the challenges in automated inspection of steel ball surfaces, various methods have been developed over the years, including optical sensing [2], machine vision inspection [3–7], eddy current inspection [8–10], optical fiber inspection [11], and capacitance sensor inspection [12]. In 2020, Zhang et al. [1] reviewed approximately two decades of automated steel ball inspection systems, summarizing the features, strengths, and limitations of each method. Due to differences in inspection methods and principles, diverse steel ball unfolding mechanisms have also been proposed. Among these, machine vision inspection stands out for its high degree of automation and repeatability. In previous research, Chen et al. [6] successfully implemented a real-time machine vision inspection system suitable for industrial production lines. Therefore, this study selects machine vision as the method for steel ball inspection.
In machine vision inspection of surface defects on steel balls, two primary challenges must be addressed: the type of light source and the ball unfolding mechanism. The review in [1] identifies four types of lighting sources used in machine vision inspection: strip-shaped, ring-shaped, dual-side, and diffuse dome lighting sources. To achieve uniform illumination on the spherical surface of steel balls, the strip-shaped lighting source is excluded from consideration. While the dual-side lighting source and the diffuse dome lighting source fall under the diffuse category and provide uniform illumination, they also lead to issues with inadequate brightness and increased noise [13]. The complex design of these lighting sources further complicates adjustments [6]. Consequently, this study adopts a ring-shaped lighting source for its simplicity and enough brightness, despite its reflection challenges. In this research, a mechanism to solve the reflection issue is proposed while unfolding a ball sphere is enabled successfully.
In addition to the lighting source type and unfolding mechanism, effective machine vision inspection of steel ball surface defects requires image processing and recognition. The overall process is illustrated in Fig. 1. To address the reflection issue posed by the ring light source, this study leverages a ball unfolding mechanism to overcome it, with a focus on achieving comprehensive inspection coverage. Finally, commonly used and effective image processing techniques combined with CNN-based recognition complete the fully automated defect detection system.

Figure 1: Flowchart of machine vision inspection process for steel ball surface defects
2.1 Steel Ball Surface Unfolding Mechanism
Previous surface unfolding mechanisms for steel balls using machine vision inspection can generally be categorized into two types. The first type is the frictional disk unfolding mechanism [5,6], comprising a base disk, driving disk, and turning rotor, as shown in Fig. 2a. This mechanism uses the driving disk to rotate the steel balls in the first direction while simultaneously conveying them, with an additional turning rotor (in red in Fig. 2a) providing a secondary rotational direction. Through specific rotation angles and multi-axis rotations, it achieves surface unfolding of the steel balls. However, this mechanism is complex in design and requires multiple cameras, necessitating a total of 15 images for accurate recognition, which incurs high costs, maintenance difficulties, and cannot resolve the issue of lighting source reflections.

Figure 2: Previous steel balls surface unfolding mechanisms for machine vision inspection. (a) Cross-sectional view of the frictional driving disk unfolding mechanism (refer to Chen et al., 2016 [6]); (b) Linear track with friction pad (refer to Ng, 2007 [2]); (c) Linear track with two-camera inspection setup (refer to Do et al., 2011 [14])
The second type employs a linear track mechanism, incorporating a rotational friction pad on the steel ball transport track [2] (Fig. 2b) to achieve spherical unfolding or increasing the number of cameras [14] (Fig. 2c) to extend coverage. The former provides two orthogonal rotational axes, achieving a straightforward and intuitive surface unfolding, but due to limitations in the inspection method, the inspection area remains small, requiring multiple scans to complete the inspection of a single steel ball, making it time-consuming and inefficient. The latter approach improves inspection coverage through imaging at different angles; however, using two angles complicates uniform lighting and requires high-spec cameras to capture dynamic steel balls, which further increases costs and introduces additional technical challenges.
2.2 Image Preprocessing and Dataset Setup
With technological advancements, image processing methods have become highly complex and diverse, often adapted across different fields to meet similar requirements. Reference [15] introduces various common image processing techniques, ranging from basic brightness and contrast adjustments to advanced spatial and frequency domain processing, including feature extraction and neural network image recognition. This section primarily discusses preprocessing techniques that prepare images for classification.
In reference [16], regions of interest (ROI) are extracted from images, followed by feature extraction and recognition based on color or brightness information. Meanwhile, Lim et al. [17] proposed a neighborhood-based grayscale conversion method that enhances brightness, contrast, and detail, showing that both color and grayscale images serve different applications. Although grayscale images may lose some features, they can also highlight specific characteristics, enabling applications that are challenging with color images. These studies also touch on important yet subtle concepts like thresholding and ROI, underscoring that effective imaging often requires auxiliary processing.
In image histogram research, Patel et al. [18] revealed that the direct histogram equalization may not always be optimal for contrast enhancement and suggested several alternative equalization methods. In contrast, Huynh-The et al. [19] highlighted that standard histogram equalization may not suit consumer electronics and proposed a brightness-preserving weighted dynamic range histogram equalization to enhance contrast and detail. Somal [20] compares various enhancement methods, noting that global and partial histogram equalization can yield distinct feature images in different image regions. These studies illustrate that histogram equalization is widely applicable yet must be tailored to specific scenarios to achieve desired outcomes.
2.3 Convolutional Neural Network (CNN) Model
In the review presented in reference [1], various image processing and recognition techniques for machine vision-based surface defect detection on steel balls are summarized, including image enhancement and neural network learning-based recognition. With current technological advances, a single neural network can be trained to accomplish various tasks. For instance, Alghassab [21] employed both VGG and Inception neural networks for automated defect detection on printed circuit boards (PCBs). Liu et al. [22] also introduced the multi-scale module, which enhanced the performance of CNN in PCB defect detection, improving various detection model evaluation indicators. Similarly, Huang et al. [23] utilized multiple well-known neural networks for defect detection on metal workpieces and developed a customized CNN model with VGG as its core architecture. In reference [24], a Real-time Multi-Variant Deep Learning Model (RMVDM) was proposed for real-time defect detection on photovoltaic panels. These studies illustrate the extensive applicability of CNN for defect detection, highlighting the capabilities of the VGG network, a CNN model proposed in reference [25] mainly with 3 × 3 convolution kernels, noted for its versatility and outstanding performance in the 2014 ImageNet competition.
3.1 Introduction of Hardware Architecture
The steel ball surface inspection device proposed in this study is shown in Fig. 3. Component A in Fig. 3 is a vertical surface unfolding mechanism for steel balls, comprising a spiral track and a spinning friction rod, each powered by independent motors [M1, M2]. A more detailed description is provided in Section 3.2, with theoretical explanations in Section 3.3. Component B in Fig. 3 is an adjustable camera lift platform installed to track steel ball movement, driven by the M3 motor and a belt for vertical positioning. Component C represents the camera and accompanying lens used in this system, with the specifications statement in Section 4.1. The ring-shaped lighting source D is mounted directly on the lens to ensure focused illumination within the camera’s field of view. Lastly, component E is a diverter track that categorizes steel balls, controlled by motor [M4], enabling efficient sorting.
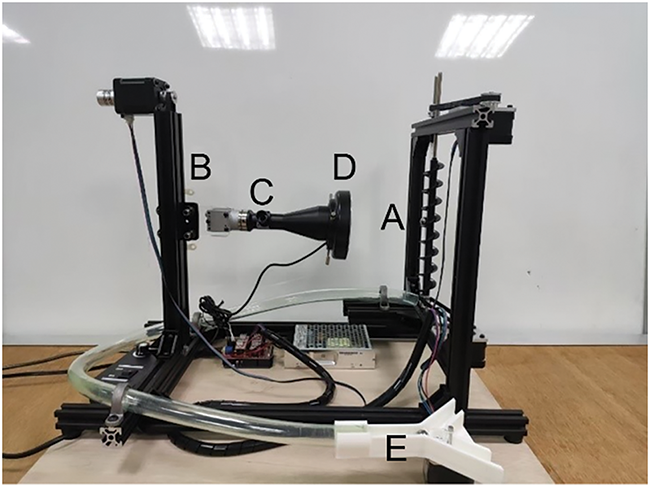
Figure 3: Actual photograph of the inspection device, A: the vertical surface unfolding mechanism; B: the camera lift platform; C: the camera and accompanying lens; D: the ring-shaped lighting source; E: the diverter
Fig. 4 illustrates the inspection process for steel balls in this system. Both Fig. 4 and previous descriptions confirm that the system utilizes four stepper motors, each driven by the A4988 driver and directed by an Arduino controller. These motors coordinate tasks such as image capture, steel ball rotation, and classification.

Figure 4: Inspection system flowchart
3.2 Unfolding Mechanism Design
This study introduces an innovative vertical unfolding mechanism, inspired by previous research concepts, designed to provide steel balls with two orthogonal rotation axes. As shown in Fig. 5, the proposed mechanism consists of a spiral track and a spinning friction rod. The spiral track simultaneously transports and rotates the steel balls, while the spinning friction rod imparts a second orthogonal rotational force, effectively addressing both ring light reflections and surface unfolding issues.
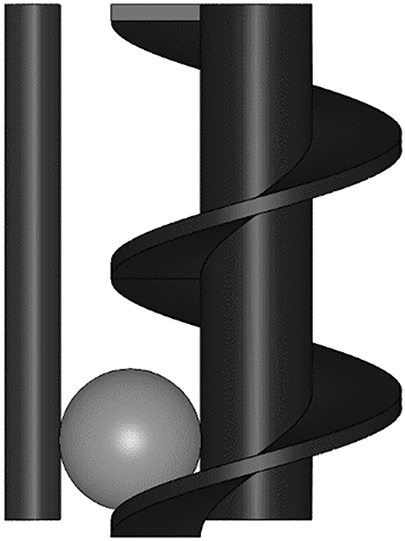
Figure 5: Front view of the vertical spherical unfolding inspection mechanism
3.3 Surface Unfolding Analysis
The image capture of the steel ball is shown in Fig. 6a, where a white ring-shaped reflection from the lighting source appears in the center, and the right edge is covered by a spiral track. Accordingly, the effective inspection area is confined to the portions without these regions. For calculation convenience, the inspection coverage is represented by the area between two concentric circles (marked in red), defining a single sampling zone (effective inspection area). Sampling means extracting the defined region from the captured image as inspection data, as indicated by the red area in Fig. 6b. Fig. 6c represents the projection plane of Fig. 6b, with further simplifications explained based on Fig. 6c. In Fig. 6c, d1 denotes the diameter of the steel ball, d2 represents the outer diameter of the effective inspection area’s concentric circles (marked in red), and d3 shows the diameter of the white ring-shaped reflection from the lighting source in Fig. 6a.

Figure 6: Camera-captured image and explanation of effective inspection area, d1: the diameter of the steel ball; d2: the outer diameter of the effective inspection area; d3: the diameter of the white ring-shaped reflection. (a) Schematic of camera capture; (b) Effective inspection area coverage diagram; (c) Projected view of effective inspection area on steel ball surface (CAD geometric model of (b))
After the first sampling of the steel ball, it rotates along the spinning friction rod on the left side in Fig. 5, moving to a second sampling position. The initial inspection area then rotates to the left, as illustrated in Fig. 7. In Fig. 7, the blue section represents the effective area for the first inspection, and the red section indicates the second inspection’s effective area. To cover the previously missed central region from the first inspection (inside the red concentric circle in Fig. 6b), it must be captured in the second inspection sampling. If the steel ball rotates too little, as shown in Fig. 7a, the overlapping central white reflection areas between the two inspections cause missed detection. If the steel ball rotates too much, as shown in Fig. 7b, the reflection areas fall outside each other’s effective inspection areas, leading to missed detection. Thus, it is essential to determine a proper rotation angle range for the steel ball and analyze the geometric relationship between the two inspection sampling. This relationship identifies whether missed detection occurs.
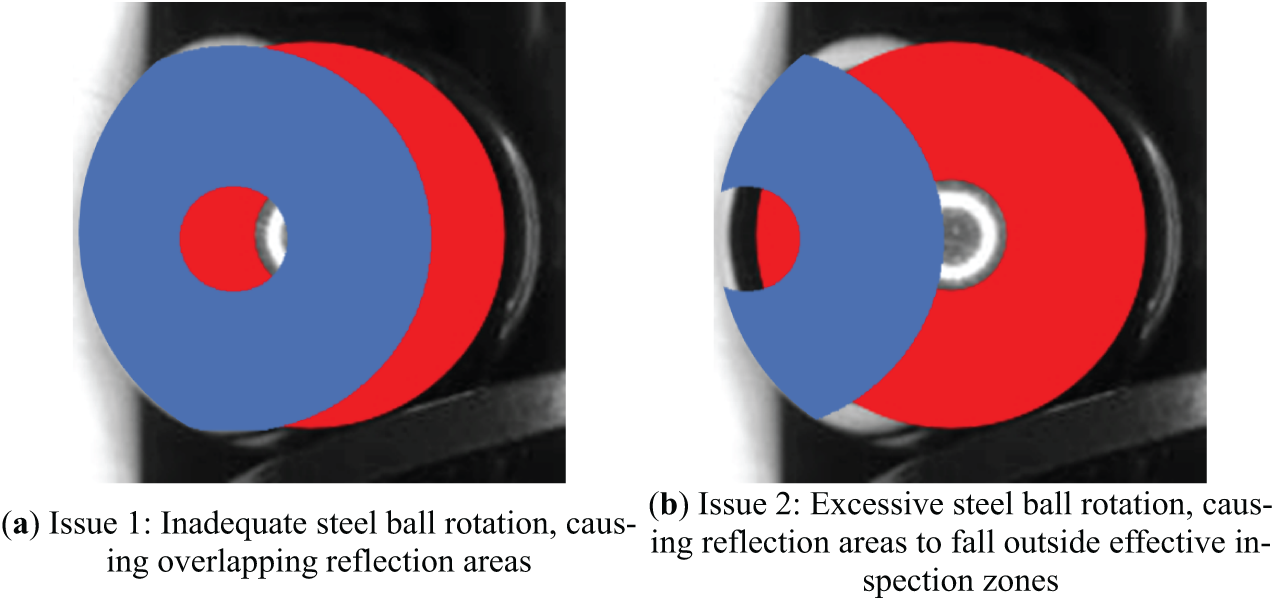
Figure 7: Illustration of missed detection issues, where the blue area represents the first inspection’s effective area, and the red area represents the second inspection’s effective area
Next, the rotational angle and inspection coverage of the steel ball will be examined from a top-down perspective. From the top view in Fig. 6a, the effective inspection area’s concentric circles appear as a region bounded by two chords, as shown in Fig. 8a. After completing the first sampling, the steel ball rotates via the spinning friction rod on the left side in Fig. 5 and proceeds to the second sampling. To avoid missed detections, as illustrated in Fig. 7, the white reflection area from the first inspection must be covered in the second sampling. This requires the steel ball’s rotation to fall between two critical states: (1) the boundaries of the reflection areas from both samplings perfectly overlap, as shown in Fig. 8b, or (2) the boundary of the reflection area in each sampling coincides with the outer boundary of the effective inspection zone, as shown in Fig. 8c. These two scenarios represent the critical conditions where the effective inspection area of the second sampling fully covers the missed white reflection area from the first inspection. By calculating the steel ball’s rotational angle range and the angular coverage of the sampling area as references for system adjustments, issues like those in Fig. 7 can be prevented.

Figure 8: Top view of steel ball inspection area, d1: the diameter of the steel ball; d2: the outer diameter of the effective inspection area; d3: the diameter of the white ring-shaped reflection
In this section’s calculations, the rotational angle required for the steel ball is determined as a reference for achieving the entire inspection of the ball’s surface. Additionally, the angular coverage of the two sampling ranges is calculated to verify whether the subsequent inspections can fully cover the entire sphere’s surface.
In the first case (Fig. 8b), labeled points and auxiliary lines (Fig. 9a) are added to illustrate key features, such as the circle center, endpoints of sampling ranges, and intersections of chords. Details of the labeled points are provided in the Fig. 9a caption.
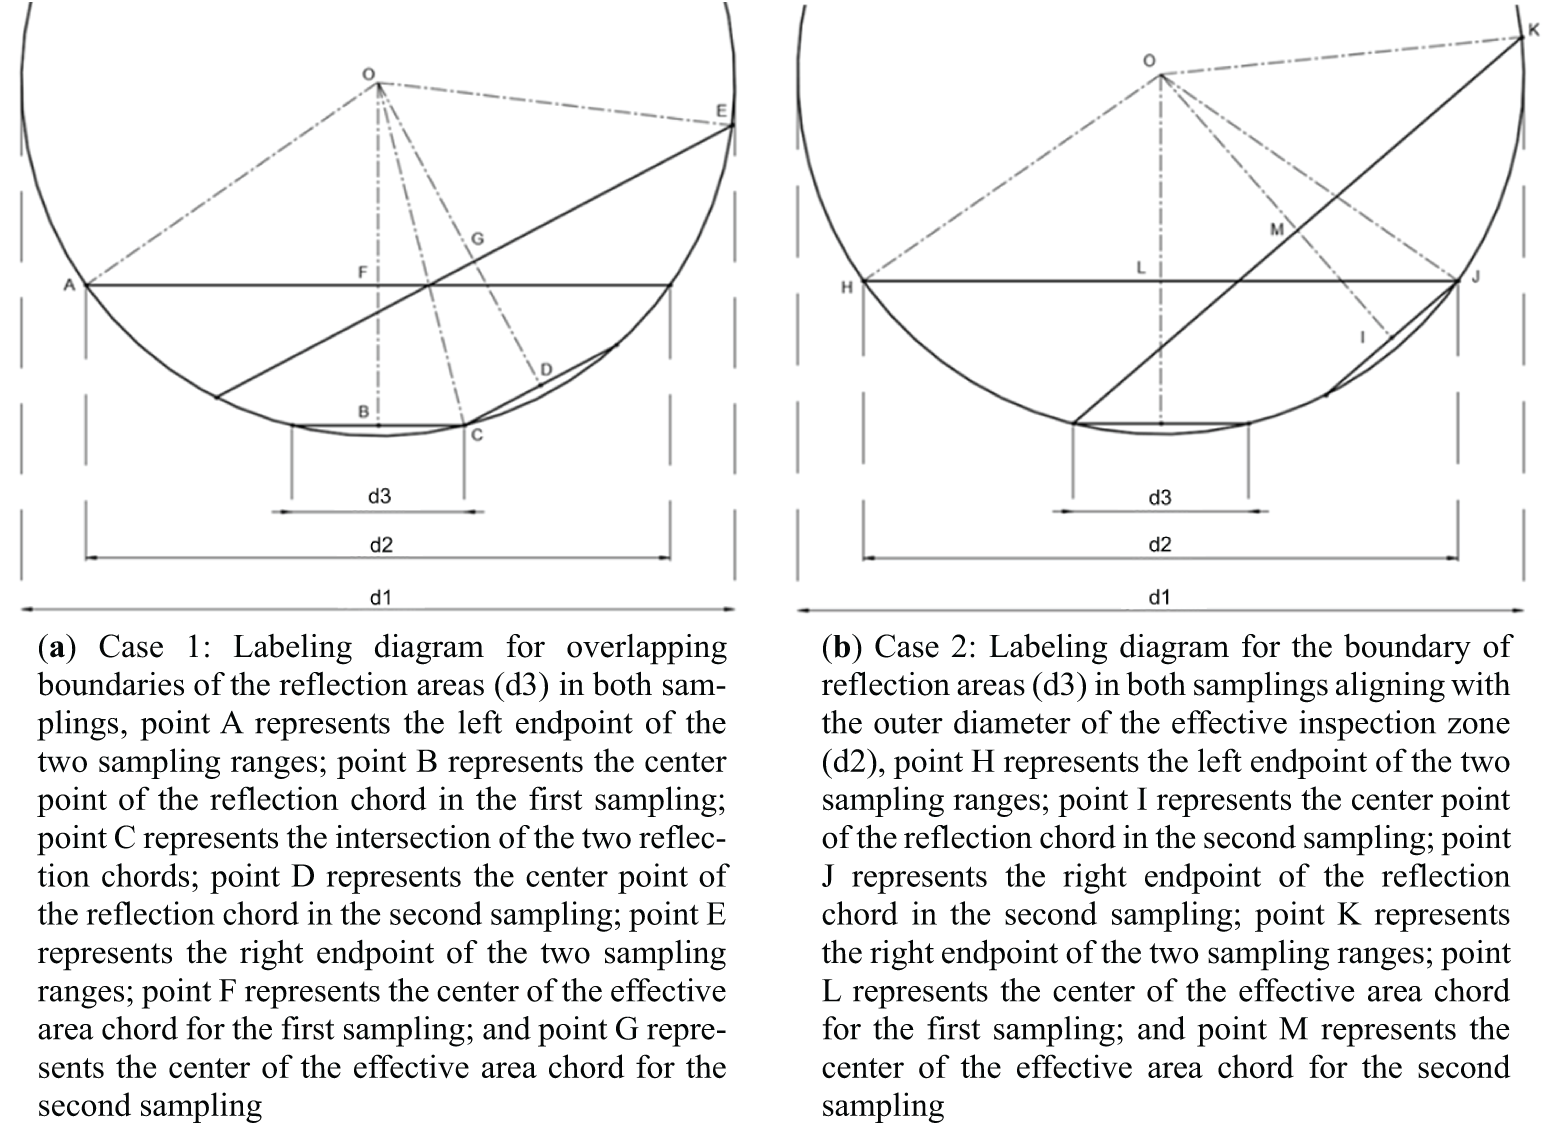
Figure 9: Labeling diagrams for the critical state in which the second inspection’s effective area covers the previously missed white reflective area from the first inspection, d1: the diameter of the steel ball; d2: the outer diameter of the effective inspection area; d3: the diameter of the white ring-shaped reflection; point O represents the circle center
In the second case (Fig. 8c), labeled points and auxiliary lines (Fig. 9b) are added to demonstrate critical aspects, including the circle center, sampling range endpoints, and reflection chord positions. Specific labeled points are explained in the Fig. 9b caption.
To maintain the geometric relationship shown in Fig. 9a,b, it is necessary to ensure that the angle between the reflective area center and the effective inspection area endpoints in each sampling is at least three times the angle between the reflective area center and the reflective chord endpoints in the same sampling. This requires that d1, d2, and d3 satisfy the following equation (Eq. (1)):
In Fig. 9a, angle BOD represents the rotation angle required for the steel ball in the first case, with the calculation process detailed in Proof 1. Angle AOE represents the angular coverage of the two sampling ranges in the first case, with the calculation process detailed in Proof 2.


In Fig. 9b, angle LOI represents the rotation angle required for the steel ball in the second case, with calculations shown in Proof 3. Meanwhile, angle HOK represents the angular coverage of the two sampling ranges in the second case, with the calculations outlined in Proof 4.


Next, this study refers to each two-sampling set as a sampling pair. Each pair is separated by an angle of α, and it is assumed that three pairs of samplings can cover the steel ball’s circle. To achieve an even sampling interval, the steel ball’s rotation angle should be 120°−α. The previously calculated result in Proof 4 needs to exceed 120°, which leads to the following relationship (Eq. (2)):
After three sampling pairs, the steel ball’s top view should resemble Fig. 10a. In this view, the central hexagonal white area represents the uninspected region, while the red portions are inspected regions. To ensure full coverage, the distance from the center to the vertices of the hexagon should be less than half of the outer diameter of the concentric circles (d2). In the simplified case, labeled points and auxiliary lines (Fig. 10b) highlight essential elements, such as the circle center, endpoints of the sampling range, and intersections of effective area chords. Further details are provided in the Fig. 10b caption. Essentially, in Fig. 10b, proving that line segment OQ is less than half of d2 demonstrates that the uninspected area (the region with white color in Fig. 10a) will be fully inspected. The calculation process, detailed in Proof 5, confirms that when
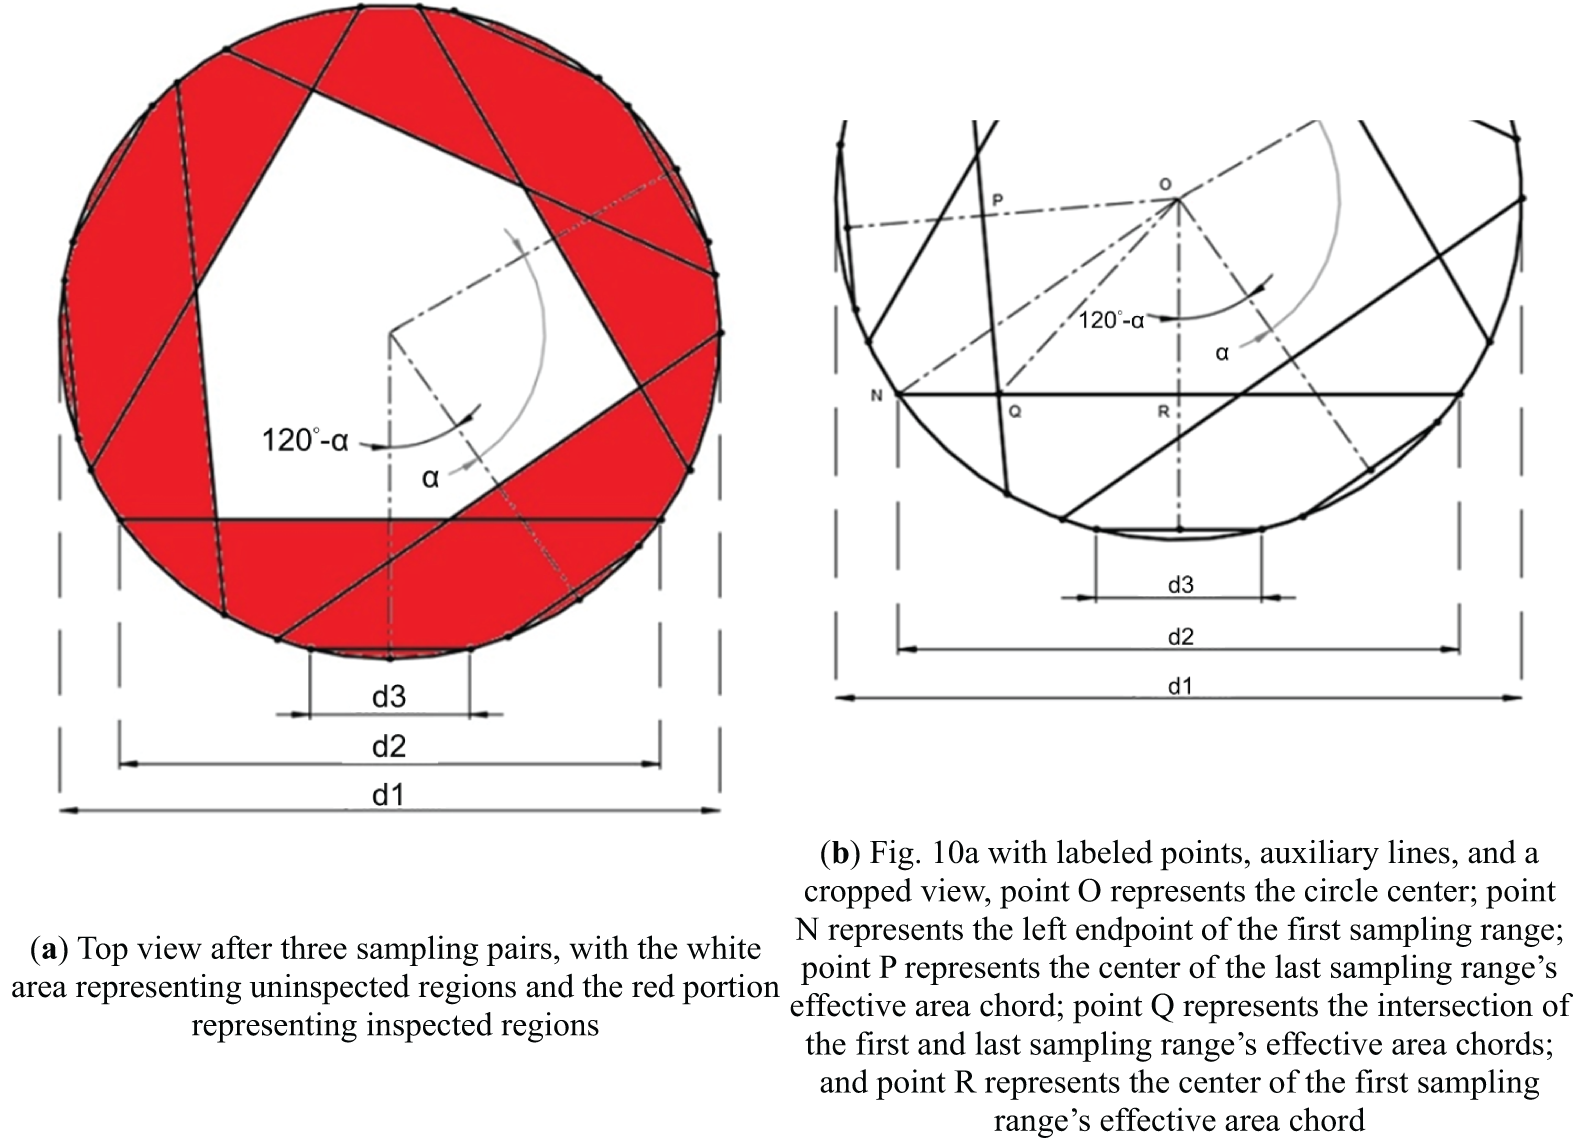
Figure 10: Top view representation and labeling diagram of effective inspection areas on the steel ball after three sampling pairs, d1: the diameter of the steel ball; d2: the outer diameter of the effective inspection area; d3: the diameter of the white ring-shaped reflection; α: the angle between sampling pairs

In this study, the steel ball’s diameter d3 is 12.70 mm, the outer diameter of the effective inspection area’s concentric circles (d2) is approximately 10.40 mm, and the diameter of the white reflective ring (d3) is about 3.07 mm. Therefore, the rotational angle range should be between 27.98° and 40.99°, and the angle between the endpoints of the two sampling ranges will be between 137.93° and 150.93°. Since 150.93° meets the condition of being greater than 120° required by Eq. (2), we proceed with a separation angle of α. Setting the rotation angle to 35° results in α = 85°, which satisfies the relationship
4 Dataset and Image Preprocessing
Due to resource limitations, only a limited number of samples were available, and the scratch defect was the sole target defect for detection in this study. Based on the research of Wang et al. [26], it is feasible to train a model with a single defect type and achieve generalization across other defect types. To align with the unfolding mechanism design proposed in this study, the dataset was entirely self-generated through captured images. An industrial camera, the Basler acA4600-10uc, was used, with specifications detailed in Fig. 11. Scratches were selected as the target defect for detection, and a total of 10 different scratched steel ball samples were collected. Part of them as shown in Fig. 12a–c. Each steel ball defect was captured in 50 images, yielding 500 defective (NG) images in total. Additionally, five defect-free steel balls were photographed, with 100 images taken per ball, resulting in 500 non-defective (OK) images.

Figure 11: Camera and related parameters

Figure 12: Images of three steel ball defect samples
The captured images were 1280 pixels × 1024 pixels in size, containing excessive background information and lacking the appropriate aspect ratio for neural network input, which typically requires a 1:1 ratio. Therefore, each image was cropped to a 1024 pixels × 1024 pixels square. To achieve this, the center of the steel ball had to be identified for precise cropping. Initially, the images were converted to grayscale (Fig. 13a), and the brightness histogram was examined (Fig. 13b). The brightest area in the center, representing the ring-shaped reflection, was distinguishable with a peak at the highest brightness level, 255. Thus, a threshold of 245 was set to perform binarization, as shown in Fig. 13c. The resulting binary image retained the reflective circle at the ball’s center, enabling rapid and accurate center positioning for cropping.
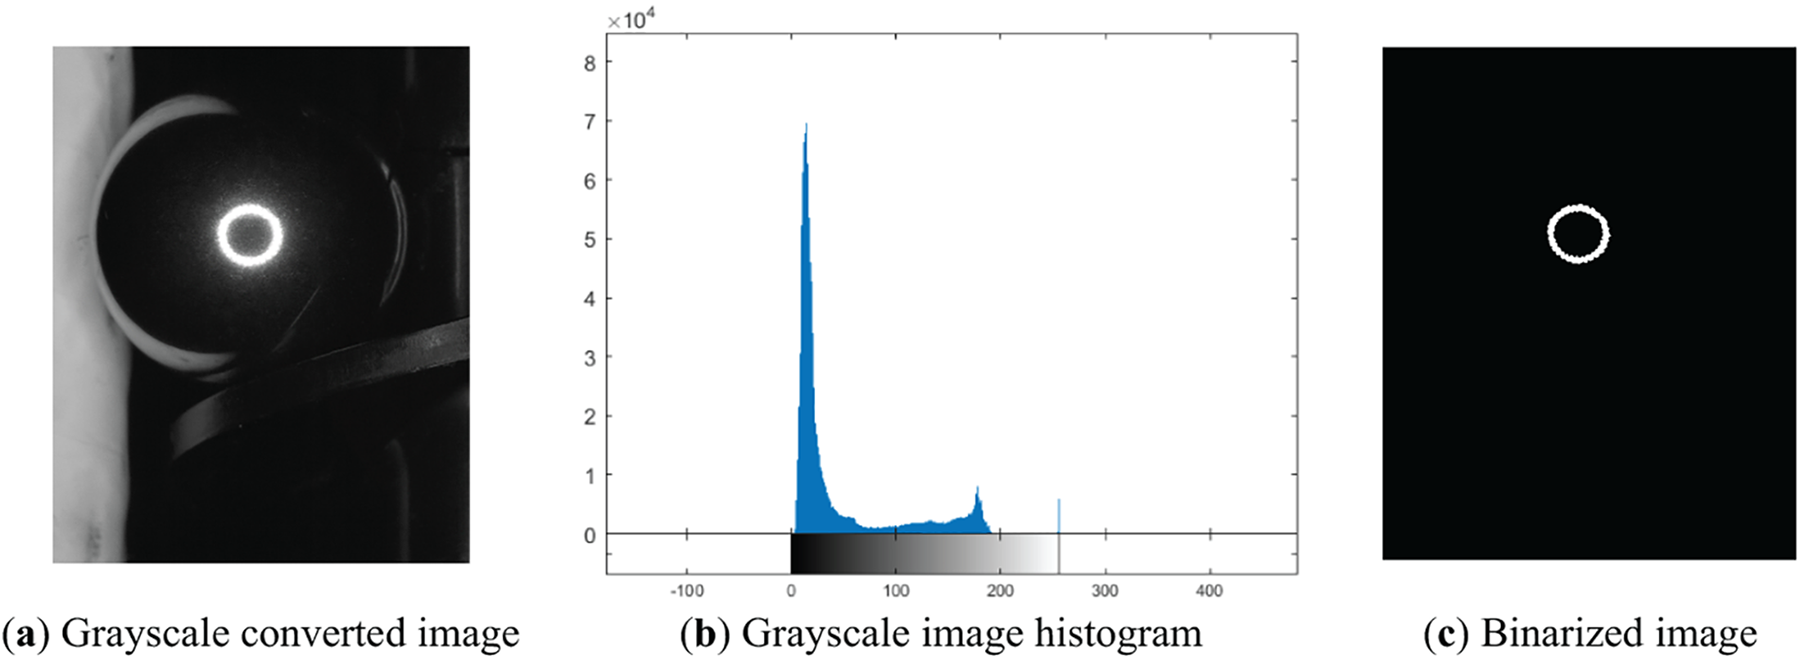
Figure 13: Figures relating to image preprocessing steps
Next, three image enhancement methods were applied: grayscale conversion, region of interest(ROI), and histogram equalization. Grayscale images possess distinct features compared to color images, and color information is not essential for detecting defects on steel balls, allowing grayscale conversion to reduce data processing demands and improve model computation and recognition speed. In addition to initially cropping images to a square shape, ROI-masked processing was imported as an image-masking step. Based on the coverage analysis of the surface unfolding mechanism in Section 3.3 and the previously identified center location, a mask was created to retain only the effective inspection area, minimizing interference from background noise on neural network recognition. Histogram equalization was applied after the masking process. Considering the presence of highly reflective regions and numerous black background areas in the original image, histogram equalization was only performed within the effective inspection area to enhance the brightness and details of the steel ball’s surface. These three preprocessing techniques resulted in six distinct image data types. Finally, to match the neural network’s input requirements, each image was resized to 224 pixels × 224 pixels, as shown in Fig. 14a–f. These six image types served as the dataset for neural network training.
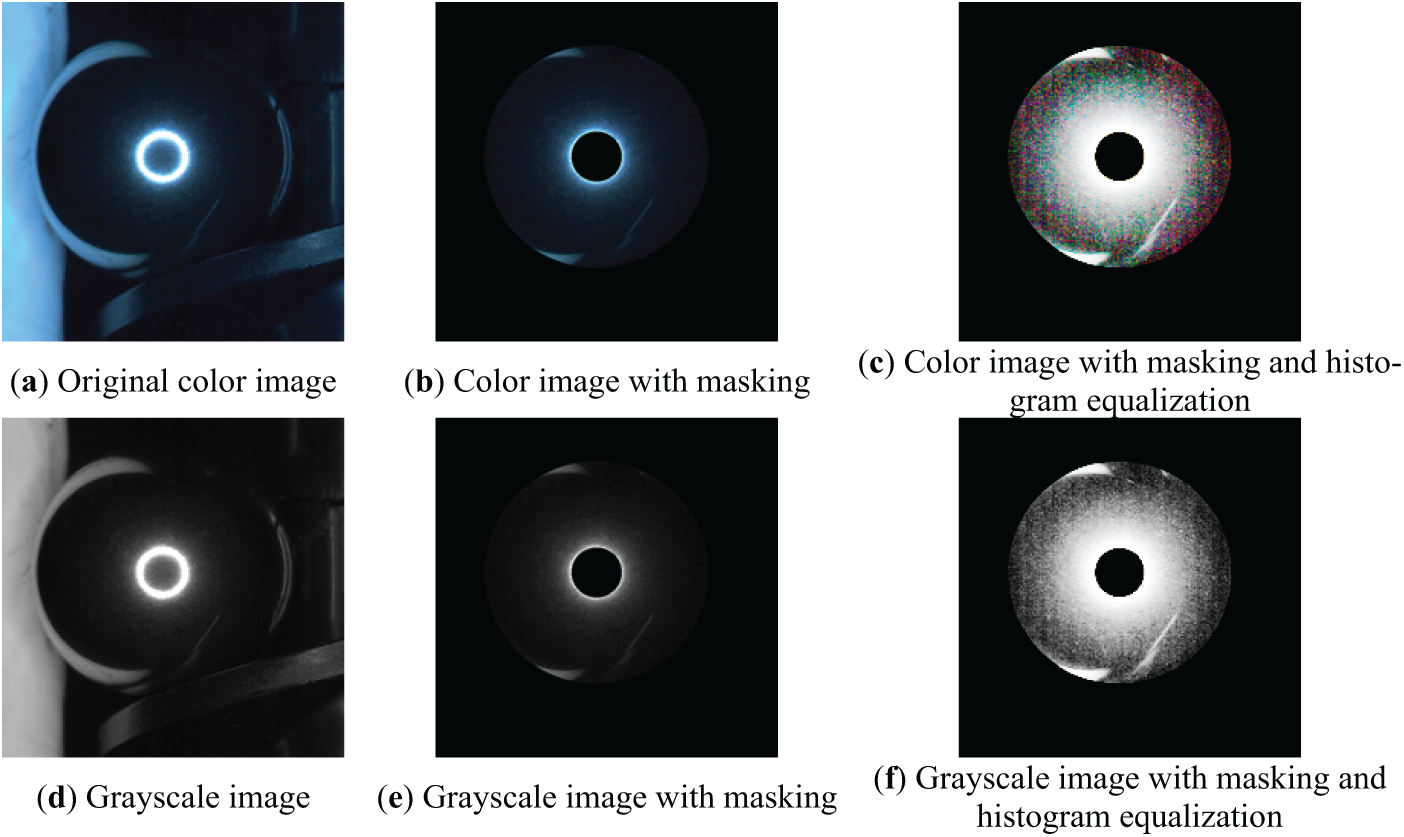
Figure 14: Six types of preprocessed image
4.3 Training Dataset Allocation
4.3.1 Six Types of Image Datasets
After image preprocessing, six types of image data were obtained, each containing 500 NG images and 500 OK images, consistent with the original dataset. To enhance randomness and improve the reliability of neural network training results, all data were shuffled to prevent overfitting. For fair comparison across the six data types, the same shuffling order was applied to all, meaning that the original cropped color images (Fig. 14a) were shuffled before applying the five other transformations. The dataset was divided into training, test, and validation sets, following a conventional 8:2 split for training and validation. Within the training set, 20% was further reserved for testing. Therefore, the training set and testing set contained 400 NG and 400 OK images, and the validation set contained 100 NG and 100 OK images. This allocation allowed exploration of the recognition effects of various preprocessed images.
To assess the generalization ability of the neural network model, further experiments were conducted on the two best-performing data types from previous training. This process validated initial results and tested the model’s recognition capacity for unseen data. The K value was set to 5, with steel ball samples as the splitting basis. Ten different NG samples were available, so each fold removed images of two NG samples for validation. For OK samples, five distinct samples were used, with one selected as the validation set for each fold. Due to sample independence, samples were consecutively selected, with shuffling applied to both extracted and retained sets to prevent overfitting. Similar to the previous dataset processing, shuffling was followed by image preprocessing, ensuring that only image types varied between datasets. This experiment evaluated whether the trained neural network model could recognize unseen scratch defects and tested its generalization ability for practical applications under limited data conditions.
5.1 Neural Network Architecture
In 2016, Redmon et al. [27] highlighted that VGG was an overly complex neural network, prompting them to introduce a new architecture, DarkNet19, which retains essential features of VGG while reducing computational load by approximately 80%. This improvement greatly enhances image recognition speed, making it more suitable for real-time image detection. Accordingly, this study adopts the DarkNet19 neural network as the architecture for defect recognition. Given that the input images are both color and grayscale, the network structure has minor modifications. Additionally, the final convolution and classification layers are adjusted to match the two-category classification requirement of this study, as shown in Table 1. Only three common hyperparameters are adjusted for this network: Batch Size, Epoch, and Learning Rate. These parameters are set based on standard values and the computational capacity of the experimental setup: Batch Size is set to 8, Epoch to 16, and Learning Rate to 0.001. The hardware specifications for this experiment include an Intel Core i7-9750H @ 2.60 GHz 6-core CPU, an NVIDIA GeForce GTX 1650 4 GB GPU, and 16 GB of RAM. The software environment consists of the Windows 11 operating system and MATLAB R2020a.

5.2 CNN Recognition Evaluation
5.2.1 Neural Network Model Evaluation Indicators
The evaluation indicators of the neural network’s recognition capabilities are typically based on the confusion matrix, as shown in Fig. 15. According to the prediction results and the actual image categories, there are four possible outcomes: True Positive (TP), False Positive (FP), False Negative (FN), and True Negative (TN). While these metrics clearly outline the model’s classification results, they lack a comprehensive evaluative perspective. Therefore, common indicators such as Accuracy, Precision, Recall, and F1-score are employed as evaluation criteria, with calculations provided in Eqs. (3)–(6). As seen in the equations, Accuracy represents the probability of correct model predictions, Precision indicates the probability of correct predictions when the model predicts a positive, Recall denotes the probability of correct predictions when the actual class is positive, and the F1-score is a comprehensive measure combining Precision and Recall.
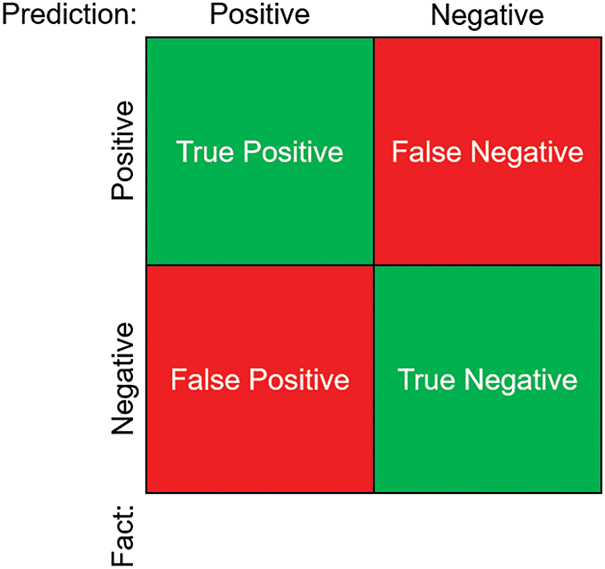
Figure 15: Confusion matrix illustration
5.2.2 Results of Experiments on Six Types of Image Datasets
Based on the previous settings, each of the 6 image data types underwent three rounds of CNN training. The results of these experiments were averaged, as shown in Table 2, where the aligned rgb, rgb_mask, and gray_mask_histeq with each corresponding image type were as shown in Fig. 14a–f. From this data, it is evident that models trained on the original color and grayscale images performed better in surface defect recognition. Although the masking process effectively removed unnecessary background noise, it also reduced some areas of the steel ball surface, which may have led to the loss of certain features or data. Additionally, while histogram equalization appeared to enhance brightness and details visually, it potentially eliminated certain features that the neural network needed for defect detection.

5.2.3 K-fold Cross-Validation Results
Since the models trained on the original color and grayscale image showed superior performance in the previous experiment, these two image-type datasets were selected for further validation. This experiment, given the variations in results, involved five rounds of model training for each of the five folds, meaning each image data type underwent 25 experiments. Table 3 displays the average results for each fold, showing slightly lower performance compared to the initial experiment. Retained test samples produced fluctuations of around 10%, yet the models overall still performed well, with most Accuracy and F1-score values reaching 0.85 or higher. As indicated by the total averages in Table 4, models trained on the grayscale images had a slightly lower accuracy, but performed significantly better in Precision, indicating a lower false positive rate.


Table 3’s rgb and gray labels are consistent with Table 2.
Table 4’s rgb and gray labels are consistent with Table 2.
This study developed a machine vision inspection system for detecting surface defects on steel balls, introducing an innovative surface unfolding mechanism with two major advantages: low cost and simplicity of design. The system demonstrated that 12 image captures provide complete surface inspection, resolving issues of intense reflections caused by using ring lighting sources. Paired with a lightweight convolutional neural network, this system effectively identified defect images. Using only 1000 images, it successfully trained a neural network model capable of reliable surface defect detection. Simple preprocessing techniques, such as grayscale conversion, ROI masking, and histogram equalization, enriched the data types and allowed exploration of their impact on model recognition performance. The study found that retaining as much information about the target as possible enhances model recognition, with both original grayscale and color images achieving 99.5% accuracy and F1-score. Additionally, K-fold cross-validation confirmed the superior generalization capability of the grayscale-images trainning model, which also reduced data size. Overall, this research presents an innovative, low-cost, and efficient machine vision inspection system for steel ball surface defects, providing an effective alternative to the traditional, labor-intensive, and subjective manual inspection methods.
Acknowledgement: The authors sincerely acknowledge Ming-Feng Yeh and Po-Yi Lu for their assistance in the research when they were NCHU’s undergraduate student, and also express their gratitude to Tan Kong Precision Technology Co., Ltd. for providing the research topic (NSTC 113-2218-E-005-007).
Funding Statement: The authors received no specific funding for this study.
Author Contributions: The authors confirm contribution to the paper as follows: Conceptualization, Yi-Ze Wu and Yi-Cheng Huang; formal analysis, Yi-Ze Wu; investigation, Yi-Ze Wu; methodology, Yi-Ze Wu and Yi-Cheng Huang; project administration, Yi-Cheng Huang; resources, Yi-Ze Wu; software, Yi-Ze Wu; supervision, Yi-Cheng Huang; writing—original draft preparation, Yi-Ze Wu; writing—review and editing, Yi-Cheng Huang. All authors reviewed the results and approved the final version of the manuscript.
Availability of Data and Materials: The defect images of the steel balls used in this study were created in a controlled laboratory environment for research purposes. Although these data were not directly provided by a commercial company, we were informed by the company that sharing similar defect images externally is restricted to protect potential proprietary interests. As a result, this image dataset cannot be made publicly available.
Ethics Approval: Not applicable.
Conflicts of Interest: The authors declare no conflicts of interest to report regarding the present study.
References
1. Zhang H, Zhang C, Wang C, Xie F. A survey of non-destructive techniques used for inspection of bearing steel balls. Measurement. 2020;159(15):107773. doi:10.1016/j.measurement.2020.107773. [Google Scholar] [CrossRef]
2. Ng TW. Optical inspection of ball bearing defects. Meas Sci Technol. 2007;18(9):N73–6. doi:10.1088/0957-0233/18/9/N01. [Google Scholar] [CrossRef]
3. Lin YZ, Liu XL, Han HY, Wang YW, Wang P. Detection and recognition of steel ball surface defect based on MATLAB. Key Eng Mater. 2009;416:603–8. doi:10.4028/www.scientific.net/KEM.416.603. [Google Scholar] [CrossRef]
4. Sun C, Liu JJ, Luo DL. Design of steel ball surface quality detection system based on machine vision. Manag Sci Stat Decis. 2010;7(1):59–62. doi:10.6704/JMSSD.2010.7.1.59. [Google Scholar] [CrossRef]
5. Chen YJ, Tsai JC, Hsu YC. Development of an automatic inspection system for surface defects of precision steel balls. In: Proceedings of the 14th IFToMM World Congress; 2015 Oct 25–30; Taipei, Taiwan. p. 448–51. doi:10.6567/IFToMM.14TH.WC.PS13.018. [Google Scholar] [CrossRef]
6. Chen YJ, Tsai JC, Hsu YC. A real-time surface inspection system for precision steel balls based on machine vision. Meas Sci Technol. 2016;27(7):074010. doi:10.1088/0957-0233/27/7/074010. [Google Scholar] [CrossRef]
7. Dong C, Zhu W, Wei J, Zhou H, Chen F. Research on steel ball surface defect detection device based on machine vision. J Phys: Conf Ser. 2021;2029:012127. doi: 10.1088/1742-6596/2029/1/012127. [Google Scholar] [CrossRef]
8. Zhang H, Zhong M, Xie F, Cao M. Application of a saddle-type eddy current sensor in steel ball surface-defect inspection. Sensors. 2017;17(12):2814. doi:10.3390/s17122814. [Google Scholar] [PubMed] [CrossRef]
9. Zhang H, Xie F, Cao M, Zhong M. A steel ball surface quality inspection method based on a circumferential eddy current array sensor. Sensors. 2017;17(7):1536. doi:10.3390/s17071536. [Google Scholar] [PubMed] [CrossRef]
10. Zhang H, Ma L, Xie F. A method of steel ball surface quality inspection based on flexible arrayed eddy current sensor. Measurement. 2019;144:192–202. doi:10.1016/j.measurement.2019.05.056. [Google Scholar] [CrossRef]
11. Li G, Zhou S, Ma L, Wang Y. Research on dual wavelength coaxial optical fiber sensor for detecting steel ball surface defects. Measurement. 2019;133:310–9. doi:10.1016/j.measurement.2018.10.026. [Google Scholar] [CrossRef]
12. Kakimoto A. Detection of surface defects on steel ball bearings in production process using a capacitive sensor. Measurement. 1996;17(1):51–7. doi:10.1016/0263-2241(96)00007-3. [Google Scholar] [CrossRef]
13. Li L, Wang Z, Pei F, Wang X. Improved illumination for vision-based defect inspection of highly reflective metal surface. Chin Opt Lett. 2013;11(2):021102. doi:10.3788/COL. [Google Scholar] [CrossRef]
14. Do Y, Lee S, Kim Y. Vision-based surface defect inspection of metal balls. Meas Sci Technol. 2011;22(10):107001. doi:10.1088/0957-0233/22/10/107001. [Google Scholar] [CrossRef]
15. Gonzalez RC, Woods RE. Digital image processing. 4th ed. Upper Saddle River, NJ, USA: Financial Times Press; 2018. [Google Scholar]
16. Petrushan M, Vermenko Y, Shaposhnikov D, Anishchenko S. Comparative analysis of color-and grayscale-based feature descriptions for image recognition. Pattern Recognit Image Anal. 2013;23(3):415–8. doi:10.1134/S1054661813030115. [Google Scholar] [CrossRef]
17. Lim WH, Isa NAM. Color to grayscale conversion based on neighborhood pixels effect approach for digital image. In: ELECO, 2011 7th International Conference on Electrical and Electronics Engineering; 2011 Dec 1–4; Bursa, Turkey. p. 157–61. [Google Scholar]
18. Patel O, Maravi YPS, Sharma S. A comparative study of histogram equalization-based image enhancement techniques for brightness preservation and contrast enhancement. Signal Image Process Int J. 2013;4(5):11–25. doi:10.5121/sipij.2013.4502. [Google Scholar] [CrossRef]
19. Huynh-The T, Le BV, Lee S, Le-Tien T, Yoon Y. Using weighted dynamic range for histogram equalization to improve the image contrast. EURASIP J Image Video Process. 2014;2014(44). doi:10.1186/1687-5281-2014-44. [Google Scholar] [CrossRef]
20. Somal S. Image enhancement using local and global histogram equalization technique and their comparison. In: First International Conference on Sustainable Technologies for Computational Intelligence; 2019 Mar 29–30; Jaipur, India. p. 739–53. doi:10.1007/978-981-15-0029-9_58. [Google Scholar] [CrossRef]
21. Alghassab MA. Defect detection in printed circuit boards with pre-trained feature extraction methodology with convolution neural networks. Comput Mater Contin. 2021;70(1):637–52. doi:10.32604/cmc.2022.019527. [Google Scholar] [CrossRef]
22. Liu B, Chen D, Qi X. YOLO-pdd: a novel multi-scale PCB defect detection method using deep representations with sequential images. arXiv:2407.15427. 2024. [Google Scholar]
23. Huang YC, Hung KC, Liu CC, Chuang TH, Chiou SJ. Customized convolutional neural networks technology for machined product inspection. Appl Sci. 2022;12(6):3014. doi:10.3390/app12063014. [Google Scholar] [CrossRef]
24. Prabhakaran S, Uthra RA, Preetharoselyn J. Feature extraction and classification of photovoltaic panels based on convolutional neural network. Comput Mater Contin. 2022;74(1):1437–55. doi:10.32604/cmc.2023.032300. [Google Scholar] [CrossRef]
25. Simonyan K, Zisserman A. Very deep convolutional networks for large-scale image recognition. arXiv:149.1556. 2015. [Google Scholar]
26. Wang Z, Xuan J, Shi T. An autonomous recognition framework based on reinforced adversarial open set algorithm for compound fault of mechanical equipment. Mech Syst Signal Process. 2024;219:111596. doi:10.1016/j.ymssp.2024.111596. [Google Scholar] [CrossRef]
27. Redmon J, Farhadi A, YOLO9000: better, faster, stronger. arXiv:1612.08242. 2016. [Google Scholar]
Cite This Article
 Copyright © 2025 The Author(s). Published by Tech Science Press.
This work is licensed under a Creative Commons Attribution 4.0 International License , which permits unrestricted use, distribution, and reproduction in any medium, provided the original work is properly cited.


 Submit a Paper
 Propose a Special lssue
 View Full Text
 Download PDF
 Downloads
 Citation Tools