 Open Access
ARTICLE
Fuzzy Decision-Based Clustering for Efficient Data Aggregation in Mobile UWSNs
1 Department of Computer Science and Engineering, Lovely Professional University, Jalandhar, 144402, Punjab, India
2 Department of Computer Science and Engineering, Chandigarh University, Mohali, 140413, Punjab, India
3 Salesforce Inc., Dallas, TX 75201, USA
4 Department of Computer Science and Engineering, School of Engineering and Technology, Central University of Haryana, Mahendragarh, 123031, Haryana, India
5 Department of Management Information Systems, College of Business Administration, King Faisal University, Al-Ahsa, 31982, Saudi Arabia
6 Department of Computer Application, Sir Chhotu Ram Institute of Engineering and Technology, Ch. Charan Singh University, Meerut, 250001, Uttar Pradesh, India
7 Chitkara University Institute of Engineering and Technology, Chitkara University, Rajpura, 140401, Punjab, India
* Corresponding Author: Nitin Goyal. Email:
Computers, Materials & Continua 2025, 83(1), 259-279. https://doi.org/10.32604/cmc.2025.062608
Received 23 December 2024; Accepted 19 February 2025; Issue published 26 March 2025
Abstract
Underwater wireless sensor networks (UWSNs) rely on data aggregation to streamline routing operations by merging information at intermediate nodes before transmitting it to the sink. However, many existing data aggregation techniques are designed exclusively for static networks and fail to reflect the dynamic nature of underwater environments. Additionally, conventional multi-hop data gathering techniques often lead to energy depletion problems near the sink, commonly known as the energy hole issue. Moreover, cluster-based aggregation methods face significant challenges such as cluster head (CH) failures and collisions within clusters that degrade overall network performance. To address these limitations, this paper introduces an innovative framework, the Cluster-based Data Aggregation using Fuzzy Decision Model (CDAFDM), tailored for mobile UWSNs. The proposed method has four main phases: clustering, CH selection, data aggregation, and re-clustering. During CH selection, a fuzzy decision model is utilized to ensure efficient cluster head selection based on parameters such as residual energy, distance to the sink, and data delivery likelihood, enhancing network stability and energy efficiency. In the aggregation phase, CHs transmit a single, consolidated set of non-redundant data to the base station (BS), thereby reducing data duplication and saving energy. To adapt to the changing network topology, the re-clustering phase periodically updates cluster formations and reselects CHs. Simulation results show that CDAFDM outperforms current protocols such as CAPTAIN (Collection Algorithm for underwater oPTical-AcoustIc sensor Networks), EDDG (Event-Driven Data Gathering), and DCBMEC (Data Collection Based on Mobile Edge Computing) with a packet delivery ratio increase of up to 4%, an energy consumption reduction of 18%, and a data collection latency reduction of 52%. These findings highlight the framework’s potential for reliable and energy-efficient data aggregation mobile UWSNs.Keywords
UWSNs have a crucial role in offshore exploration in various applications of monitoring and surveillance. In terms of aural signal communication, the price of affluent sensors, larger storage space to store as much data as possible, extreme power for communication, and dense sensor distribution, UWSN contrasts with common sensor networks on the ground. UWSNs have both static and mobile nodes that communicate via an acoustic channel [1]. UWSN is used in a spectrum of uses involving the underwater environment, such as pollution monitoring, especially chemical waste, underwater plant life, and wildlife populations, examining the health of rare ocean beings, mining investigation, disaster avoidance, supporting tracking, nutrient yield, fuel leak detection, and scattered strategic oversight are some of the concerns that need to be acknowledged, and seafloor data collection, monitoring, and military surveillance in the water [2]. Sensor nodes are used to accumulate data and transmit it to a sink through a network [3].
UWSNs are used for a wide scope of utilizations, for example, observing the marine climate for logical exploration to business abuse and coastline assurance to submerged contamination checking, from water-based fiasco counteractions to water-based games help. UWSN offers a promising answer for truly requesting applications [4]. Nonetheless, UWSN applications are energizing yet testing at a very similar time. The explanation lies in eccentric states of water climate which makes genuine imperatives in the plan and arrangement of such organizations. UWSN-implemented models are being used for direct observation purposes in a variety of aquatic environments for Instance Rivers, lakes, and ponds [5].
However, in the case of oceans, seas, and other large bodies of water, these implemented models may not provide accurate data because they cover a larger area and there are several factors to consider, including the region that will be impacted, the depth of water, and pressure, all of that should be investigated in real-time. Furthermore, Radio Frequency (RF) is not suitable for UWSN communication as RF is conductive. Due to its conductive nature RF waves are highly attenuated in water. Thus, the acoustic signal is used for UWSN’s communication but it has limited bandwidth and slow speed. So, underwater network suffers from latency [6].
In order to get over the condition, a data aggregation approach is used in addition to routing models where larger data is acquired and integrated at a node before to sinking of its transmission. The beneficial and efficient data buildup in the network has shortened information severance thus avoiding energy depletion, as well as securing data transmission with minimal delay, according to the result [7]. Data is aggregated from the deployed sensor, and the sensor near the surface sinks has a load in comparison to other nodes as they are continuously transmitting the data that requires high energy. As a result, more energy wastage has been seen normally on these nodes, Autonomous Underwater Vehicle (AUV) helps to reduce the transmission load in better power uses [8,9].
On the other hand, the achievement of a large amount of data faces tasks in designing data-collecting approaches. Besides, harsh underwater settings, comprising the low flow of information rates, the specified navigation rules and information collection protocols developed for land-based purposes are not suitable for UWSNs due to telecast delay and complexity of node recharging. As a consequence, planning an effective data collection method for UWSNs is critical [10,11]. The majority of data collection systems presume that sensor nodes are constant. Only a small number of studies have tried to remove data duplication during data collection. Multi-hop data gathering methods cause an energy hole at the sink. In most of the cluster-based data gathering schemes, the failure rate of CHs and Intra-cluster collision are not resolved. A cluster-based data aggregation is proposed in this scheme using a fuzzy decision model for mobile UWSN. The novelty of our proposed technique lies in its integration of fuzzy logic for CH selection and re-clustering, enabling real-time adaptation to dynamic network topology in underwater environments that ensures minimal energy consumption, lower packet loss, and enhanced data transmission reliability—capabilities not adequately addressed by existing protocols. Furthermore, the main contributions of this scheme are listed below:
i) Fuzzy Logic-based CH Selection: A novel fuzzy logic mechanism selects optimal cluster heads by considering factors like residual energy, distance, delivery probability, and coverage ratio, which minimizes energy use and improves network stability.
ii) Packet Delivery Reliability: The framework uses path loss and SINR (Signal to Interference plus Noise Ratio) metrics to assess Packet Delivery Probability (PDP), ensuring robust and reliable data transmission while preventing CH failures.
iii) Adaptive Re-Clustering: In order to maintain network performance in mobile scenarios, a dynamic re-clustering process is activated when the coverage ratio or distance between the CH and the sink is beyond a certain threshold.
iv) Data Redundancy Mitigation: A similarity function identifies and removes redundant data at the cluster head, reducing unnecessary transmissions and optimizing network efficiency.
Researchers are now interested in Underwater Wireless Sensor Networks (UWSNs) as a novel field for the purpose of research. Data aggregation is the most prominent area of research because it is the backbone for fast and energy-efficient data transmission, collected from sensors towards the data collection point.
Considering sensor nodes with limited power, segmented networks with purely information gathering points at a range, and sporadic observing applications with interruption patience [6], a Mobile Sink (MS)-based data collection method would possibly prolong the life span of the network postponement is accomplished by justifying sink neighborhood problem as well as postponing data communication until the MS is basically in advantageous information transmission position. Apart from terrestrial WSN approaches, they account for the MS’s non-zero transmit time among data gathering points, improving the model’s accuracy for UWSNs, each related and isolated. But this is not mentioned how the sojourn locations for MS to visit are chosen. They have taken into consideration the routes that are aided by the mobility method for allowing sparse UWSNs to connect and improving their energy efficiency, contemplating It is referred to as a Delay/Disruption Tolerant Network (DTN) or an Intermittently Connected Network (ICN). They investigated the act of data collection using analytical models. At the cost of higher message latency, the DTN scheme enhances energy utilization and Packet Transmission Ratio (PTR), depending on the outcome. The impact of using a range of mobile aspects for information collection and exercise priority polling is studied. However, it is not made clear how the sojourn places for MS to visit are decided [9].
Wang et al. [10] have proposed the clustering of high-energy nodes as a top-priority procedure, where there would be a cluster head designated depending on the enduring geometry distance among sensor nodes and their energy. Additionally, to progress the ability of data aggregation, they deployed the Ant Colony Optimization (ACO) method for finding the briefest path for AUV. Major disadvantages are (i) CH selection merely takes only the enduring strength of the nodes, disregarding the delay of data collection, the failure rate, and the load (ii) It utilizes ACO to find the quickest way tour plan which is a stale optimization method. Blanc et al. [12] have exposed dissimilar models to make this sort of change, combining by way of replication in NS-3. Furthermore, since energy conservation is critical to information collection through submersible vehicles, at which nodes could operate for lengthy periods instead of being connected, this article focuses on multi-hop configurations. Whenever a vehicle shows up in three dimensions, it is anticipated to collect even more data as is conceivable in the shortest length of time. Vehicle presence is the point at which the procedure for collecting begins, not through nodes in the close surroundings, and yet from each node in the three-dimensional volume. However, as it utilizes a multi-hop data collection route, its outcome in the area of the sink, there is an energy gap.
Júnior et al. [13] suggested Collection Algorithm for underwater oPTical-AcoustIc sensor Networks (CAPTAIN), a procedure to do data gathering with information accumulation in Underwater Optical Acoustic Sensor Networks (UOASNs). CAPTAIN splits the network into sections, envelops a packet forwarding tree, and sends all of the data to the sink node using data gathering. By using fewer acoustic emissions in clustered networks, the sink node of CAPTAIN might attain reduced latencies and elevated data collection rates per hour. But the CHs are chosen depending on the energy levels only leaving the depth level or distance to the sink. Furthermore, it may outcome in intra-cluster data collisions, at the time of aggregation. Mortada et al. [14] have suggested an energy-productive data variation method on the premise of clustering design. The goal would be to recognize and investigate data similarity in those sensor and CH phases. Rather than sending raw data, so every sensor transmits a group of descriptive notes to the CH every time frame during the initial phase. When the CH obtains data points, before transmitting data to the sink, it uses Euclidean distance to segregate necessary data collected by the sink node in close proximity. To authenticate their method, they used their methods based on real data from underwater sensors they associated with each other prevailing data compression approaches. Although it removes data redundancy, it didn’t take into account the CH failures and energy drain issues.
Huang et al. [15] have suggested a decision-making data-gathering method, considering the high likeness of the collected data and indeed the depletion of the highest accuracy data quantization. The energy depletion of the networks is competently supplemented by this decision-making method. The choice-creating method provides an energy-productive method for sensor nodes that minimizes energy depletion in a variety of network situations, by accessing data redundancy, network communication reputation, and uploading energy depletion. However, it considers all the sensor nodes to be constant. Akbar et al. [16] presented Mobile Sink (MS) as well as Courier Nodes (CNs) to reduce node energy depletion. MS and CNs come to a complete stop for data collection, after which the CNs send the data to the MS for further transmission. The complete energy depletion of nodes is reduced due to the flexibility of CNs and MS. But it considers sensor nodes as constant. Table 1 summarizes the key points of the literature review.

Cai et al. [17] presented a data-gathering method for mobile edge components underwater based on a mobility pattern. This model completely considers motility orientation and acceleration, and they are very comparable to the vigor features of AUVs in a stable 3D environment. An evaluation and selection algorithm is developed to evaluate the mobility route of data gathering for AUVs using the coding, storage, and mobility functionality of AUVs. Analytical and empirical findings reveal that the suggested strategy improves information-gathering accuracy, lowers node energy usage, and enhances network life. The effectual edge processing and actual simulation environment of AUV in the underwater environment are not adequately considered.
Furthermore, Table 1 has a comparative analysis of these schemes.
From the observation of Table 1, it has been carried out that an approach for data aggregation is still needed that improves the collection delay, packet loss, and energy consumption and should also have a better delivery ratio.
3 Cluster-Based Data Aggregation Using Fuzzy Decision Model (CDAFDM) Methodology
This method aims to reduce the time it takes to collect data, the packet drop, the delivery ratio, as well as energy consumption. Furthermore, when new data is received, the two vectors are analyzed using a similarity function to mitigate the redundant data. If two sets of data are similar, the CH sends only one set of non-duplicate data to the BS. To fulfill these requirements a cluster-based data aggregation for mobile UWSN using fuzzy logic is proposed.
A cluster-based data aggregation scheme using a fuzzy decision model for mobile UWSN, comprising four key stages: clustering, CH selection, data aggregation, and re-clustering. In the clustering stage, the network is divided into clusters based on node proximity to optimize communication. During the CH selection stage, crucial parameters such as energy consumption, node location, and distance to the BS are considered. The selection process employs a Fuzzy Logic Decision (FLD) model, incorporating factors like residual energy, shortest distance to BS, delivery probability, and coverage ratio to ensure efficient CH selection. In the data aggregation stage, CHs collect and store sensor data as structured vectors. Upon receiving new data, a similarity function is applied to identify redundancies, ensuring that unique and relevant data is transmitted to the BS.
To maintain network stability, the re-clustering stage is initiated when a CH’s performance metrics, such as distance to the BS or coverage ratio, exceed a predefined threshold. As illustrated in Fig. 1, sensor nodes forward their data to CH, which then transmits the aggregated information. AUVs further assist in data collection by gathering information from CHs and forwarding it to the sink or BS. Additionally, CHs can directly relay the aggregated data to the sink when feasible, reducing transmission delays and enhancing network efficiency.
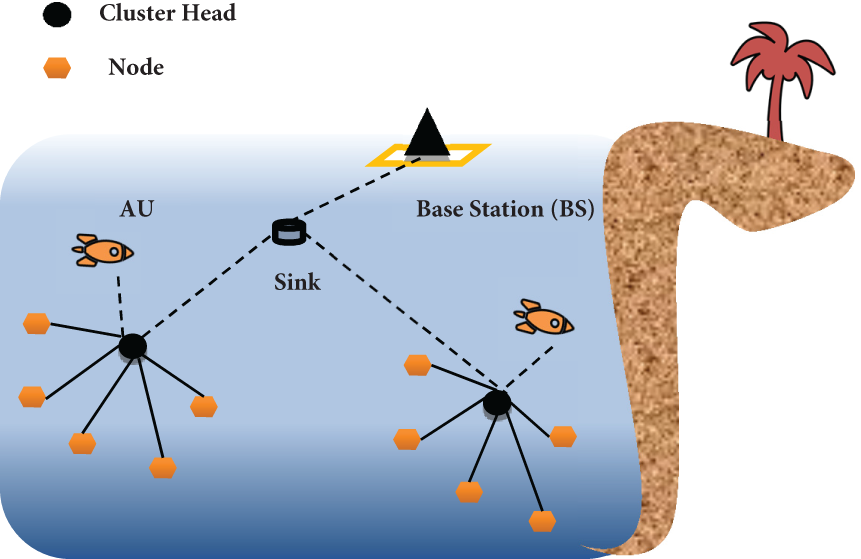
Figure 1: Proposed data aggregation method in mobile UWSN
Clustering is employed in the proposed CDAFDM framework to effectively group sensor nodes and control data transmission while preserving energy. The network is separated into several clusters once each node initially learns about its neighbors by exchanging control messages. Choosing the right CHs is essential to maximizing network performance. Three important criteria are used to pick CHs: packet delivery probability, distance to the BS, and residual energy. This ensures a selection procedure that is both dependable and energy-efficient. Nodes are more likely to become CHs if they have more available energy, are closer to the base station, and have a higher possibility of transmitting data successfully. Following the selection of CHs, sensor nodes pair up with the best CH based on connection and signal strength. The CHs then oversee cluster communication, compile gathered data, and send it directly or via intermediary relay nodes to the BS. This clustering technique increases network stability, decreases redundant transmissions, and extends sensor node operating lifetime. The subsequent sections provide a detailed discussion of the selection criteria, including residual energy, packet delivery probability, and distance to the base station.
i. Residual Energy
An overall energy expended by the sender for transferring q bit of data over finite distance d is expressed below [18]:
where,
Eq. (3) gives the total power consumption by the receiver.
Eq. (4) calculates the residual energy of each node after each communication [19].
where,
ii. Estimation of Packet Delivery Probability (PDP)
In this section, the delivery of packets
where,
In the case of spherical spreading,
The average SINR over distance
where,
Binary Phase Shift Keying (BPSK) is considered here, commonly used in the UWSNs. Each word in BPSK typically contains a bit. As a result, the probability of a bit mistake over distance can be expressed as follows:
As a result, for each pair of nodes separated by a distance, the delivery probability (
iii. Distance from BS
Every node determines the distance towards BS depending on the Received Signals Strength (RSS). Friis Equation is used to calculate RSS [20].
where,
Hence, the distance is evaluated by Eq. (11):
where,
3.3 CH Selection Based on Fuzzy Logic
FLD model is used to select CHs, fuzzy membership functions take the parameters residual energy, distance to BS, and delivery probability as inputs, and the probability for choosing CH is calculated using fuzzy rules. The following are the processes for determining fuzzy rule-based interference.
• Fuzzification: This entails extracting better product quality from the input data chosen and evaluating the degree corresponding to inputs of each appropriate fuzzy set.
• Rule Evaluation: The collected fuzzy inputs compared with fuzzy rules forebears. Thereafter implement to the membership function consequently.
• Aggregation of the rule outputs: It entails combining the results of entire rules.
• Defuzzification: The collected output fuzzy set merged output is utilized as the input for the defuzzification process, and the result is a single integer.
The rule base is shown in Fig. 2.
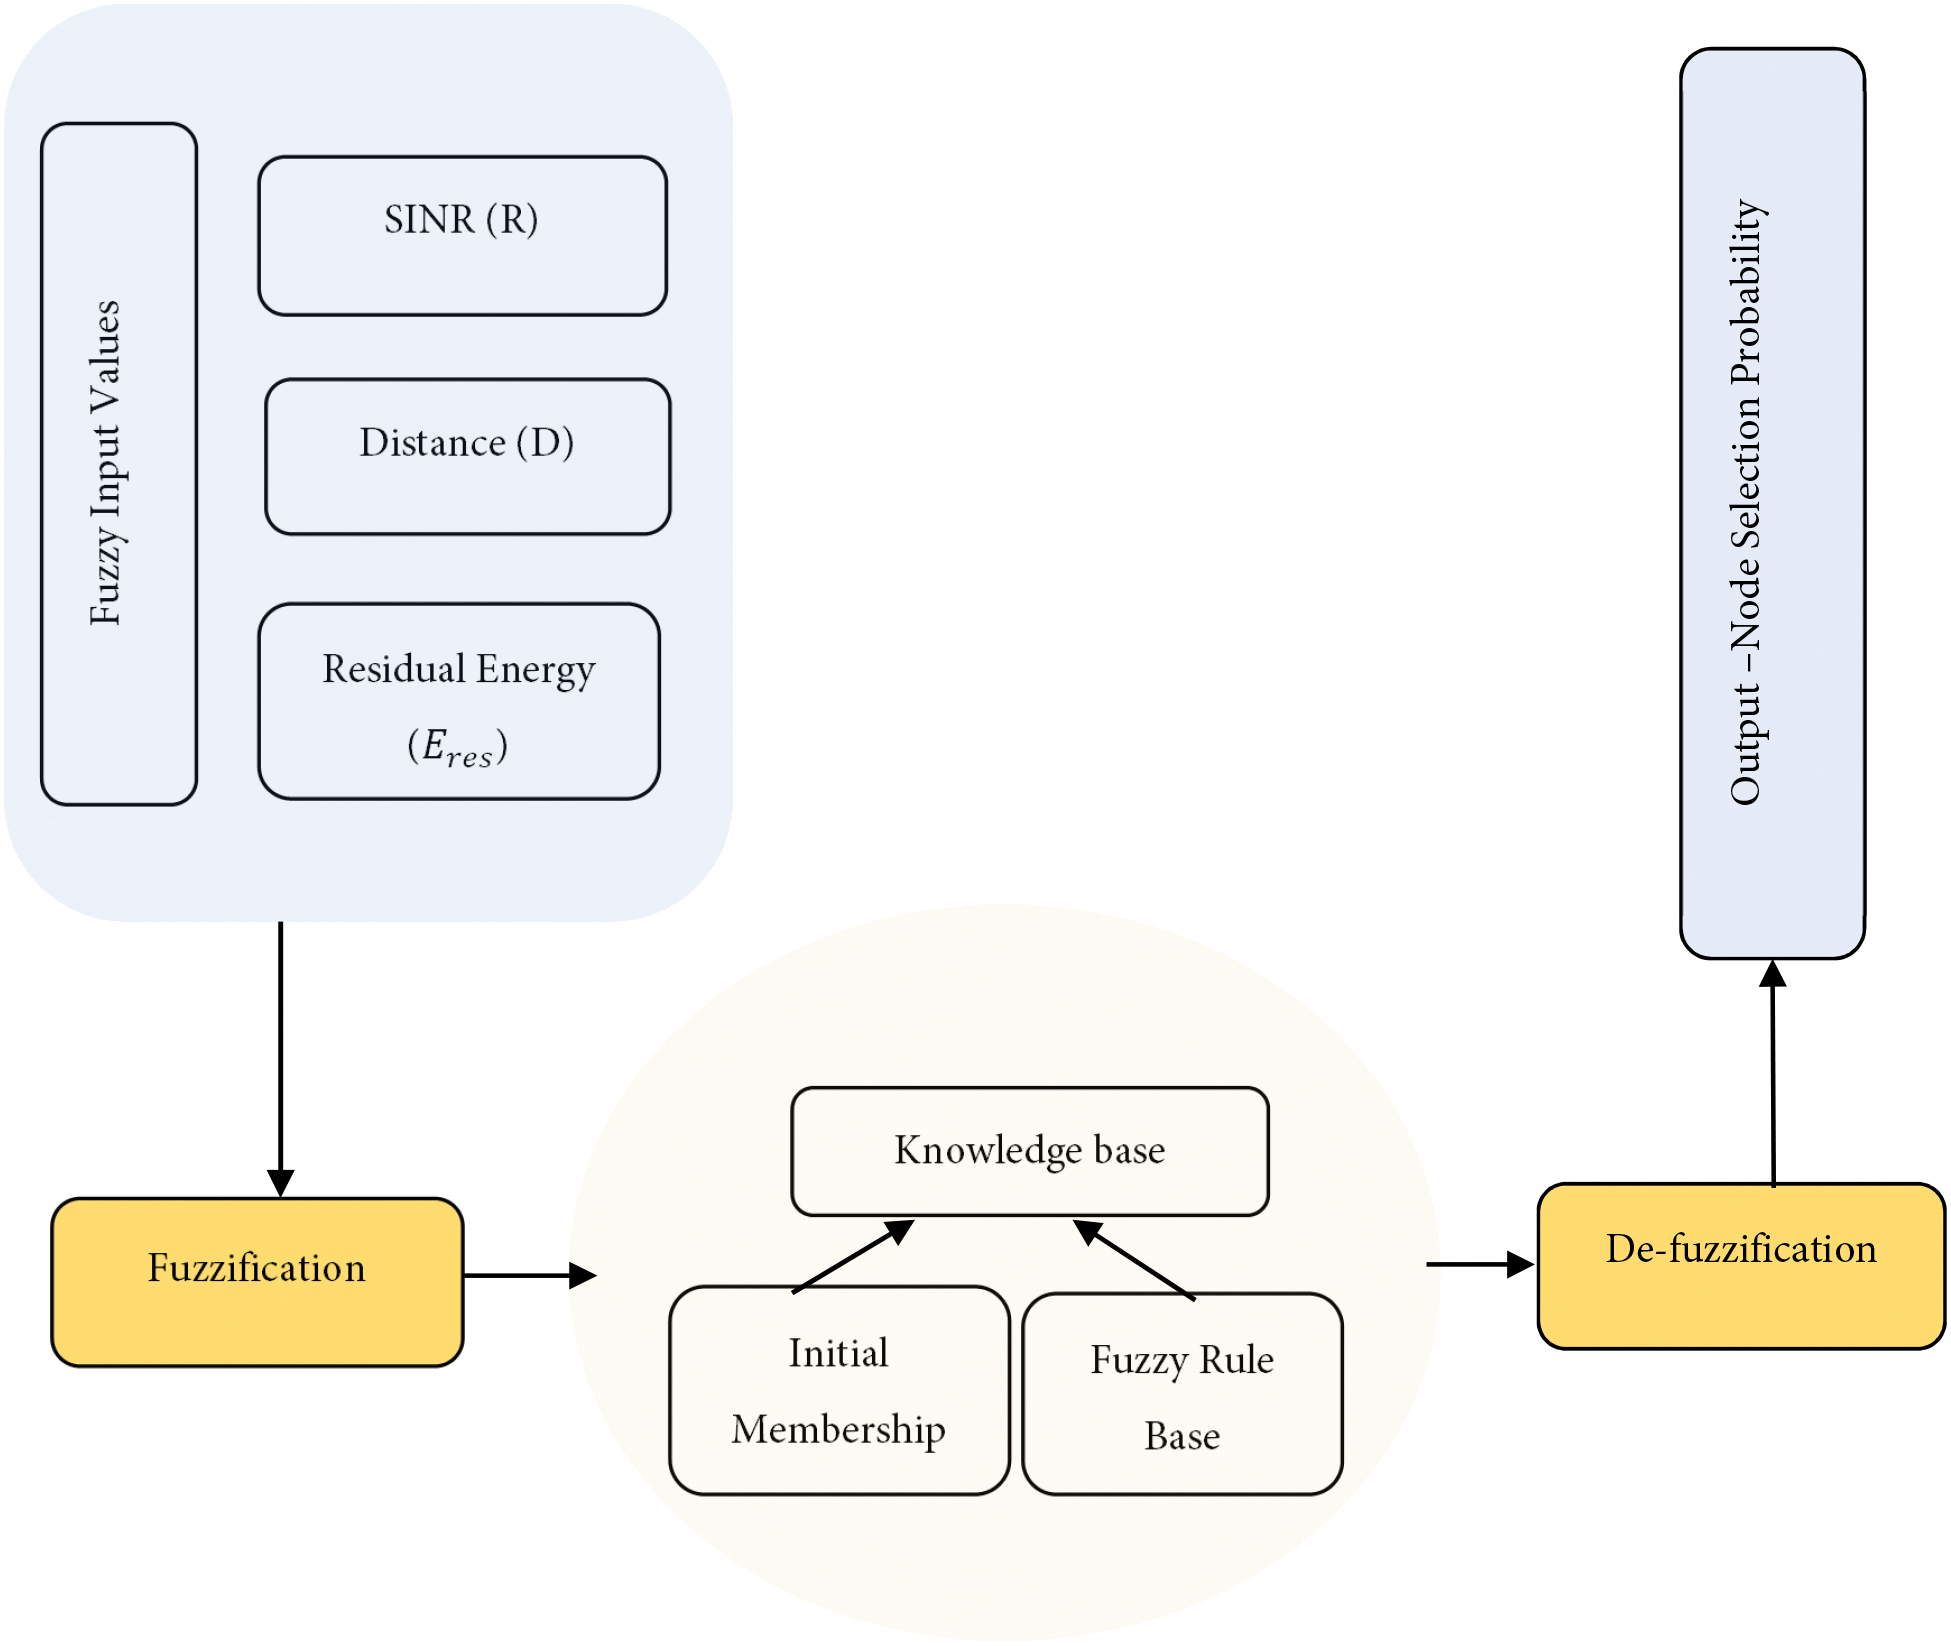
Figure 2: CH selection using a fuzzy model
i. Fuzzification
Fuzzification involves input variables like Residual Energy (
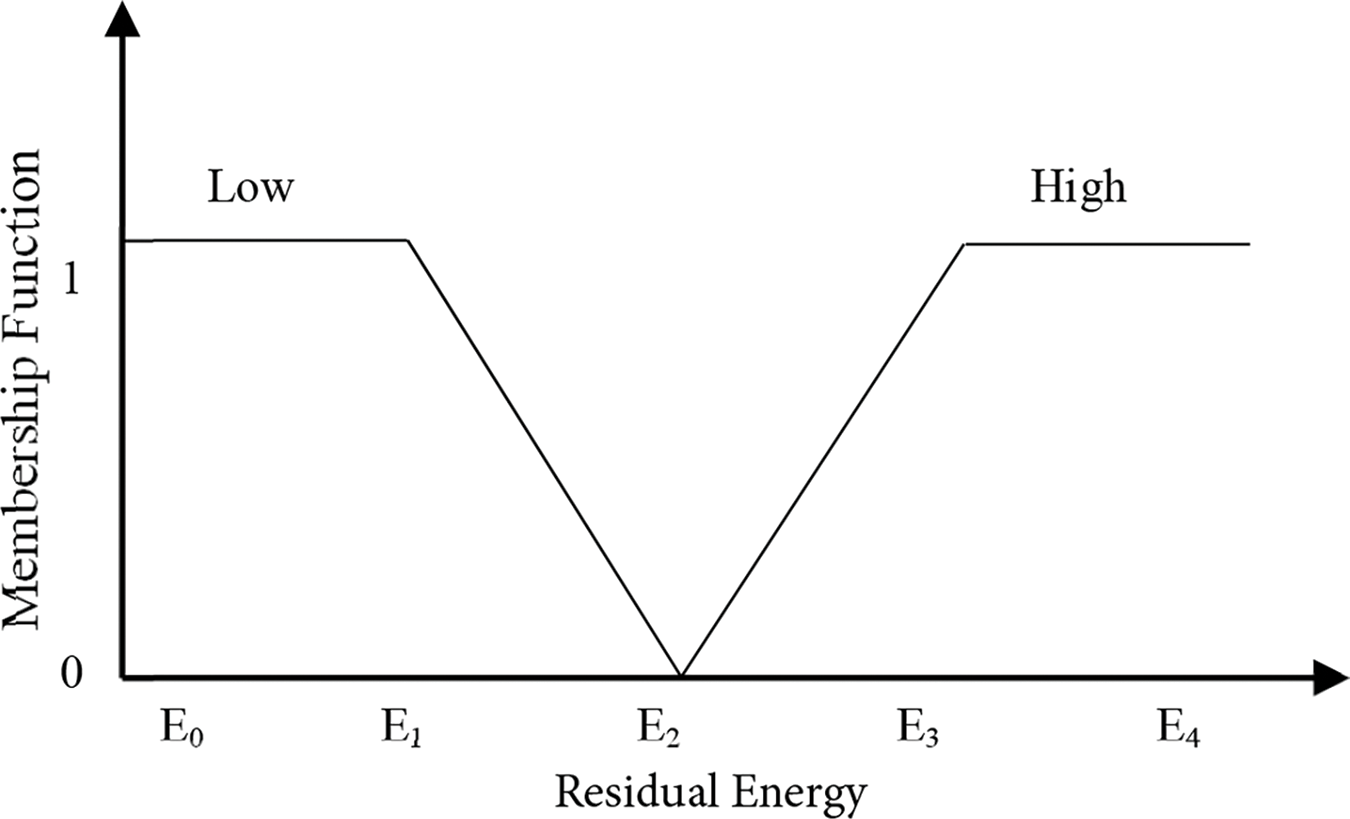
Figure 3: Membership function of residual energy
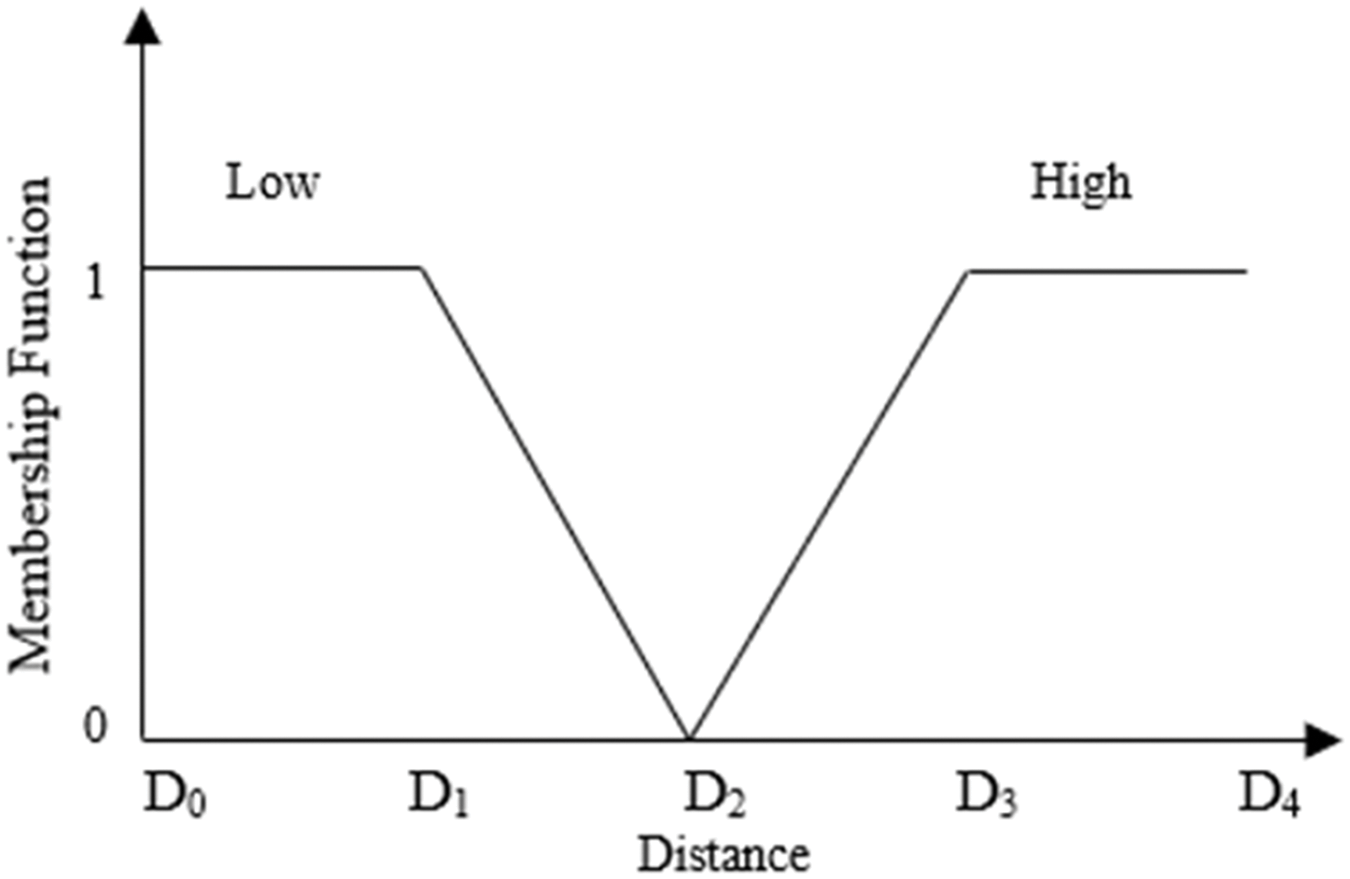
Figure 4: Membership function of distance
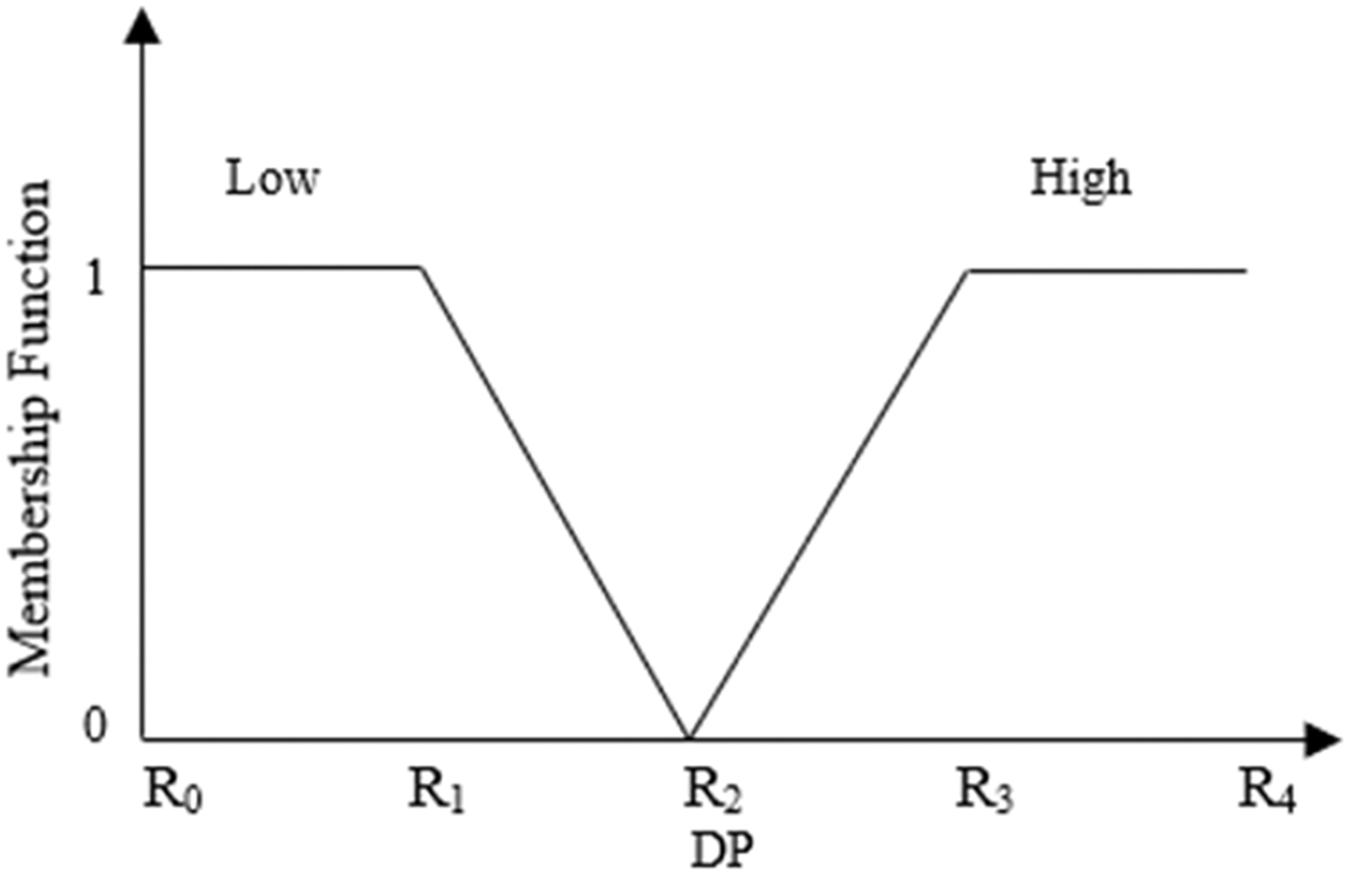
Figure 5: Membership function of DP
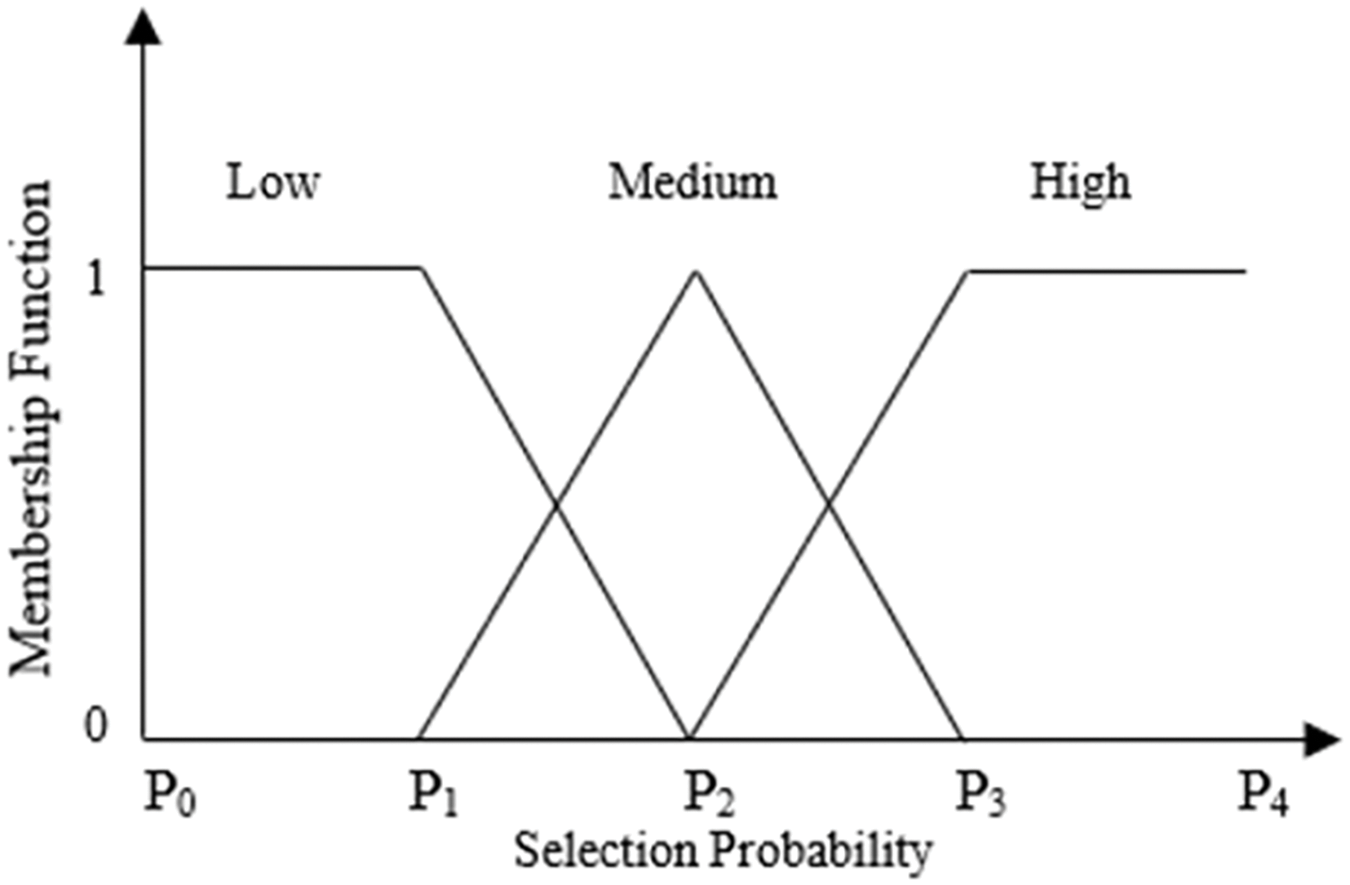
Figure 6: Membership function of selection probability
Table 2 depicts the designed fuzzy inference model that evaluates the function of the inference system and technique through the outcome of all rules joined that make the fuzzy decision. For example, Rule 8th If, (Eres & DP = H) and (D = L), then CH selection probability is High.

ii. Defuzzification
Defuzzification is the process of extracting numerical output from a fuzzy set and using them as interpretation values. During the fuzzy choice-making process, the midpoint of the area method is examined for defuzzification.
where,
3.4 Cluster-Based Data Gathering
In the data aggregation phase, CH collects information from sensors and saves it as a vector to decrease data duplication. When new data is received, a similarity function is used to compare the two vectors. If the two sets of data are similar, the CH sends only one set of non-duplicated data to the BS. If the distance to BS/sink changes beyond a limit, then the re-clustering phase is initiated again. The following Algorithm 1 demonstrates the data-gathering procedure of CDAFDM.
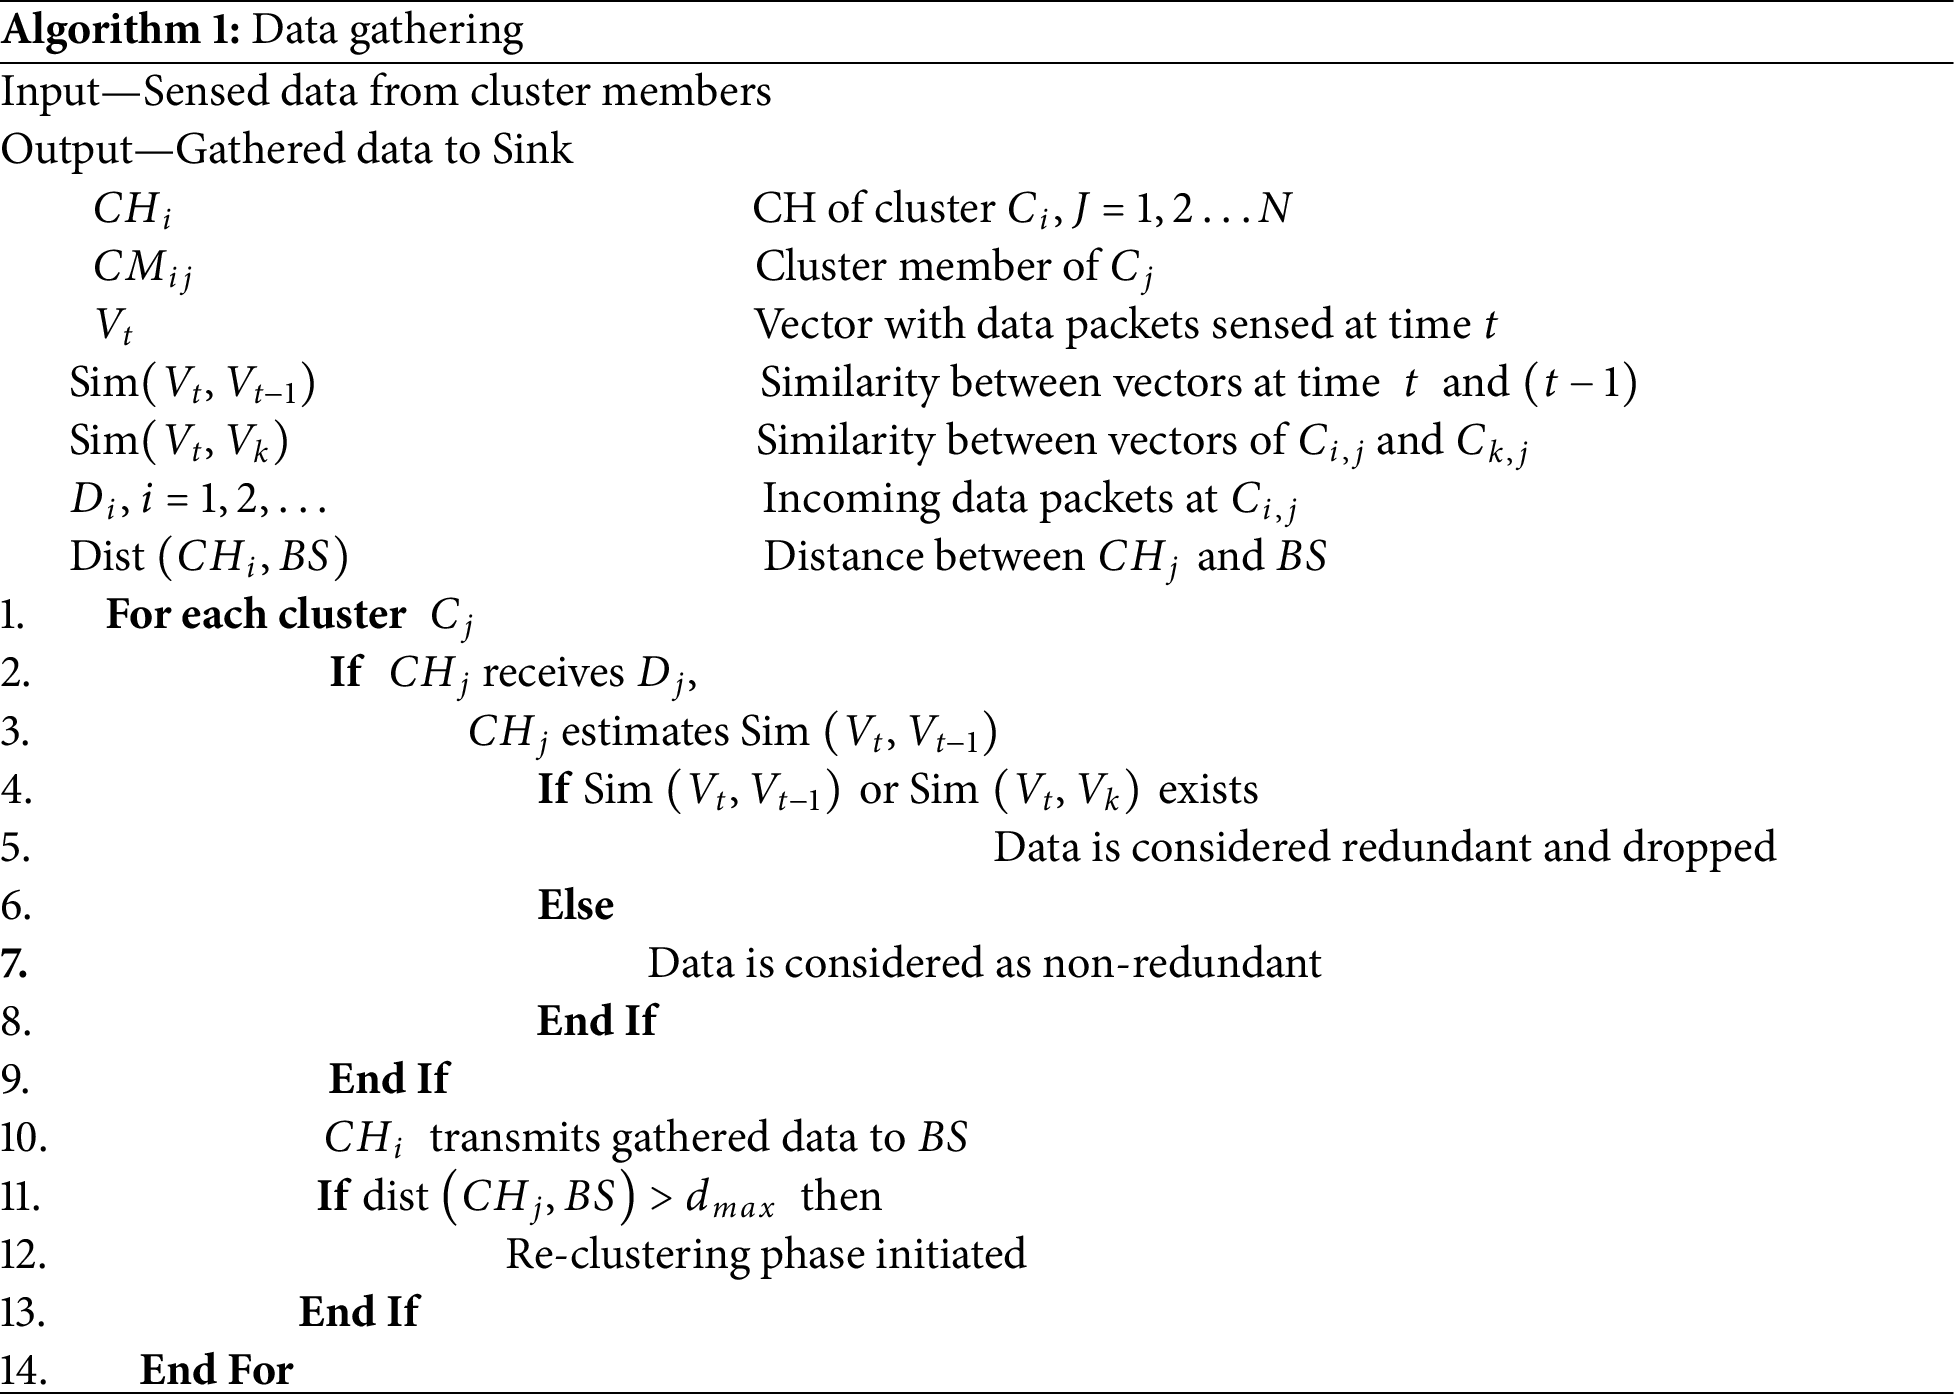
Re-clustering, the last phase of the proposed method, implies that the network maintains its effectiveness and flexibility in a changing undersea environment. Re-clustering is necessary to provide dependable data transmission in mobile UWSNs since node movement and energy depletion cause constant topology changes. When a CH no longer satisfies the ideal communication circumstances, this procedure is initiated. To avoid communication failure and increase network longevity, a CH is replaced if its remaining energy falls below a certain level. Similarly, re-clustering is started to restructure the cluster structure and preserve stable connections if a CH travels too far from its assigned cluster or if its coverage efficiency decreases. PDP is another important consideration; a new CH is chosen to restore effective data aggregation and delivery when transmission reliability declines as a result of poor signal strength or excessive interference. The network may adapt dynamically to changing circumstances thanks to this adaptive mechanism, which guarantees steady performance, lower packet loss, and improved energy management. The selection procedure uses the FLD model to identify the best CH, adhering to the same methodology as covered in the earlier sections.
4 Simulation Parameters and Result Analysis
NS2 with Aqua-Sim toolkit is used for the simulation of the proposed CDAFDM framework. It is chosen due to its dedicated support for underwater networks, customizable protocol implementation, and open-source flexibility. Unlike OPNET, which is proprietary, and GloMoSim, which lacks underwater modules, NS2 allows precise modeling of acoustic communication, mobility patterns, and energy consumption, making it the most suitable choice for evaluating UWSN performance [21]. The acoustic interference loss, travel model, and packet delays are all efficiently addressed by Aqua-Sim. It is an entity framework and can be deployed in three dimensions. Table 3 lists the system parameters and settings of our proposed framework.

The proposed CDAFDM is compared with Event-Driven Data Gathering (EDDG), data Collection Algorithm for underwater Optical Acoustic Sensor Networks (CAPTAIN), and Data Collection Based on Mobile Edge Computing (DCBMEC) approaches. The execution is evaluated on the dimensions of data gathering delay, packet delivery ratio, packet drop, and energy usage. Simulation has been done on the basis of (i) Data generation interval and (ii) Transmission range.
4.1 Based on Data Generation Interval
In this research, the data generation interval is altered as 100, 200, 300, 400, and 500 ms.
i. Packet delivery ratio: The ratio of received packets to total transmitted packets sent out by the source node to the primary node in the network.
where,
Fig. 7 shows the visual depiction of the packet delivery ratio with different data generation intervals. With the increase in data generation intervals, the values of CDAFDM, CAPTAIN, and EDDG decrease from 0.9434 to 0.9414, 0.9265 to 0.9207, 0.9143 to 0.9140, respectively, and for DCBMEC the value increases from 0.9 to 0.9045. Since CDAFDM avoids inter-cluster collisions and provides reliable transmission, the packet delivery ratio of CDAFDM is 2% higher when compared to CAPTAIN, 3% higher than EDDG, and 4% higher than DCBMEC.
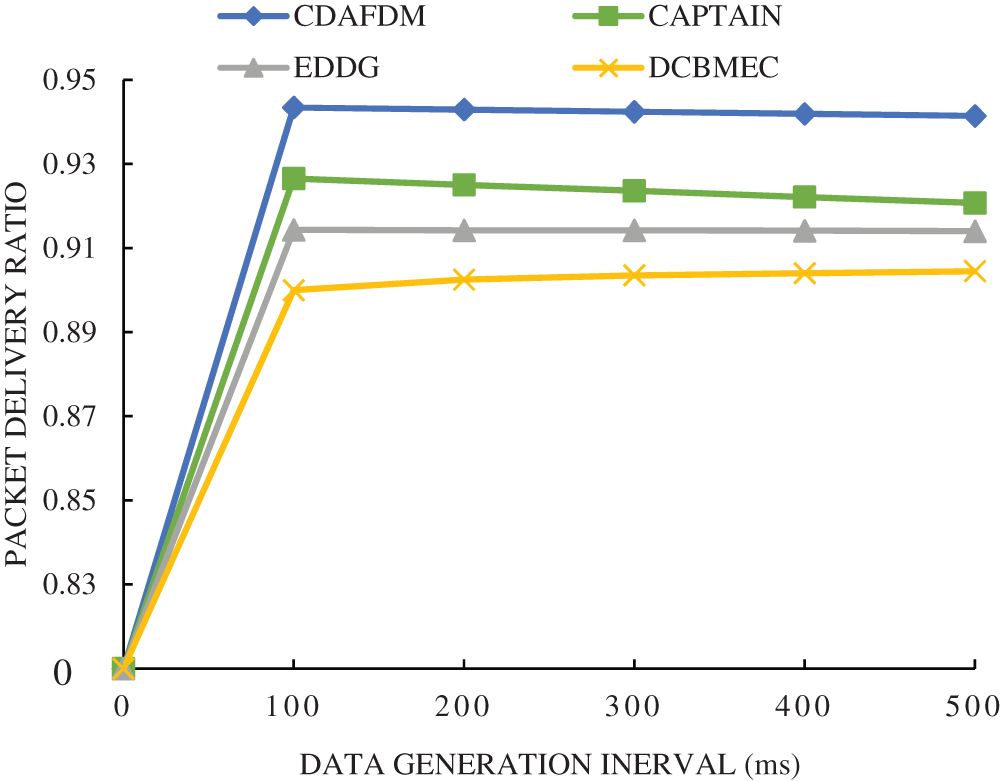
Figure 7: Packet delivery ratio for data generation intervals
ii. Packets dropped: Defined as loss of packets during the transmission to the intended destination.
where,
Fig. 8 shows the outcome of packet drop with different data generation intervals. With the increase in data generation interval, the values of CAPTIAN, EDDG, and DCBMEC increase from 277 to 285, 314 to 324, and 323 to 333 while for our proposed technique CDAFDM increases slightly from 266 to 270 means there is less packet loss. Since CDAFDM avoids inter-cluster collisions and provides reliable transmission, the packet drop of CDAFDM is 5% less than CAPTAIN, 13% less than EDDG, and 15% less than DCBMEC.
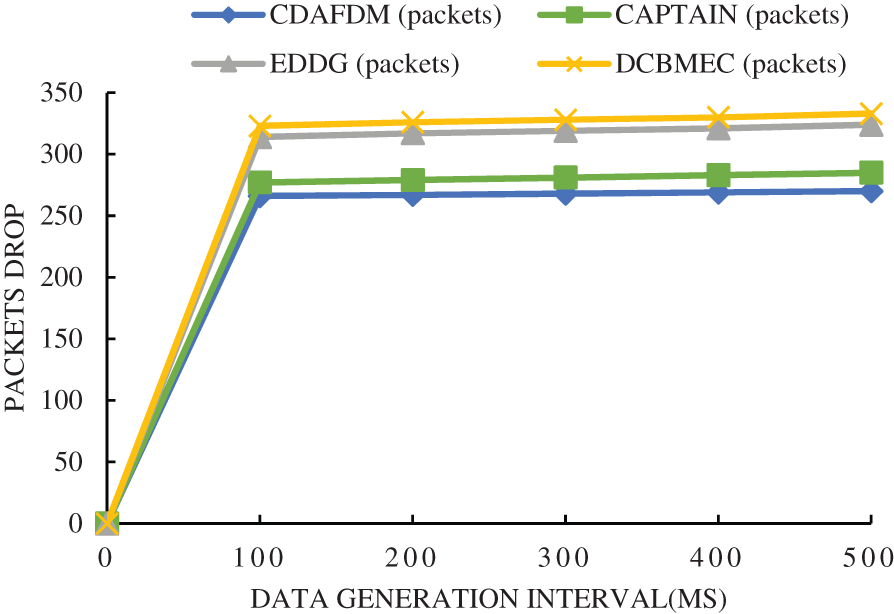
Figure 8: Packets dropped for data generation interval
iii. Data Gathering Delay: Fig. 9 demonstrates data findings gathering delay for varying the data generation intervals. In this with an increase in data generation intervals, the value of the CAPTAIN decreases from 0.1726 to 0.1703, and for EDDG and DCBMEC it increases from 0.1813 to 0.1883 and 0.1885 to 0.1946 respectively while considering the proposed method CDAFDM the values decrease from 0.0883 to 0.0874. Since CDAFDM selects CHs with the shortest distance and avoids data collisions, the data-gathering delay of CDAFDM is 49% less than CAPTAIN, 52% less than EDDG, and 53% less than DCBMEC.
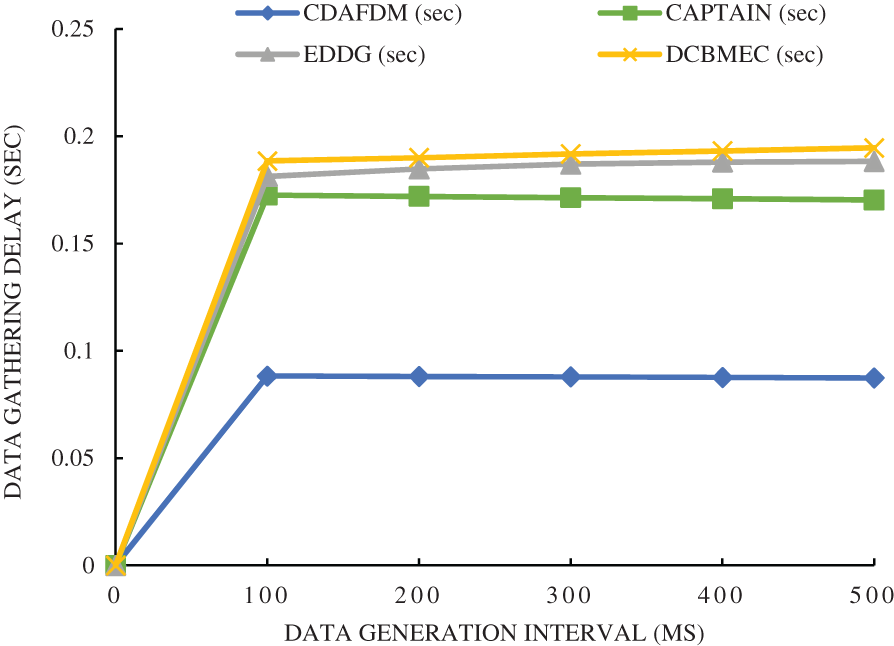
Figure 9: Data gathering delay for data generation intervals
iv. Energy Consumption: Defined as the entire quantity of energy consumption for transferring, reception, and data aggregation. Fig. 10 shows the outcomes of maximum energy consumption with changing intervals between data creation. With the increase in data generation interval from 0 to 500 the value of CAPTAIN, EDDG, and DCBMEC increases from 680.42 to 701.85, 799.73 to 802.23, and 815 to 845 respectively while for the proposed method the value is slightly increases from 646.36 to 658.11. Since CDAFDM avoids the energy hole problem, the energy usage of CDAFDM is 5% less when contrasted to CAPTAIN, 18% less that of EDDG, and 21% less than DCBMEC.
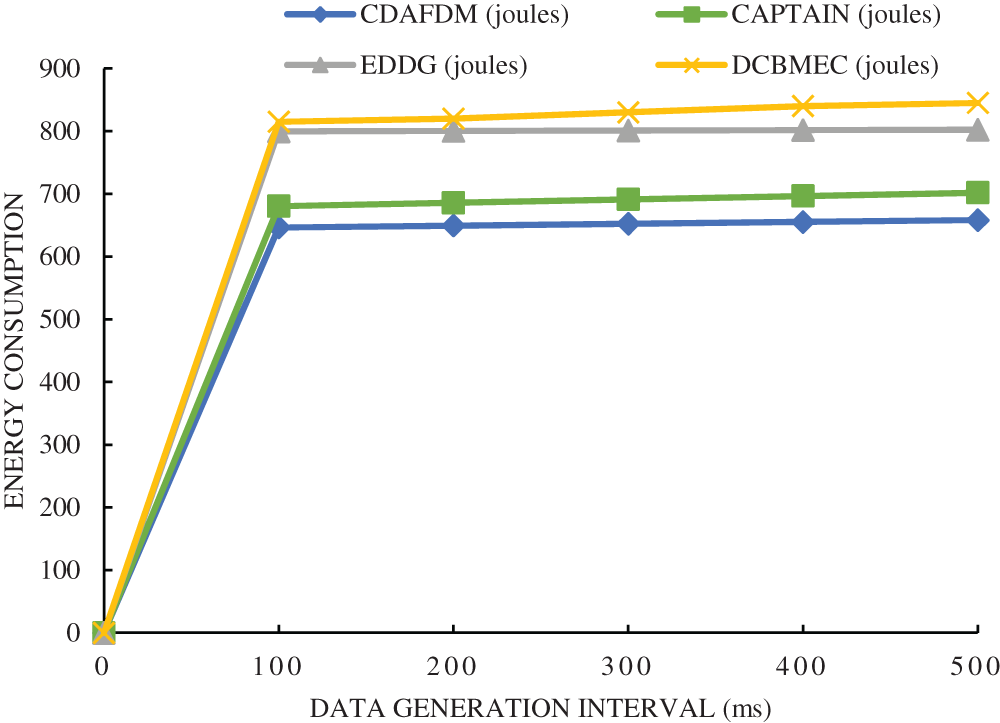
Figure 10: Energy consumption for data generation intervals
Comparative Analysis: The performance comparison between CDAFDM, CAPTAIN, EDDG, and DCBMEC clearly demonstrates the efficiency of the proposed approach. CDAFDM consistently achieves higher packet delivery ratios across different data generation intervals (shown in Fig. 7) due to its optimized CH selection and re-clustering mechanism, that ensures stable communication links. In contrast, CAPTAIN and EDDG suffer from intra-cluster collisions and inefficient CH replacement, leading to more packet loss (shown in Fig. 8). The reduced packet drop rate in CDAFDM is attributed to its similarity-based data aggregation, which prevents redundant transmissions, and minimizes network congestion. Unlike DCBMEC, which relies on a mobile edge computing model with higher processing overhead, CDAFDM efficiently balances data transmission loads, reducing packet loss by 6–18% compared to other methods. The data collection delay (Fig. 9) is significantly lower in CDAFDM, with a 48–52% reduction compared to CAPTAIN and EDDG. This improvement results from shorter communication paths, efficient CH selection, and optimized re-clustering, that adaptively reassigns CHs before network instability occurs. CAPTAIN and EDDG experience higher latency due to suboptimal CH selection, which leads to frequent retransmissions and delayed data aggregation.
Regarding energy consumption as shown in Fig. 10, CDAFDM shows 7%–18% lower energy usage compared to CAPTAIN, EDDG, and DCBMEC. This improvement is due to its intelligent CH selection based on residual energy and data similarity-based aggregation, it reduces redundant data transmissions. In contrast, CAPTAIN and EDDG experience higher energy depletion due to multi-hop relay inefficiencies, while DCBMEC suffers from higher computational overhead associated with edge processing.
4.2 Based on Transmission Range
In this study data transmission range alters to 100, 150, 200, 250, and 300 m.
i. Data gathering delay: Fig. 11 shows the outcomes of data gathering delay for varied transmission ranges. As the range varies the value of CAPTAIN, EDDG, and DCBMEC decreases from 0.1697 to 0.1676, 0.1787 to 0.1716, and 0.1835 to 0.1796, respectively, while CDAFDM shows a slight decrease from 0.0871 to 0.0862. Since CDAFDM selects CHs with the shortest distance and avoids data collisions, the data-gathering delay of CDAFDM is 48% less than CAPTAIN, 50% less than EDDG, and 52% less than DCBMEC.
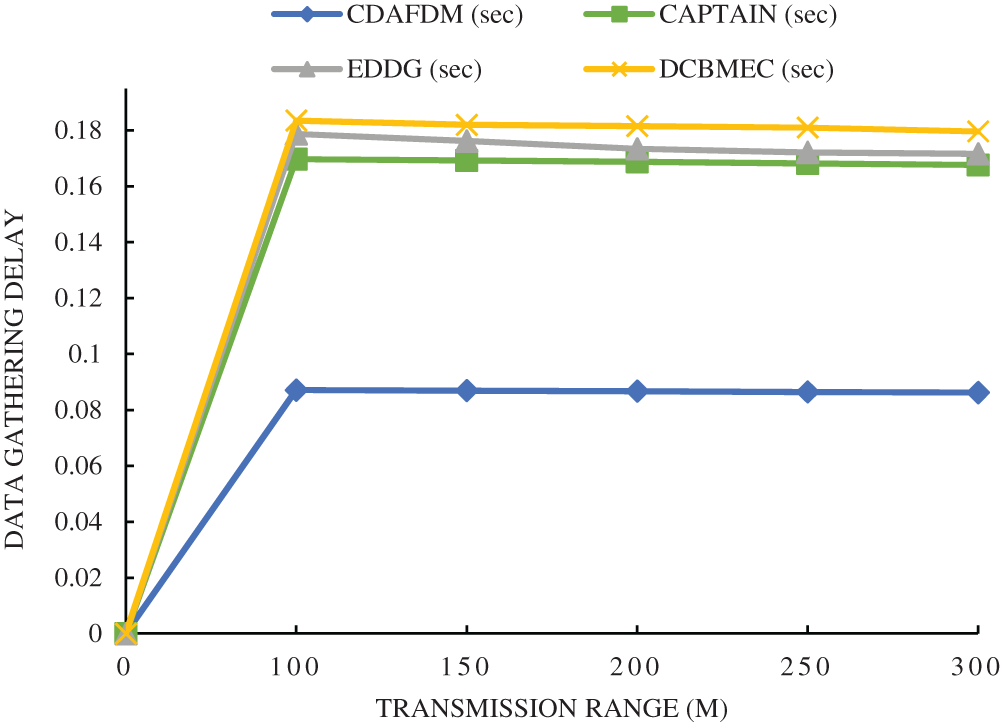
Figure 11: Data gathering delay for ranges
ii. Packet delivery ratio: The ratio of received packets to total packets sent out by the source node to the primary node in the network.
where,
Fig. 12 shows the outcome of packet drop with different data transmission ranges. With the increase in the range value, the value of CAPTAIN, EDDG, and DCBMEC increases from 0.81999 to 0.9212, 0.8199 to 0.9143, and 0.81999 to 0.9035 respectively while as the proposed method CDAFDM the value increases from 0.81999 to 0.9329. Since CDAFDM avoids inter-cluster collisions and provides reliable transmission, the delivery ratio of CDAFDM is 2% higher compared to CAPTAIN, 3%% higher than EDDG, and 4% higher than DCBMEC.
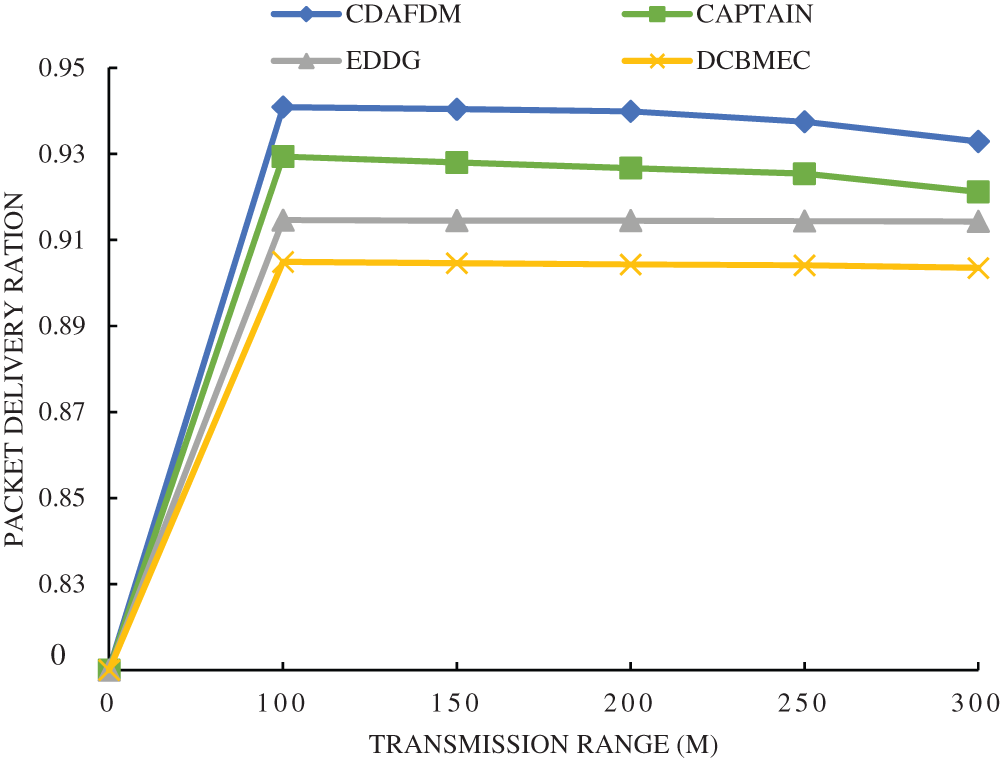
Figure 12: Packet delivery ratio for ranges
iii. Packet dropped: It is defined as the loss of packets during the transmission to the intended destination.
where,
Fig. 13 shows the outcome of packet drop with different transmission ranges. While increasing the range value the values of CAPTAIN, EDDG, and DCBMEC increase from 287 to 295, 315 to 319, and 320 to 334 respectively while in the proposed method the value slightly increases from 271 to 275. Since CDAFDM avoids inter-cluster collisions and provides reliable transmission, the packet drop of CDAFDM is 6% less compared to CAPTAIN, 14% less than EDDG, and 18% less than DCBMEC.
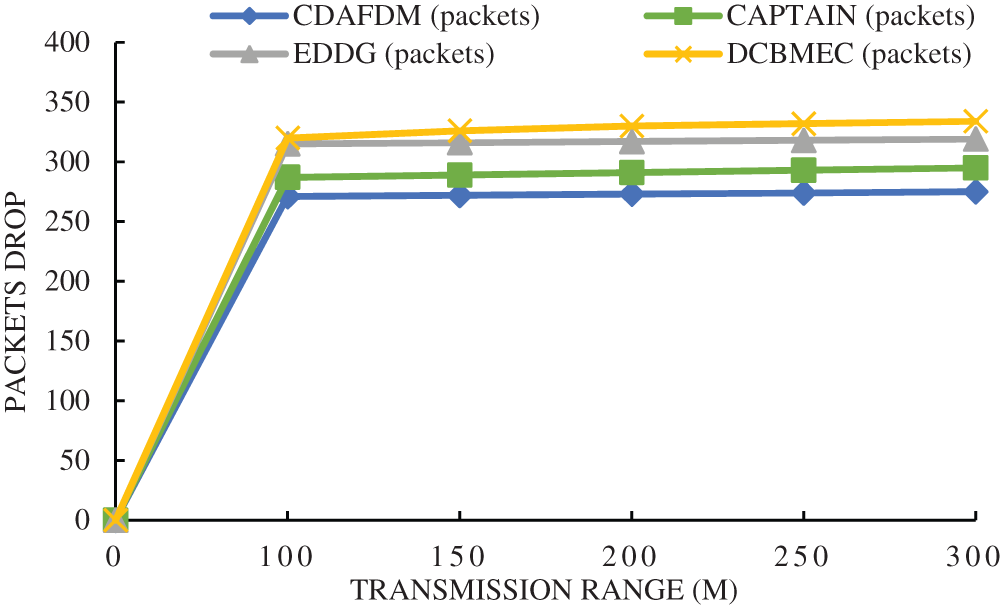
Figure 13: Packets dropped for transmission range
iv. Energy consumption: It is defined as the overall quantity of energy consumption in broadcasting, reception, and data aggregation. Fig. 14 depicts the results of maximum energy consumption for the transmission range. With the increase in range value, the value of CAPTAIN, EDDG, and DCBMEC increases from 707.08 to 727.45, 790.48 to 799.09, and 808.73 to 825.34 respectively while the proposed method shows a slight increase from 660.97 to 672.12. Since CDAFDM avoids the energy hole problem, the energy usage of CDAFDM is 7% less when contrasted to CAPTAIN, 16% less than that of EDDG, and 18% less than DCBMEC.
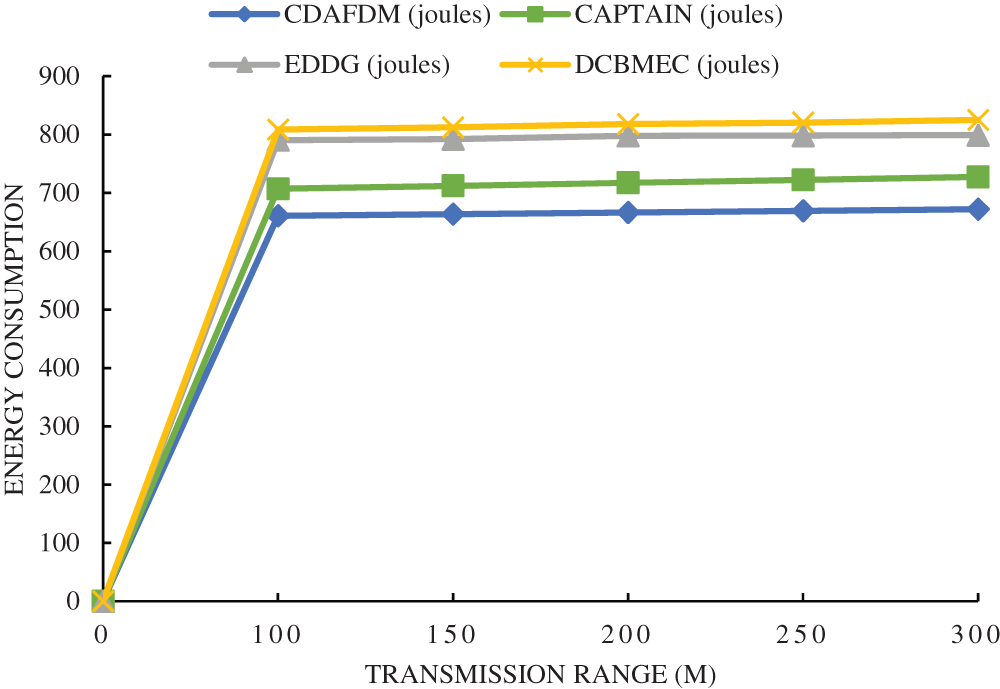
Figure 14: Energy consumption for ranges
Comparative Analysis: Across varying transmission ranges (Figs. 11–14), CDAFDM maintains its superior performance by adapting to network topology changes, ensuring reliable data aggregation, and minimizing packet drops. The combination of fuzzy logic-based CH selection and adaptive re-clustering allows CDAFDM to outperform existing protocols in both short-range and long-range communication scenarios. These results highlight the strength of CDAFDM’s intelligent CH selection, adaptive re-clustering, and optimized data aggregation, making it a more energy-efficient, low-latency, and high-reliability solution compared to CAPTAIN, EDDG, and DCBMEC.
This study presented the CDAFDM framework, a cluster-based data aggregation approach designed for mobile UWSNs, incorporating a fuzzy decision model to enhance network efficiency. This framework is evaluated against existing protocols such as CAPTAIN, EDDG, and DCBMEC across various data generation intervals and transmission ranges, focusing on key performance metrics, including packet delivery ratio, packet drop, data collection latency, and energy consumption. Simulation results demonstrated that CDAFDM consistently outperformed the traditional approaches in all scenarios. Specifically, CDAFDM achieved a 2%–4% increase in packet delivery ratio, 6%–18% fewer packet losses, 48%–52% lower data collection latency, and 7%–18% less energy consumption compared to CAPTAIN, EDDG, and DCBMEC. These improvements are attributed to its efficient cluster head selection based on residual energy, proximity to the sink, and delivery probability, along with an adaptive re-clustering mechanism that ensures stable performance in dynamic underwater environments. The results confirm that CDAFDM not only enhances energy efficiency but also ensures reliable and timely data transmission, making it a robust and scalable solution for real-world underwater applications. The proposed methodology provides a significant advancement for researchers and industry professionals striving to overcome mobility challenges, energy constraints, and network reliability issues in UWSNs, clearing the path for undersea communication systems that are more sustainable and effective.
In order to increase flexibility and efficiency, this system can be further enhanced in subsequent work by including machine learning approaches for dynamic cluster head selection and investigating real-time implementation in vast underwater environments.
Acknowledgement: This work was supported by the Deanship of Scientific Research, the Vice Presidency for Graduate Studies and Scientific Research, King Faisal University, Saudi Arabia under the project (KFU250420).
Funding Statement: This work was funded by the Deanship of Scientific Research, the Vice Presidency for Graduate Studies and Scientific Research, King Faisal University, Saudi Arabia under the project (KFU250420).
Author Contributions: Study conception and design: Aadil Mushtaq Pandit, Manni Kumar, Naveen Kumar; data collection: Sachin Ahuja, Yonis Gulzar; analysis and interpretation of results: Rashi Rastogi, Rupesh Gupta; draft manuscript preparation: Aadil Mushtaq Pandit, Manni Kumar; final review editing: Naveen Kumar, Sachin Ahuja; supervision: Yonis Gulzar, Rashi Rastogi; project administration: Rupesh Gupta, Nitin Goyal. All authors reviewed the results and approved the final version of the manuscript.
Availability of Data and Materials: Data will be made available from the corresponding author upon reasonable request.
Ethics Approval: Not applicable.
Conflicts of Interest: The authors declare no conflicts of interest regarding the present study.
References
1. Khalid M, Cao Y, Ahmad N, Khalid W, Dhawankar P. Radius-based multipath courier node routing protocol for acoustic communications. IET Wirel Sens Syst. 2018;8(4):183–9. doi:10.1049/iet-wss.2017.0165. [Google Scholar] [CrossRef]
2. Goyal N, Dave M, Verma AK. Data aggregation in underwater wireless sensor network: recent approaches and issues. J King Saud Univ Comput Inf Sci. 2019;31(3):275–86. doi:10.1016/j.jksuci.2017.04.007. [Google Scholar] [CrossRef]
3. Sun L, Wang Y, Hui X, Ma X, Bai X, Tan M. Underwater robots and key technologies for operation control. Cyborg Bionic Syst. 2024;5(48):89. doi:10.34133/cbsystems.0089. [Google Scholar] [PubMed] [CrossRef]
4. Chen B, Hu J, Zhao Y, Ghosh BK. Finite-time observer based tracking control of uncertain heterogeneous underwater vehicles using adaptive sliding mode approach. Neurocomputing. 2022;481(5):322–32. doi:10.1016/j.neucom.2022.01.038. [Google Scholar] [CrossRef]
5. Sathish K, Hamdi M, Chinthaginjala R, Pau G, Ksibi A, Anbazhagan R, et al. Reliable data transmission in underwater wireless sensor networks using a cluster-based routing protocol endorsed by member nodes. Electronics. 2023;12(6):1287. doi:10.3390/electronics12061287. [Google Scholar] [CrossRef]
6. Kartha JJ, Jacob L. Network lifetime-aware data collection in Underwater Sensor Networks for delay-tolerant applications. Sādhanā. 2017;42(10):1645–64. doi:10.1007/s12046-017-0713-x. [Google Scholar] [CrossRef]
7. Wibisono A, Alsharif MH, Song HK, Lee BM. A survey on underwater wireless power and data transfer system. IEEE Access. 2024;12:34942–57. doi:10.1109/ACCESS.2024.3373791. [Google Scholar] [CrossRef]
8. Choudhary M, Goyal N. A rendezvous point-based data gathering in underwater wireless sensor networks for monitoring applications. Int J Commun. 2022;35(6):e5078. doi:10.1002/dac.5078. [Google Scholar] [CrossRef]
9. Ferri G, Cococcioni M, Alvarez A. Mission planning and decision support for underwater glider networks: a sampling on-demand approach. Sensors. 2015;16(1):28. doi:10.3390/s16010028. [Google Scholar] [PubMed] [CrossRef]
10. Wang S, Nguyen TLN, Shin Y. Data collection strategy for magnetic induction based monitoring in underwater sensor networks. IEEE Access. 2018;6:43644–53. doi:10.1109/ACCESS.2018.2861946. [Google Scholar] [CrossRef]
11. Han G, Long X, Zhu C, Guizani M, Bi Y, Zhang W. An AUV location prediction-based data collection scheme for underwater wireless sensor networks. IEEE Trans Veh Technol. 2019;68(6):6037–49. doi:10.1109/TVT.2019.2911694. [Google Scholar] [CrossRef]
12. Blanc S. Event-driven data gathering in pure asynchronous multi-hop underwater acoustic sensor networks. Sensors. 2020;20(5):1407. doi:10.3390/s20051407. [Google Scholar] [PubMed] [CrossRef]
13. Câmara EPMJr, Vieira LFM, Vieira MAM. CAPTAIN: a data collection algorithm for underwater optical-acoustic sensor networks. Comput Netw. 2020;171(4):107145. doi:10.1016/j.comnet.2020.107145. [Google Scholar] [CrossRef]
14. Mortada M, Makhoul A, Abou Jaoude C, Harb H, Laiymani D. A distributed processing technique for sensor data applied to underwater sensor networks. In: Proceedings of the 15th International Wireless Communications & Mobile Computing Conference (IWCMC); 2019 Jun 24–28; Tangier, Morocco. p. 979–84. doi:10.1109/iwcmc.2019.8766742. [Google Scholar] [CrossRef]
15. Huang X, Sun S, Yang Q. Data uploading strategy for underwater wireless sensor networks. Sensors. 2019;19(23):5265. doi:10.3390/s19235265. [Google Scholar] [PubMed] [CrossRef]
16. Akbar M, Javaid N, Khan AH, Imran M, Shoaib M, Vasilakos A. Efficient data gathering in 3D linear underwater wireless sensor networks using sink mobility. Sensors. 2016;16(3):404. doi:10.3390/s16030404. [Google Scholar] [PubMed] [CrossRef]
17. Cai S, Zhu Y, Wang T, Xu G, Liu A, Liu X. Data collection in underwater sensor networks based on mobile edge computing. IEEE Access. 2019;7:65357–67. doi:10.1109/ACCESS.2019.2918213. [Google Scholar] [CrossRef]
18. Kumar M, Goyal N, Singh AK, Kumar R, Rana AK. Analysis and performance evaluation of computation models for node localization in deep sea using UWSN. Int J Commun Syst. 2024;37(11):e5798. doi:10.1002/dac.5798. [Google Scholar] [CrossRef]
19. Gupta O, Kumar M, Mushtaq A, Goyal N. Localization schemes and its challenges in underwater wireless sensor networks. J Comput Theor Nanosci. 2020;17(6):2750–4. doi:10.1166/jctn.2020.9116. [Google Scholar] [CrossRef]
20. Akila IS, Venkatesan R. A fuzzy based energy-aware clustering architecture for cooperative communication in WSN. Comput J. 2016;59(10):1551–62. doi:10.1093/comjnl/bxw062. [Google Scholar] [PubMed] [CrossRef]
21. Choudhary M, Goyal N, Gupta D, Sharma B, Sharma N. An oceanographic data collection scheme using hybrid optimization for leakage detection during oil mining in mobility assisted UWSN. Multimed Tools Appl. 2024;83(42):89723–41. doi:10.1007/s11042-024-19023-z. [Google Scholar] [CrossRef]
Cite This Article
 Copyright © 2025 The Author(s). Published by Tech Science Press.
This work is licensed under a Creative Commons Attribution 4.0 International License , which permits unrestricted use, distribution, and reproduction in any medium, provided the original work is properly cited.


 Submit a Paper
 Propose a Special lssue
 View Full Text
 Download PDF
 Downloads
 Citation Tools