
 Submit a Paper
 Propose a Special lssue
 Open Access
ARTICLE

A Neural Network-Driven Method for State of Charge Estimation Using Dynamic AC Impedance in Lithium-Ion Batteries
1 Graduate Institute of A.I. Cross-Disciplinary Tech, National Taiwan University of Science and Technology, Taipei, 106335, Taiwan
2 Department of Electrical Engineering, National Changhua University of Education, Changhua, 50074, Taiwan
3 Department of Electrical Engineering, National Yunlin University of Science and Technology, Yunlin, 640301, Taiwan
4 Department of Electrical Engineering, National Taiwan University of Science and Technology, Taipei, 106335, Taiwan
* Corresponding Author: Guan-Jhu Chen. Email:
Computers, Materials & Continua 2025, 83(1), 823-844. https://doi.org/10.32604/cmc.2025.061498
Received 26 November 2024; Accepted 16 January 2025; Issue published 26 March 2025
 View Full Text
 Download PDF
Abstract
As lithium-ion batteries become increasingly prevalent in electric scooters, vehicles, mobile devices, and energy storage systems, accurate estimation of remaining battery capacity is crucial for optimizing system performance and reliability. Unlike traditional methods that rely on static alternating internal resistance (SAIR) measurements in an open-circuit state, this study presents a real-time state of charge (SOC) estimation method combining dynamic alternating internal resistance (DAIR) with artificial neural networks (ANN). The system simultaneously measures electrochemical impedance |Z| at various frequencies, discharge C-rate, and battery surface temperature during the discharge process, using these parameters for ANN training. The ANN, leveraging its superior nonlinear system modeling capabilities, effectively captures the complex nonlinear relationships between AC impedance and SOC through iterative training. Compared to other machine learning approaches, the proposed ANN features a simpler architecture and lower computational overhead, making it more suitable for integration into battery management system (BMS) microcontrollers. In tests conducted with Samsung batteries using lithium cobalt oxide cathode material, the method achieved an overall average error of merely 0.42% in self-validation, with mean absolute errors (MAE) for individual SOCs not exceeding 1%. Secondary validation demonstrated an overall average error of 1.24%, with MAE for individual SOCs below 2.5%. This integrated DAIR-ANN approach not only provides enhanced estimation accuracy but also simplifies computational requirements, offering a more effective solution for battery management in practical applications.Keywords
Abbreviations
| SOH | State of health |
| SOC | State of charge |
| OCV | Open circuit voltage |
| EIS | Electrochemical impedance spectroscopy |
| ANN | Artificial neural network |
| ECM | Equivalent circuit model |
| BPNN | Back-propagation neural network |
| DIR | Direct internal resistance |
| SAIR | Static alternating internal resistance |
| DAIR | Dynamic alternating internal resistance |
| GEIS | Galvanostatic electrochemical impedance spectroscopy |
| CC | Constant current |
| CV | Constant voltage |
| SEIS | Static electrochemical impedance spectroscopy |
| DEIS | Dynamic electrochemical impedance spectroscopy |
| MSE | Mean squared error |
| AE | Absolute error |
With the rapid advancement of energy systems, electric vehicles (EVs), and mobile devices, lithium-ion batteries have become integral to modern technology. Ensuring their safe and effective use necessitates the implementation of a battery management system (BMS), which typically focuses on two critical parameters: state of health (SOH) and state of charge (SOC) [1–5]. Among these, SOC plays a pivotal role in influencing user experience, particularly in applications like EVs, where the accuracy of SOC estimation directly impacts the perceived driving range. Inaccurate SOC estimations can lead to range anxiety, undermining consumer confidence and impeding the adoption of EVs. While various SOC estimation methods have been developed, each with unique strengths and limitations, their suitability depends on the specific application. For instance, SOC estimation for emergency lighting systems—primarily used during power outages—prioritizes simplicity and speed over precision, given their constant connection to mains charging. In contrast, applications like EVs demand higher precision to optimize performance and user satisfaction, underscoring the importance of selecting the appropriate method for each use case.
In recent years, Dynamic Electrochemical Impedance Spectroscopy (DEIS) has achieved significant advances in battery monitoring and diagnostics. Unlike traditional electrochemical impedance spectroscopy (EIS), DEIS enables real-time monitoring during battery operation, providing a novel research tool for performance evaluation and fault diagnosis. Reference [6] introduced an innovative DEIS method capable of continuous single-frequency impedance measurements during charge/discharge cycles, demonstrating smaller charge transfer resistance compared to steady-state EIS across a wide state-of-charge range, establishing a crucial foundation for DEIS applications. In fundamental theoretical research, several innovative works have advanced DEIS technology. Reference [7] employed the Doyle-Fuller-Newman pseudo-two-dimensional model to investigate DEIS applications during lithium-ion battery charging and discharging. The study compared brute force time domain calculation with fast-computing time-separated methods, validating the rigorous correctness of the time-separated approach and revealing DEIS signals’ selective sensitivity to interfacial processes, providing theoretical basis for real-time diagnostics and electrode control. Reference [8] developed a simplified time-frequency physicochemical model, identifying 24 parameters with varying sensitivity through parameter sensitivity analysis, offering crucial guidance for parameter identification and advanced battery management system development. Innovation in measurement techniques represents another significant direction in DEIS research. Reference [9] proposed an online real-time EIS measurement method based on closed-loop control of power converters, achieving faster measurements under consistent battery operating conditions while improving output voltage control and eliminating added perturbation ripple. Reference [10] developed a fast broadband EIS method using the local rational method (LRM), effectively compensating for transient effects and eliminating traditional long waiting times, demonstrating superior performance over nonparametric techniques like local polynomial methods in experimental tests. Reference [11] introduced a rapid EIS measurement method based on large square wave excitation signals, achieving microsecond-level response times, establishing new technical pathways for real-time online impedance monitoring. Reference [12] integrated impedance measurement algorithms into high-power battery chargers, implementing AC current ripple injection, signal transformation, and impedance calculation, providing novel approaches for charging current optimization and reactive current-voltage assessment.
Battery state estimation represents a crucial application domain for DEIS technology. Reference [13] innovatively introduced fractional calculus methods into EIS-based impedance models for SOC estimation, proposing new model identification methods. Reference [14] combined EIS with machine learning techniques to develop a flexible, customizable measurement method, significantly reducing measurement time while maintaining high SOC estimation accuracy. Reference [15] enhanced estimation accuracy and computational efficiency through simplified electrochemical models, eliminating solution-phase and solid-phase lithium-ion diffusion models while extracting key frequency features and considering ambient temperature effects. Reference [16] achieved SOC estimation errors within 2% through a multi-level PI observer approach with dynamic battery model parameter adjustment under compound dynamic stress testing. Reference [17] further integrated impedance spectrum detection into battery management systems, controlling AE within 5.4% under various charging and discharging conditions, significantly improving estimation accuracy. DEIS technology demonstrates unique advantages in battery health diagnostics. Reference [18] evaluated lithium-ion battery aging behavior during charging using DEIS, identifying film resistance as a critical aging indicator, particularly significant at elevated temperatures, providing important insights into battery degradation mechanisms. Reference [19] developed a DEIS-based real-time lithium plating detection method, effectively identifying lithium plating phenomena during charging through monitoring impedance real and imaginary components, validated through voltage relaxation profiles and current interruption methods. Significant progress has also been achieved in model development. Reference [20] proposed a novel dynamic modeling approach based on EIS data, characterized by simplicity, accuracy, and clear physical interpretation, effectively addressing limitations of traditional time-domain methods. Reference [21] analyzed relationships between equivalent circuit elements and impedance spectra of commercial lithium-ion polymer batteries under varying SOC, SOH, and internal temperature conditions, quantifying dependencies between impedance variables and state parameters using curve fitting techniques and Pearson correlation matrices, providing crucial foundations for developing impedance-based real-time battery management systems. These research advances demonstrate DEIS technology’s extensive potential in battery monitoring, diagnostics, and management. Particularly, breakthrough progress in measurement techniques, state estimation, and health diagnostics provides robust support for improving battery system reliability and safety. However, key challenges remain for future research, including enhancing model accuracy, optimizing computational efficiency, and better integrating DEIS technology into practical applications.
Lithium-ion batteries play an increasingly critical role in modern energy management, making the accurate assessment of their performance a key research focus. Many studies have explored methods combining dynamic AC impedance (DAI) and artificial intelligence (AI) for battery state estimation. For instance, Reference [22] proposed a state of health (SOH) estimation model based on voltage, current, and temperature profiles during charging, leveraging artificial neural networks (ANNs) to achieve high accuracy under various conditions. Similarly, Reference [23] focused on estimating capacity fade in electric vehicles, utilizing ANNs to enhance the accuracy of state of charge (SOC) estimation, thereby extending battery lifespan and improving reliability. In addition, Reference [24] investigated the application of ANNs in real-time power estimation for electric vehicles, highlighting the advantages of data-driven models. Significant progress has also been made in combining impedance spectroscopy with deep learning techniques. For example, Reference [25] introduced a multi-frequency electrical impedance spectroscopy (EIS) technique integrated with ANN to estimate SOC, optimizing the model by adjusting the number of neurons in the hidden layer and substantially reducing estimation errors. Meanwhile, Reference [26] analyzed the relationship between impedance spectra and equivalent circuit model parameters, proposing a capacity estimation method based on deep Gaussian process regression, validated under various temperature conditions for broad applicability. Furthermore, Reference [27] employed transfer learning techniques to address data scarcity, training deep neural networks (DNNs) on EIS measurements at different temperatures, achieving exceptional estimation accuracy. For applications involving retired batteries, Reference [28] proposed a rapid capacity estimation method combining low-frequency EIS and Gaussian process regression, extracting health indicators (HIs) to significantly shorten detection time and improve accuracy. Similarly, Reference [29] utilized feature-matching-based transfer learning to validate the method across various battery types, reducing testing costs and time while maintaining estimation accuracy. Novel model architectures and algorithms have also been explored. For instance, Reference [30] developed a hybrid multi-layer deep neural network (HMDNN) that demonstrated high SOC estimation accuracy in electric vehicle datasets, while Reference [31] introduced a Transformer-based architecture which achieved exceptional SOC estimation performance under complex multi-physics conditions. Additionally, Reference [32] combined labeled and unlabeled data in a DNN framework, leveraging time-dependent feature extraction to enhance model performance with limited data. These studies collectively demonstrate that the integration of DAI and AI techniques provides a powerful tool for lithium-ion battery state estimation, offering significant advancements in accuracy, efficiency, and versatility. This research aims to further explore the characteristics of DAI, integrating ANN methods for real-time capacity estimation to deliver innovative solutions for lithium-ion battery management.
This study emphasizes the use of artificial neural networks (ANNs) for state estimation, given their simplicity and potential for seamless integration into the microcontrollers of battery management systems (BMS). Unlike traditional approaches that rely on static alternating internal resistance (SAIR), this paper adopts dynamic alternating internal resistance (DAIR) as the key estimation parameter. DAIR is measured during battery discharge, offering more immediate and accurate data, making it particularly suitable for real-time applications. The nonlinear relationship between AC impedance and the state of charge (SOC) cannot be effectively captured using conventional mathematical models. To address this, the proposed method employs ANNs, which excel in handling nonlinear systems. Through iterative training with input data and target values, ANNs identify optimal solutions for complex nonlinear relationships. In this study, dynamic AC impedance is used as the primary input parameter, while SOC serves as the estimation target. This approach not only enhances estimation accuracy but also simplifies computational demands, making it highly feasible for future integration into resource-constrained microcontrollers within BMS applications. Compared to traditional battery state estimation methods, the proposed approach combining DAIR and ANN offers several significant advantages. While traditional SAIR measurement requires the battery to be in a static state, making it impossible to reflect real-time state changes during operation, DAIR provides continuous monitoring during the discharge process, offering more immediate and accurate data. Furthermore, although other machine learning methods such as Gaussian process regression and deep learning models have demonstrated excellent performance in battery state estimation, these approaches typically demand higher computational resources and complex model architectures. The ANN method adopted in this study features a simpler structure and lighter computational load, making it more suitable for integration into BMS microcontrollers. However, this approach does have certain limitations, such as the requirement for large amounts of high-quality training data and potential constraints in model generalization capability due to the scope of training data. Nevertheless, in terms of practical applicability, this method maintains clear advantages in accuracy, real-time performance, and system integration. By leveraging DAIR and ANN-based modeling, this work aims to pave the way for more efficient and accurate battery management solutions in real-world applications.
2 Dynamic and Static AC Impedance
2.1 System Architecture for AC Impedance Analysis
AC Impedance Analysis involves applying a small sinusoidal voltage or current perturbation to the battery, from which the response current or voltage is obtained. Using ohm’s law, the AC impedance of the battery can be calculated. Typically, a single-frequency perturbation is applied to the battery. By varying the frequency and plotting the measured impedance as real and imaginary parts on a graph, where the X-axis represents the real part impedance and the Y-axis represents the imaginary part impedance, the electrochemical impedance spectrum (Nyquist plot) of the battery can be obtained, or presented as a Bode plot with frequency on the X-axis. In this study, the BioLogic BCS-815 potentiostat/galvanostat was used in conjunction with BT-Lab software for parameter settings, and the Architecture Diagram as shown in Fig. 1. Depending on experimental requirements, the sinusoidal voltage or current amplitude and frequency range applied to the battery perturbation can be adjusted. The BCS-815 module measures voltage, current, and other information, which is then fed back to the BT-Lab software for analysis. Impedance values at various frequencies are plotted as Nyquist plots to describe the battery’s electrochemical properties. AC impedance measurements can be conducted using potentiostatic electrochemical Impedance Spectroscopy (PEIS) or galvanostatic electrochemical impedance spectroscopy (GEIS) techniques. Both methods provide similar Nyquist plots under identical conditions, as illustrated in Fig. 2 for a battery tested at 25°C in an OCV state. Based on these results, PEIS was chosen for impedance measurements in this study. BT-Lab performs calculations on the perturbation voltage and response current as described in Eqs. (1) and (2). Eq. (1) calculates impedance by dividing voltage by current, while Eq. (2) decomposes impedance Z into its real and imaginary components.
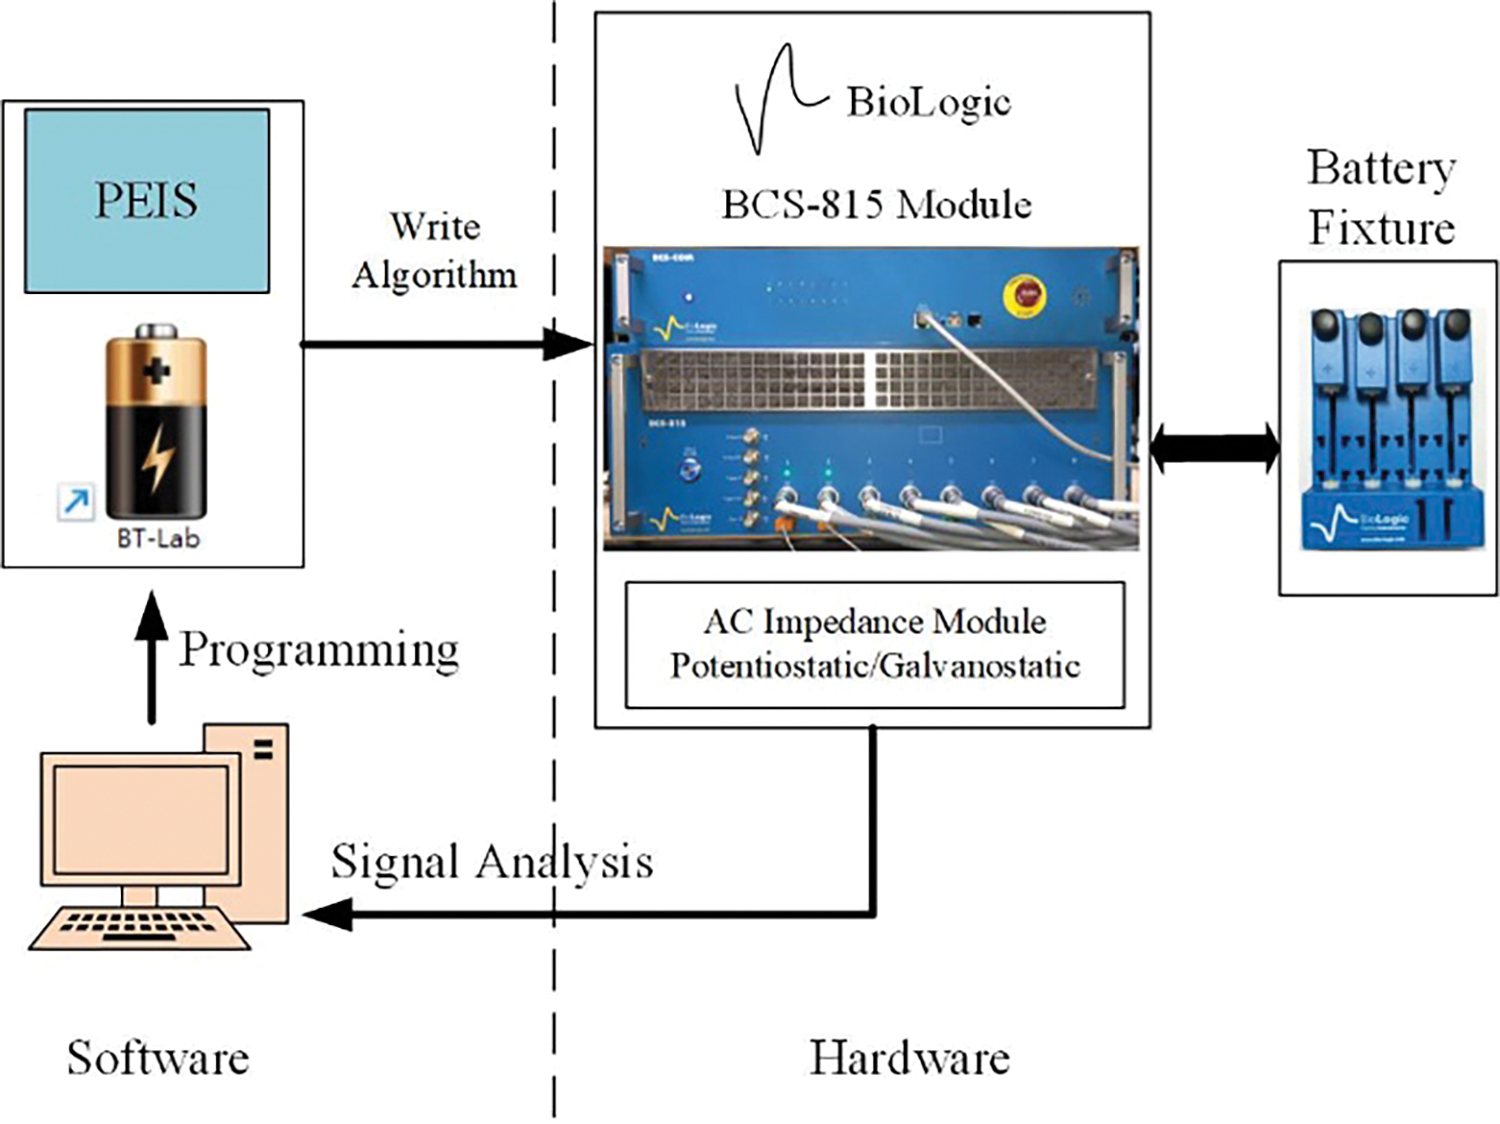
Figure 1: AC impedance analysis system architecture diagram
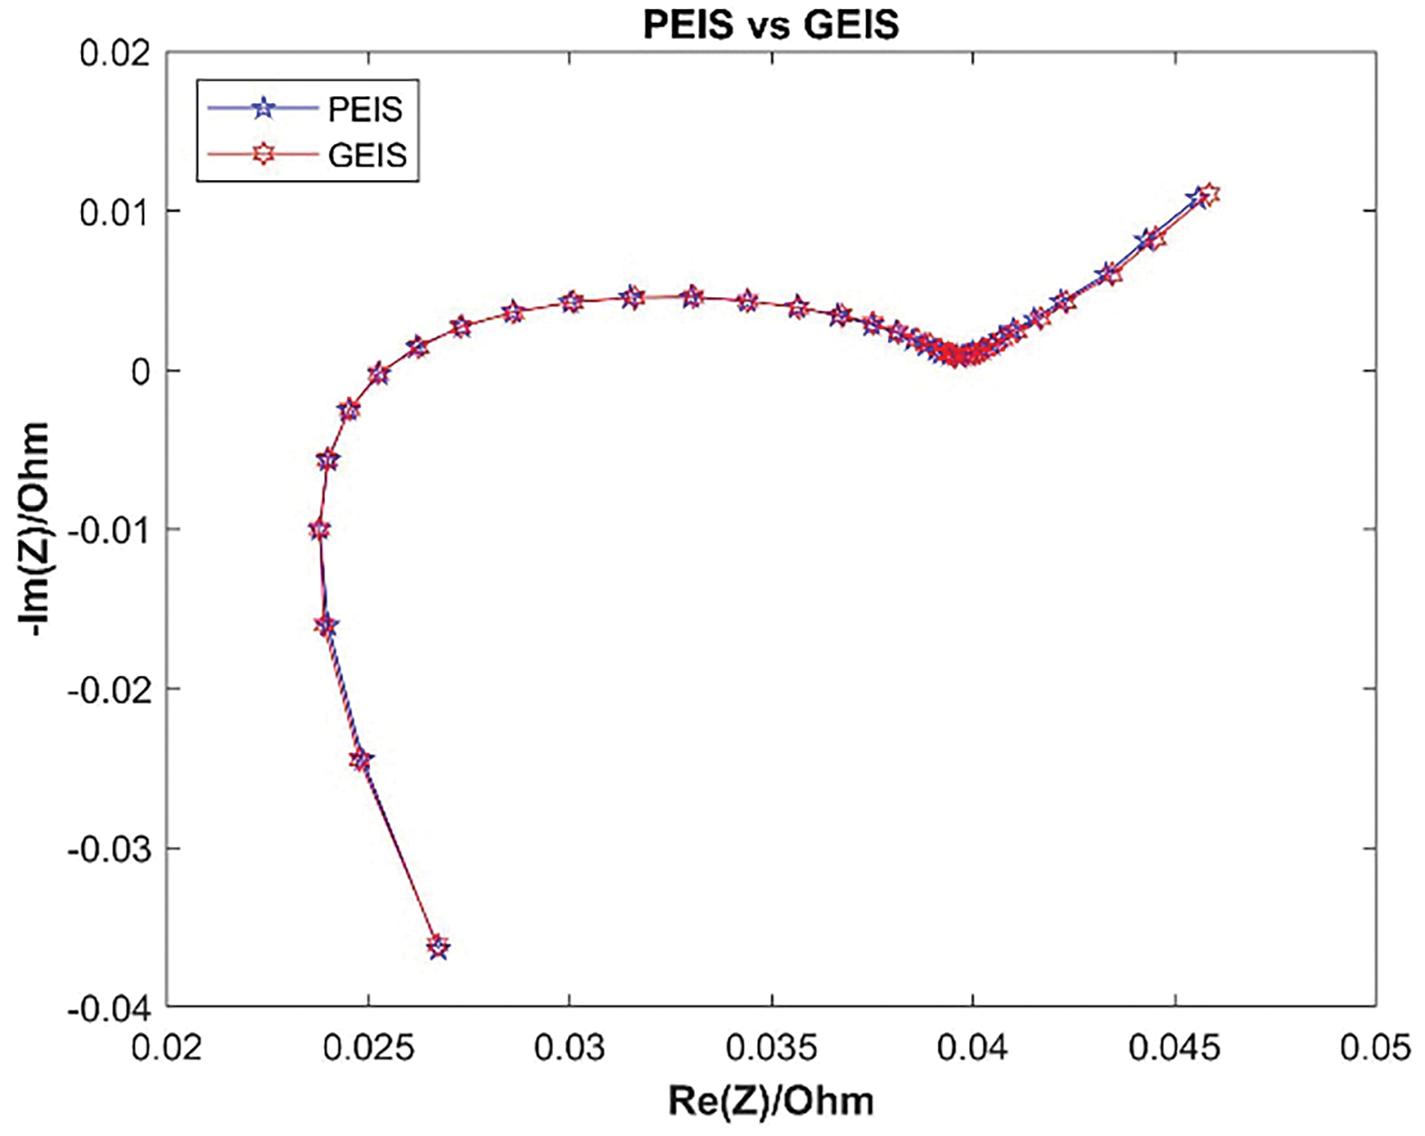
Figure 2: Comparison of PEIS and GEIS
In Eq. (1), Vamp represents the amplitude of the perturbation voltage, and Iamp represents the amplitude of the response current. Since both are sinusoidal waves, they each have a phase and exhibit a phase difference
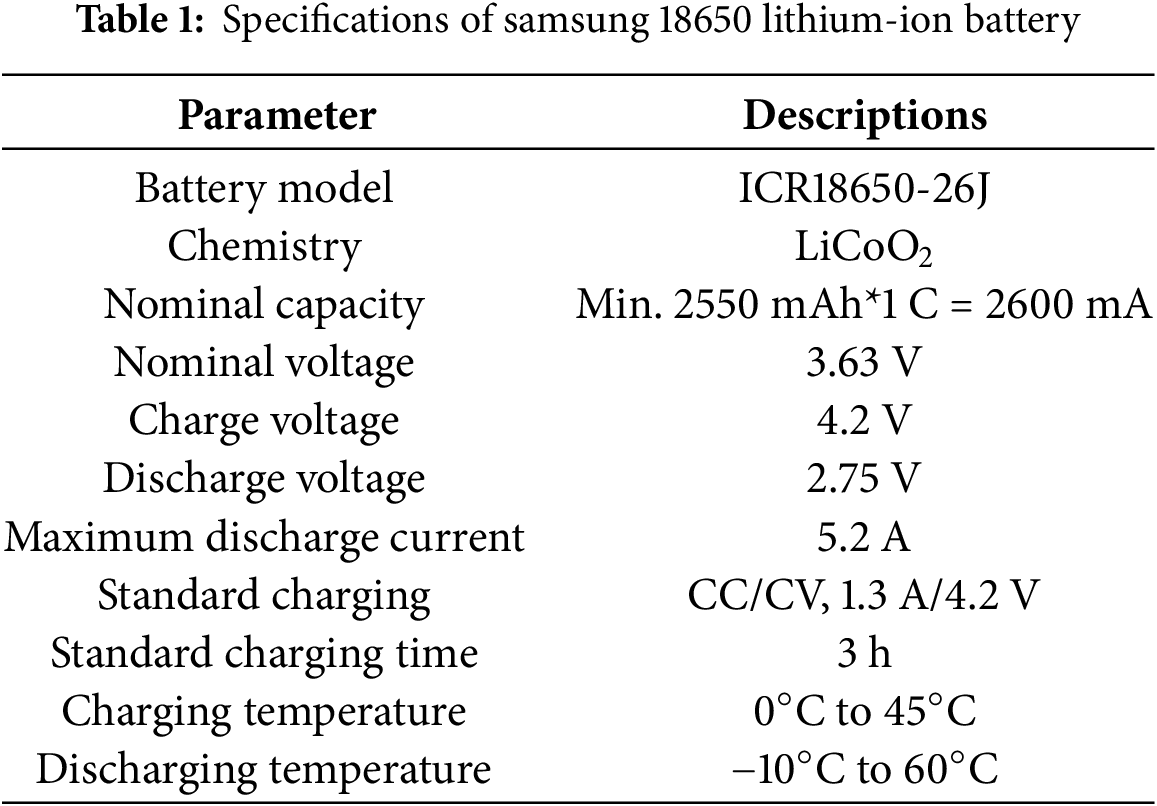
Experiments are conducted using Samsung ICR18650-26J batteries. Two batteries of the same type are selected: one for training data and one for validation data. This setup assesses the feasibility and estimation accuracy of this method across the same type of batteries.
The Samsung 18650 lithium-ion battery was selected for this study, with detailed specifications provided in Table 1. To ensure that new batteries were used, a capacity learning process was first conducted. Batteries with similar impedance characteristics were then selected for the experiments. From a batch of eight identical batteries, two were chosen: one for use in the neural network dataset and the other for validation purposes. All batteries were tested in a 25°C temperature chamber. The selection process involved charging at a constant current of 0.5 C (CC mode) until the battery voltage reached 4.2 V, then switching to constant voltage charging (CV mode) until the charging current dropped below 0.05 C. After a 1-h rest period, the battery was discharged at 0.1 C (constant current discharge) to the rated cutoff voltage of 2.75 V. Following three charge-discharge cycles, the battery underwent electrochemical impedance spectroscopy (EIS) analysis. The initial capacity of each battery was determined by averaging the capacities discharged over the three cycles. After completing the first three charge-discharge cycles, the batteries were fully charged using the CC/CV method, rested for one hour, and then subjected to EIS analysis to complete the selection process.
EIS can be categorized into Static EIS (SEIS) and Dynamic EIS (DEIS). EIS measured during the battery’s charge and discharge process is referred to as DEIS, while EIS measured at the OCV state is referred to as SEIS. Typically, a battery returns to the OCV state approximately one hour after stopping charge or discharge. Prior to collecting dynamic EIS, the initial battery screening was conducted under static conditions, meaning SEIS measurements were taken after the battery had been at rest for more than one hour following the end of charge or discharge. This resulted in the acquisition of static Nyquist plots. The DEIS measurements in this study were conducted in real-time during the discharge process. It is known that, due to the characteristics of the battery, the voltage at the battery terminals during discharge and after resting for one hour to return to the OCV state will differ at the same SOC.
Therefore, it can be inferred that the actual measured Nyquist plots of dynamic and static EIS at the same SOC will differ, as shown in Fig. 3. The figure illustrates comparisons of dynamic and static Nyquist plots at SOC levels of 90%, 50%, and 30%. From the figure, it is evident that there are significant differences between dynamic and static EIS at the same SOC. The radius of the static EIS is larger than that of the dynamic EIS, likely due to varying surface temperatures of the battery during dynamic conditions, which affect the EIS measurements. During dynamic discharge, the battery’s surface temperature gradually increases, whereas it remains relatively stable in static conditions. Temperature variations impact the battery’s internal resistance and electrochemical reaction rates, resulting in notable differences between dynamic and static EIS measurements.
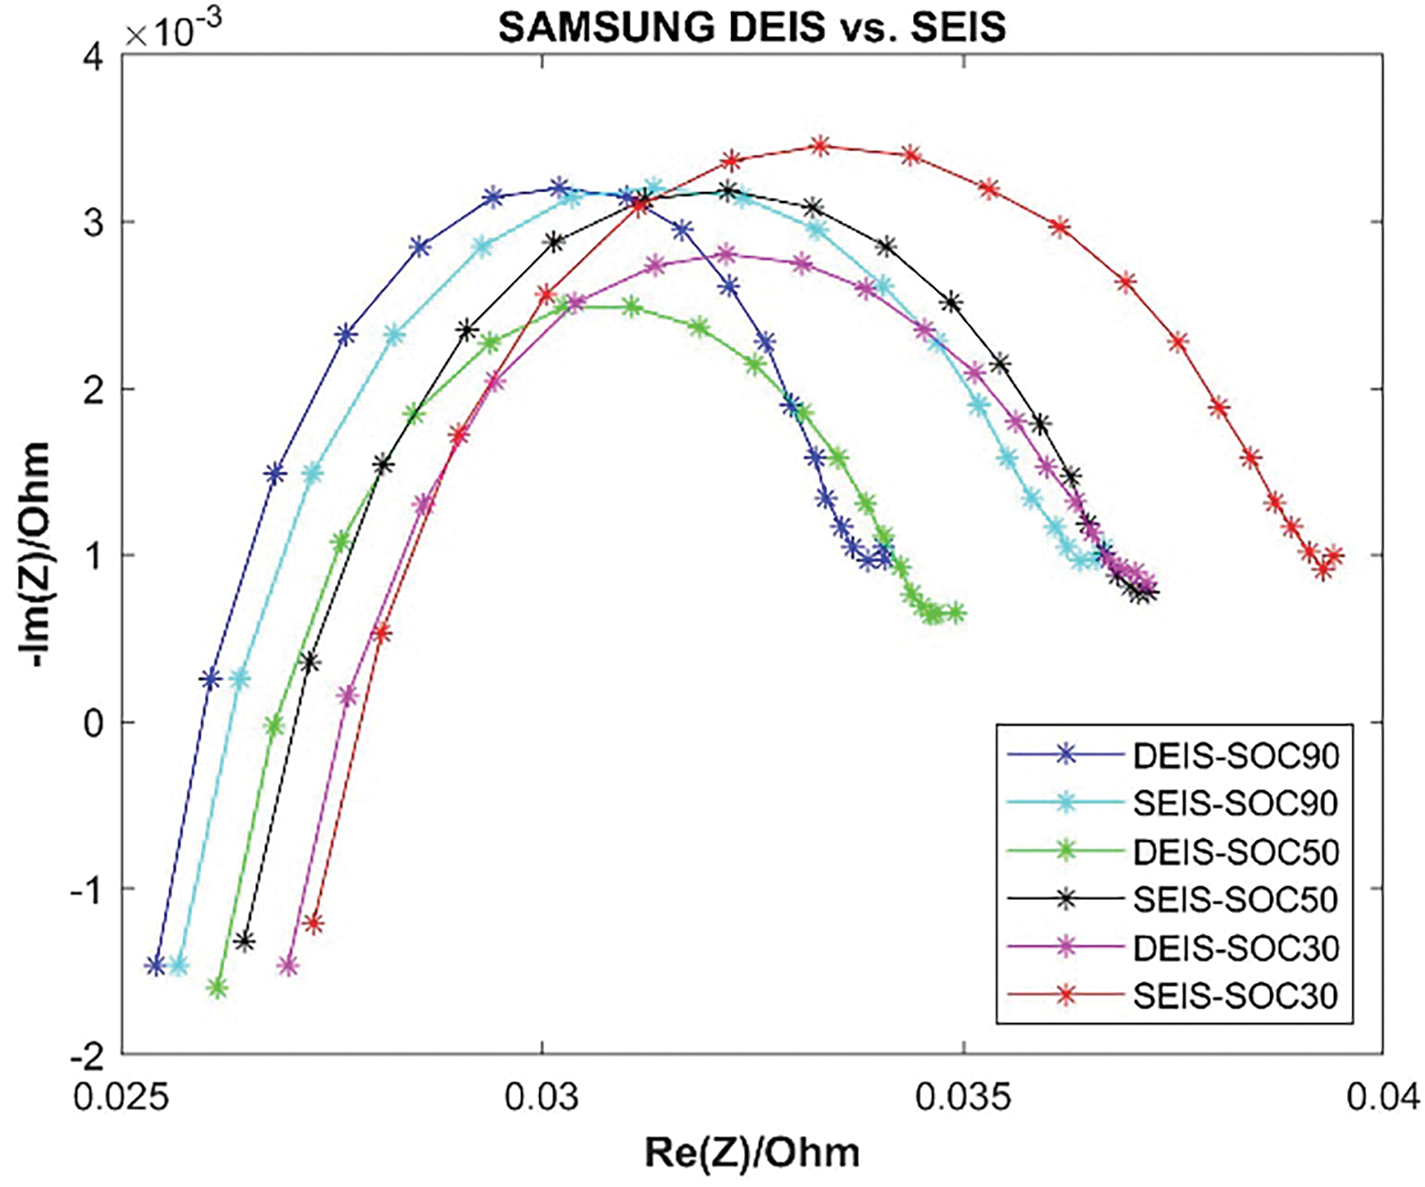
Figure 3: Comparison of dynamic and static nyquist plots at SOC Levels of 90%, 50%, and 30%
During real-time discharge, as the C-rate increases, battery losses also increase, leading to a rise in battery surface temperature. Fig. 4 illustrates dynamic Electrochemical Impedance Spectroscopy (EIS) of lithium batteries discharged at different C-rates (0.2–1.2 C) to SOC equal to 60%. From Fig. 4, it is apparent that all Nyquist plots differ at the same SOC. While dynamic EIS is more complex, static EIS requires a period of rest before measurement, whereas dynamic EIS enables real-time measurement of battery electrochemical characteristics during charge and discharge, providing more immediate SOC estimation. Therefore, for employing dynamic EIS in SOC detection algorithms, discharge C-rate and battery surface temperature must be included as input parameters for training neural network models.
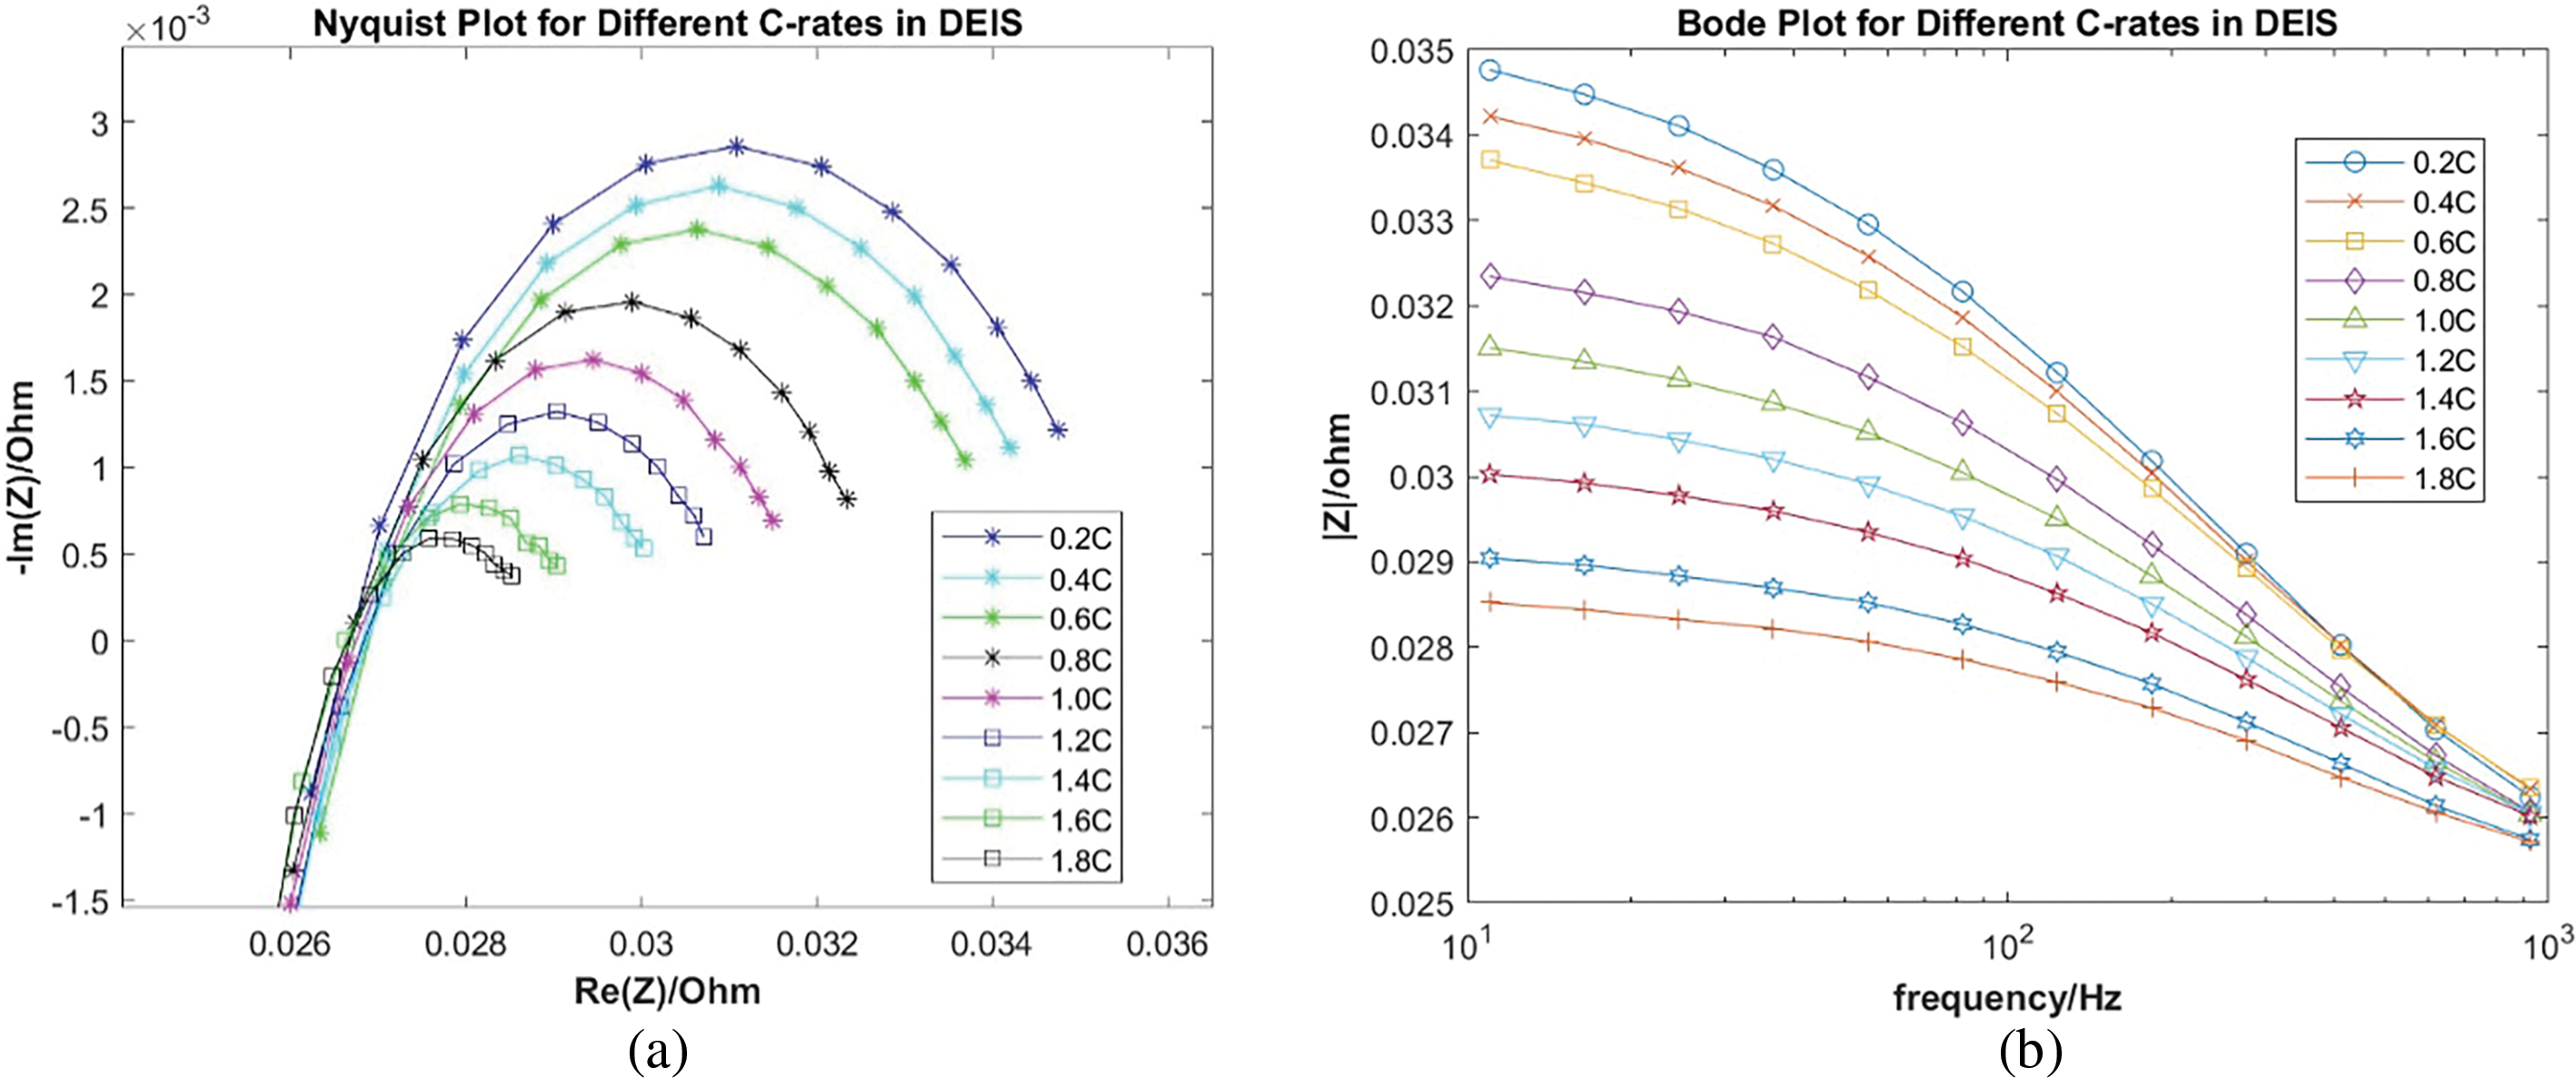
Figure 4: When SOC = 60%, (a) Nyquist comparison of different discharge C-rates. (b) Bode comparison of different discharge C-rates
Dynamic Electrochemical Impedance Spectroscopy (DEIS) refers to the AC impedance measured in real-time conditions of a battery. Previous literature has noted that high-frequency DEIS is less discernible, and low-frequency DEIS often exhibits disturbances in Nyquist plots, appearing as deviations from the ideal 45° line characteristic of static conditions. Therefore, the measurement frequency range for DEIS avoids both high and low-frequency regions. Considering these conditions, this study employed two SAMSUNG batteries for measurement within a frequency range of 924 to 11 Hz. The process flowchart for DEIS collection is depicted in Fig. 5. The subsequent sections will explain each step of the flowchart in detail:
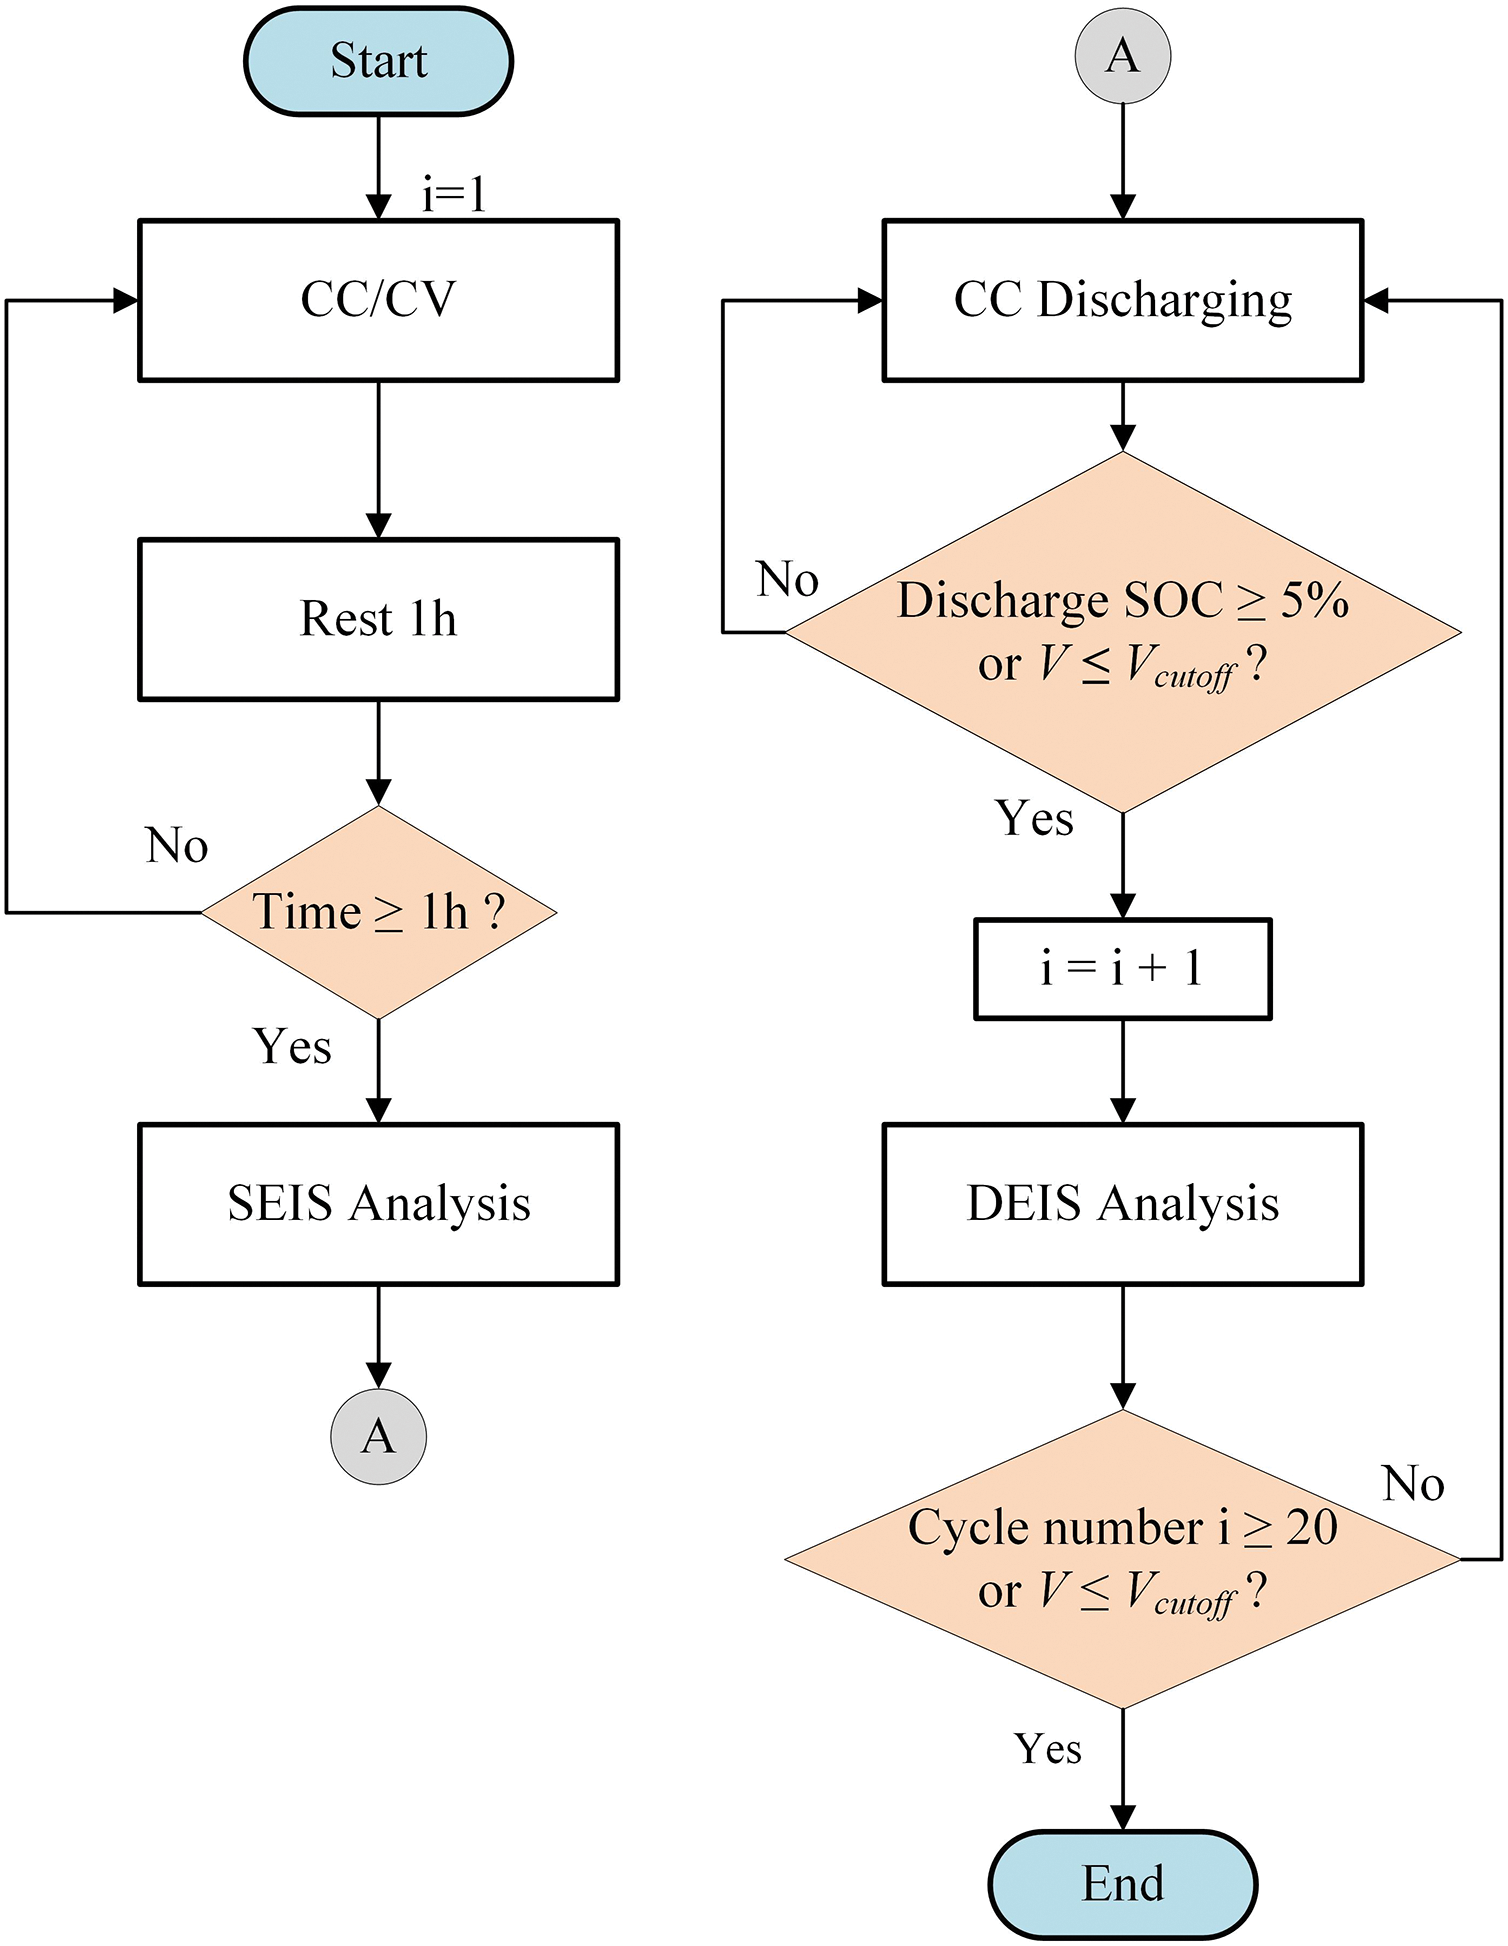
Figure 5: EIS collection flowchart
CC/CV charging: CC at 0.5 C, CV at 4.2 V, cutoff current at 0.05 C (Initial cycle number i is equal to 1).
Step1. Rest: Rest 1 h.
Step2. SEIS measure: The paper adopts a sinusoidal voltage perturbation signal ranging from 0.1 Hz to 10 kHz with 6 points per decade and a 10 mV amplitude.
Step3. CC discharge: Discharge currents range from 0.2 to 1.8 C, in increments of 0.2 C, totaling 9 discharge C-rates.
Step4. Voltage termination check: Is the terminal voltage less than the cutoff voltage? If no, proceed to step 6; if yes, proceed to step 7.
Step5. SOC determination: Is the SOC discharge greater than or equal to 5%? If no, return to step 4; if yes, proceed to step 7.
Step6. DEIS measure: The paper adopts a sinusoidal voltage perturbation signal ranging from 0.1 Hz to 10 kHz with 6 points per decade and a 10 mV amplitude.
Step7. Cycle count (i) and voltage termination check: Is the cycle count (i) greater than or equal to 20? Or is the terminal voltage less than or equal to the cutoff voltage? If no, return to step 4; if yes, terminate.
2.5 Frequency Selection of the Magnitude of Impedance |Z|
From the aforementioned experimental procedures, dynamic AC impedance of the battery at different discharge C-rates from 95% to 0% SOC can be obtained. The results will be presented in Nyquist plots, as shown in Fig. 6. The figure displays the Nyquist plot of a Battery 1 discharged at 0.2 C constant current. From DEIS measurements, |Z|,

Figure 6: SAMSUNG 0.2 C discharge Battery 1 using DEIS
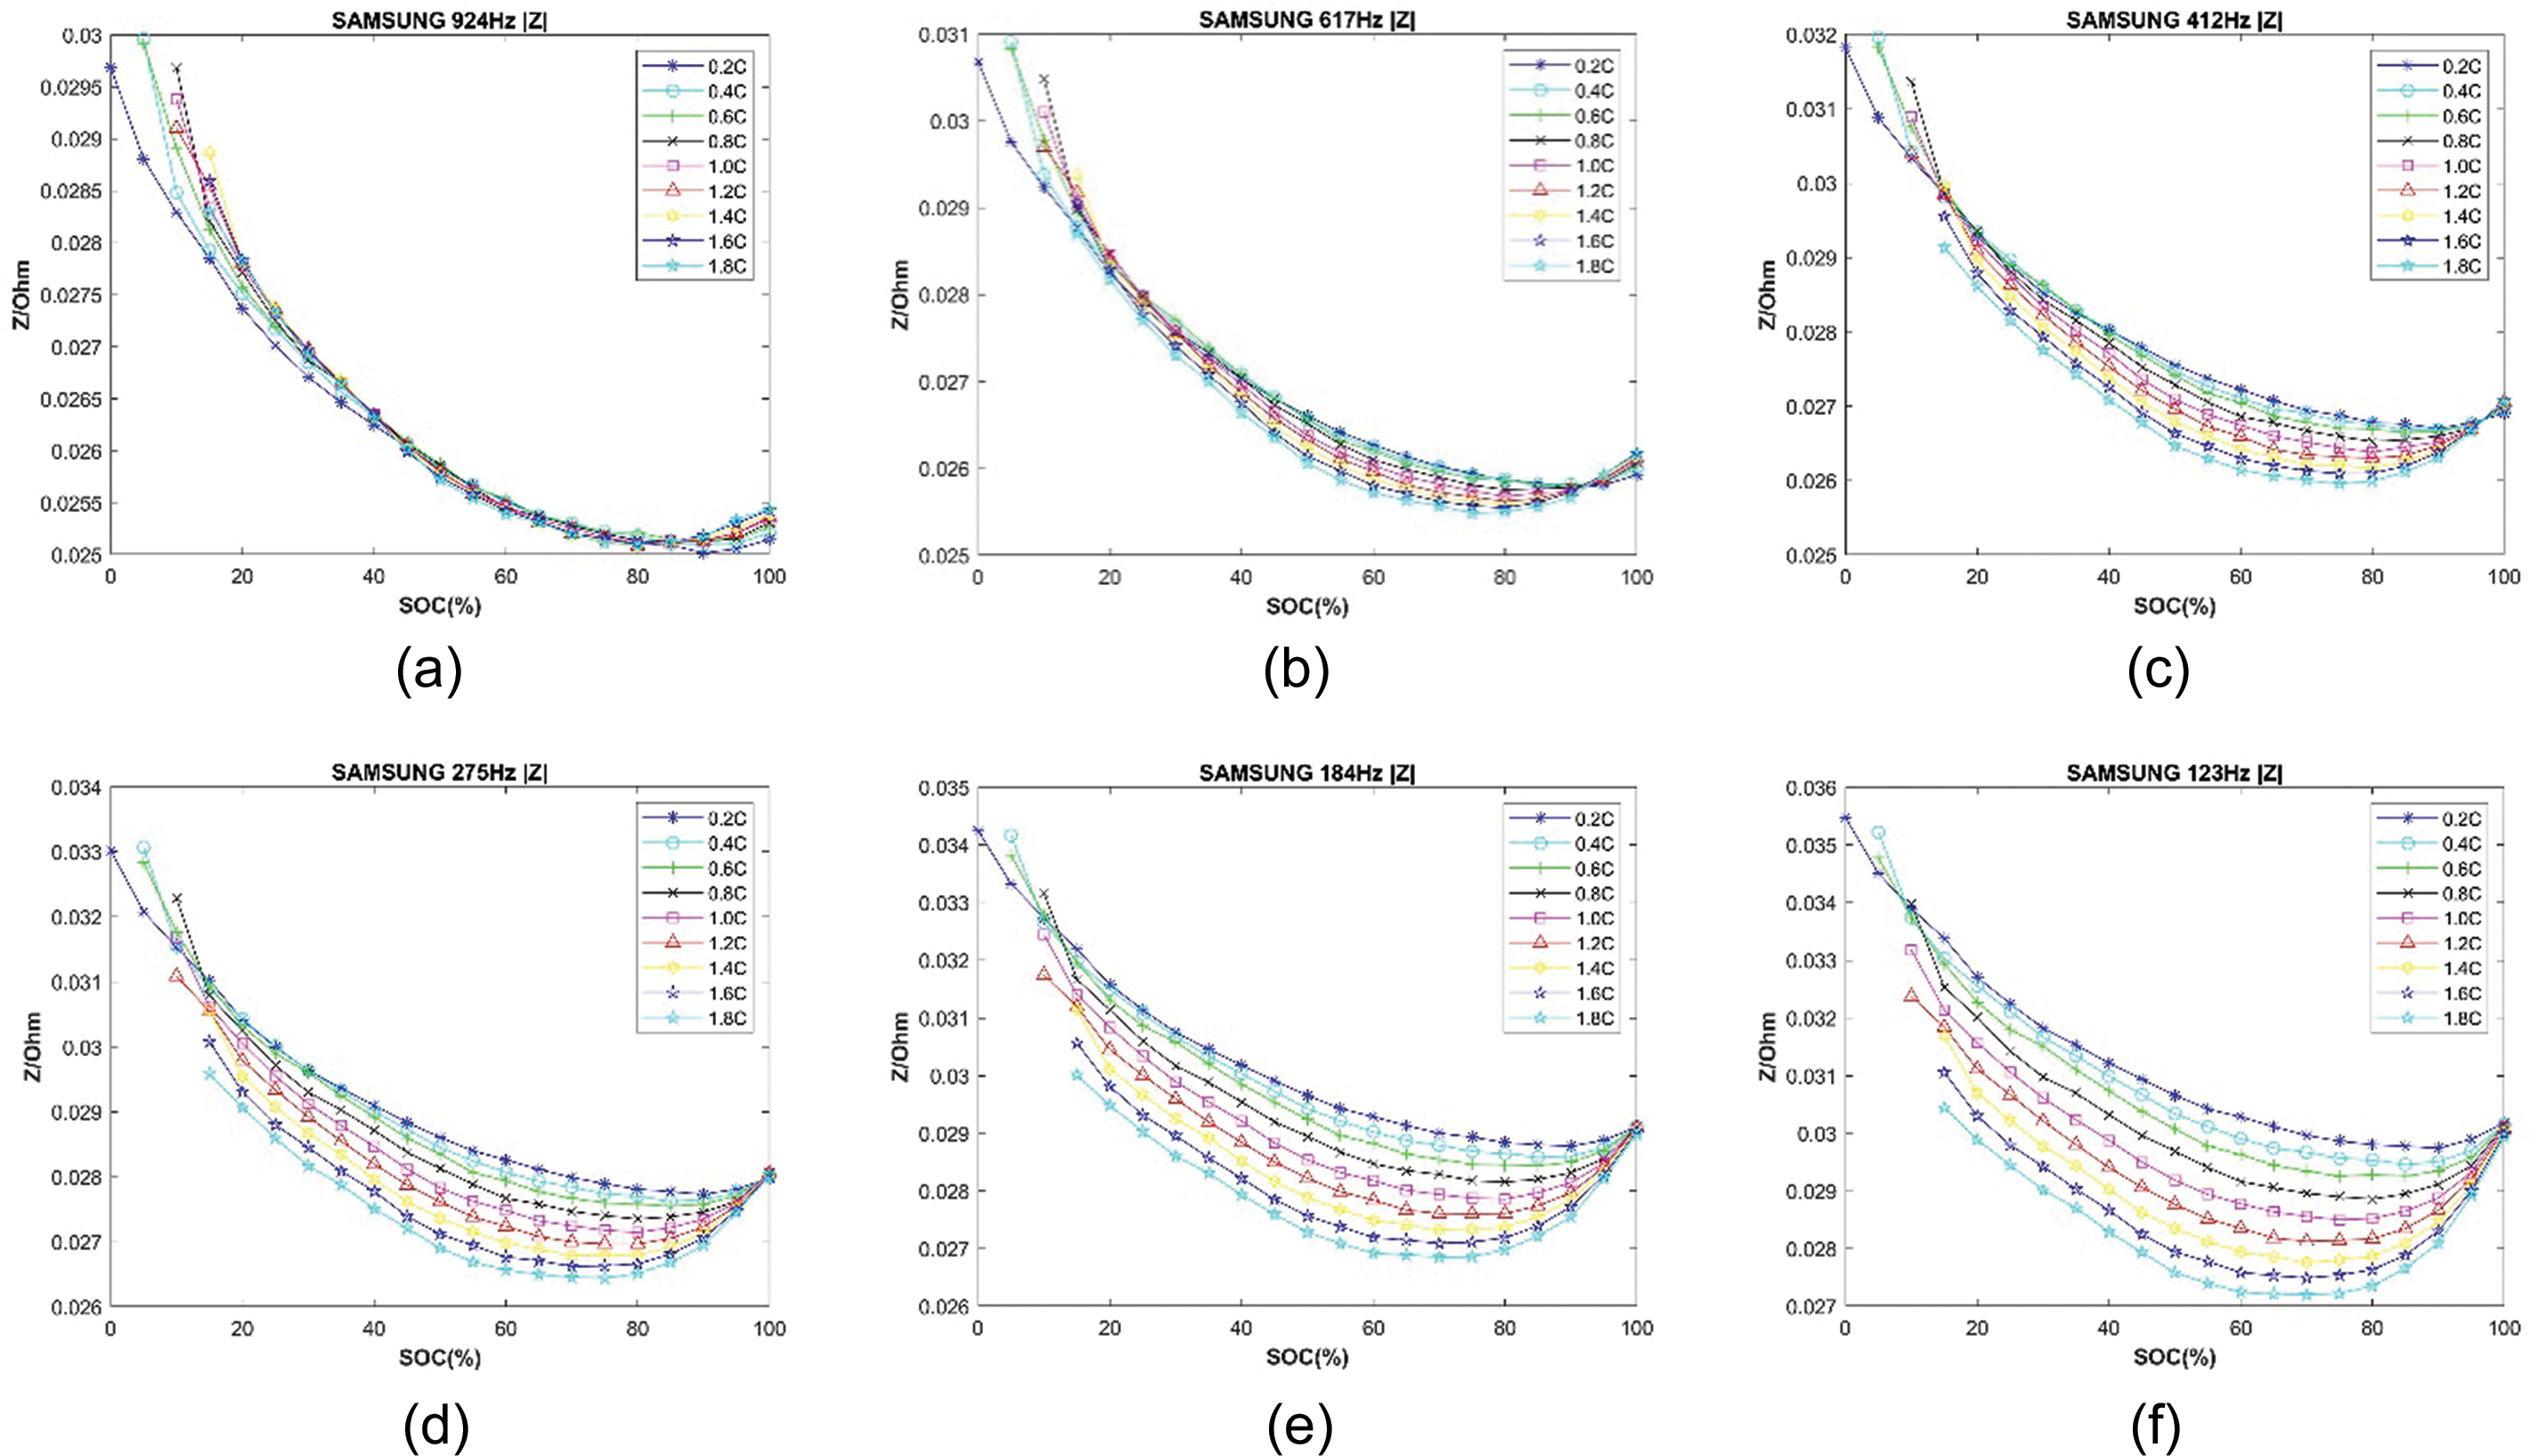
Figure 7: Magnitude of |Z| obtained for each C-rate of Battery 1. (a) at fn_12 = 924 Hz; (b) at f n_11 = 617 Hz; (c) at f n_10 = 412 Hz; (d) at f n_9 = 275 Hz; (e) at f n_8 = 184 Hz; (f) at f n_7 = 123 Hz
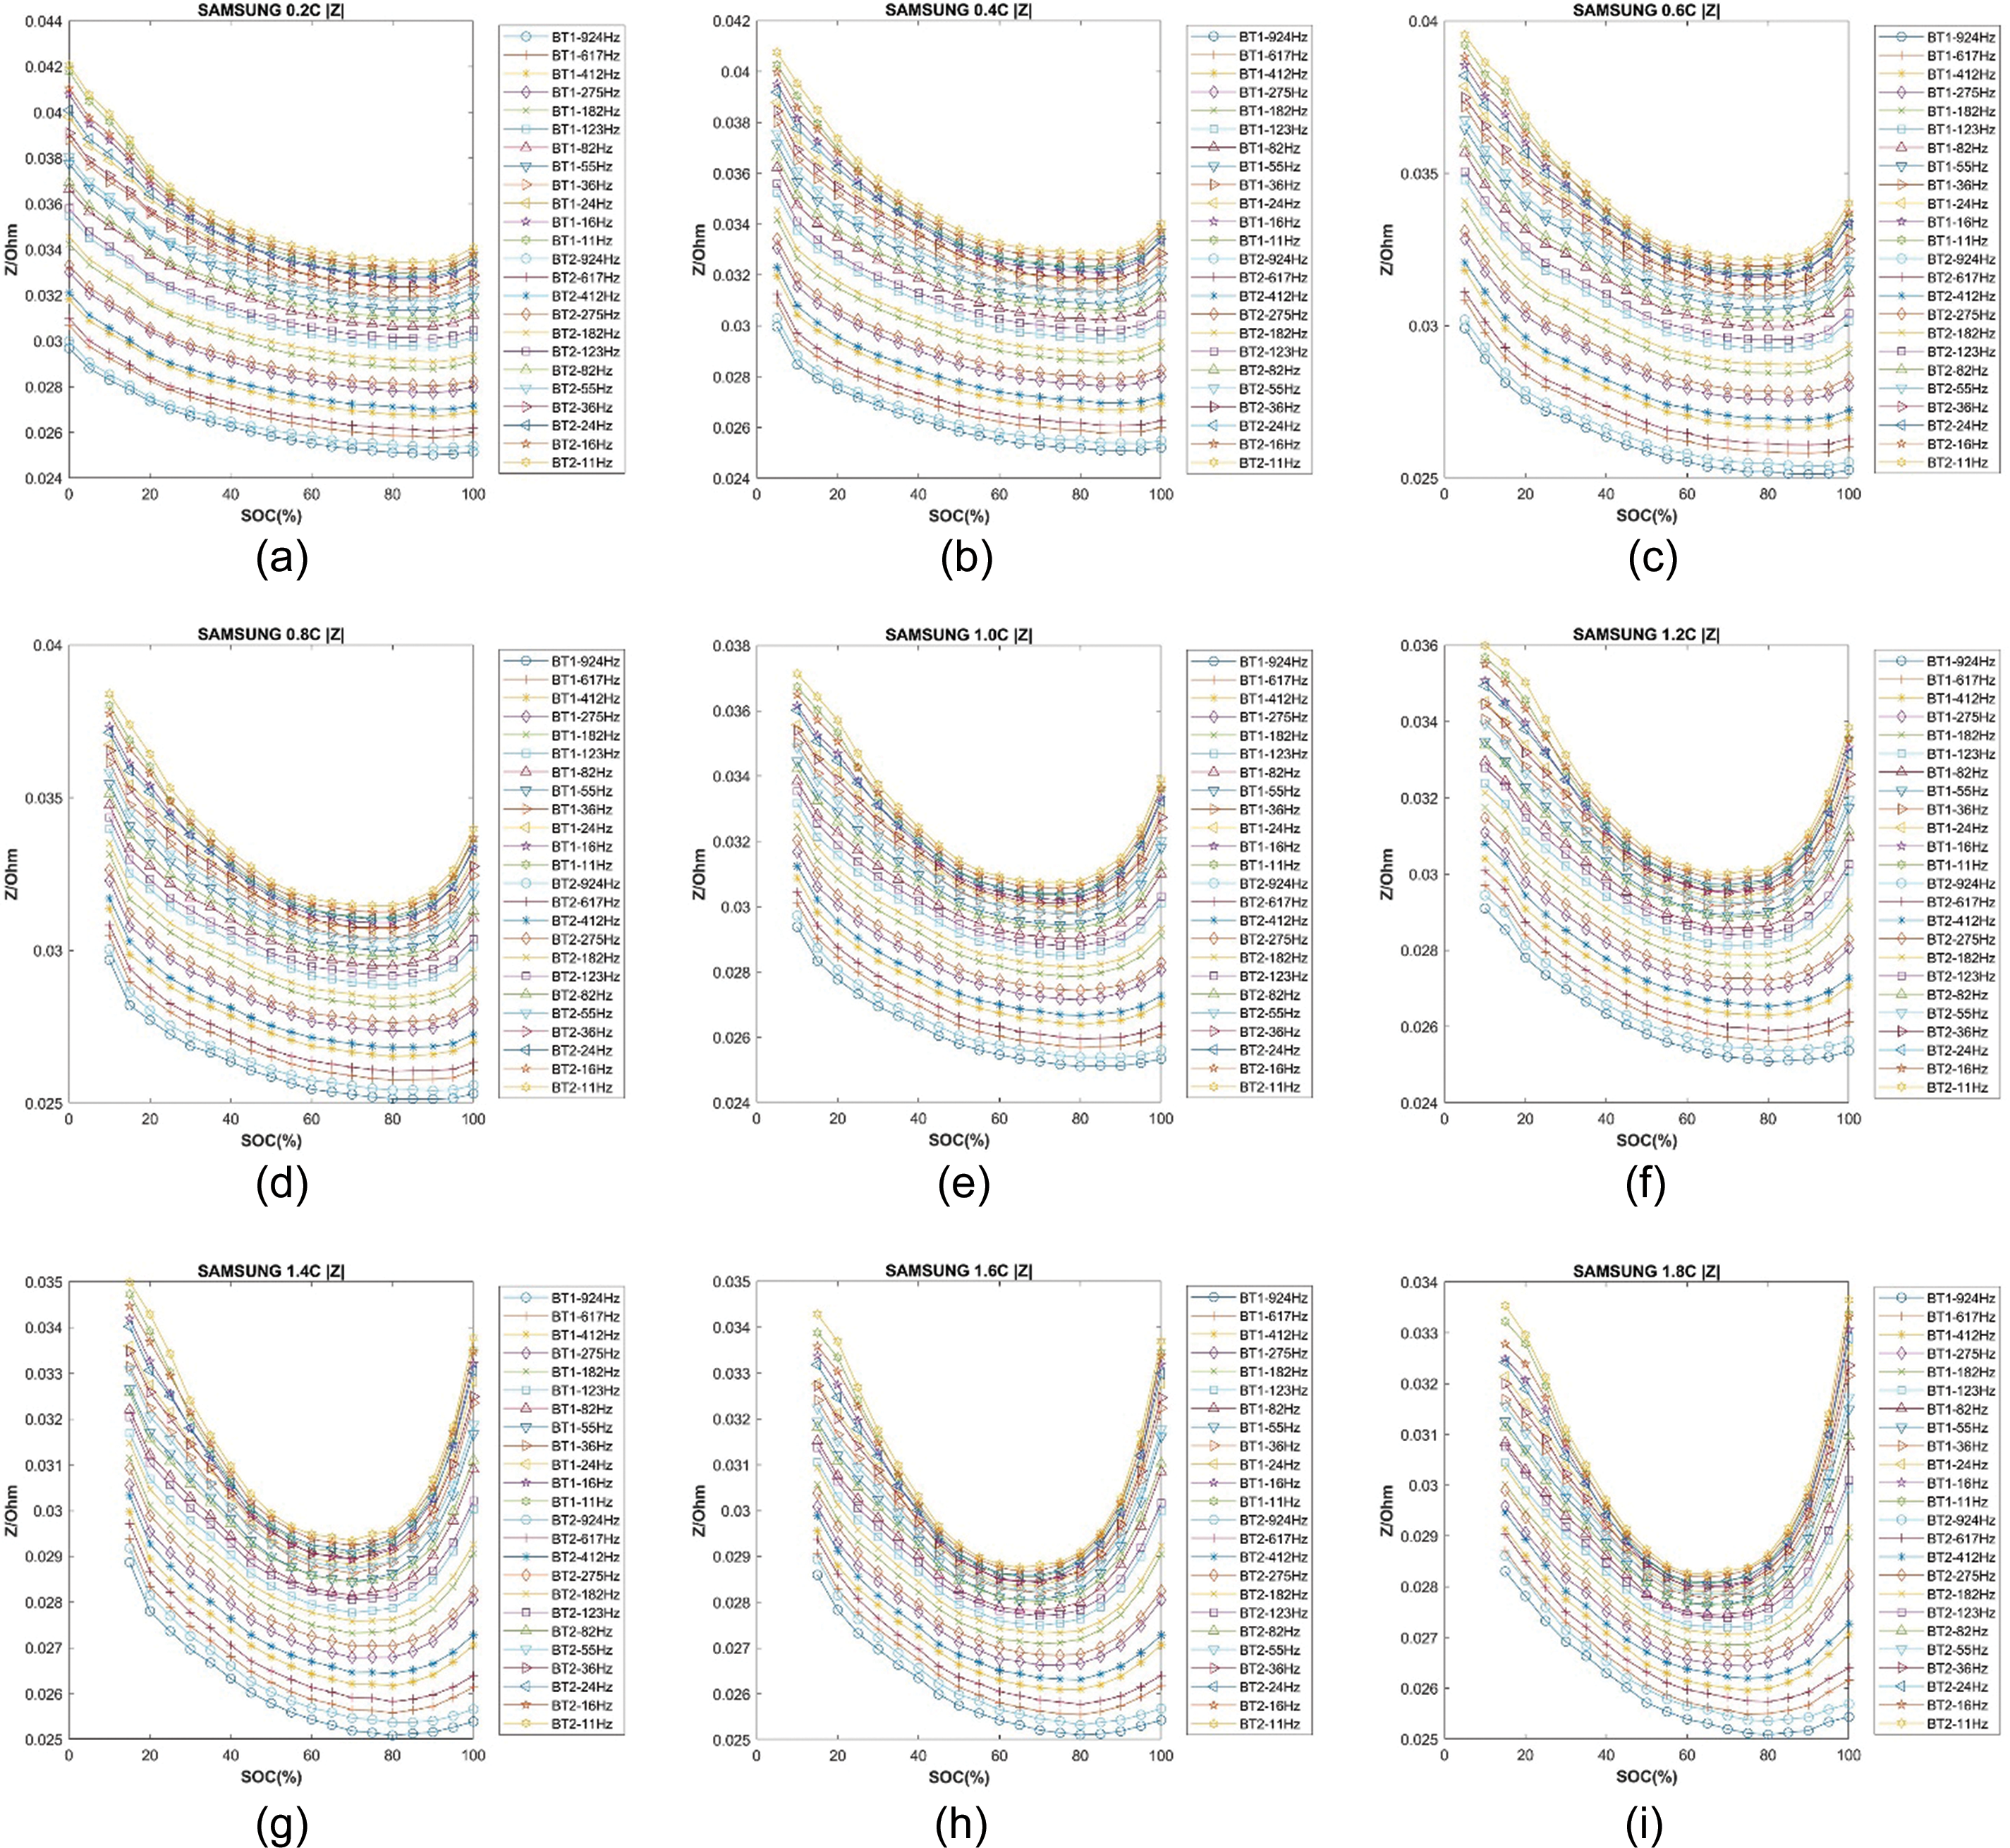
Figure 8: Magnitude of |Z| of Battery 1 and Battery 2. (a) at 0.2 C; (b) at 0.4 C; (c) at 0.6 C z; (d) at 0.8 C; (e) at 1.0 C; (f) 1.2 C; (g) 1.4 C; (h) 1.6 C; (i) 1.8 C
3 Artificial Neural Network Establishment
Firstly, sequentially introduce the establishment and training process of the artificial ANN, as depicted in Fig. 9. The detailed steps are explained as follows.
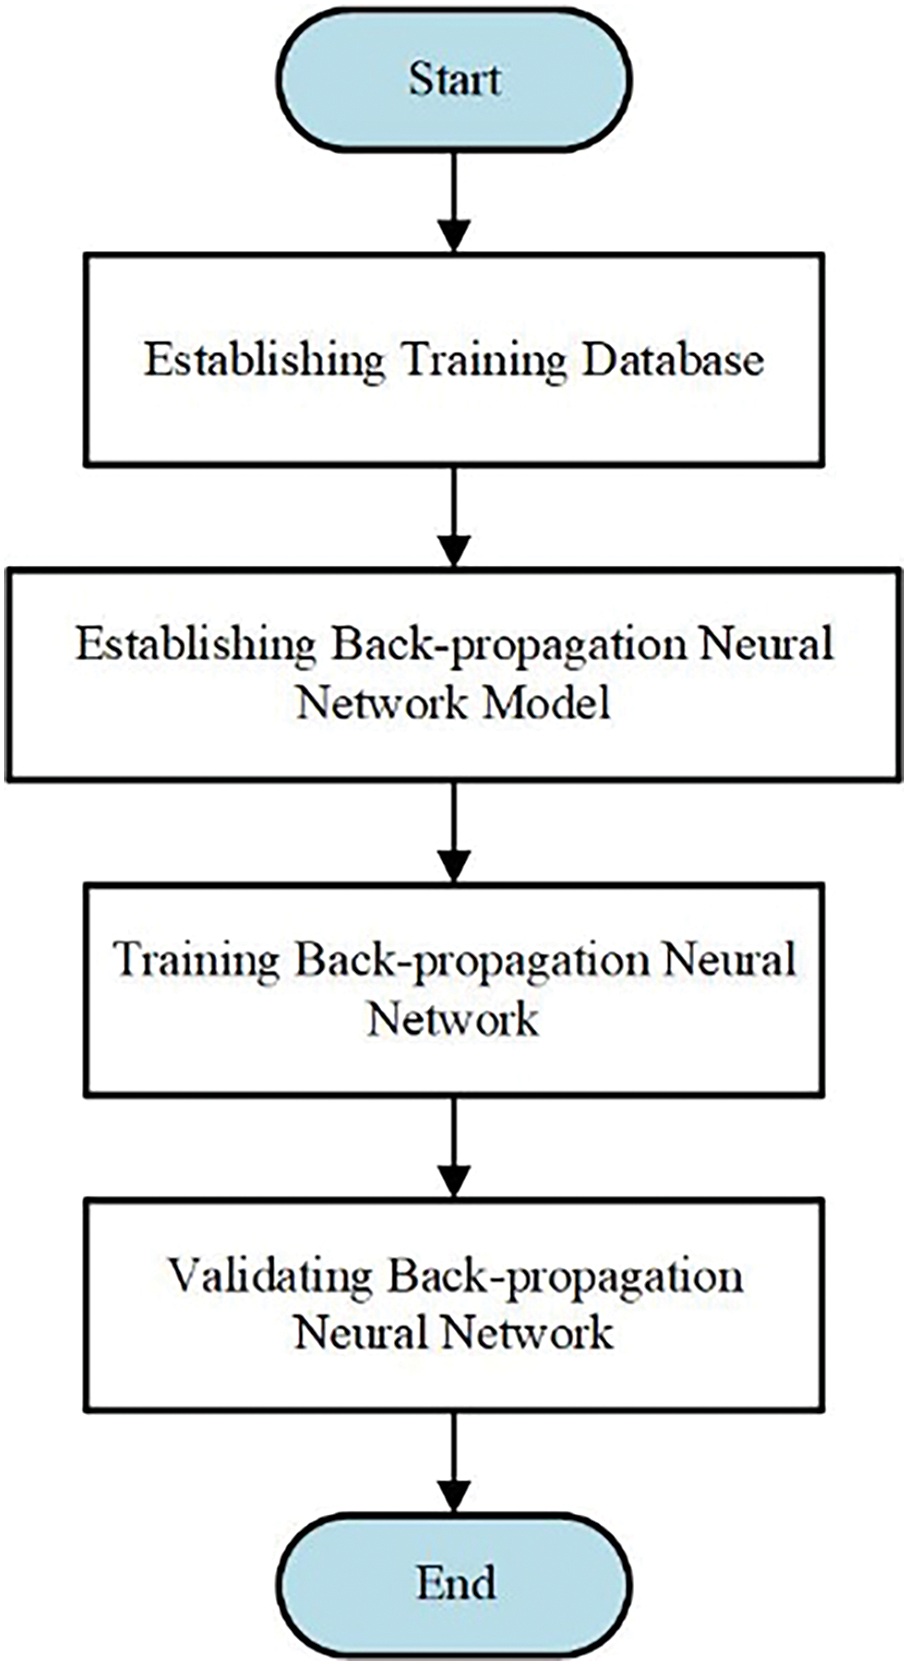
Figure 9: Flowchart of neural network establishment and training
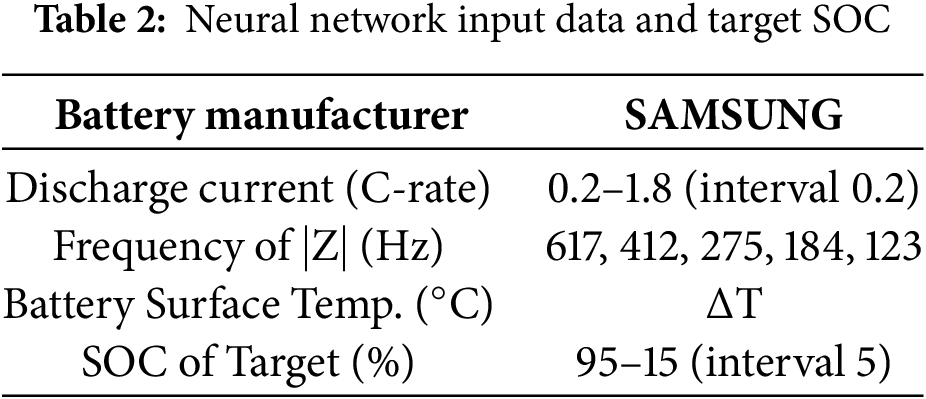
During discharge, higher C-rates result in faster voltage reaching the cutoff voltage. Using Samsung batteries discharged at 1.4 C as an example, they reach the cutoff voltage at SOC 15%. Therefore, subsequent neural network estimations only consider SOC up to 15%. Additionally, SOC 100% under different discharge currents always corresponds to fully charged states is not included in the estimation range. Experimental battery data and neural network estimation ranges are summarized in Table 2. Battery 1 is used for training data, while Battery 2 validates experimental results. Both training and validation data include discharge C-rates: 0.2–1.8 C (incremented by 0.2 C), impedance |Z| at 5 frequency points, and battery surface temperature rise (ΔT). The neural network aims to estimate SOC from 95% to 15% in 5% increments. The neural network input data is a matrix of [7 × 153], and the target SOC is a matrix of [1 × 153].
3.2 Backpropagation Neural Network Model
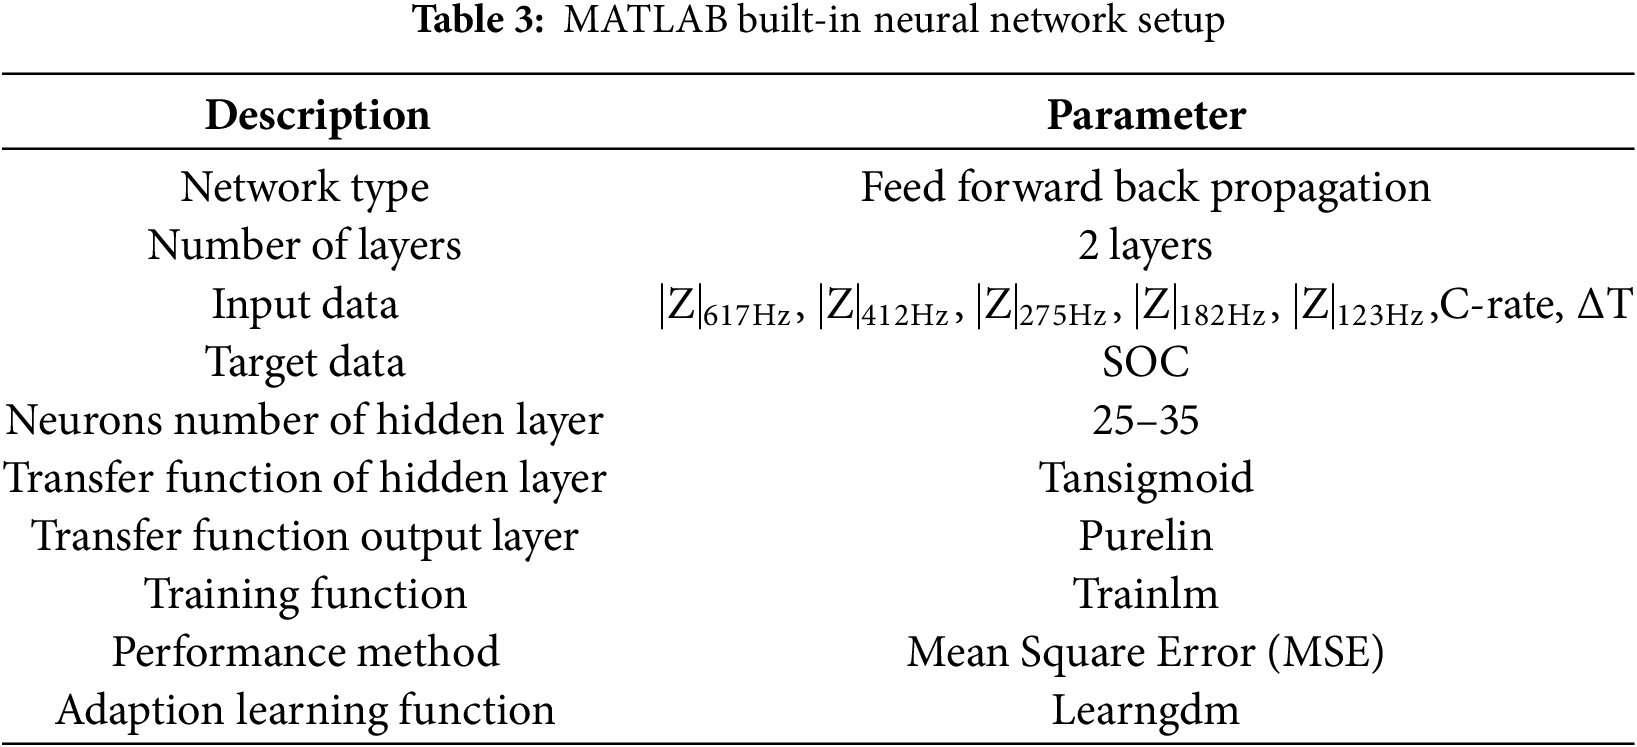
The neural network architecture selected for this study is illustrated in Fig. 10 and detailed in Table 3. A feed-forward backpropagation neural network was employed with training function Trainlm and adaptive learning function Learngdm. The input layer consists of 7 variables: discharge current C-rate, impedance |Z| at 5 different frequency points, and battery surface temperature rise (ΔT). The output layer predicts SOC. The hidden layer comprises 25 to 30 neurons, utilizing the Tansig transfer function f1 to introduce non-linearity and scale inputs to a range of −1 to 1. Tansig limits and compresses input parameters before passing them to the next layer of neurons. The output layer employs the Purelin transfer function as f2, chosen for its computational efficiency and ease of hardware implementation. The performance function used is Mean Squared Error (MSE). Among various backpropagation training methods, Trainlm was selected for its efficiency and effectiveness in this study.
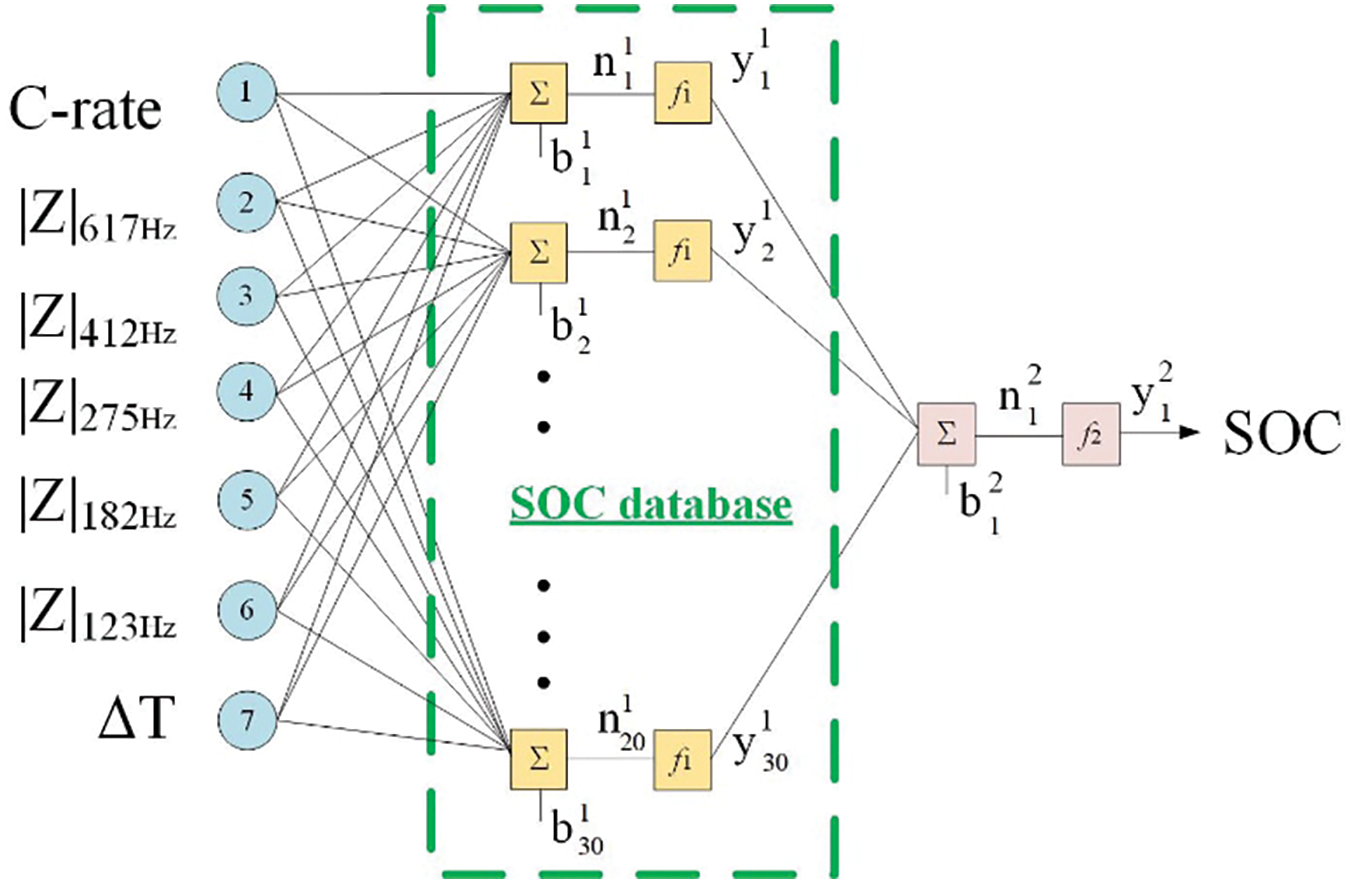
Figure 10: Neural network architecture for SAMSUNG battery
Firstly, summarize the training data and the targeted estimated SOC values, along with the input and output dimensions of the two batteries, as shown in Table 4. Next, linear regression was employed to assess and analyze the results of the backpropagation neural network model used in this study. The coefficient of determination R, closer to 1, indicates higher accuracy of the results, as shown in Table 5. Upon completion of the backpropagation neural network training, the training convergence plot is obtained, depicted in Fig. 11, From the plot, it is observed that Battery 1 achieves the optimal MSE of 0.74664 after 42 training iterations.
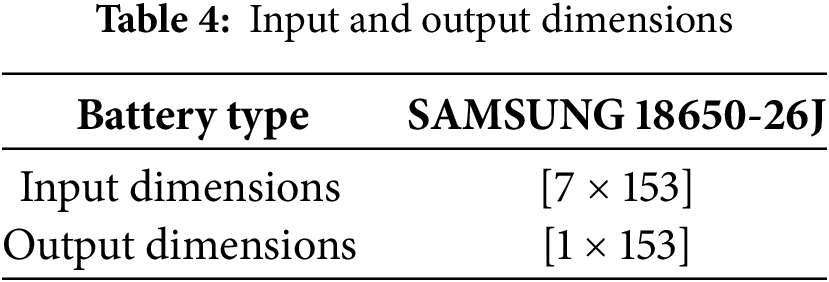
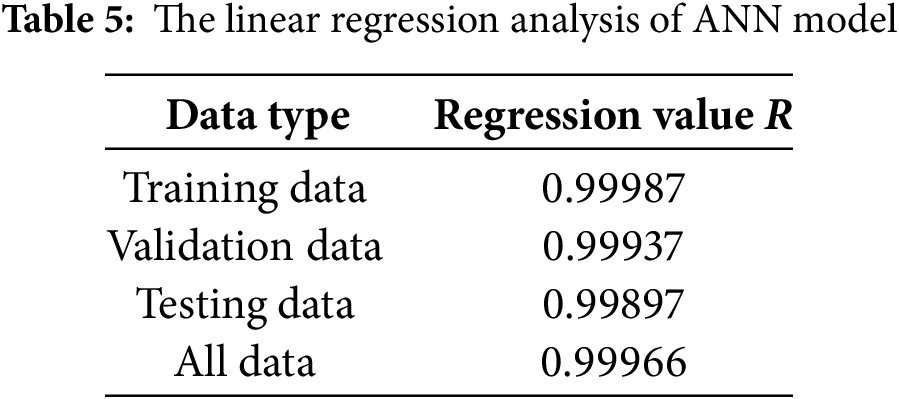
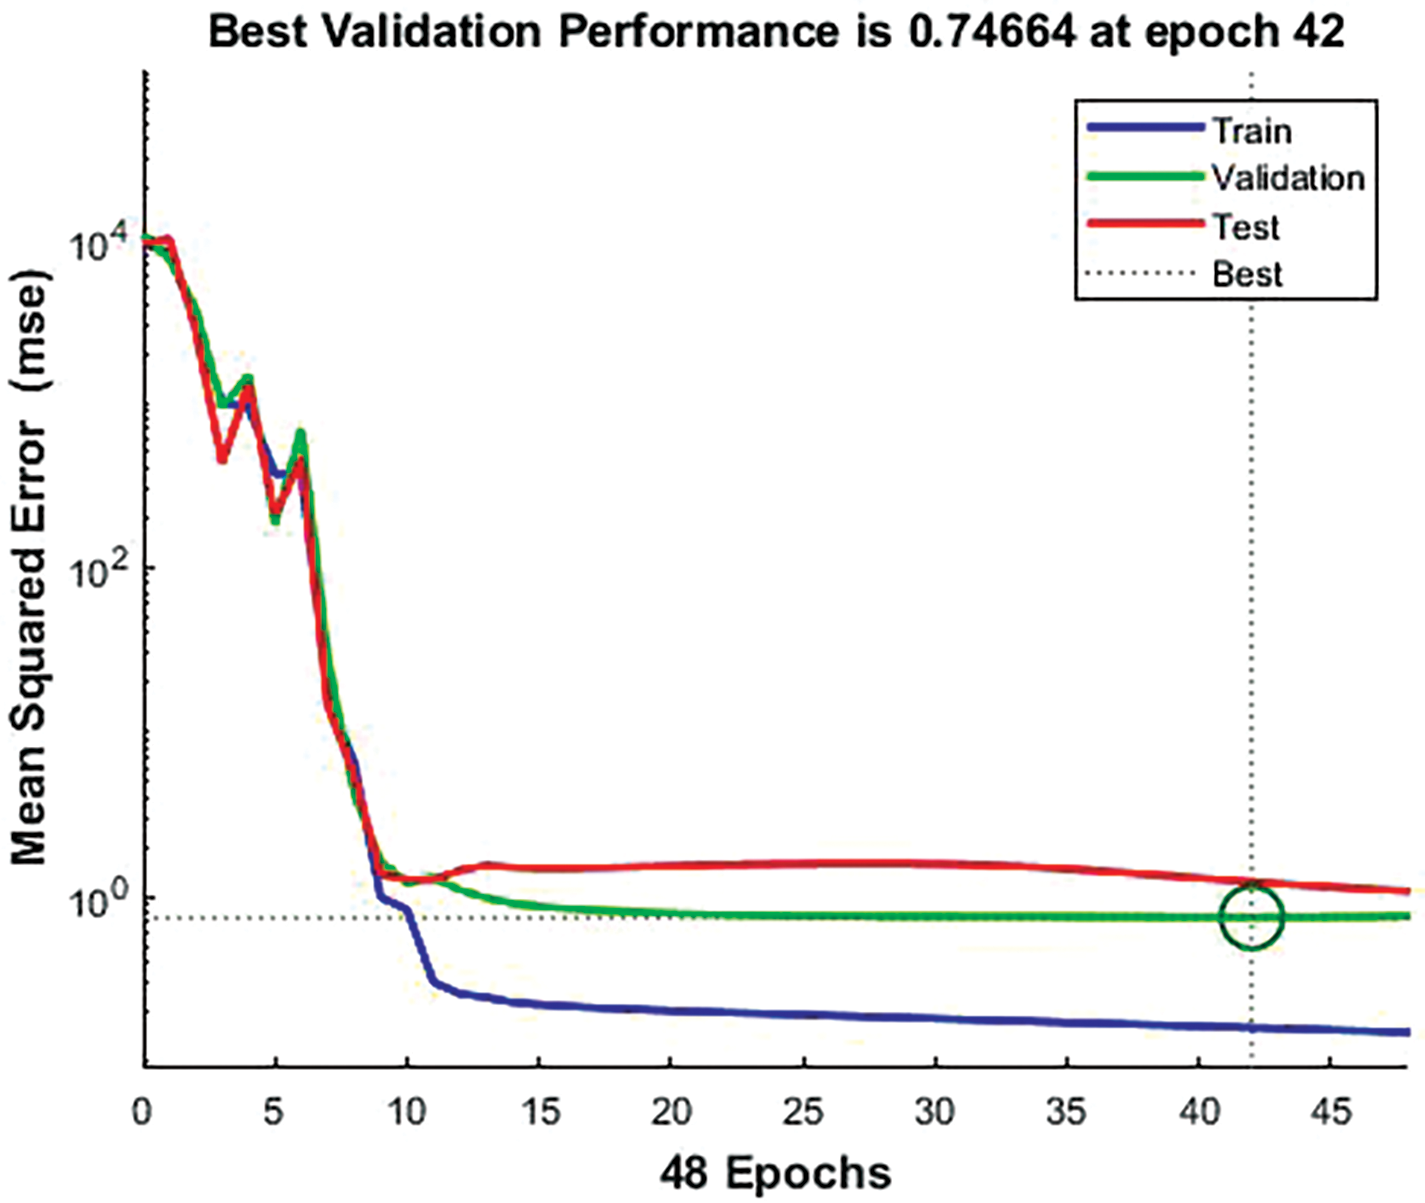
Figure 11: Convergence plot of neural network for Battery 1
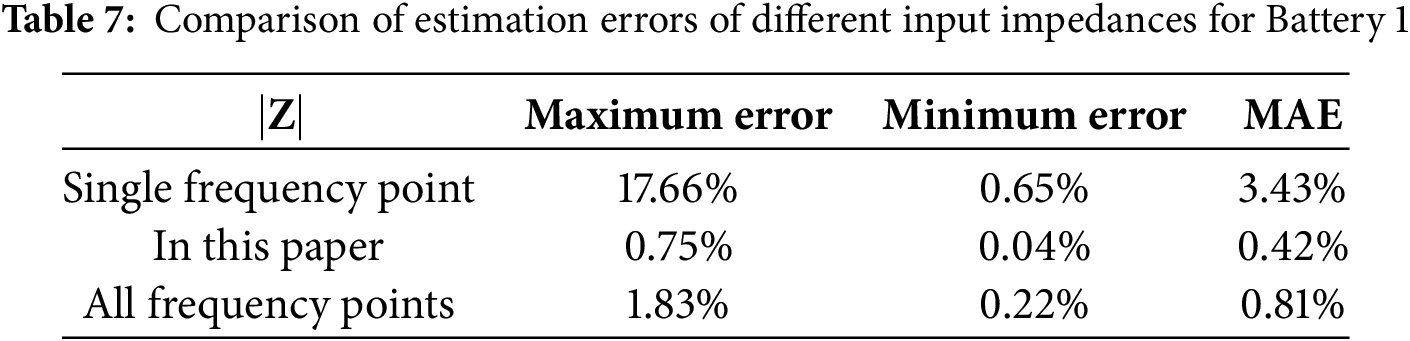
The validation approach in this study involves using the trained neural network to first perform self-validation on Battery 1. If the trained network fails to achieve the expected estimated SOC values when validating against the input training data, it indicates training failure and necessitates starting over from scratch. The trained network is compared using Eqs. (3) and (4), and the network with the smallest overall mean absolute error (MAE) value is used for validation on Battery 2. Initially, Battery 1 is used to complete the backpropagation neural network training following the steps outlined above, followed by self-validation. The number of hidden layer nodes influences the accuracy of the estimation; therefore, this study tests three different numbers of neurons: 25, 30, and 35. The absolute error (AE) of the estimated SOC obtained from self-validation is calculated, and the MAE across different C-rates is determined. The formulas for AE and MAE are shown in Eqs. (3) and (4), respectively. Fig. 12 and Table 6 illustrate the MAE differences in SOC estimation for Battery 1 using three different numbers of neurons in the hidden layer. From the figure and table, it is evident that the overall MAE is best when the number of neurons is 30, with the smallest estimation errors observed across the SOC range from 95% to 15%. Consequently, the hidden layer in this study is set to 30 neurons. Apart from C-rate and temperature, which are essential inputs, the optimal design of the input layer also requires selecting the five most discriminative frequency points of |Z|. This selection is compared with using 12 frequency points of |Z| and a single most discriminative frequency point of |Z|. As shown in Fig. 13 and Table 7 for Battery 1, the five selected frequency points of |Z| result in a lower MAE compared to using a single frequency point or all 12 frequency points of |Z|.
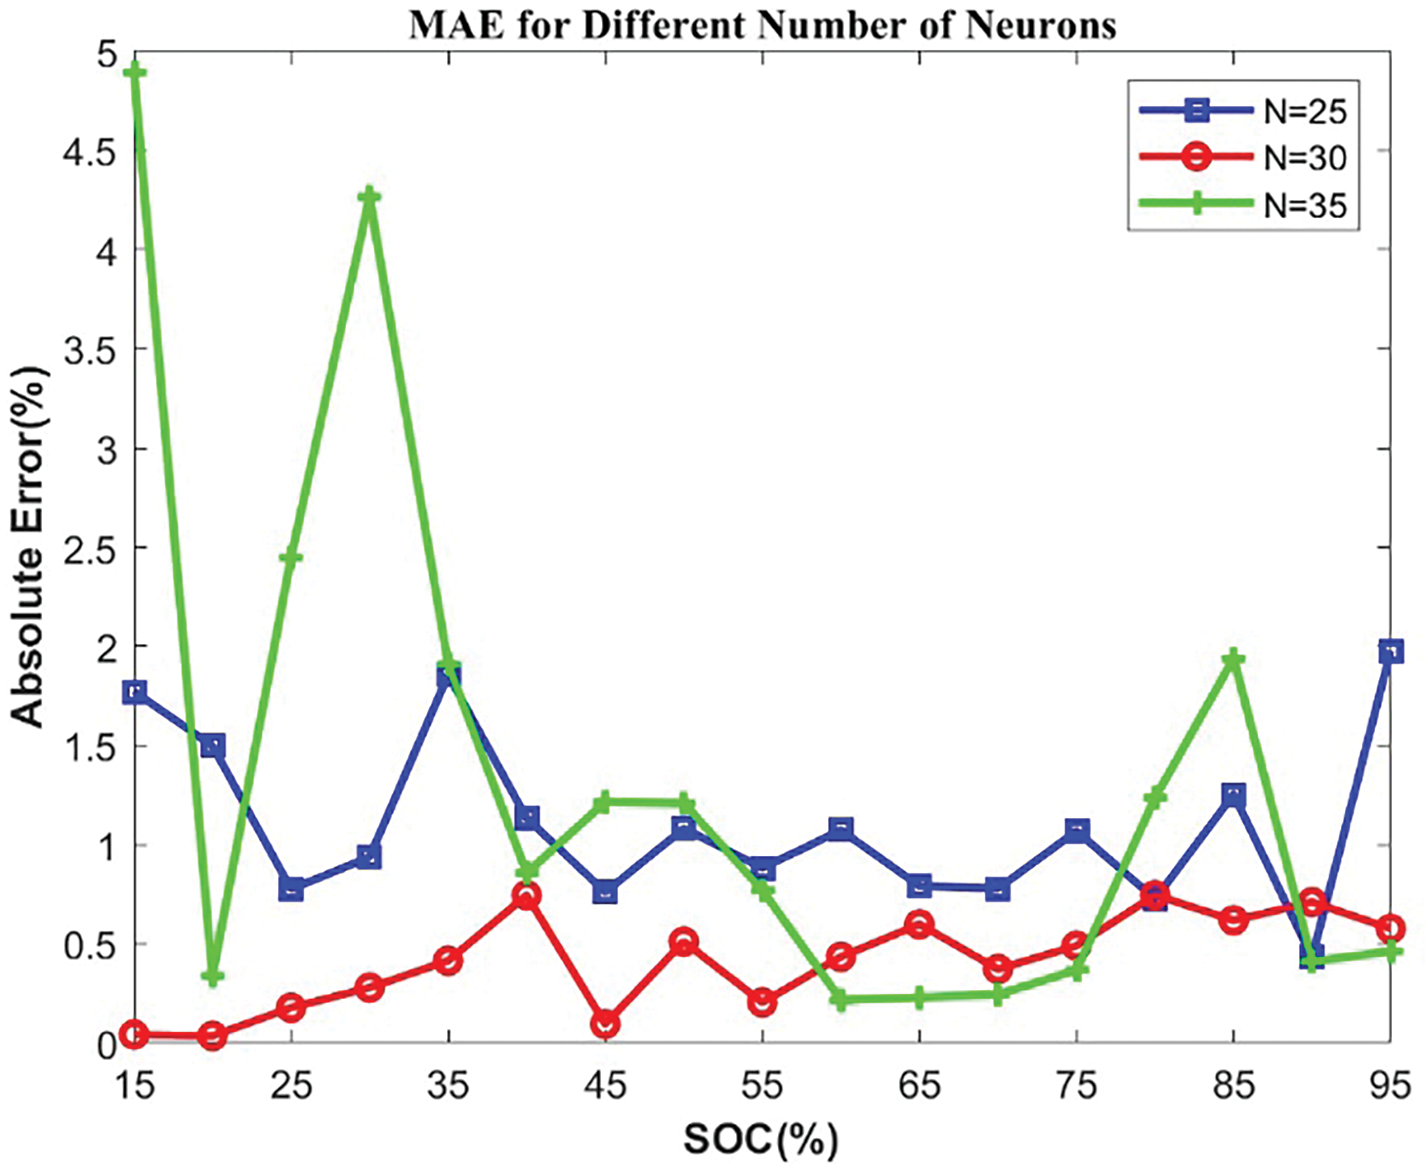
Figure 12: MAE for different numbers of neurons for Battery 1
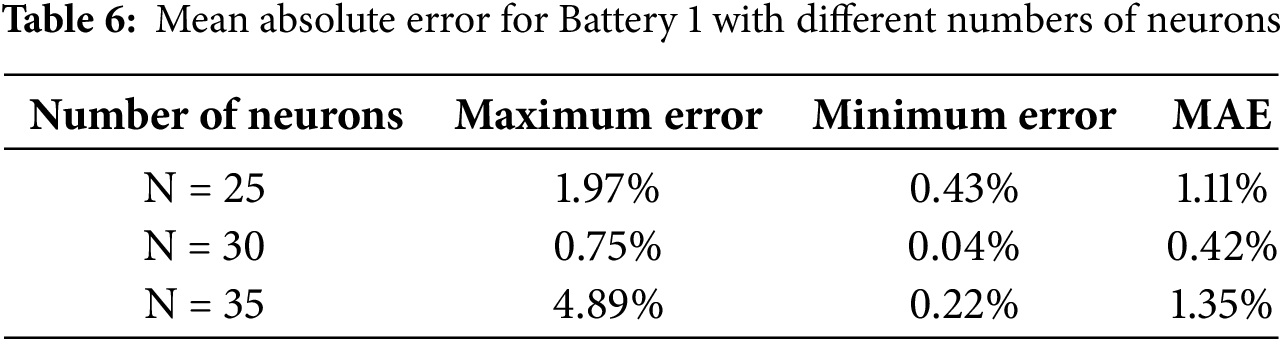

Figure 13: Comparison of estimation errors with different impedance inputs for Battery 1
The training and validation data for the neural network are obtained through electrochemical impedance spectroscopy (EIS) analysis. Subsequently, the neural network is trained and validated. Battery 1 is used for self-validation to ensure that the trained network does not exhibit significant deviations when tested against the training data. Battery 2 is used for validation to confirm the accuracy of the trained neural network. Figs. 14 and 15 present the self-validation results and AE plots for Battery 1 across 0.2 to 1.8 C. Figs. 16 and 17 show the secondary validation results and AE plots for Battery 2 across the same range of 0.2 to 1.8 C. Fig. 18 and Table 8 compare the MAE results between Battery 1 and Battery 2.

Figure 14: Self-validation results of Battery 1 at different C-rates

Figure 15: AE of self-validation results for Battery 1 at different C-rates

Figure 16: Self-validation results of Battery 2 at different C-rates
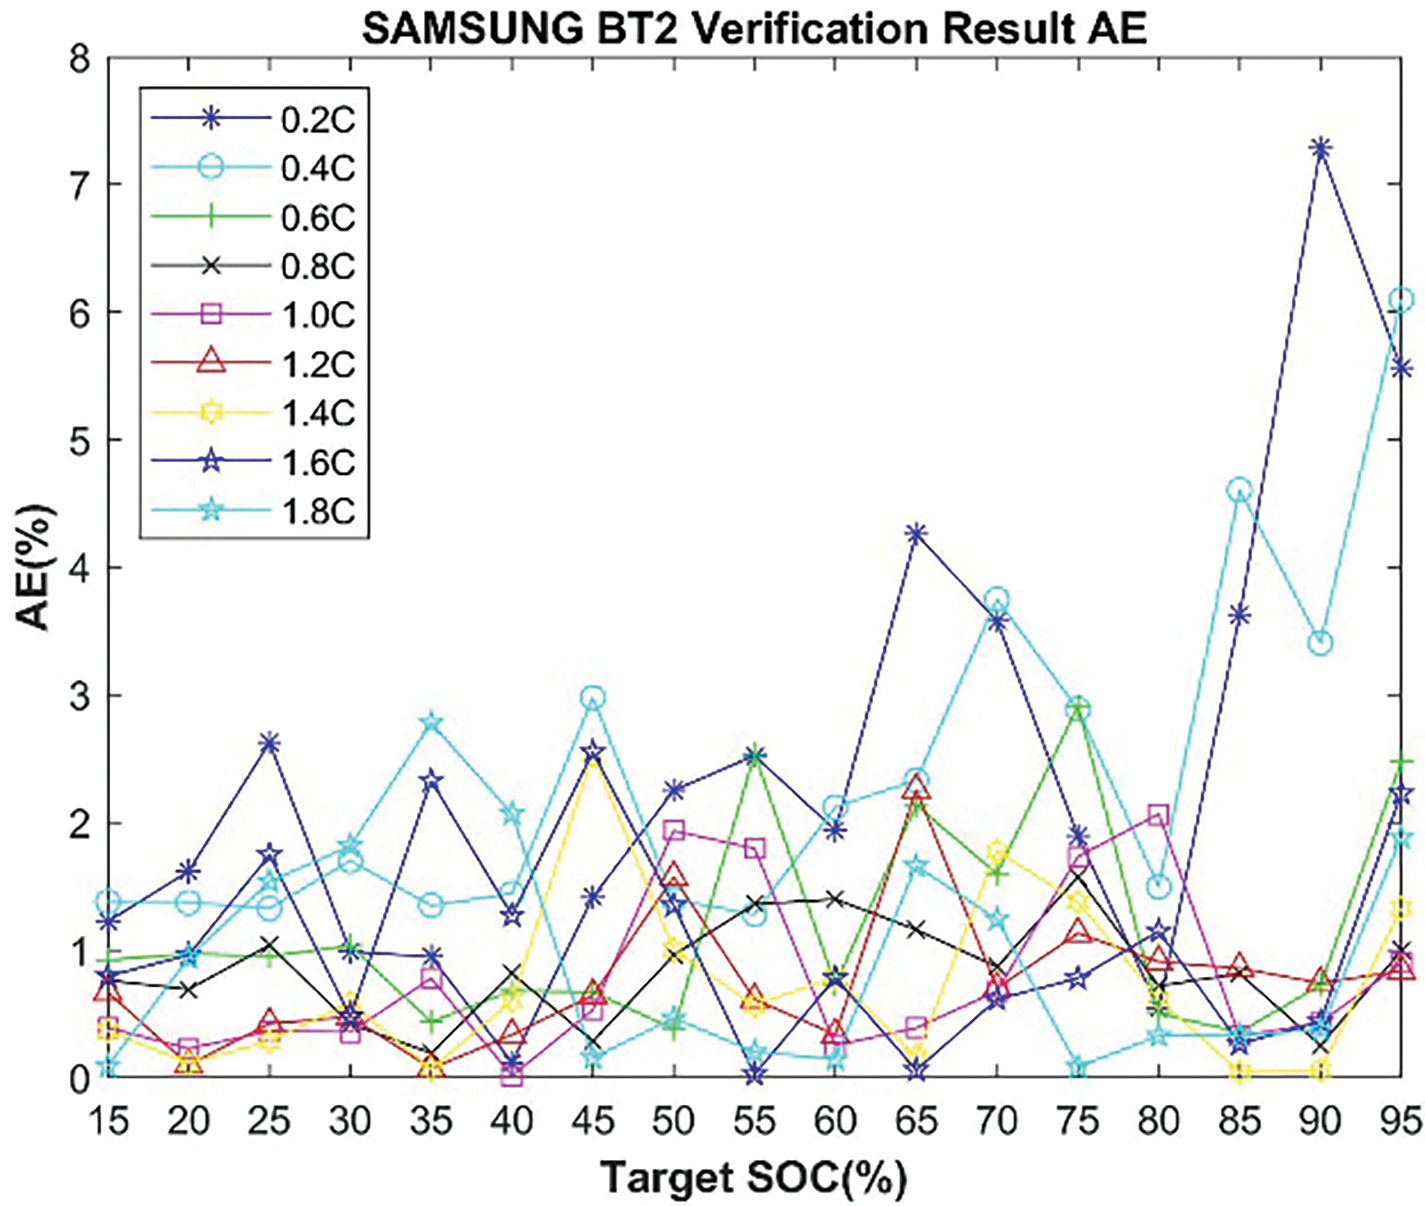
Figure 17: AE of self-validation results for Battery 2 at different C-rates

Figure 18: Comparison of MAE between Battery 1 and Battery 2
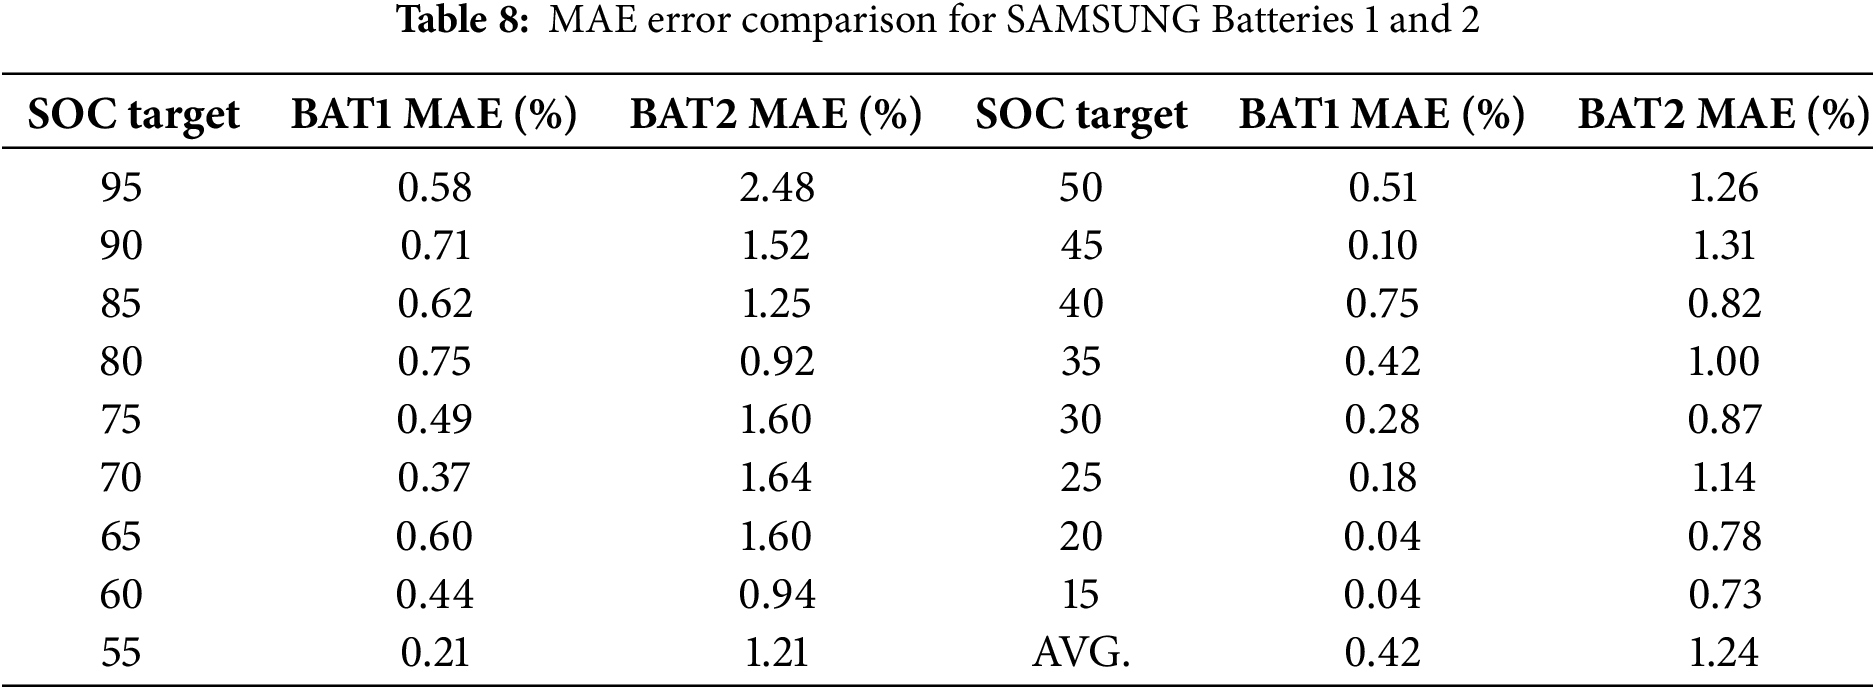
Based on the experimental results, Battery 1, used as the training data for the neural network, exhibits superior accuracy in self-validation. The overall estimated MAE for Battery 1 across 0.2 to 1.8 C ranges from a best value of 0.04% to a worst value of 0.75%. Battery 2, serving as the secondary validation battery, shows an overall estimated MAE ranging from a best value of 0.73% to a worst value of 2.48% across 0.2 to 1.8 C, with the average overall estimated MAE being 0.82% higher compared to Battery 1. As indicated by the estimation results, the trend across SOC from 95% to 15% demonstrates a significant degree of accuracy. Therefore, the neural network architecture employed in this study effectively performs dynamic SOC estimation for the battery.
a) The MAE for individual SOCs in the self-validated battery is less than 1%.
b) For a different battery of the same model under the same neural network, the MAE for individual SOCs is less than 2.5%.
c) The overall average error in the self-validation is only 0.42%.
d) The overall average error for the secondary validation battery is 1.24%.
This paper presents a method for real-time SOC estimation of lithium-ion batteries using dynamic AC impedance and an ANN. By measuring the electrochemical impedance |Z| at various frequencies, discharge C-rate, and surface temperature of the battery in real-time during the discharge process, these data serve as parameters for training the ANN. The use of dynamic AC impedance allows for real-time monitoring, overcoming the limitations of traditional static AC impedance methods that require an open-circuit state and cannot provide timely information.
Experimental results indicate that the impedance |Z| of the battery shows a consistent relationship with SOC, leading to more accurate SOC estimations. For Samsung batteries using lithium cobalt oxide as the cathode material, the method achieves an overall average error of only 0.42% in self-validation, with the mean MAE for individual SOCs not exceeding 1%. In secondary validation, the overall average error is 1.24%, with the MAE for individual SOCs below 2.5%.
However, several practical limitations must be noted. Measuring impedance at multiple frequencies in dynamic conditions requires advanced hardware, which may increase system complexity and cost. Testing was conducted at 25°C with limited discharge rates (0.2–1.8 C), leaving its performance under varied environmental and operational conditions unverified. Moreover, validation was based on two cells from the same manufacturer, and further studies are needed to evaluate its generalizability across diverse battery types.
This method can be applied not only to electric vehicles, electric scooters, and mobile devices but also effectively utilized in energy storage systems, significantly enhancing system operational efficiency and reliability. The approach demonstrates the potential for improving battery management systems by providing accurate and real-time SOC estimates.
Acknowledgement: The authors are grateful to all the editors and anonymous reviewers for their comments and suggestions.
Funding Statement: The authors received no specific funding for this study.
Author Contributions: The authors confirm contribution to the paper as follows: study conception and design: Yi-Feng Luo, Guan-Jhu Chen; data collection: Yi-Feng Luo, Chun-Liang Liu; analysis and interpretation of results: Chun-Liang Liu, Yen-Tse Chung; draft manuscript preparation: Yi-Feng Luo, Guan-Jhu Chen and Yen-Tse Chung. All authors reviewed the results and approved the final version of the manuscript.
Availability of Data and Materials: Not applicable.
Ethics Approval: Not applicable.
Conflicts of Interest: The authors declare no conflicts of interest to report regarding the present study.
References
1. Sadeghi E, Gholami MM, Hamzeh M, Alavi SMM, Saif M. A systematic overview of power electronics interfaced electrochemical impedance spectroscopy for energy storage systems. J Energy Storage. 2023;62(6513):106850. doi:10.1016/j.est.2023.106850. [Google Scholar] [CrossRef]
2. Wang X, Wang S, Huang J, Fernandez C, Zhou Y, Chen L. A novel Gaussian particle swarms optimized particle filter algorithm for the state of charge estimation of lithium-ion batteries. Int J Electrochem Sci. 2020;15(10):10632–48. doi:10.20964/2020.10.21. [Google Scholar] [CrossRef]
3. Sarrafan K, Muttaqi KM, Sutanto D. Real-time estimation of model parameters and state-of-charge of Li-ion batteries in electric vehicles using a new mixed estimation model. IEEE Trans Ind Appl. 2020;56(5):5417–28. doi:10.1109/TIA.2020.3002977. [Google Scholar] [CrossRef]
4. El Mejdoubi A, Oukaour A, Chaoui H, Gualous H, Sabor J, Slamani Y. State-of-charge and state-of-health lithium-ion batteries’ diagnosis according to surface temperature variation. IEEE Trans Ind Electron. 2016;63(4):2391–402. doi:10.1109/TIE.2015.2509916. [Google Scholar] [CrossRef]
5. Mc Carthy K, Gullapalli H, Ryan KM, Kennedy T. Review—use of impedance spectroscopy for the estimation of Li-ion battery state of charge, state of health and internal temperature. J Electrochem Soc. 2021;168(8):080517. doi:10.1149/1945-7111/ac1a85. [Google Scholar] [CrossRef]
6. Huang J, Li Z, Zhang J. Dynamic electrochemical impedance spectroscopy reconstructed from continuous impedance measurement of single frequency during charging/discharging. J Power Sources. 2015;273:1098–102. doi:10.1016/j.jpowsour.2014.07.067. [Google Scholar] [CrossRef]
7. Teo L, Subramanian VR, Schwartz DT. Dynamic electrochemical impedance spectroscopy of lithium-ion batteries: revealing underlying physics through efficient joint time-frequency modeling. J Electrochem Soc. 2021;168(1):010526. doi:10.1149/1945-7111/abda04. [Google Scholar] [CrossRef]
8. Chen H, Li Z. Joint time-frequency physicochemical modeling and parameter sensitivity analysis on dynamic electrochemical impedance spectroscopy of lithium-ion batteries. J Power Sources. 2025;626:235762. doi:10.1016/j.jpowsour.2024.235762. [Google Scholar] [CrossRef]
9. Abu Qahouq JA, Xia Z. Single-perturbation-cycle online battery impedance spectrum measurement method with closed-loop control of power converter. IEEE Trans Ind Electron. 2017;64(9):7019–29. doi:10.1109/TIE.2017.2686324. [Google Scholar] [CrossRef]
10. De Angelis A, Csurcsia PZ, Brunacci V, Carbone P. Fast battery EIS measurement using flexible local rational method. IEEE Trans Instrum Meas. 2024;73(5):6501810. doi:10.1109/TIM.2024.3366587. [Google Scholar] [CrossRef]
11. Wang L, Song Z, Zhu L, Jiang J. Fast electrochemical impedance spectroscopy of lithium-ion batteries based on the large square wave excitation signal. iScience. 2023;26(4):106463. doi:10.1016/j.isci.2023.106463. [Google Scholar] [PubMed] [CrossRef]
12. Lee YD, Park SY, Han SB. Online embedded impedance measurement using high-power battery charger. IEEE Trans Ind Appl. 2015;51(1):498–508. doi:10.1109/TIA.2014.2336979. [Google Scholar] [CrossRef]
13. Xu J, Mi CC, Cao B, Cao J. A new method to estimate the state of charge of lithium-ion batteries based on the battery impedance model. J Power Sources. 2013;233:277–84. doi:10.1016/j.jpowsour.2013.01.094. [Google Scholar] [CrossRef]
14. Bourelly C, Vitelli M, Milano F, Molinara M, Fontanella F, Ferrigno L. EIS-based SoC estimation: a novel measurement method for optimizing accuracy and measurement time. IEEE Access. 2023;11:91472–84. doi:10.1109/ACCESS.2023.3308029. [Google Scholar] [CrossRef]
15. Kong L, Fang S, Niu T, Chen G, Yang L, Liao R. Fast state of charge estimation for lithium-ion battery based on electrochemical impedance spectroscopy frequency feature extraction. IEEE Trans Ind Appl. 2024;60(1):1369–79. doi:10.1109/TIA.2023.3324632. [Google Scholar] [CrossRef]
16. Chen T, Huo M, Yang X, Wen R. A fast lithium-ion battery impedance and SOC estimation method based on two-stage PI observer. World Electr Veh J. 2021;12(3):108. doi:10.3390/wevj12030108. [Google Scholar] [CrossRef]
17. Wang L, Zhao X, Deng Z, Yang L. Application of electrochemical impedance spectroscopy in battery management system: state of charge estimation for aging batteries. J Energy Storage. 2023;57(1):106275. doi:10.1016/j.est.2022.106275. [Google Scholar] [CrossRef]
18. Cavaliere D, Ikezawa A, Okajima T, Arai H. Reduced artifacts in dynamic electrochemical impedance spectroscopy applied to battery degradation analysis. J Power Sources. 2024;621(1):235316. doi:10.1016/j.jpowsour.2024.235316. [Google Scholar] [CrossRef]
19. Koseoglou M, Tsioumas E, Ferentinou D, Jabbour N, Papagiannis D, Mademlis C. Lithium plating detection using dynamic electrochemical impedance spectroscopy in lithium-ion batteries. J Power Sources. 2021;512(4):230508. doi:10.1016/j.jpowsour.2021.230508. [Google Scholar] [CrossRef]
20. Zhou X, Zhang R, Wang Y. Electrochemical impedance spectroscopy-based dynamic modeling of lithium-ion batteries using a simple equivalent circuit model. Energy Tech. 2023;11(9):2300473. doi:10.1002/ente.202300473. [Google Scholar] [CrossRef]
21. Mc Carthy K, Gullapalli H, Ryan KM, Kennedy T. Electrochemical impedance correlation analysis for the estimation of Li-ion battery state of charge, state of health and internal temperature. J Energy Storage. 2022;50(8):104608. doi:10.1016/j.est.2022.104608. [Google Scholar] [CrossRef]
22. Driscoll L, de la Torre S, Gomez-Ruiz JA. Feature-based lithium-ion battery state of health estimation with artificial neural networks. J Energy Storage. 2022;50(1):104584. doi:10.1016/j.est.2022.104584. [Google Scholar] [CrossRef]
23. Hussein AA. Capacity fade estimation in electric vehicle Li-ion batteries using artificial neural networks. IEEE Trans Ind Appl. 2015;51(3):2321–30. doi:10.1109/TIA.2014.2365152. [Google Scholar] [CrossRef]
24. Hussein AA. Adaptive artificial neural network-based models for instantaneous power estimation enhancement in electric vehicles’ Li-ion batteries. IEEE Trans Ind Appl. 2019;55(1):840–9. doi:10.1109/TIA.2018.2866102. [Google Scholar] [CrossRef]
25. Luo YF. A multi-frequency electrical impedance spectroscopy technique of artificial neural network-based for the static state of charge. Energies. 2021;14(9):2526. doi:10.3390/en14092526. [Google Scholar] [CrossRef]
26. Zhang S, Yuan W, Wang Y, Cheng S, Wang J. Capacity estimation for lithium-ion batteries based on impedance spectral dynamics and deep Gaussian process. IEEE Trans Power Electron. 2024;39(8):10287–98. doi:10.1109/TPEL.2024.3395513. [Google Scholar] [CrossRef]
27. Babaeiyazdi I, Rezaei-Zare A, Shokrzadeh S. Transfer learning with deep neural network for capacity prediction of Li-ion batteries using EIS measurement. IEEE Trans Transp Electrif. 2023;9(1):886–95. doi:10.1109/TTE.2022.3170230. [Google Scholar] [CrossRef]
28. Su X, Sun B, Wang J, Zhang W, Ma S, He X, et al. Fast capacity estimation for lithium-ion battery based on online identification of low-frequency electrochemical impedance spectroscopy and Gaussian process regression. Appl Energy. 2022;322(4):119516. doi:10.1016/j.apenergy.2022.119516. [Google Scholar] [CrossRef]
29. Fan W, Jiang B, Wang X, Yuan Y, Zhu J, Wei X, et al. Enhancing capacity estimation of retired electric vehicle lithium-ion batteries through transfer learning from electrochemical impedance spectroscopy. eTransportation. 2024;22(2):100362. doi:10.1016/j.etran.2024.100362. [Google Scholar] [CrossRef]
30. Zafar MH, Mansoor M, Abou Houran M, Khan NM, Khan K, Raza Moosavi SK, et al. Hybrid deep learning model for efficient state of charge estimation of Li-ion batteries in electric vehicles. Energy. 2023;282(4):128317. doi:10.1016/j.energy.2023.128317. [Google Scholar] [CrossRef]
31. Shi D, Zhao J, Wang Z, Zhao H, Wang J, Lian Y, et al. Spatial-temporal self-attention transformer networks for battery state of charge estimation. Electronics. 2023;12(12):2598. doi:10.3390/electronics12122598. [Google Scholar] [CrossRef]
32. Ma L, Zhang T. Deep learning-based battery state of charge estimation: enhancing estimation performance with unlabelled training samples. J Energy Chem. 2023;80:48–57. doi:10.1016/j.jechem.2023.01.036. [Google Scholar] [CrossRef]
Cite This Article
 Copyright © 2025 The Author(s). Published by Tech Science Press.
This work is licensed under a Creative Commons Attribution 4.0 International License , which permits unrestricted use, distribution, and reproduction in any medium, provided the original work is properly cited.
 Downloads
 Citation Tools