
 Submit a Paper
 Propose a Special lssue
 Open Access
ARTICLE

AI-Based Tire Pressure Detection Using an Enhanced Deep Learning Architecture
Graduate Institute of Vehicle Engineering, National Changhua University of Education, Changhua, 50007, Taiwan
* Corresponding Author: Shih-Lin Lin. Email:
Computers, Materials & Continua 2025, 83(1), 537-557. https://doi.org/10.32604/cmc.2025.061379
Received 23 November 2024; Accepted 11 February 2025; Issue published 26 March 2025
 View Full Text
 Download PDF
Abstract
Tires are integral to vehicular systems, directly influencing both safety and overall performance. Traditional tire pressure inspection methods—such as manual or gauge-based approaches—are often time-consuming, prone to inconsistency, and lack the flexibility needed to meet diverse operational demands. In this research, we introduce an AI-driven tire pressure detection system that leverages an enhanced GoogLeNet architecture incorporating a novel Softplus-LReLU activation function. By combining the smooth, non-saturating characteristics of Softplus with a linear adjustment term, this activation function improves computational efficiency and helps stabilize network gradients, thereby mitigating issues such as gradient vanishing and neuron death. Our enhanced GoogLeNet algorithm was validated on a dedicated tire pressure image database comprising three categories-low pressure, normal pressure, and undetected. Experimental results revealed a classification accuracy of 98.518% within 11 min and 56 s of total processing time, substantially surpassing the original GoogLeNet’s 95.1852% and ResNet18’s 92.7778%. This performance gain is attributed to superior feature extraction within the Inception modules and the robust integration of our novel activation function, leading to improved detection reliability and faster inference. Beyond accuracy and speed, the proposed system offers significant benefits for real-time monitoring and vehicle safety by providing timely and precise tire pressure assessments. The automation facilitated by our AI-based method addresses the limitations of manual inspection, delivering consistent, high-quality results that can be easily scaled or customized for various vehicular platforms. Overall, this work establishes a solid foundation for advanced tire pressure monitoring systems and opens avenues for further exploration in AI-assisted vehicle maintenance, contributing to safer and more efficient automotive operations.Keywords
Automated Visual Inspection (AVI) is an image processing method for quality control, image analysis, and pattern recognition. Traditional AVI systems often employ simple image subtraction or template matching to measure differences between predefined reference patterns and sliding window image blocks on the inspection image. Although these methods are suitable for detecting simple feature images, they prove inadequate for complex feature images. In recent years, novel image processing and classification techniques have been applied to tackle more challenging and intricate inspection problems in precision engineering and manufacturing. Based on image analysis technology, detection systems can be categorized into four distinct groups. Image projection methods model the correlation between learning samples and determine a more discriminative space to represent these samples. This process yields low-dimensional sample features with strong discriminative power. Machine vision-based inspection has been applied in bearing defect analysis, large-scale infrastructure monitoring, color inspection of produce, bridge inspection, and agricultural applications. Integrating these techniques with deep learning frameworks [1] and real-time inspection approaches [2] has further advanced detection accuracy. Meanwhile, camera calibration and image projection methods [3] enhance vehicle analysis, and PCA-based feature reduction strategies [4] improve classification for high-dimensional data. Radon transform [5], linear discriminant analysis (LDA) [6], and independent component analysis (ICA) [7,8] are several relatively mature projection methods based on eigenvectors [9].
Image filtering methods are frequently employed in signal processing [10–12]. When capturing images of measured objects, image quality, and visual effects are influenced by factors such as the imaging system, transmission medium, and equipment performance. This interference complicates the analysis of original image features and poses challenges for subsequent image processing tasks [13]. The primary objective is to extract relevant features of human interest from images, making the filtering of noise and uninteresting information in images a crucial preliminary task in signal processing. Moreover, frequency-domain filtering techniques (including low-pass and high-pass filters) are typically utilized to process images and noises exhibiting repetitive patterns (periodicity), to analyze the spectral characteristics of uninteresting images and noises, and to design corresponding filters [14,15]. Deep learning-based approaches, including convolutional neural networks and advanced feature extraction techniques [16–19], have significantly improved performance in complex computer vision tasks. These methods primarily stem from the comprehensive development of technologies such as machine learning and pattern recognition. The concepts originate from diverse research fields, including statistics, probability theory, approximation theory, algorithmic complexity theory, artificial intelligence, and information theory. The objective is for computers to logically deduce discriminant rules by learning from training samples to continuously and automatically optimize algorithm performance, ultimately endowing machines with intelligent functions. Related research includes sparse coding [20,21], deep neural networks (DNNs) [22–25], support vector machines (SVMs) [26], and genetic algorithms (GAs) [27], as well as vehicle networks and image perception [28]. Which are currently several classic learning-based computer vision detection algorithms. For complex and challenging tasks, systems often combine multiple technologies to achieve task detection. Related research encompasses wavelet transform [29], genetic algorithm [30], zero-defect manufacturing [31], rough set theory [32], and integrated machine vision frameworks [33].
However, existing tire inspection methods still lack robust adaptability and scalability, especially when dealing with variations in tire type, lighting conditions, and complex backgrounds. Recent studies have explored partial solutions through sensor-based or rule-based approaches, yet these methods often struggle with real-time classification accuracy. In contrast, deep learning has demonstrated strong potential to bridge this gap by autonomously extracting and learning discriminative features from large-scale image datasets. This study examines the current research status and market application of automobile tire testing technologies. Considering the shortcomings of manual detection, such as low efficiency, slow speed, instability, and subjectivity, we have developed a machine vision-based tire pressure detection system for automobile tires, generally divided into three stages. First, sensors (cameras) are used to acquire an image database of car tires. Next, an algorithm is established to analyze and classify automobile tire images. Lastly, algorithmic pattern recognition is employed to categorize tires as having normal tire pressure, being under-inflated, or remaining undetected. Detection and classification based on image analysis represent the critical and challenging research content of the automated visual inspection system. This research advances the field by addressing several critical gaps:
1. Novel Architecture: This research introduces an enhanced deep learning framework that combines GoogLeNet with a newly developed Softplus-LReLU activation function, specifically tailored to handle varied tire types, lighting conditions, and complex backgrounds.
2. Improved Robustness: Through comprehensive data augmentation and careful dataset curation, the proposed method demonstrates stronger adaptability and higher classification accuracy compared to conventional models.
3. Real-World Validation: The proposed approach is thoroughly evaluated under multiple angles, distances, and tire rotations, consistently outperforming traditional manual or rule-based inspection methods and providing a reliable foundation for future studies in automated tire pressure monitoring and vehicle safety.
As a result, the system demonstrates enhanced accuracy and objectivity in detecting tire pressure levels, thereby elevating detection efficiency. This advancement in tire pressure monitoring holds significant potential for improving vehicle safety and overall performance.
2 Description of the Research Methodology
2.1 Automobile Tire Image Enhancement Technology
This section explains the preprocessing of car tire images. A histogram is a statistical representation of an image. For a grayscale image, its histogram reflects the distribution of different gray levels within the image. Generally, there is a corresponding relationship between the visual effect of an image and its histogram; adjusting or transforming the shape of the histogram can significantly affect the image’s display properties. Histogram equalization is primarily employed to enhance the contrast of images with a narrow dynamic range of gray values. Its fundamental concept involves transforming the gray statistical histogram of the original image into a uniform distribution. Consequently, the dynamic range of gray values for graphic elements is increased, thereby achieving the effect of enhancing the overall contrast of the image.
According to information theory, once histogram equalization is applied, more information is retained in the image, highlighting critical features. Assuming that the image has n levels of grayscale, and the probability of its
The information content of the whole image is:
Information theory demonstrates that the image with a uniformly distributed histogram has the largest amount of information
Median filtering is a nonlinear signal processing technology, which can effectively suppress image noise and improve image signal-to-noise ratio. The median filter is based on the neighborhood operation, which can be operated by defining a neighborhood with a size of
In Eq. (3),
Grayscale image binarization refers to segmenting the target and background by agreeing on a grayscale threshold. Pixel objects within the threshold are marked as 1. Others belong to the background marked as 0. In the process of tire pressure target detection and recognition, edge, area: three features can be used for discrimination. The gray difference value between the crack target and the surrounding background can also be used as a basis for discrimination. This requires the introduction of a threshold for image binarization.
Suppose a grayscale crack image is represented by f (x, y). Where (x, y) represents the position coordinates of the primitive in the image. T represents the threshold, then the binary image b (x, y) after threshold segmentation satisfies:
Primitive grayscales of car tire objects or background regions are usually highly correlated. However, there is usually a large difference in the gray scale between the tire target and the background area and generally contains obvious features such as edges. Therefore, in order to segment the tire target and the background to a greater extent, it is necessary to perform gray threshold segmentation and select an appropriate threshold.
2.2 Traditional GoogLeNet Network
GoogLeNet is a deep learning network architecture proposed by Christian Szegedy [34,35]. In contrast to earlier networks such as AlexNet [36] and VGG16 [37], which primarily increased the network depth to achieve better training results, GoogLeNet not only deepens the network but also broadens its width. The Inception module serves as the core structure of GoogLeNet. Within the Inception module, a single convolution kernel is replaced with a combination of a pooling layer and three sets of parallel convolution kernels-1 × 1, 3 × 3, and 5 × 5. Each path is followed by a 1 × 1 convolution, applied either before the convolution or after the pooling operation. This configuration facilitates the extraction of richer features within the same receptive field size, while the 1 × 1 convolution performs dimensionality reduction, thereby decreasing computational complexity and enhancing network performance. In this study, the GoogLeNet network is chosen as the base network for improving automobile tire pressure image recognition. Fig. 1 illustrates the internal optimization structure of the traditional GoogLeNet network Inception module.
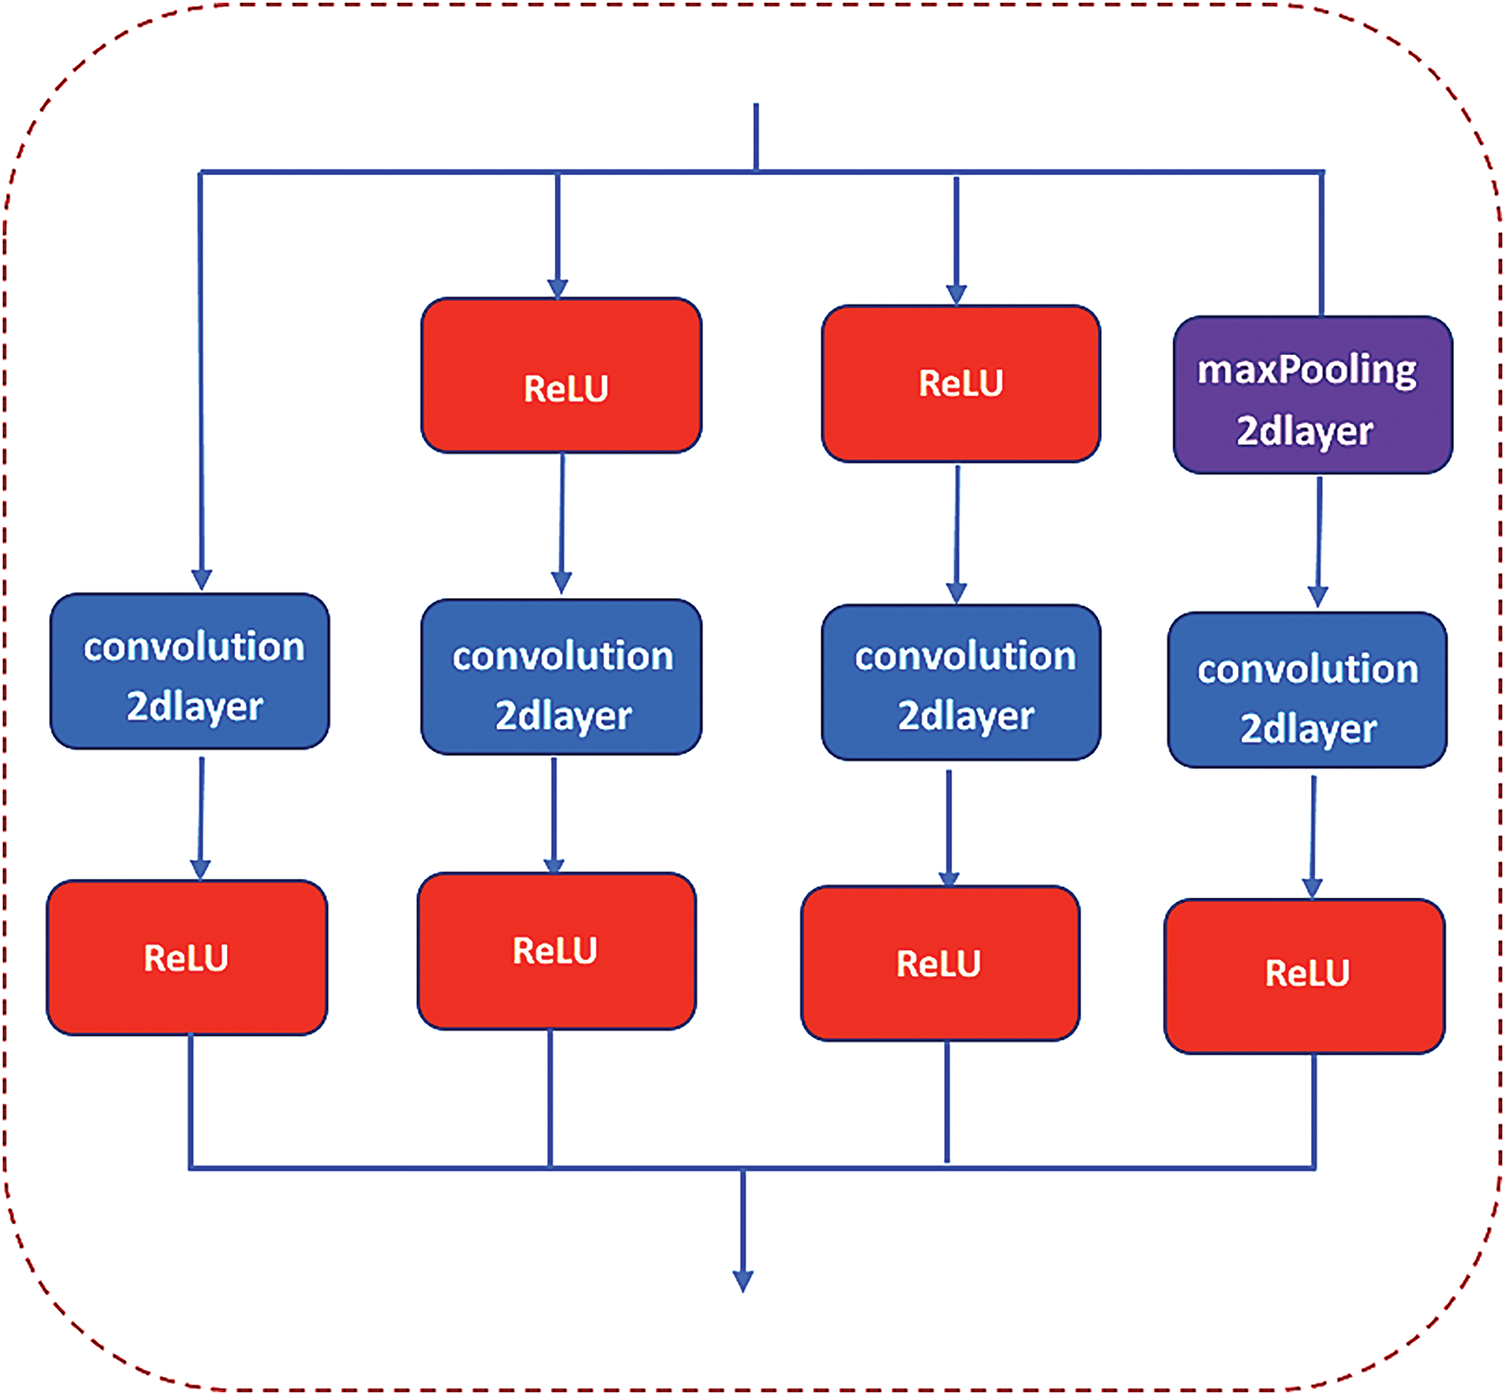
Figure 1: The internal optimization structure of the traditional GoogLeNet network Inception module
2.3 Improvement of GoogLeNet Network Structure
This research delves into the sophisticated realm of refining the GoogLeNet architecture, employing a multifaceted approach to elevate its performance. At the core of this approach is optimizing the Inception module, now recalibrated to better align with the specialized demands of tire pressure detection. We venture beyond the conventional boundaries by integrating advanced strategies such as the meticulous selection of a batch normalization technique, the careful choice of an activation function, the strategic implementation of Dropout, and the pioneering adoption of an enhanced Softplus-LReLU mechanism within the classification layer. The Inception module, originally designed for broad-spectrum classification tasks, receives significant attention for its structural advancement. Originally conceived for broad-spectrum image classification, the traditional Inception module of GoogLeNet has shown limitations in its ability to enhance the precision of algorithmic result classification markedly. Although the GoogLeNet framework is adept at managing extensive datasets like ImageNet, showcasing remarkable classification capabilities, it encounters challenges in more nuanced tasks. The highly context-specific challenge of detecting and classifying tire pressure patterns requires deeper architectural modifications and robust activation functions to handle small yet complex datasets.
This research advances the precision of air pressure detection within automobile tires, meticulously refining the classical GoogLeNet architecture. The evolved network structure introduces a strategic enhancement by incorporating a maxPooling2d and the innovative Softplus-LReLU activation function directly into the Inception module’s framework. This revitalized GoogLeNet model exploits the power of stacked Inception modules, ingeniously aggregating data through 1 × 1 convolutions to streamline the channel count before computation. This methodical approach to computing optimizes the use of computational resources and harmonizes convolution and pooling operations across varying scales, fostering a more nuanced fusion and recognition of multi-dimensional features. In a transformative shift from depth to width within the network’s architecture, this study circumvents the notorious challenge of training gradient dispersion, often a byproduct of excessively deep networks. The refined GoogLeNet architecture introduces global mean pooling as a solution to the intricate and often underperforming last fully connected layer found in traditional CNN frameworks. To unearth additional potential features, the maxPooling2d layer, along with a corresponding downsampling layer, is integrated within the Inception module. Tailoring to the nuances of small datasets, the architecture strategically reduces the number of layers while preserving a singular branch classifier. Furthermore, introducing Batch-Normalization regularization before the fully connected layer is a countermeasure to the gradient vanishing dilemma. Illustrated in Fig. 2 is the internal optimization structure of the improved GoogLeNet Inception module, showcasing how these structural modifications, in tandem with an appropriate activation function, directly address the fine-grained nature of tire pressure detection. Within the traditional GoogLeNet framework, three distinct types of unsaturated nonlinear functions emerge as the backbone for activation:
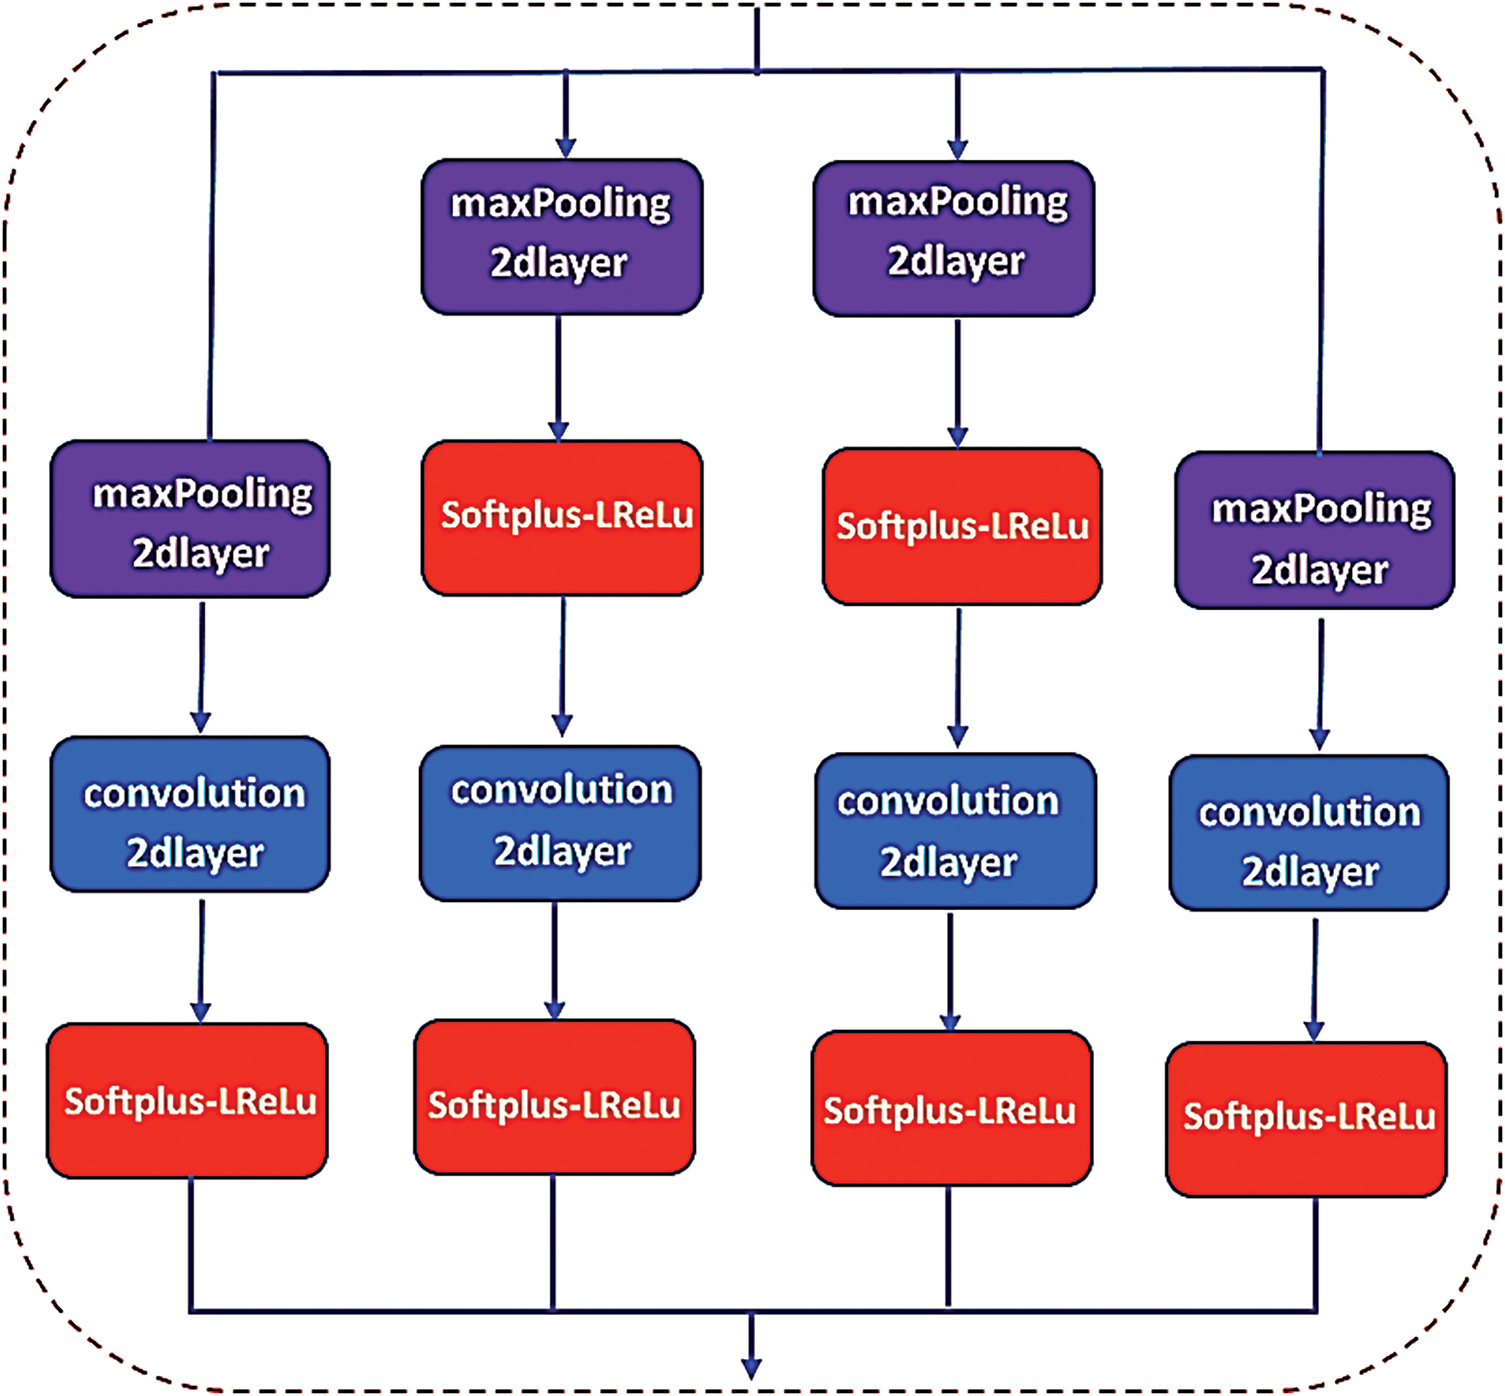
Figure 2: Internal optimization structure of the improved GoogLeNet network Inception module
These unsaturated nonlinear functions have ascended as the activation functions of choice in the realm of constructing deep convolutional neural networks, marking a pivotal shift towards more dynamic and efficient network designs.
2.4 Introducing the Innovative Softplus-LReLU Activation Function and Theoretical Basis
In the realm of neural network advancements, this study unveils the Softplus-LReLU activation function, a cutting-edge innovation that marries the strengths of both the LReLU and Softplus functions. The Softplus-LReLU function emerges as an unsaturated, nonlinear activation mechanism, characterized by a unified operational principle that eliminates the need for piecewise definitions. The function is formulated as follows:
This innovative function effectively combines the properties of the Softplus function and a linear term controlled by the parameter aaa, ensuring a smooth and continuous transition across the input range. Unlike traditional piecewise-defined functions, the unified formulation enhances computational efficiency and stability. It preserves a segment of the negative axis data, thereby improving data distribution, while also inheriting the rapid convergence attribute of the ReLU function, significantly reducing the risk of “neuronal death”.
Crucially, this modified function achieves a nonlinear yet smooth transition, equipping the Softplus-LReLU function with both sparse activation and broad nonlinear mapping potential. To demonstrate the stability of Softplus-LReLU, we analyze its derivative, which governs the gradient flow during backpropagation. Taking the derivative of
First, note that
By leveraging the synergy of smoothness and sparse activation, this function is well-suited for deep learning architectures, particularly those optimized for small datasets or requiring highly nuanced feature extractions. Moreover, we conducted convergence analyses under varying conditions (e.g., differing batch sizes and learning rates), showing that models using Softplus-LReLU exhibited more stable loss curves and lower final error rates, effectively addressing the gradient vanishing and exploding issues often encountered in deeper or narrower architectures. In light of the modifications to the GoogLeNet architecture and its advanced Inception structure, this research opts to preserve the original model framework while enhancing its functionality with the proposed activation function. This approach directly tackles the intricate nature of tire pressure detection, where subtle variations in tread and inflation levels can easily be lost if the activation function saturates or kills gradients prematurely. Through these combined theoretical and experimental insights, we affirm the stability of Softplus-LReLU, establish its effectiveness over traditional functions such as ReLU and Swish in our specific tire pressure detection context, and demonstrate how the refined GoogLeNet architecture converges reliably under various training conditions.
This innovative function preserves a segment of the negative axis data, thereby enhancing the data distribution. It inherits the rapid convergence attribute of the ReLU function, whilst significantly reducing the risk of “neuronal death.” Crucially, it achieves a nonlinear and smooth transition, equipping the Softplus-LReLU function with both sparse activation and broad nonlinear mapping potential. In light of the modifications to the GoogLeNet architecture and its profound Inception structure, this research opts to preserve the original model framework. This decision is informed by the observation that the spatial focus of the convolution kernel diminishes in the network’s deeper strata. Consequently, features delineated by comparatively larger convolution kernels assume a more abstract form, rendering them ideally suited for integration into the deeper segments of the network. Considering the improvements to GoogLeNet and the deep Inception structure, this paper maintains the original model structure. This is because the spatial concentration of the convolution kernel decreases in the deeper layers of the network, and features extracted by relatively larger convolution kernels become more abstract, making them suitable for application in the network’s deeper layers. This study introduces an innovative Softplus-LReLU activation function, aiming to harness the combined benefits of the LReLU and Softplus functions to enhance neural network performance. The Softplus-LReLU function, an unsaturated nonlinear activation function, innovatively adjusts the Softplus function curve by shifting it down by ln2 units and applying the LReLU function’s ax output for inputs less than 0. This approach retains some negative axis data, optimizing data distribution. It not only inherits the rapid convergence properties of the ReLU function but also significantly reduces the risk of “neuronal necrosis,” achieving a nonlinear and smooth mapping. This equips the Softplus-LReLU function with both sparse representational capacity and a wide range of nonlinear mapping capabilities.
In terms of improvements to the GoogLeNet architecture and its deep Inception structure, this research opts to preserve the original model structure. This decision is informed by the observation that the spatial concentration of the convolution kernel diminishes in deeper network layers, where features extracted by larger convolution kernels become more abstract, making them more suited for application in the network’s deeper layers. This choice reflects an understanding of the feature extraction and abstraction capabilities in deep network architectures, ensuring that the modified model can handle complex tasks such as detecting air pressure inside automobile tires while maintaining efficient classification performance on large datasets.
2.5 Establishing Clear Connections between Architectural Modifications and Tire Pressure Detection Challenges
Tire pressure detection poses unique difficulties due to subtle visual cues, such as minor changes in tire curvature, tread visibility, and lighting variations in real-world conditions. Our enhanced GoogLeNet addresses these challenges through a multi-scale Inception design, which captures both global shape features (e.g., overall tire contour) and fine-grained local details (e.g., minute texture differences) across varied resolutions. The added maxPooling2d and global mean pooling layers focus network capacity on high-saliency regions, counteracting the clutter typical in outdoor scenes. Meanwhile, the Softplus-LReLU activation function ensures stable gradient flow and reduces sensitivity to small feature variations, thereby improving classification consistency even in small-sample scenarios. Consequently, each architectural refinement directly targets specific tire detection hurdles—improving feature discrimination, mitigating noise, and stabilizing training processes in more reliable tire pressure recognition performance.
3 Description of the Research Data
This dataset comprises images captured using an iPhone 12, containing three classifications of different tire pressures: low pressure, normal pressure, and undetected tire pressure, as shown in Fig. 3. The dataset includes 900 color images of 240 × 240 resolution, encompassing various car makes and types with different tire pressures. The image database is stored as .jpg files and labeled as “full”, “flat”, or “no-tire”. In the dataset, the manufacturer-specified pressure range for normal passenger car tires typically spans 30–35 psi (206–241 kPa). When a tire’s measured pressure falls below 28 psi (193 kPa)—indicating a significant deviation from the manufacturer specification—we label it as “flat” (underinflated). Images were captured from different angles, distances, and tire rotations. The following describes the three tire pressure categories:
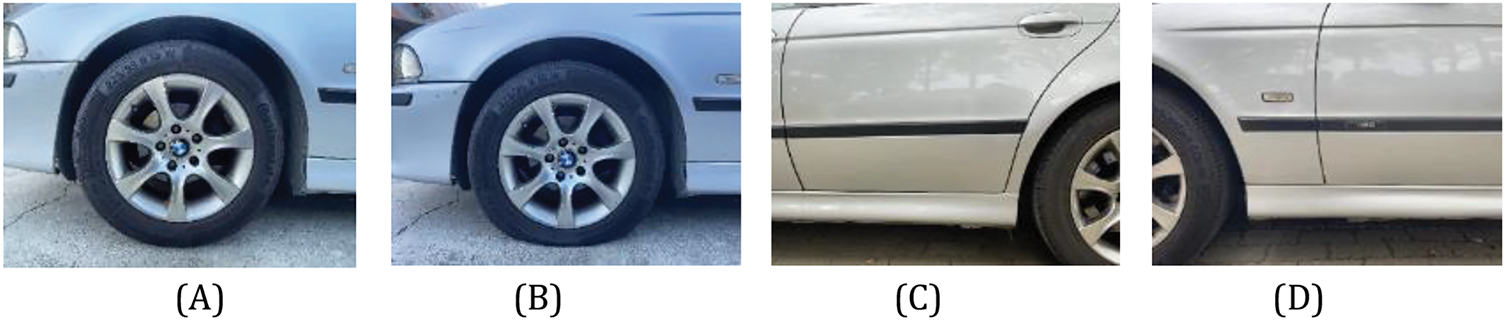
Figure 3: Pictures of car tires (A) Normal tire pressure; (B) Under-inflated tire; (C) and (D) No tire detected
Different car makes and types have distinct normal tire pressures (typically 30–35 psi). This category includes 300 images of tires at the appropriate pressure based on the specifications of various car makes and types. All images in this category feature a single tire with a buffer zone of several inches around it. Images were taken at slightly different angles, distances, and tire rotations. An example of a normal tire pressure image is shown in Fig. 3A.
Different car makes and types have varying tire pressures, but in this study, underinflated tires are those measured below 28 psi. This category includes 300 images of tires at incorrect pressures based on the specifications of various car makes and types. All images in this category feature a single tire with a buffer zone of several inches around it. Images were taken at slightly different angles, distances, and tire rotations. An example of an underinflated tire image is shown in Fig. 3B.
Images with no tires detected are labeled as “no-tire,” and this category contains 300 non-tire objects. The image database includes pictures of car sides with only partial tires, no tires, or partial tires that cannot be detected and do not meet the criteria for a “full” or “flat” label. It is essential to detect tires for proper identification. Examples of images with no tire detected are shown in Fig. 3C,D.
Fig. 4 offers a detailed comparative visualization that elucidates the distribution of car tire images utilized across two pivotal phases of the research process: the training phase (A) and the testing phase (B). This demarcation is imperative for a comprehensive understanding of the dataset’s allocation, which plays a critical role in both the development and subsequent evaluation of the predictive model’s efficacy. By systematically categorizing the images into these dichotomous groups, the figure significantly contributes to highlighting the equilibrium or potential disparities present between the training and testing datasets. Such a delineation is quintessential in evaluating the model’s robustness and its capacity for generalization across diverse datasets, thereby underpinning the reliability and validity of the research findings.
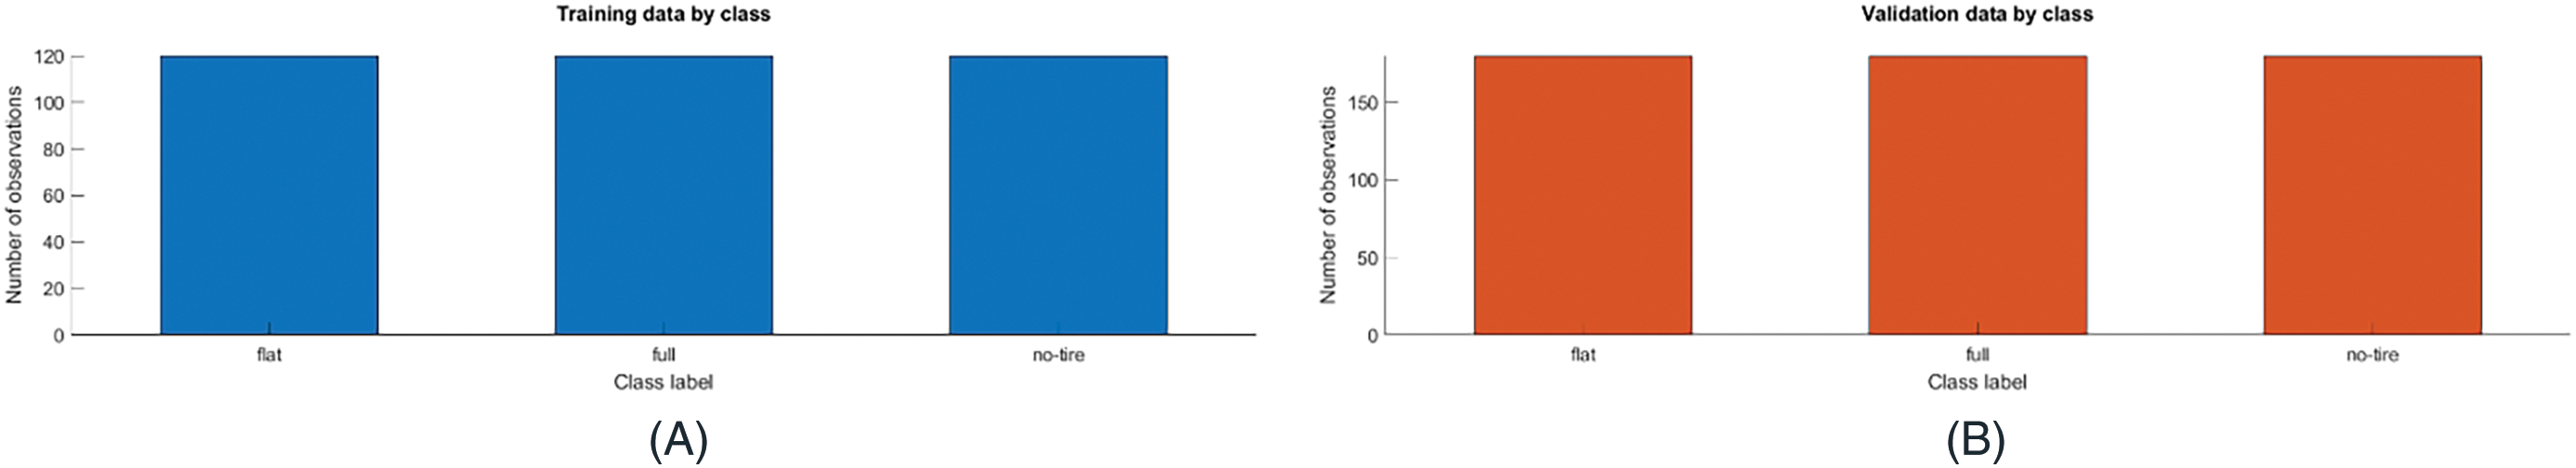
Figure 4: Number of automobile tire images in training (A) and testing (B)
In this study, we began by conducting preliminary statistical tests and performance analyses on a small sample of 150 images, tracking classification accuracy and F1-scores via cross-validation. We then incrementally increased the dataset size to 300, 500, and 700 images, finding that beyond 700, the accuracy and F1-score curves leveled off while differences in hyperparameters and network architectures became clearer. Considering both the logistical costs and the need for diverse conditions—encompassing multiple car models, lighting scenarios, and road surfaces—we settled on 900 images. We confirmed the statistical significance of performance gains at this threshold using t-tests and ANOVA, observing reduced error margins and heightened model stability. Although on-site constraints mostly limited us to small car models, we captured images reflecting diverse tire ages, brands, lighting (largely daytime, with some variation), and road surfaces (asphalt and concrete, both flat and slightly inclined). To maintain class balance, we allocated 300 images to each of three categories—normal tire pressure, underinflated, and no tire—and then applied uniform data augmentation measures (rotation, cropping, brightness adjustments). We assessed performance using accuracy, precision, recall, and F1-scores, along with confusion matrices to detect any systematic misclassification. This approach provided a sufficiently varied yet statistically robust dataset, laying a solid foundation for subsequent model evaluation and comparative studies.
Using car tire images as an example, a histogram equalization experiment is conducted. Fig. 5A shows the original car tire image, while Fig. 5B presents the result of histogram equalization image enhancement. In Fig. 5C,D, the original histogram primarily concentrates between 0–100 and 100–200, indicating a large proportion of dark regions and making it challenging to discern tire pressure details. Fig. 5B,D reveals that after equalization, the image pixels are evenly distributed within the 0 to 255 range. Intuitively, this yields a uniform brightness effect, enabling better observation of the tire pressure area’s details. Therefore, histogram equalization can improve the visualization of images with uneven brightness distribution and overexposure to a certain extent, proving to be a more effective image enhancement method.
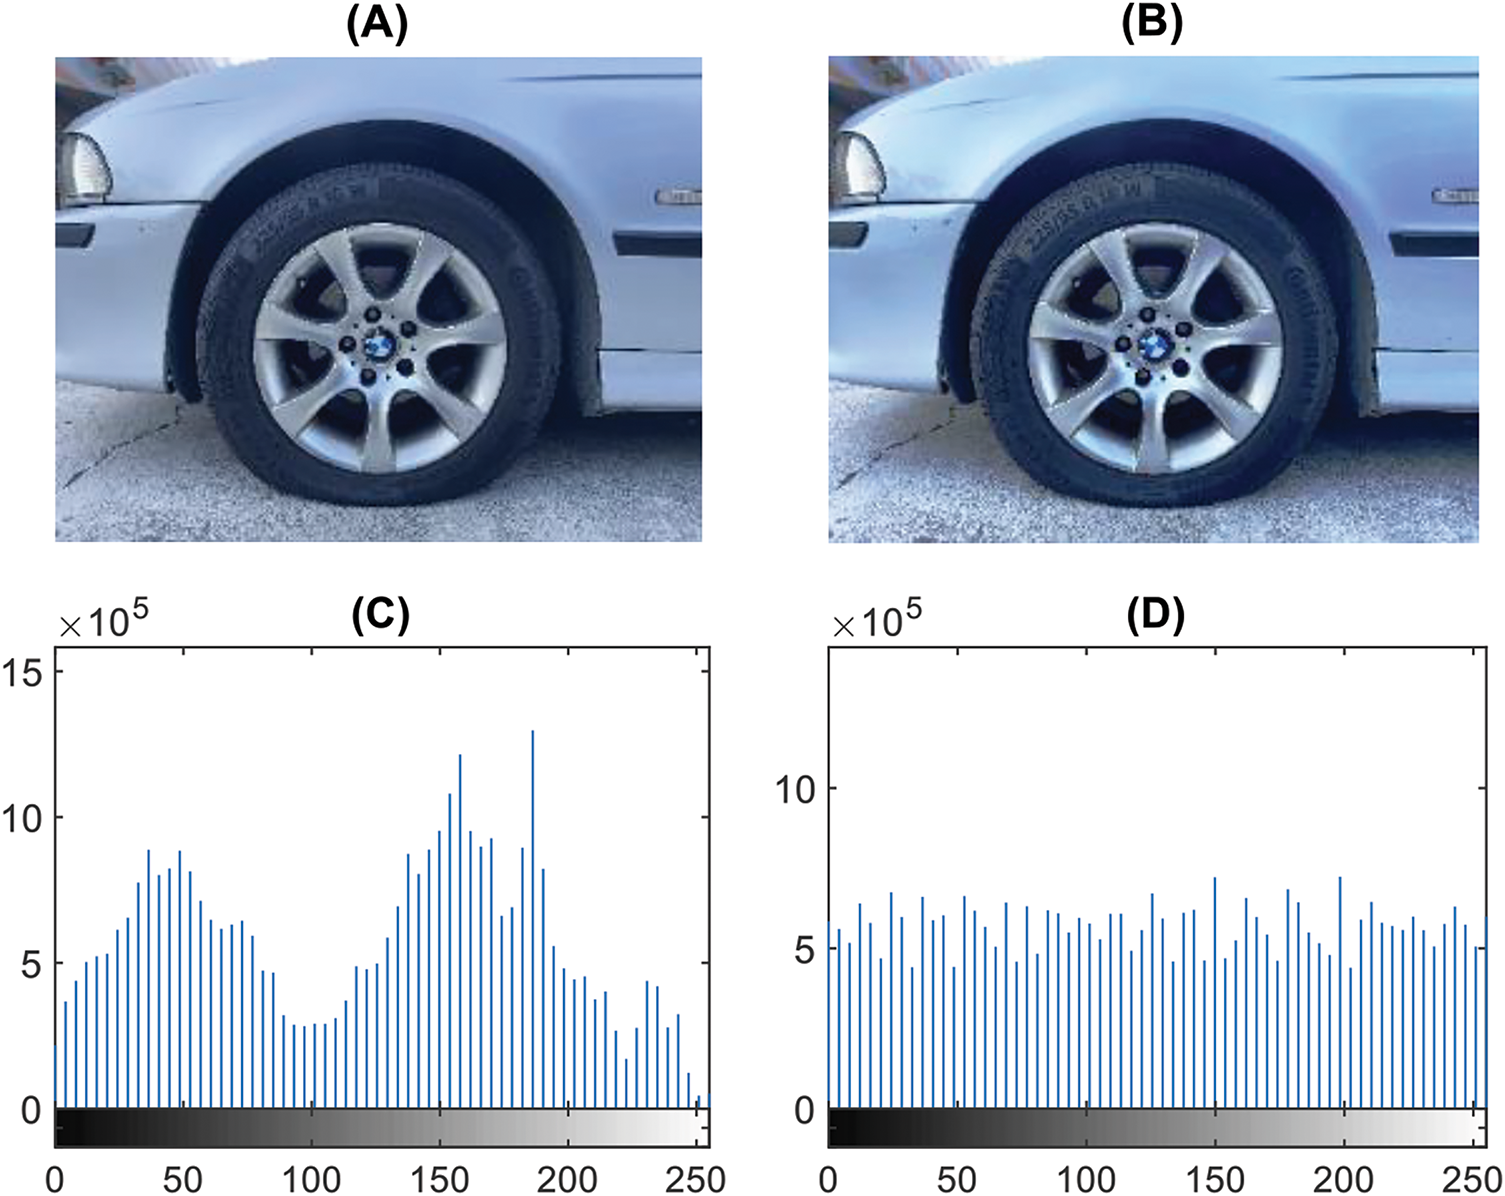
Figure 5: Histogram equalization image enhancement (A) Original image; (B) Histogram Equalization Image Enhancement; (C) Histogram distribution of original image; (D) Histogram distribution after image enhancement
In addition to histogram equalization, the following preprocessing steps are used in our approach to ensure reproducibility and enhance model performance: (1) Resolution Adjustment: All tire images are standardized to 240 × 240 pixels, ensuring uniform input size across the training and testing phases. (2) Cropping: We apply region-of-interest (ROI) cropping around the tire area to eliminate irrelevant background. (3) Rotation: Slight random rotations (±10 degrees) are introduced during training data augmentation to improve rotation invariance. (4) Brightness Normalization: Each image is normalized based on its per-channel mean and variance to reduce the impact of lighting variations. In this study, the binarization process adopts a self-adjusting threshold, which is a relatively basic image self-adjusting segmentation method. Generally, threshold segmentation is performed based on the image primitive itself and the characteristics of grayscale changes within the image domain, enabling the binarization of the grayscale image. This method thoroughly considers the characteristics of tire primitive neighborhoods and can generally better highlight the boundary between the target and the background. In most cases, the tire image background is relatively fixed, including elements such as the ground, fenders, and mudguards. However, since image acquisition typically occurs outdoors, it may be affected by factors such as shooting conditions and road debris. Consequently, further noise reduction or contrast enhancement is performed if severe degradation or noise artifacts are detected. Therefore, special image processing must be employed to analyze the characteristic differences between the tire image target and the background. Fig. 6 represents the tire image processing techniques: (A) median filtering, (B) contrast enhancement, (C) binarization, and (D) binary image filtering.
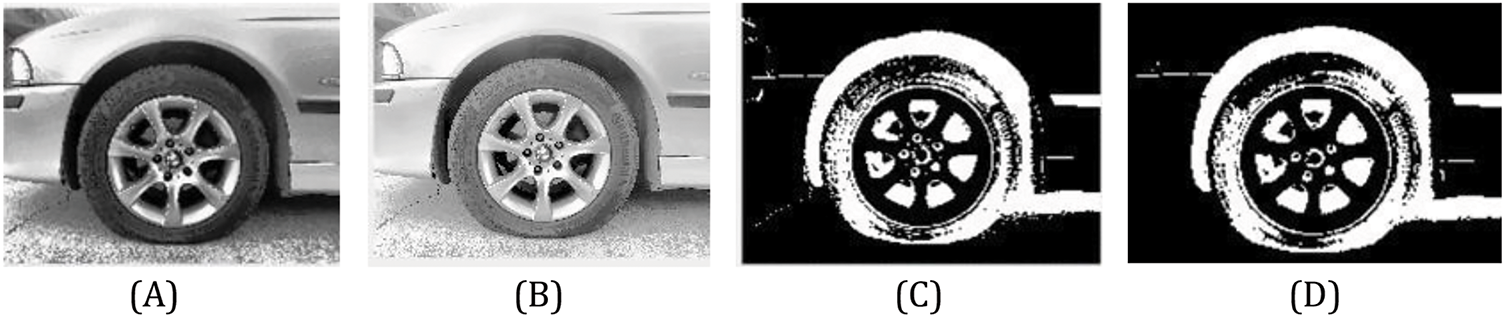
Figure 6: Tire image processing technology (A) Median filtering (B) Contrast enhancement (C) Binarization processing (D) Binary image filtering
Machine vision technology applied to deep learning for tire pressure detection is a relatively novel research direction. This technology, based on computer vision and image processing techniques, processes and analyzes tire images to achieve automatic tire pressure testing.
Specific research steps include:
1. Tire image collection: Utilize cameras or other imaging equipment to capture tire images, followed by pre-processing tasks such as image de-noising and smoothing.
2. Tire image feature extraction: Employ image processing technology to extract features related to tire pressure in tire images, such as uneven tire surfaces and the influence of internal air pressure on the tire.
3. Construction of tire pressure detection model: Build tire pressure detection models based on machine learning or deep learning algorithms. These models can classify and recognize tire images and output tire pressure values.
4. Output of tire pressure detection results: Display tire pressure detection results on a screen or other devices for users to view and analyze.
The advantage of this technology is its ability to achieve unmanned, automated testing, significantly improving detection efficiency and accuracy while reducing labor costs and errors.
GoogLeNet’s most distinctive feature is the grouping of convolution kernels and the application of the Network-in-Network concept, which replaces the linear convolution model with a multilayer perceptron. This improves the network’s expressive capacity while reducing the number of convolution parameters, thus forming an Inception module. Researchers have developed several different versions of the Inception module, corresponding to various GoogLeNet versions. This study refers to relevant literature, enhances the neural structure of traditional GoogLeNet, and aims to improve the accuracy of tire pressure image classification through customization. This research implements an optimized version of GoogLeNet, which performs exceptionally well in image classification problems.
The algorithm parameter settings are described here. To fairly verify the three methods, the parameter settings of the improved GoogLeNet, traditional GoogLeNet, and ResNet18 are the same. The specified algorithm is ‘sgdm’, utilizing a stochastic gradient descent (SGDM) optimizer with momentum. Verbose is set to 0, VerboseFrequency is 50, MaxEpochs is 5, MiniBatchSize is 4, Shuffle is True, every-epoch is True, ValidationFrequency is 3, ValidationPatience is 5, InitialLearnRate is 0.0001, Learn Rate Schedule is none, Learn Rate Drop Period is 10, Learn Rate Drop Factor is 0.1. L2Regularization is 0.0001, Momentum is 0.9, Gradient Threshold is Inf, Gradient Threshold Method is l2norm, SequenceLength is longest, Sequence Padding Value is 0, Execution Environment is multi-gpu, and cross-validation is 5-fold.
In order to evaluate the model’s convergence behavior under a wide range of conditions, we conducted experiments using multiple batch sizes (16, 32, 64) and learning rates (1 × 10⁻³, 1 × 10⁻⁴, 5 × 10⁻⁴), as well as multiple random initializations. The outcomes show that Softplus-LReLU remains stable when using small batch sizes and larger learning rates, exhibiting minimal gradient oscillations or training instabilities. Additionally, performance is relatively insensitive to different random weight initializations, indicating robust generalization across diverse conditions. Overall, these findings highlight Softplus-LReLU’s reliable and stable convergence properties, making it well-suited for various deep learning tasks that require consistency, resilience, and strong performance under dynamic training settings.
To enhance both the reliability and generalizability of our experimental results, we adopt repeated stratified 10-fold cross-validation in addition to the standard k-fold approach. Specifically, for our dataset of 900 images, we first partition the data into ten equal folds—each consisting of approximately 90 images (10%) for validation, while the remaining 810 images (90%) are used for training. After completing one 10-fold cycle, we repeat the same partitioning procedure three to five times (with random shuffling at each iteration). This process yields an average performance measure that more accurately reflects the model’s behavior across various partition schemes.
The results are validated using a confusion matrix when evaluating metrics, as shown in Fig. 7, with true labels trueLabels and predicted labels predictedLabels presenting a confusion matrix diagram. The rows of the confusion matrix correspond to the true classes, and the columns correspond to the predicted classes. Diagonal and off-diagonal cells correspond to correctly and misclassified observations, respectively. The normalized row summary on the right side of the plot shows the percentage of correctly and incorrectly classified observations for each true class. The lower column of the graph, Normalized, column summary, shows the percentage of correctly and misclassified observations for each predicted category.
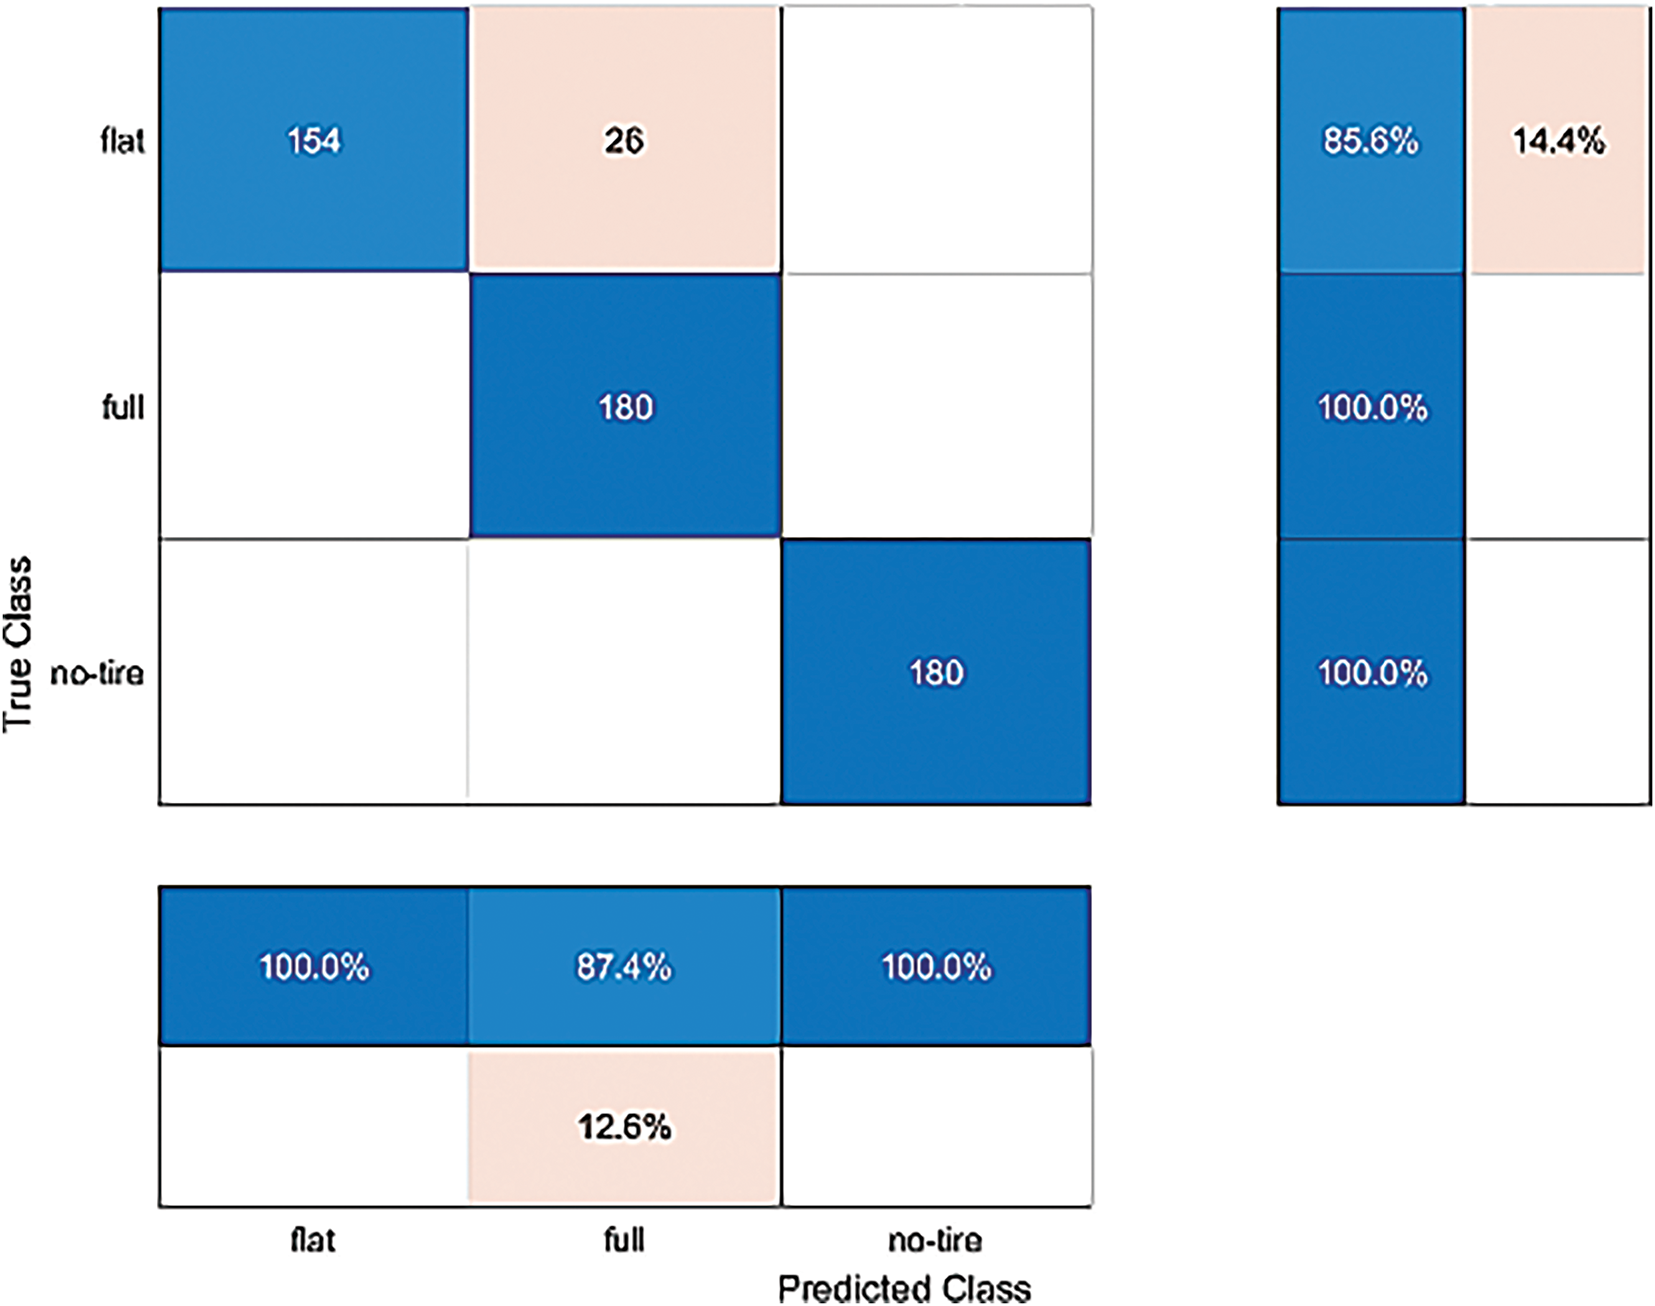
Figure 7: The confusion matrix of the traditional GoogleNet method in the test. The accuracy of the test is 95.1852%
Another important evaluation index in deep learning is the loss function and accuracy. These metrics can be used to judge whether the verification is at a good accuracy level. Accuracy is the model based on the given labels on the dataset. In other words, the label is the answer. The deep learning algorithm uses feature extraction of car tires to predict the classification of the 3 categories in the car tire database in the case of unknown labels. The result of the classification prediction is also compared with the original given label to confirm the evaluation result obtained. Loss is the loss value calculated by the preset loss function. The deep learning algorithm obtains the accuracy by verifying the model in the training and testing data sets. The ratio of the number of samples correctly classified by an algorithm or model to the total number of samples is calculated to evaluate the performance of the model. The goal is to measure the performance of the model. This study’s objective is to achieve the highest classification accuracy for car tires. Through the calculation of the loss function, the model parameters are updated. The goal is to reduce the optimization error. That is, under the joint action of the loss function and the optimization algorithm, the model’s empirical risk is reduced.
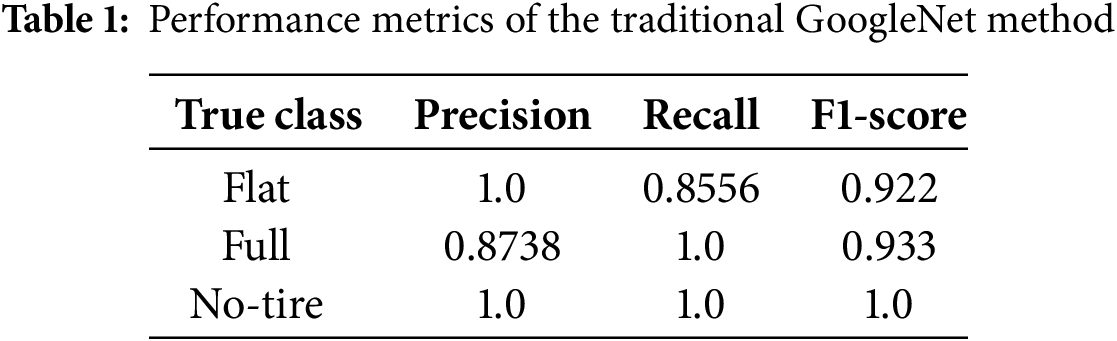
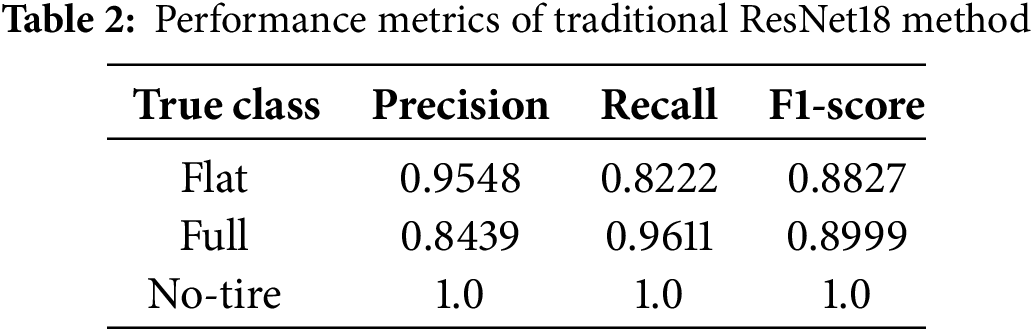
In the test of the traditional GoogLeNet method, 154 flat car tire pictures were classified correctly, and 26 were misclassified as full. In proportion, 85.6% were correctly classified, and 14.4% were misclassified. There are 180 correct classifications in the full car tire picture classification results, with a 100% correct classification rate. There are 180 correct classifications in the car tire no-tire image classification results, with a 100% correct classification rate. Fig. 7 shows that the traditional GoogLeNet method has a total accuracy of 95.1852% in the test classification. In Table 1, the performance metrics for the traditional GoogleNet method show strong overall results with some class-specific discrepancies. The flat class achieves perfect precision of 1.0 but exhibits reduced recall, indicating occasional misclassifications that lower its F1-score to 0.922. The full class attains a perfect recall of 1.0, though its precision of 0.8738 suggests overprediction. By contrast, the no-tire class achieves flawless performance across all metrics. These findings highlight the method’s effectiveness yet point to potential refinement in distinguishing flat and full instances.
Here, we choose the ResNet18 method similar to GoogLeNet for comparison. There are 3 categories with 180 images on the ResNet18 test. The results show that 148 of the car tire flat image classification results of ResNet18 were correctly classified, and 32 were misclassified to full. Calculated as a proportion, 82.2% were correctly classified and 17.8% were misclassified. In the classification results of full car tire images, 173 were correctly classified, and 7 were misclassified as flat. Calculated by proportion, 96.1% were correctly classified and 3.9% were misclassified. There are 180 correct classifications in the classification results of car tire no-tire images, and the correct classification is 100% in proportion. Fig. 8 shows that the total accuracy of the ResNet18 method in the test classification is 92.7778%. In Table 2, the traditional ResNet18 method displays generally high accuracy but reveals more pronounced misclassification patterns than those in Table 1. The flat class obtains 0.9548 precision and 0.8222 recall, which suggests occasional confusion with full. Meanwhile, the full class achieves a higher recall of 0.9611 but relatively lower precision at 0.8439, indicating some overprediction. The no-tire class again attains perfect scores. Although robust, this model’s slightly reduced effectiveness underscores the need for further refinement in separating flat from full.
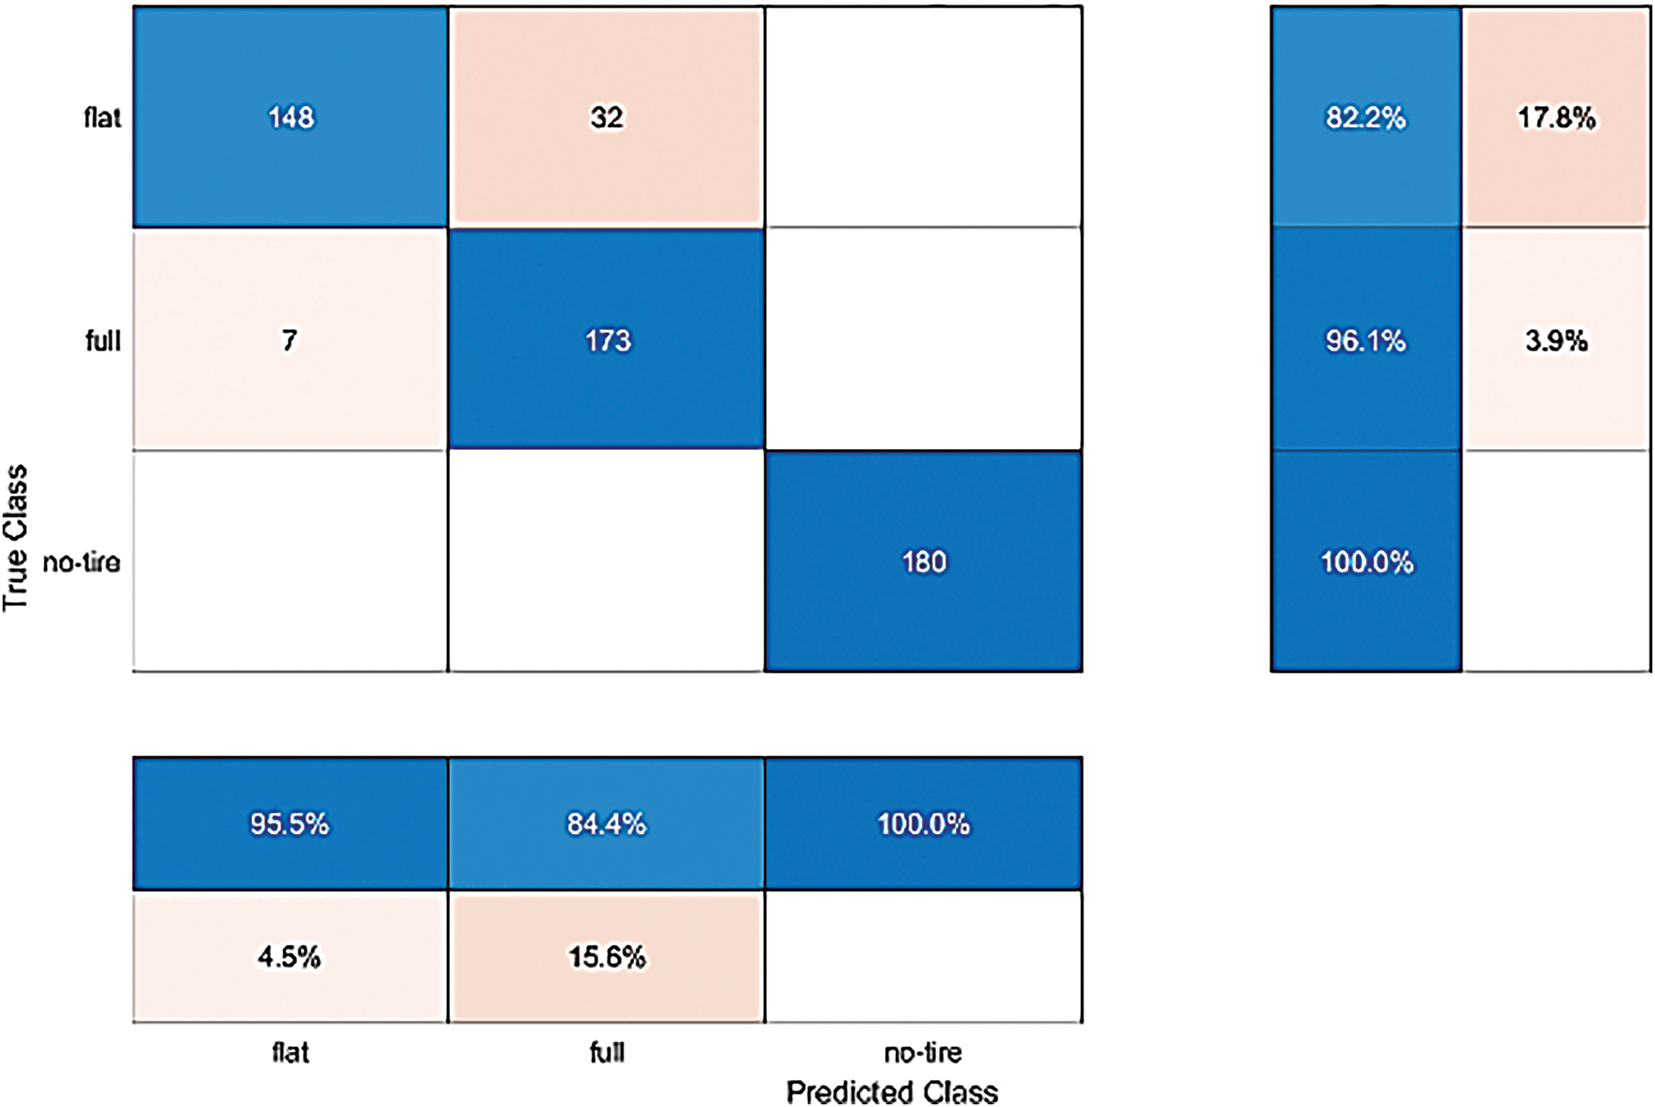
Figure 8: The confusion matrix of the traditional ResNet18 method in the test, the test accuracy rate is 92.7778%
In the present study, we opted to conduct a comparative analysis with an enhanced version of the GoogLeNet method. The evaluation of the improved GoogLeNet approach was segmented into three categories, with each category comprising 180 images. The findings indicated that, within the classification results of flat tire images using the modified GoogLeNet method, 172 images were accurately categorized, while 8 images were erroneously classified as intact. Calculated as a percentage, the accuracy rate for correct classification stood at 95.6%, with a misclassification rate of 4.4%. In the categorization outcomes for the entire set of tire images, all 180 images were precisely classified as flat, achieving an accuracy rate of 100%. Similarly, for the classification of images without tires, 180 images were correctly identified, maintaining an accuracy rate of 100%. Fig. 9 demonstrates that the overall accuracy rate of the refined GoogLeNet in test classification reached 98.518%. In Table 3, the improved GoogLeNet method delivers the strongest outcomes among the three approaches. Both flat and full classes reach near-perfect performance, each with F1-scores exceeding 0.97. Notably, the full class maintains a flawless recall of 1.0 alongside a precision of 0.9574, illustrating minimal confusion with other categories. The no-tire class once again shows perfect metrics. These improvements confirm that the modified GoogLeNet architecture substantially reduces errors observed in prior models, achieving superior accuracy and reliability for all classes.
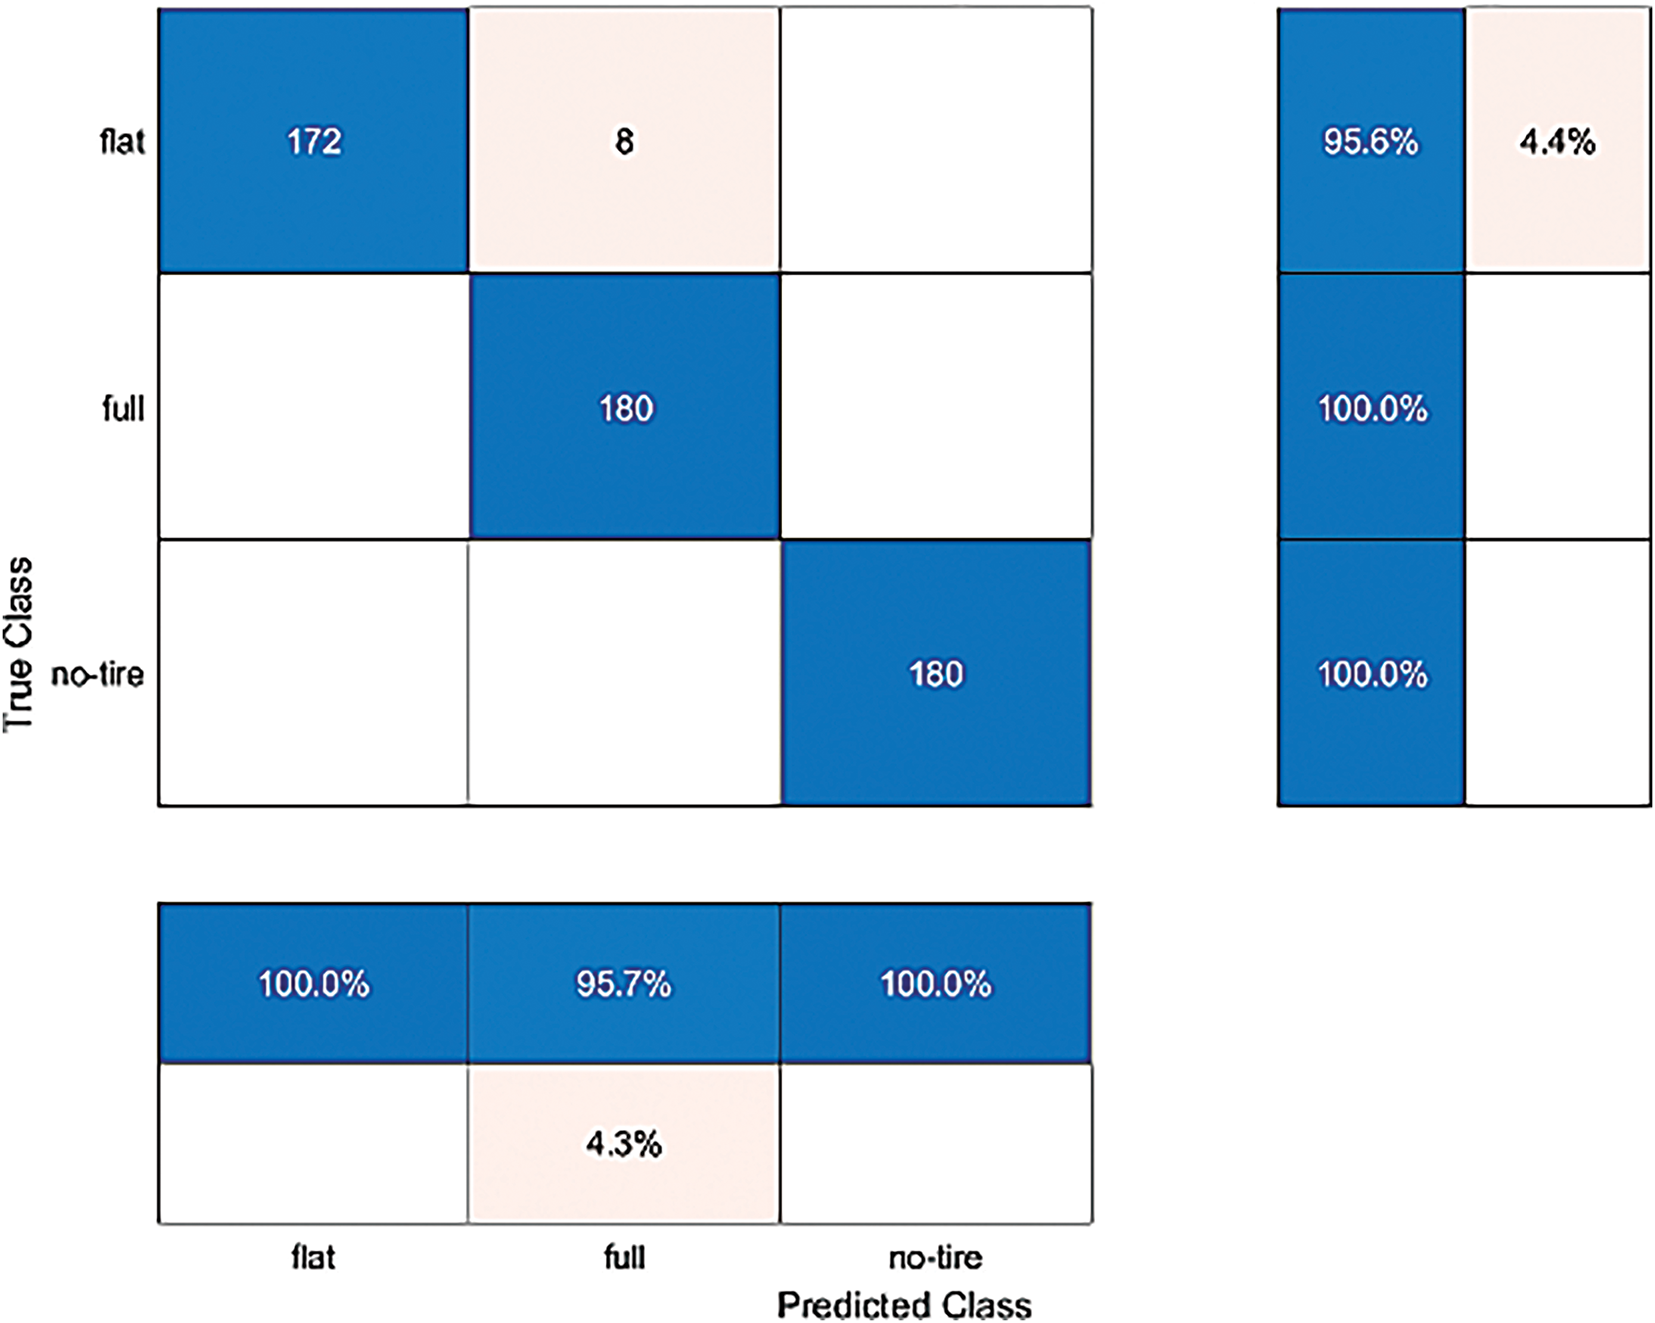
Figure 9: The confusion matrix of the improved GoogLeNet method in the test, the test accuracy rate is 98.518%
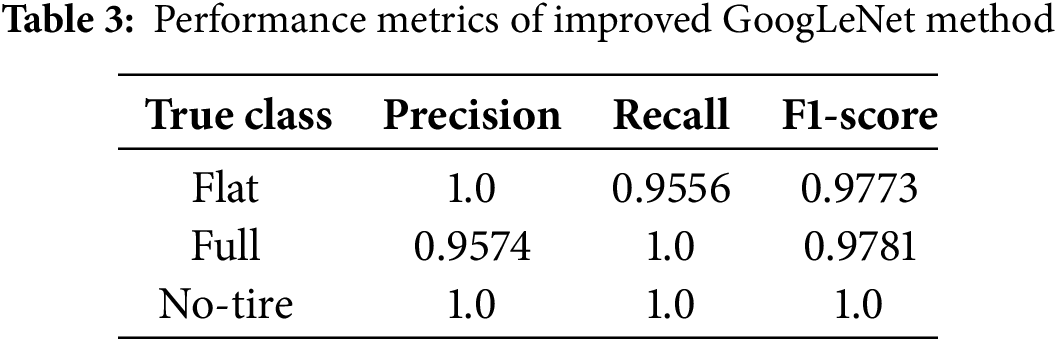
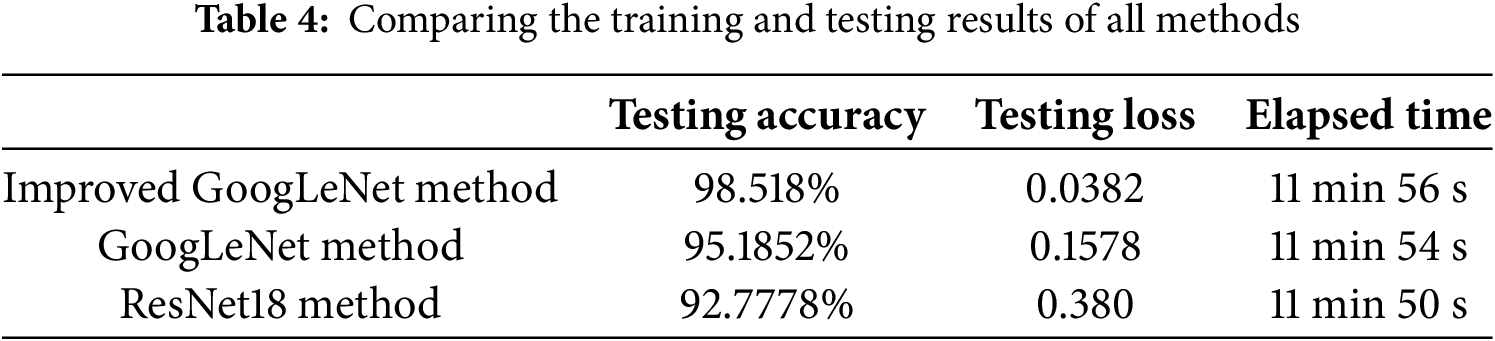
Table 4 presents a comprehensive comparison of the testing performance metrics and computational efficiency for three image classification methodologies applied to the detection of internal tire pressure in automobiles: the improved GoogLeNet method, the original GoogLeNet framework, and the ResNet18 architecture. The improved GoogLeNet method achieved the highest testing accuracy of 98.518% and the lowest testing loss of 0.0382, demonstrating its robust generalization capability and superior ability to accurately classify internal tire pressure images. In contrast, the original GoogLeNet method attained a testing accuracy of 95.1852% and a testing loss of 0.1578, indicating moderate performance improvements over the baseline. The ResNet18 method exhibited the lowest testing accuracy of 92.7778% and the highest testing loss of 0.380, reflecting its inferior generalization performance compared to both versions of GoogLeNet. Additionally, the elapsed times for all three methods were remarkably similar, with the improved GoogLeNet method requiring 11 min and 56 s, the original GoogLeNet method taking 11 min and 54 s, and the ResNet18 method completing in 11 min and 50 s. The minimal differences in computational time suggest that the architectural enhancements introduced in the improved GoogLeNet method do not compromise computational efficiency. These results collectively underscore the superior testing performance of the improved GoogLeNet method, highlighting its effectiveness in accurately classifying internal tire pressure images while maintaining efficient processing times. This affirms the improved GoogLeNet method’s suitability for applications demanding high precision and rapid computation, thereby positioning it as a highly effective solution for intelligent tire pressure detection systems.
In this study, we undertook a comprehensive enhancement of the GoogLeNet network architecture to improve the accuracy of detecting internal tire pressure, focusing on several key areas. Firstly, internal optimization of the Inception module was performed by making structural modifications to adapt to the complexity of features associated with internal tire pressure. This included the introduction of additional maxPooling2d layers and corresponding downsampling layers within the Inception module, which facilitated efficient computational utilization and the fusion of multi-dimensional features, thereby addressing limitations when applying the traditional GoogLeNet to specific use cases. Secondly, batch normalization algorithms were selected and applied to accelerate training and improve network stability. Thirdly, we proposed a novel Softplus-LReLU activation function that merges the benefits of Leaky ReLU (LReLU) and Softplus functions; this function retains partial negative axis data, amends data distribution, and mitigates the probability of neuron “death,” achieving non-linear and smooth mapping functions that enhance sparse representation capability and non-linear mapping. Additionally, dropout was incorporated to prevent overfitting, with careful selection of dropout ratios to balance robustness and training efficiency. Finally, an improved Softplus-LReLU classifier was implemented in the classification layer to further enhance model performance. These architectural enhancements collectively contributed to significant improvements in the model’s ability to accurately classify internal tire pressure images, demonstrating the effectiveness of the proposed modifications in addressing the challenges associated with this specific application.
The improved GoogLeNet method outperforms the original GoogLeNet and ResNet18 methods across all performance metrics. The significant improvements in training and testing accuracies, coupled with reduced losses, underscore the effectiveness of the architectural modifications. The integration of the Softplus-LReLU activation function and other enhancements contribute to superior generalization and learning capabilities. These findings highlight the improved GoogLeNet method’s exceptional capability in accurately classifying car tire images, evidencing its potential to significantly elevate the precision of tire pressure detection systems. The enhancements do not compromise computational efficiency, making it a promising choice for applications requiring high accuracy and speed. The detailed comparison showcases the methodological superiority of the improved GoogLeNet, setting a benchmark for future research in image-based classification systems. Internal parameter optimization and network structural improvements, especially within the Inception module, effectively elevate the accuracy of internal tire pressure detection. This study demonstrates that targeted architectural enhancements can lead to significant performance gains in specific application scenarios.
Softplus-LReLU’s gradient-preserving property, combined with the enhanced Inception modules’ multi-scale features, shows promise for broader vision tasks such as image segmentation or object detection. By maintaining stable gradient flow even in deeper networks, Softplus-LReLU helps avoid vanishing gradients, which is crucial for pixel-level segmentation and accurate bounding-box regression. Meanwhile, the Inception modules’ multi-scale architecture accommodates objects or regions of varied sizes, facilitating robust performance under complex or cluttered backgrounds. Future research can extend this approach to well-known benchmarks like MS COCO or Cityscapes, evaluating its efficacy in identifying multiple objects and capturing fine-grained details. If successful, the modified GoogLeNet combined with Softplus-LReLU could serve as a flexible backbone for numerous high-level vision tasks, enhancing both convergence stability and feature diversity across diverse image domains.
For real-time inference using the modified GoogLeNet model, Minimum Hardware Requirements include at least a mid-range GPU (e.g., NVIDIA GTX 1660) or a high-performance CPU (e.g., Intel Core i7) with 8 GB of RAM. Real-time processing Capabilities show that inference on a single tire image typically completes in about 30 ms (30 FPS), sufficient for most driving scenarios; if higher resolution or more complex preprocessing is needed, strategies such as batch-size reduction or mixed-precision inference help maintain near-real-time performance. Integration with Existing Vehicle Systems can be achieved via an OBD-II or CAN bus framework, connecting the camera through USB or serial interfaces, and sending outputs via CAN signals or network protocols (UDP/TCP). A sturdy camera housing reduces vibration or debris interference, and sensor fusion with ADAS systems may further boost overall safety.
Despite the promising outcomes observed thus far, several tasks remain beyond the current scope due to constraints in resources, project timelines, and data availability. First, we have not yet performed thorough ablation studies to isolate the contributions of each architectural modification (e.g., Inception module tweaks, Softplus-LReLU activation). We plan to conduct these systematic comparisons once additional computational resources become available, ensuring that the role of each modification is quantified. Second, while we acknowledge the importance of extensive hyperparameter tuning (e.g., grid or Bayesian searches) for model robustness, limited time and hardware capacity currently prevent us from exploring the entire parameter space. Future expansions of our computational resources will allow us to refine these procedures and optimize performance further. Third, our investigation of system scalability and integration with real-world automotive platforms remains preliminary; we intend to collaborate with industry partners for larger-scale evaluations and to develop comprehensive integration schematics detailing the end-to-end workflow, including sensor fusion and control unit interfaces. Lastly, we will incorporate error distribution visualizations to better understand the model’s failure modes and guide targeted solutions, thereby enhancing both the transparency and efficacy of our approach. Through these efforts, we aim to build a more complete foundation for real-world tire pressure detection, culminating in a robust, generalizable framework for broader applications in automotive safety systems and beyond. Although this study focused on detecting underinflated tires, the proposed model’s architecture and methodology offer promising scalability for other automotive safety testing scenarios, such as detecting tire wear patterns or structural damage. We plan to expand our dataset to capture a wider array of tire conditions and vehicle types, and to refine the model’s feature extraction capabilities to accommodate additional cues (e.g., worn treads, sidewall punctures). By integrating these enhancements, our approach could serve as a more comprehensive solution for real-time vehicle safety monitoring, ultimately helping to reduce road hazards and maintenance costs.
In this study, we developed an automated tire pressure inspection system using an improved GoogLeNet architecture and the Softplus-LReLU activation function. We validated that combining the smooth transition of Softplus with a linear adjustment term enhanced gradient stability and computational efficiency, prevented neuronal death, and optimized feature extraction. We also demonstrated that the system achieved high classification accuracy for normal tires, underinflated tires, and no-tire scenarios, thereby providing rapid, reliable alerts to prevent vehicle damage and casualties. This approach significantly contributed to automated tire inspections, highlighting the potential of integrated AI-driven solutions in vehicle safety.
We further acknowledge the importance of a more comprehensive theoretical derivation and experimental comparison with alternative activation functions (e.g., ReLU, Swish) to strengthen the justification for Softplus-LReLU. While our focus was on the feasibility and suitability of integrating Softplus-LReLU into GoogLeNet for small-sample tasks, we plan to conduct additional experiments that quantitatively compare different activation functions and provide deeper insights into Softplus-LReLU’s advantages and limitations. We also recognize the value of ablation studies to break down the individual contributions of Softplus-LReLU and the architectural refinements in GoogLeNet; although such analyses would significantly expand the scope of this paper, we intend to perform rigorous ablation experiments in future work. Looking ahead, we will integrate more extensive hyperparameter optimization procedures, explore scalability with larger datasets and varied deployment environments, and refine sensor fusion approaches for real-time inference on embedded platforms. By embracing these enhancements, we aim to broaden the system’s applicability, facilitate its adoption in the automotive industry, and advance tire pressure monitoring and management technologies.
Acknowledgement: Not applicable.
Funding Statement: The author would like to thank the National Science and Technology Council, Taiwan, for financially supporting this research (Grant No. NSTC 113-2221-E-018-011) and Ministry of Education’s Teaching Practice Research Program, Taiwan (PSK1134099).
Availability of Data and Materials: Not applicable.
Ethics Approval: Not applicable.
Conflicts of Interest: The author declares no conflicts of interest to report regarding the present study.
References
1. Wang J, Fu P, Gao RX. Machine vision intelligence for product defect inspection based on deep learning and Hough transform. J Manuf Syst. 2019;51(3):52–60. doi:10.1016/j.jmsy.2019.03.002. [Google Scholar] [CrossRef]
2. Ren Z, Fang F, Yan N, Wu Y. State of the art in defect detection based on machine vision. Int J Precis Eng Manuf Green Technol. 2022;9(2):661–91. doi:10.1007/s40684-021-00343-6. [Google Scholar] [CrossRef]
3. Gunawan AAS, Tanjung DA, Gunawan FE. Detection of vehicle position and speed using camera calibration and image projection methods. Procedia Comput Sci. 2019;157(6):255–65. doi:10.1016/j.procs.2019.08.165. [Google Scholar] [CrossRef]
4. Uddin MP, Al Mamun M, Ali Hossain M. PCA-based feature reduction for hyperspectral remote sensing image classification. IETE Tech Rev. 2021;38(4):377–96. doi:10.1080/02564602.2020.1740615. [Google Scholar] [CrossRef]
5. Beckmann M, Bhandari A, Krahmer F. The modulo radon transform: theory, algorithms, and applications. SIAM J Imaging Sci. 2022;15(2):455–90. doi:10.1137/21M1424615. [Google Scholar] [CrossRef]
6. Yuan MD, Feng DZ, Shi Y, Liu WJ. Dimensionality reduction by collaborative preserving Fisher discriminant analysis. Neurocomputing. 2019;356(Part 2):228–43. doi:10.1016/j.neucom.2019.05.014. [Google Scholar] [CrossRef]
7. Hyvärinen A, Oja E. Independent component analysis: algorithms and applications. Neural Netw. 2000;13(4–5):411–30. doi:10.1016/S0893-6080(00)00026-5. [Google Scholar] [PubMed] [CrossRef]
8. Tharwat A. Independent component analysis: an introduction. Appl Comput Inform. 2021;17(2):222–49. doi:10.1016/j.aci.2018.08.006. [Google Scholar] [CrossRef]
9. Migenda N, Möller R, Schenck W. Adaptive dimensionality reduction for neural network-based online principal component analysis. PLoS One. 2021;16(3):e0248896. doi:10.1371/journal.pone.0248896. [Google Scholar] [PubMed] [CrossRef]
10. Buades A, Coll B, Morel JM. A review of image denoising algorithms, with a new one. Multiscale Model Simul. 2005;4(2):490–530. doi:10.1137/040616024. [Google Scholar] [CrossRef]
11. Li S, Kang X, Hu J. Image fusion with guided filtering. IEEE Trans Image Process. 2013;22(7):2864–75. doi:10.1109/TIP.2013.2244222. [Google Scholar] [PubMed] [CrossRef]
12. Yang WQ, Peng L. Image reconstruction algorithms for electrical capacitance tomography. Meas Sci Technol. 2003;14(1):R1–13. doi:10.1088/0957-0233/14/1/201. [Google Scholar] [CrossRef]
13. Egmont-Petersen M, de Ridder D, Handels H. Image processing with neural networks—a review. Pattern Recognit. 2002;35(10):2279–301. doi:10.1016/S0031-3203(01)00178-9. [Google Scholar] [CrossRef]
14. Muhammad M, Zeebaree D, Brifcani AMA, Saeed J, Zebari DA. Region of interest segmentation based on clustering techniques for breast cancer ultrasound images: a review. J Appl Sci Technol Trends. 2020;1(2):78–91. doi:10.38094/jastt20201328. [Google Scholar] [CrossRef]
15. Brickson LL, Hyun D, Jakovljevic M, Dahl JJ. Reverberation noise suppression in ultrasound channel signals using a 3D fully convolutional neural network. IEEE Trans Med Imaging. 2021;40(4):1184–95. doi:10.1109/TMI.2021.3049307. [Google Scholar] [PubMed] [CrossRef]
16. Patel P, Thakkar A. The upsurge of deep learning for computer vision applications. Int J Electr Comput Eng. 2020;10(1):538. doi:10.11591/ijece.v10i1.pp538-548. [Google Scholar] [CrossRef]
17. Guo J, He H, He T, Lausen L, Li M, Lin H, et al. Gluoncv and gluonnlp: deep learning in computer vision and natural language processing. J Mach Learn Res. 2020;21(1):845–51. [Google Scholar]
18. Nguyen G, Dlugolinsky S, Bobák M, Tran V, López García Á, Heredia I, et al. Machine Learning and Deep Learning frameworks and libraries for large-scale data mining: a survey. Artif Intell Rev. 2019;52(1):77–124. doi:10.1007/s10462-018-09679-z. [Google Scholar] [CrossRef]
19. Dargan S, Kumar M, Ayyagari MR, Kumar G. A survey of deep learning and its applications: a new paradigm to machine learning. Arch Comput Meth Eng. 2020;27(4):1071–92. doi:10.1007/s11831-019-09344-w. [Google Scholar] [CrossRef]
20. Wu P, Liu J, Li M, Sun Y, Shen F. Fast sparse coding networks for anomaly detection in videos. Pattern Recognit. 2020;107(7):107515. doi:10.1016/j.patcog.2020.107515. [Google Scholar] [CrossRef]
21. Luo W, Liu W, Lian D, Tang J, Duan L, Peng X, et al. Video anomaly detection with sparse coding inspired deep neural networks. IEEE Trans Pattern Anal Mach Intell. 2021;43(3):1070–84. doi:10.1109/TPAMI.2019.2944377. [Google Scholar] [PubMed] [CrossRef]
22. Fang W, Zhong B, Zhao N, Love PED, Luo H, Xue J, et al. A deep learning-based approach for mitigating falls from height with computer vision: convolutional neural network. Adv Eng Inform. 2019;39(7):170–7. doi:10.1016/j.aei.2018.12.005. [Google Scholar] [CrossRef]
23. Schütt KT, Gastegger M, Tkatchenko A, Müller KR, Maurer RJ. Unifying machine learning and quantum chemistry with a deep neural network for molecular wavefunctions. Nat Commun. 2019;10(1):5024. doi:10.1038/s41467-019-12875-2. [Google Scholar] [PubMed] [CrossRef]
24. Tammina S. Transfer learning using VGG-16 with deep convolutional neural network for classifying images. Int J Sci Res Publ IJSRP. 2019;9(10):143–50. doi:10.29322/IJSRP.9.10.2019.p9420. [Google Scholar] [CrossRef]
25. Wang P, Fan E, Wang P. Comparative analysis of image classification algorithms based on traditional machine learning and deep learning. Pattern Recognit Lett. 2021;141(11):61–7. doi:10.1016/j.patrec.2020.07.042. [Google Scholar] [CrossRef]
26. Okwuashi O, Ndehedehe CE. Deep support vector machine for hyperspectral image classification. Pattern Recognit. 2020;103(4):107298. doi:10.1016/j.patcog.2020.107298. [Google Scholar] [CrossRef]
27. Mirjalili S, Dong J, Sadiq AS, Faris H. Genetic algorithm: theory, literature review, and application in image reconstruction. Nat-Inspired Optimizers: Theories, Lit Rev Appl. 2020;811:69–85. [Google Scholar]
28. Li D, Deng L, Cai Z. Intelligent vehicle network system and smart city management based on genetic algorithms and image perception. Mech Syst Signal Process. 2020;141(4):106623. doi:10.1016/j.ymssp.2020.106623. [Google Scholar] [CrossRef]
29. Muhuri PK, Ashraf Z, Goel S. A novel image steganographic method based on integer wavelet transformation and particle swarm optimization. Appl Soft Comput. 2020;92(s2):106257. doi:10.1016/j.asoc.2020.106257. [Google Scholar] [CrossRef]
30. Kaur M, Singh D, Sun K, Rawat U. Color image encryption using non-dominated sorting genetic algorithm with local chaotic search based 5D chaotic map. Future Gener Comput Syst. 2020;107(8):333–50. doi:10.1016/j.future.2020.02.029. [Google Scholar] [CrossRef]
31. Azamfirei V, Psarommatis F, Lagrosen Y. Application of automation for in-line quality inspection, a zero-defect manufacturing approach. J Manuf Syst. 2023;67(9):1–22. doi:10.1016/j.jmsy.2022.12.010. [Google Scholar] [CrossRef]
32. Huang H, Meng F, Zhou S, Jiang F, Manogaran G. Brain image segmentation based on FCM clustering algorithm and rough set. IEEE Access. 2019;7:12386–96. doi:10.1109/ACCESS.2019.2893063. [Google Scholar] [CrossRef]
33. Lin SL. Research on tire crack detection using image deep learning method. Sci Rep. 2023;13(1):8027. doi:10.1038/s41598-023-35227-z. [Google Scholar] [PubMed] [CrossRef]
34. Szegedy C, Liu W, Jia Y, Sermanet P, Reed S, Anguelov D, et al. Going deeper with convolutions. In: 2015 IEEE Conference on Computer Vision and Pattern Recognition (CVPR); 2015 Jun 7–12; Boston, MA, USA: IEEE; 2015. p. 1–9. doi:10.1109/CVPR.2015.7298594. [Google Scholar] [CrossRef]
35. Szegedy C, Vanhoucke V, Ioffe S, Shlens J, Wojna Z. Rethinking the inception architecture for computer vision. In: Proceedings of IEEE Conference on Computer Vision and Pattern Recognition; 2016 Jun 27–30; Las Vegas, NV, USA. p. 2818–26. [Google Scholar]
36. Iandola FN, Han S, Moskewicz MW, Ashraf K, Dally WJ, Keutzer K. SqueezeNet: AlexNet-level accuracy with 50x fewer parameters and <0.5 MB model size. arXiv:1602.07360. 2016. [Google Scholar]
37. Qassim H, Verma A, Feinzimer D. Compressed residual-VGG16 CNN model for big data places image recognition. In: Proceedings of 2018 IEEE 8th Annual Computing and Communication Workshop and Conference (CCWC); 2018; Las Vegas, NV, USA. p. 169–75. doi:10.1109/CCWC.2018.8301729. [Google Scholar] [CrossRef]
Cite This Article
 Copyright © 2025 The Author(s). Published by Tech Science Press.
This work is licensed under a Creative Commons Attribution 4.0 International License , which permits unrestricted use, distribution, and reproduction in any medium, provided the original work is properly cited.
 Downloads
 Citation Tools