 Open Access
ARTICLE
Guided Wave Based Composite Structural Fatigue Damage Monitoring Utilizing the WOA-BP Neural Network
College of Fiber Engineering and Equipment Technology, Jiangnan University, Wuxi, 214122, China
* Corresponding Author: Dongyue Gao. Email:
(This article belongs to the Special Issue: Computing Technology in the Design and Manufacturing of Advanced Materials)
Computers, Materials & Continua 2025, 83(1), 455-473. https://doi.org/10.32604/cmc.2025.060617
Received 06 November 2024; Accepted 30 December 2024; Issue published 26 March 2025
Abstract
Fatigue damage is a primary contributor to the failure of composite structures, underscoring the critical importance of monitoring its progression to ensure structural safety. This paper introduces an innovative approach to fatigue damage monitoring in composite structures, leveraging a hybrid methodology that integrates the Whale Optimization Algorithm (WOA)-Backpropagation (BP) neural network with an ultrasonic guided wave feature selection algorithm. Initially, a network of piezoelectric ceramic sensors is employed to transmit and capture ultrasonic-guided waves, thereby establishing a signal space that correlates with the structural condition. Subsequently, the Relief-F algorithm is applied for signal feature extraction, culminating in the formation of a feature matrix. This matrix is then utilized to train the WOA-BP neural network, which optimizes the fatigue damage identification model globally. The proposed model’s efficacy in quantifying fatigue damage is tested against fatigue test datasets, with its performance benchmarked against the traditional BP neural network algorithm. The findings demonstrate that the WOA-BP neural network model not only surpasses the BP model in predictive accuracy but also exhibits enhanced global search capabilities. The effect of different sensor-receiver path signals on the model damage recognition results is also discussed. The results of the discussion found that the path directly through the damaged area is more accurate in modeling damage recognition compared to the path signals away from the damaged area. Consequently, the proposed monitoring method in the fatigue test dataset is adept at accurately tracking and recognizing the progression of fatigue damage.Keywords
Composite materials, renowned for their lightweight, high specific strength, and high specific modulus, have become indispensable in the aerospace industry [1–3]. These materials, integral to aerospace structures, are subject to prolonged fatigue loads, posing a significant risk of damage in the complex operational environments they encounter [4]. The implementation of real-time fatigue damage monitoring systems is pivotal for the timely detection of potential structural vulnerabilities and the issuance of preemptive alerts, thereby safeguarding the integrity and reliability of composite structures [5–8].
Ultrasonic-guided waves, with their expansive inspection range, heightened sensitivity to damage, and ability to access traditionally challenging areas, have emerged as a prominent technique in nondestructive evaluation [9–13]. They enable the precise identification of internal damage, including micro-cracks and delamination, and have garnered considerable interest within the domain of composite aerospace structural health monitoring, heralded as a method with immense potential for application.
Traditional approaches to ultrasonic-guided wave-based structural health monitoring often rely on comparative analyses of signal characteristics pre- and post-damage, correlating damage indices with the condition of the structure, and identifying damage states against predefined thresholds [14–18]. However, the intricate and varied nature of real-world operational conditions can confound sensing signal characteristics, complicating the establishment of a direct correlation between specific signal features and structural damage using a physical model [19].
Machine learning offers a robust solution to these complexities, with an array of studies leveraging its capabilities for guided wave-based structural damage identification [20–24]. Among neural network technologies, the Backpropagation (BP) neural network stands out for its user-friendliness and robust approximation capabilities [25–28]. Unlike conventional methods, the BP neural network sidesteps the need to define a functional relationship between structural responses and physical parameters, focusing instead on establishing linear or nonlinear mappings between inputs and outputs. Despite these advantages, the BP neural network’s susceptibility to local optima and its slower convergence rates present challenges in the context of structural damage identification.
The introduction of the Whale Optimization Algorithm (WOA) marked a significant advancement in the field of population-based intelligent optimization algorithms. Characterized by its straightforward structure and prowess in global optimization, WOA has rapidly gained traction for addressing optimization challenges [29]. Notably, it offers a compelling solution to the tendency of Backpropagation (BP) neural networks to converge prematurely on local minima, a common issue in neural network training. The algorithm’s utility extends to the realm of damage monitoring, where it has been successfully harnessed by researchers to develop and validate novel methods for quantifying and identifying structural damage across a spectrum of damage scenarios [30–34].
This paper delves into the integration of WOA with feature engineering techniques to enhance the selection of sensing signal features pivotal to the structural damage state, thereby augmenting the predictive accuracy of our model. Furthermore, we employ WOA to refine the BP neural network, crafting an optimized structural damage prediction model that mitigates the drawbacks of slow computational speed and susceptibility to local minima inherent in traditional BP networks. The robustness of our approach is substantiated through rigorous testing against a composite fatigue test dataset, demonstrating that the hybrid WOA-BP neural network model outperforms its BP counterpart in terms of predictive precision and global search efficacy. The results corroborate the method’s efficacy in the precise identification of the progression of structural damage.
2 Structural Damage Identification Method Combining Feature Engineering and Optimized Machine Learning Algorithm
2.1 Structural Health Monitoring System Based on Ultrasonic-Guided Wave
Under fatigue loads, composite structures may experience a variety of failure modes, including matrix cracking, delamination, and fiber breakage. The initiation of composite laminate failure often stems from micro-cracks within the matrix. These micro-cracks are precipitated by localized stress concentrations around material defects and accumulate progressively as fatigue loads are applied. Should the interfacial stress surpass a critical threshold, delamination within the composite can initiate and propagate swiftly, culminating in structural collapse within a brief timeframe.
This study introduced a health monitoring system for composite structures that relies on ultrasonic guided waves, featuring an integrated pair of piezoelectric transducers (PZTs). As depicted in Fig. 1, an electrical signal was initially delivered to one PZT, designated as the actuator, to generate a guided wave within the structure. The wave then traverses the composite, being subsequently detected by a second PZT, known as the sensor. Leveraging the piezoelectric effect, the sensor transformed the structural vibrations into electrical signals, which were emitted as the monitoring output. During propagation, guided waves were perturbed by the presence of defects, inducing signal alterations that facilitate the monitoring and precise localization of damage. By assessing the health condition of each path using the ultrasonic guided wave signals captured across various actuator-to-sensor pathways, the system could locate the regions of fatigue damage within the composite structure [35,36].
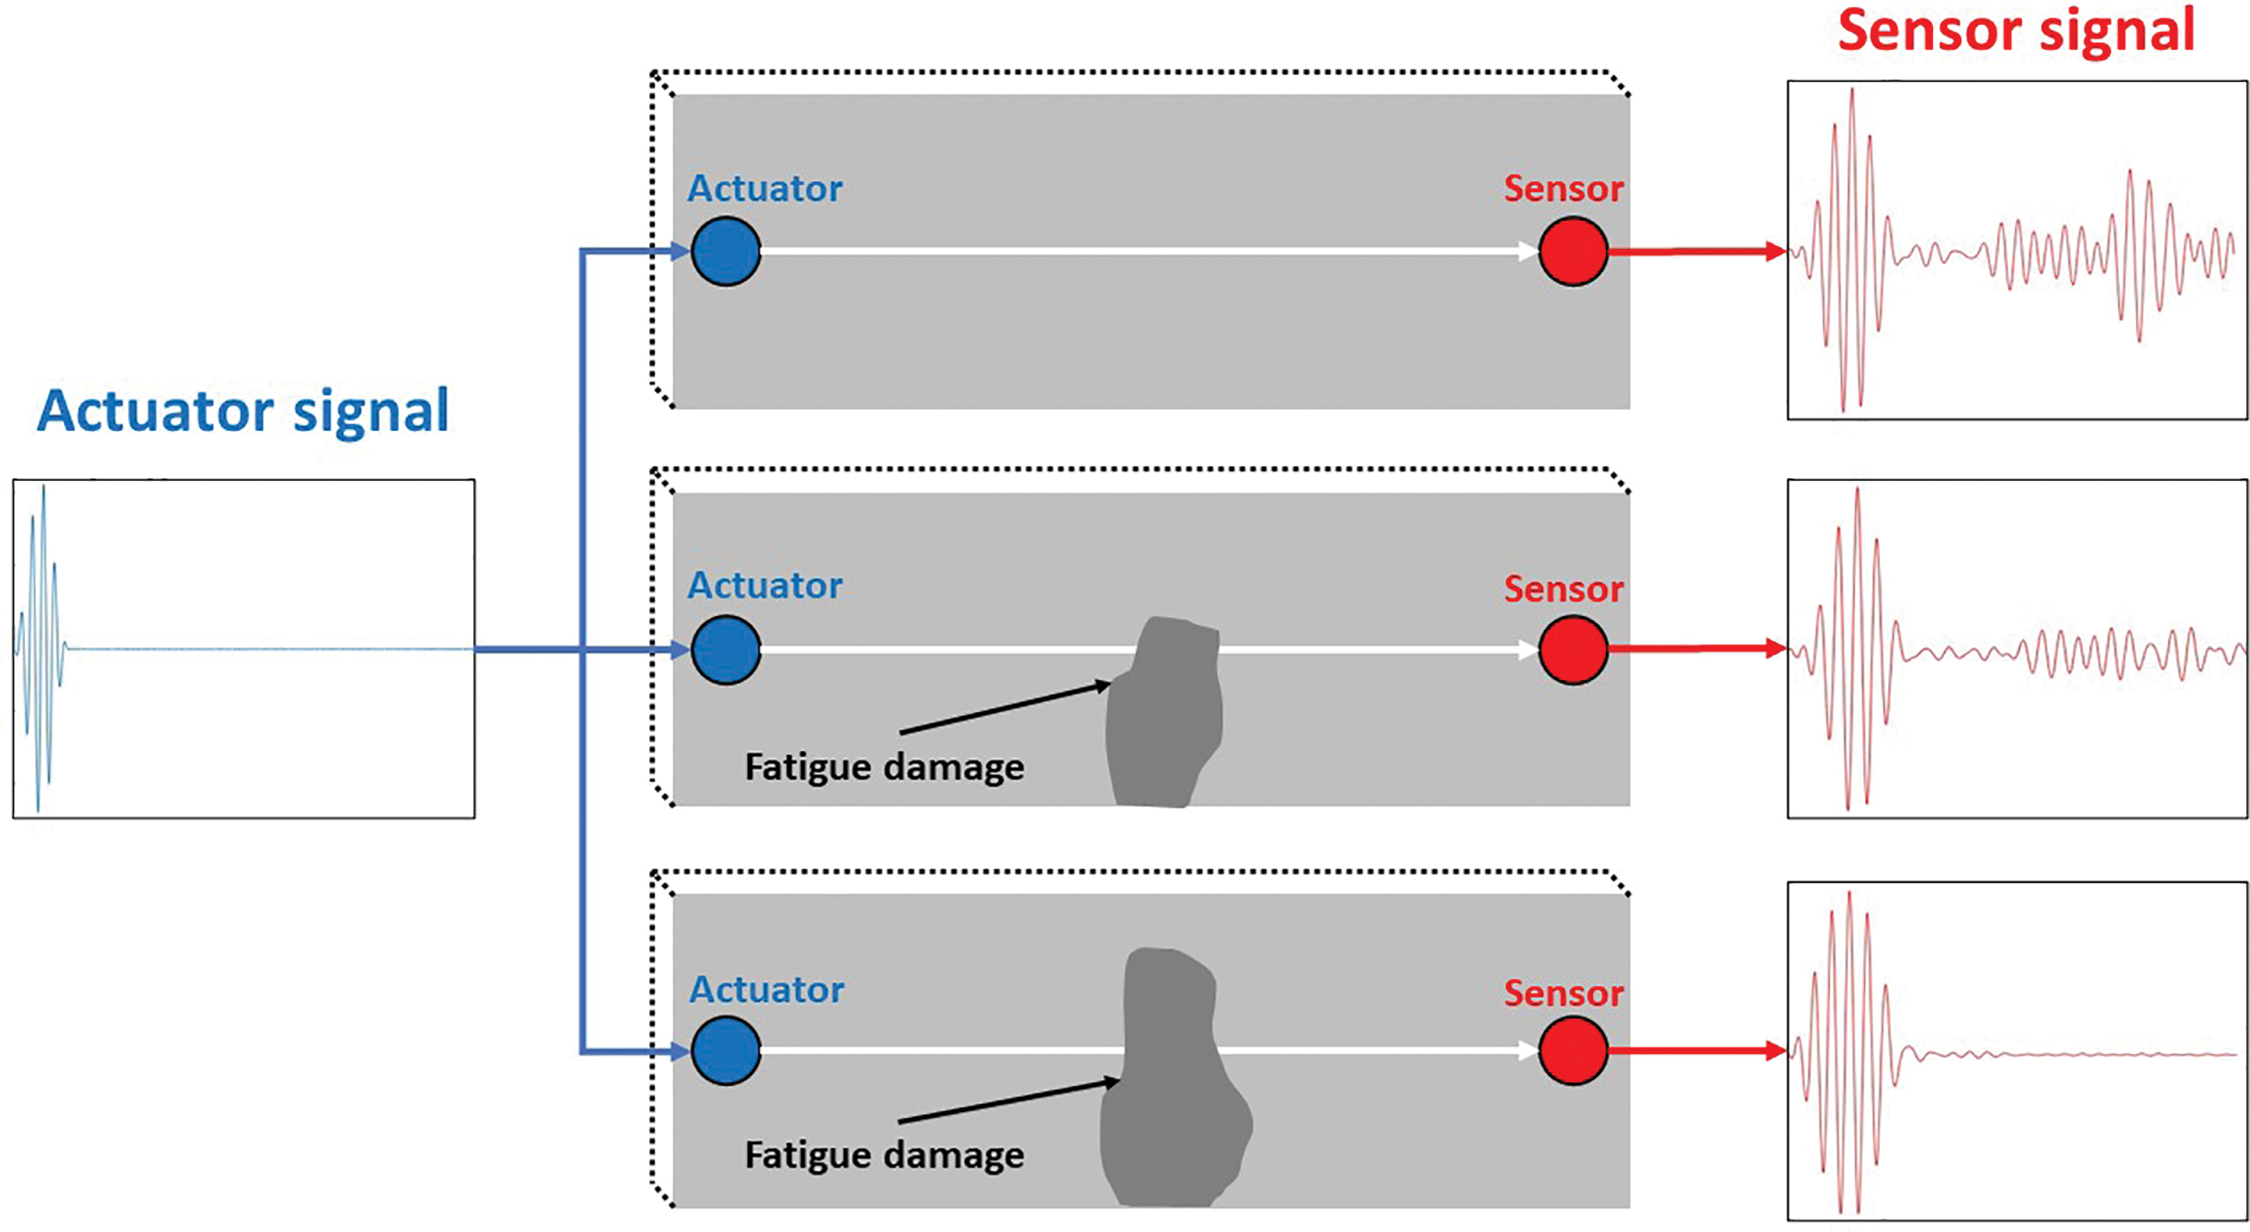
Figure 1: Schematic diagram of the composite structural health monitoring system under different damage conditions with guided wave signals excited and received by PZT sensors
In guided wave based structural health monitoring, the propagation of the guided wave is divided into three phases: excitation, propagation, and reception phases. During the excitation phase of the guided wave, the piezoelectric sensor operates based on the following principle: when mechanical stress is applied to the sensor, it generates an electrical charge due to the piezoelectric effect. This can be mathematically represented as:
Eq. (1) is the equation for the conversion of electric field into strain, i.e., the inverse piezoelectric effect, where
where
In a free boundary plate, the fluctuation equation for the displacement of the plasma point is:
where μ and λ are Lamé constants, u is displacement,
Given an excitation at a point on the plate, the resulting energy encounters the upper and lower boundary surfaces of the plate, causing the modes of the longitudinal and transverse waves to shift. As the energy propagates along the plate, superposition allows the formation of wave groups or guided wave modes in the plate.
The guided wave dispersion equations for symmetric and asymmetric modes are shown below:
where k denotes the number of waves, h is half the thickness of the specimen, and the parameters p and q are defined by the following equation:
where
However, for N-layer anisotropic composite plates, the propagation of guided waves is more complicated. Guided waves on a composite plate can usually be described by a displacement field, with each layer satisfying the Navier displacement equation:
where
As shown in Eq. (9), the amplitude of the guided wave decays by
where
where
When the strain is transmitted to the receiving sensor through the coupling effect of the adhesive layer to drive the sensor deformation triggered piezoelectric effect eventually into an electrical signal, driven by the plate strain
where
According to the piezoelectric effect, the strain of the sensor is converted into a voltage signal
where
During guided wave propagation, the characterization of the response signal is influenced by factors such as the sensor, structural material properties, and structural dimensions. When damage such as microcracks and delamination occurs in the plate structure, parameters such as the plate’s modulus of elasticity and boundary conditions for wave propagation are change, leading to corresponding changes in the guided wave signal.
2.2 Ultrasonic Guided Wave Signal Feature Extraction
The regression model based on signal features will affect the stability of the regression model in the phase of dimensionality reduction. At the same time, in the case of low signal to noise ratio (SNR), it is important to build a model with multiple signal features to retain as much signal matrix information as possible. In this paper, 5 features of signal time domain and 5 features of signal frequency domain are selected to model the damage monitoring. The FFT is used to convert the guided wave signal in the time-frequency domain, as shown below:
where
The Time domain signal features include: the peak of signal related to the propagation efficiency of Lamb wave energy, of the signal main peak affected by the Lamb wave mode transformation (Time of Flight, TOF), the root mean square describing the signal energy, the standard deviation representing the degree of signal dispersion, and the margin index representing the degree of peak extreme in the waveform. The characteristics of the signal in the frequency domain include: the barycenter frequency describing the power spectrum of the spectrum signal, the standard deviation reflecting the dispersion of the signal in the frequency domain, the mean square frequency describing the energy of the spectrum signal, the signal band energy (±25 kHz), and the relative power spectrum entropy representing the signal chaos. The characteristic expressions of damage signals preliminarily selected are shown in Table 1.

2.3 Damage Monitoring Modeling Based on WOA-BP Neural Network and Relief-F Algorithm
In the process of damage prediction model establishment, selecting the appropriate sensing signal features is helpful to improve the accuracy of the damage prediction model. It is difficult for a single signal feature to fully explain the signal changes under different damage conditions, so it is necessary to construct a model containing multiple signal features to explain the damage. At the same time, not every signal feature is associated with damage, so feature optimization is needed to build a good model to predict damage. The Relief-F algorithm is a feature weight algorithm that assigns different weights to features according to the relevance of each feature and category. Features with weights smaller than a certain threshold will be removed.
where W(A) is the weight of the A-th feature, R is the sample randomly selected from the training set, H is the nearest neighbor sample of the same class set R, M is the nearest neighbor sample of the different class set R, diff(A, R1, R2) represents the difference between sample R1 and sample R2 on feature A, and its calculation formula is as follows:
In the application of BP neural network, there are many local optimal solutions, which affect the accuracy of the model. To solve this challenge, WOA is used to optimize the BP neural network. The core of this method is to optimize the initial weights and thresholds of the BP neural network to avoid falling into the local optimal solution.
Since the position of the optimal design in the search space is not known a priori, the WOA algorithm assumes that the current best candidate solution is the target prey or is close to the optimum. After the best search agent is defined, the other search agents will hence try to update their positions towards the best search agent [29]. This behavior is represented by the following equations:
where t indicates the current iteration,
where
Fig. 2a shows the possible positions from (X, Y) towards (X∗, Y∗) that can be achieved by 0 ≤ A ≤ 1 in a 2D space. As can be seen in Fig. 2b, this approach first calculates the distance between the whale located at (X, Y) and prey located at (X∗, Y∗). A spiral equation is then created between the position of whale and prey to mimic the helix-shaped movement of humpback whales as follows:
where
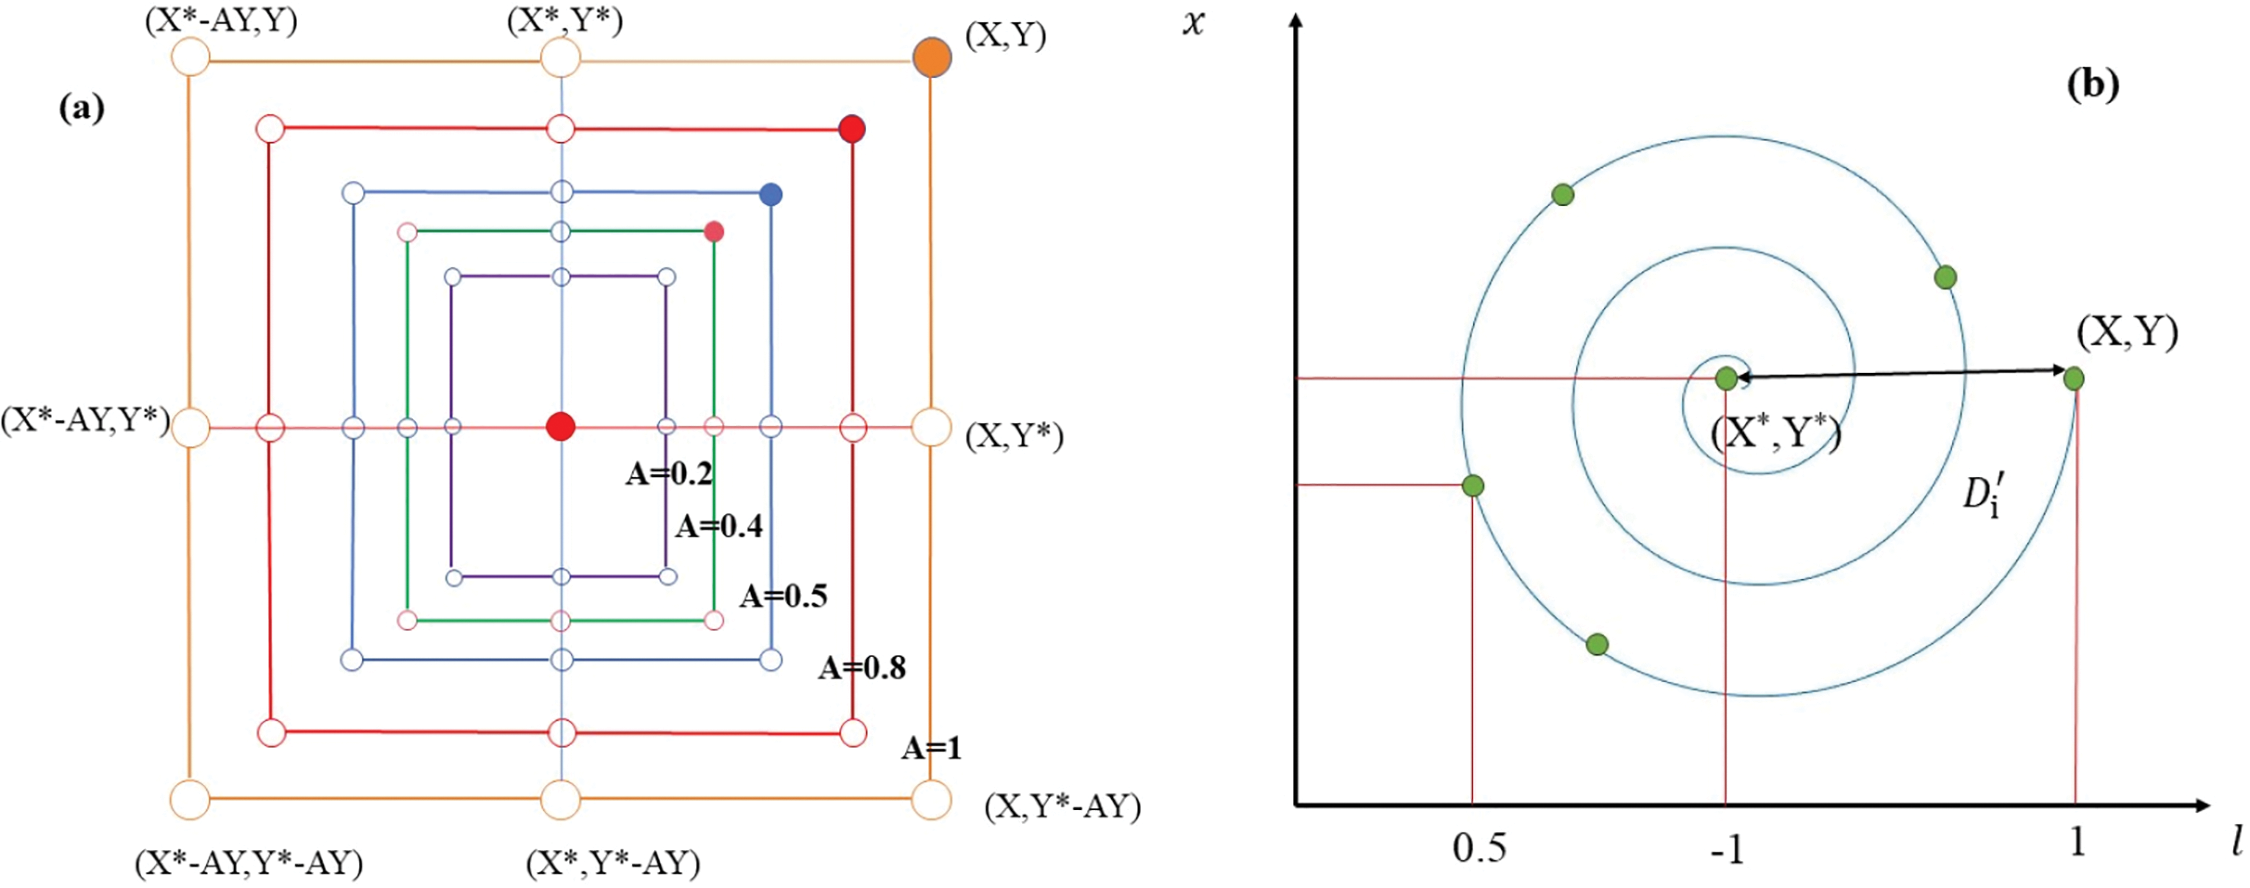
Figure 2: Bubble-net search mechanism implemented in WOA (X∗ is the best solution obtained so far): (a) shrinking encircling mechanism and (b) spiral updating position
We assume that there is a probability of 50% to choose between either the shrinking encircling mechanism or the spiral model to update the position of whales during optimization. The mathematical model is as follows:
where
WOA introduces also another mechanism called exploration phase. Its main role is to explore the search space away from the current best solution in order to potentially find a better one. Therefore, WOA has a global search ability. The mathematical model is as follows:
where
Aiming at the structural characteristics and load characteristics in fatigue loading damage monitoring of composite materials, this paper combined Relief-F algorithm and WOA-BP neural network to propose the structural damage identification method, as shown in Fig. 3.
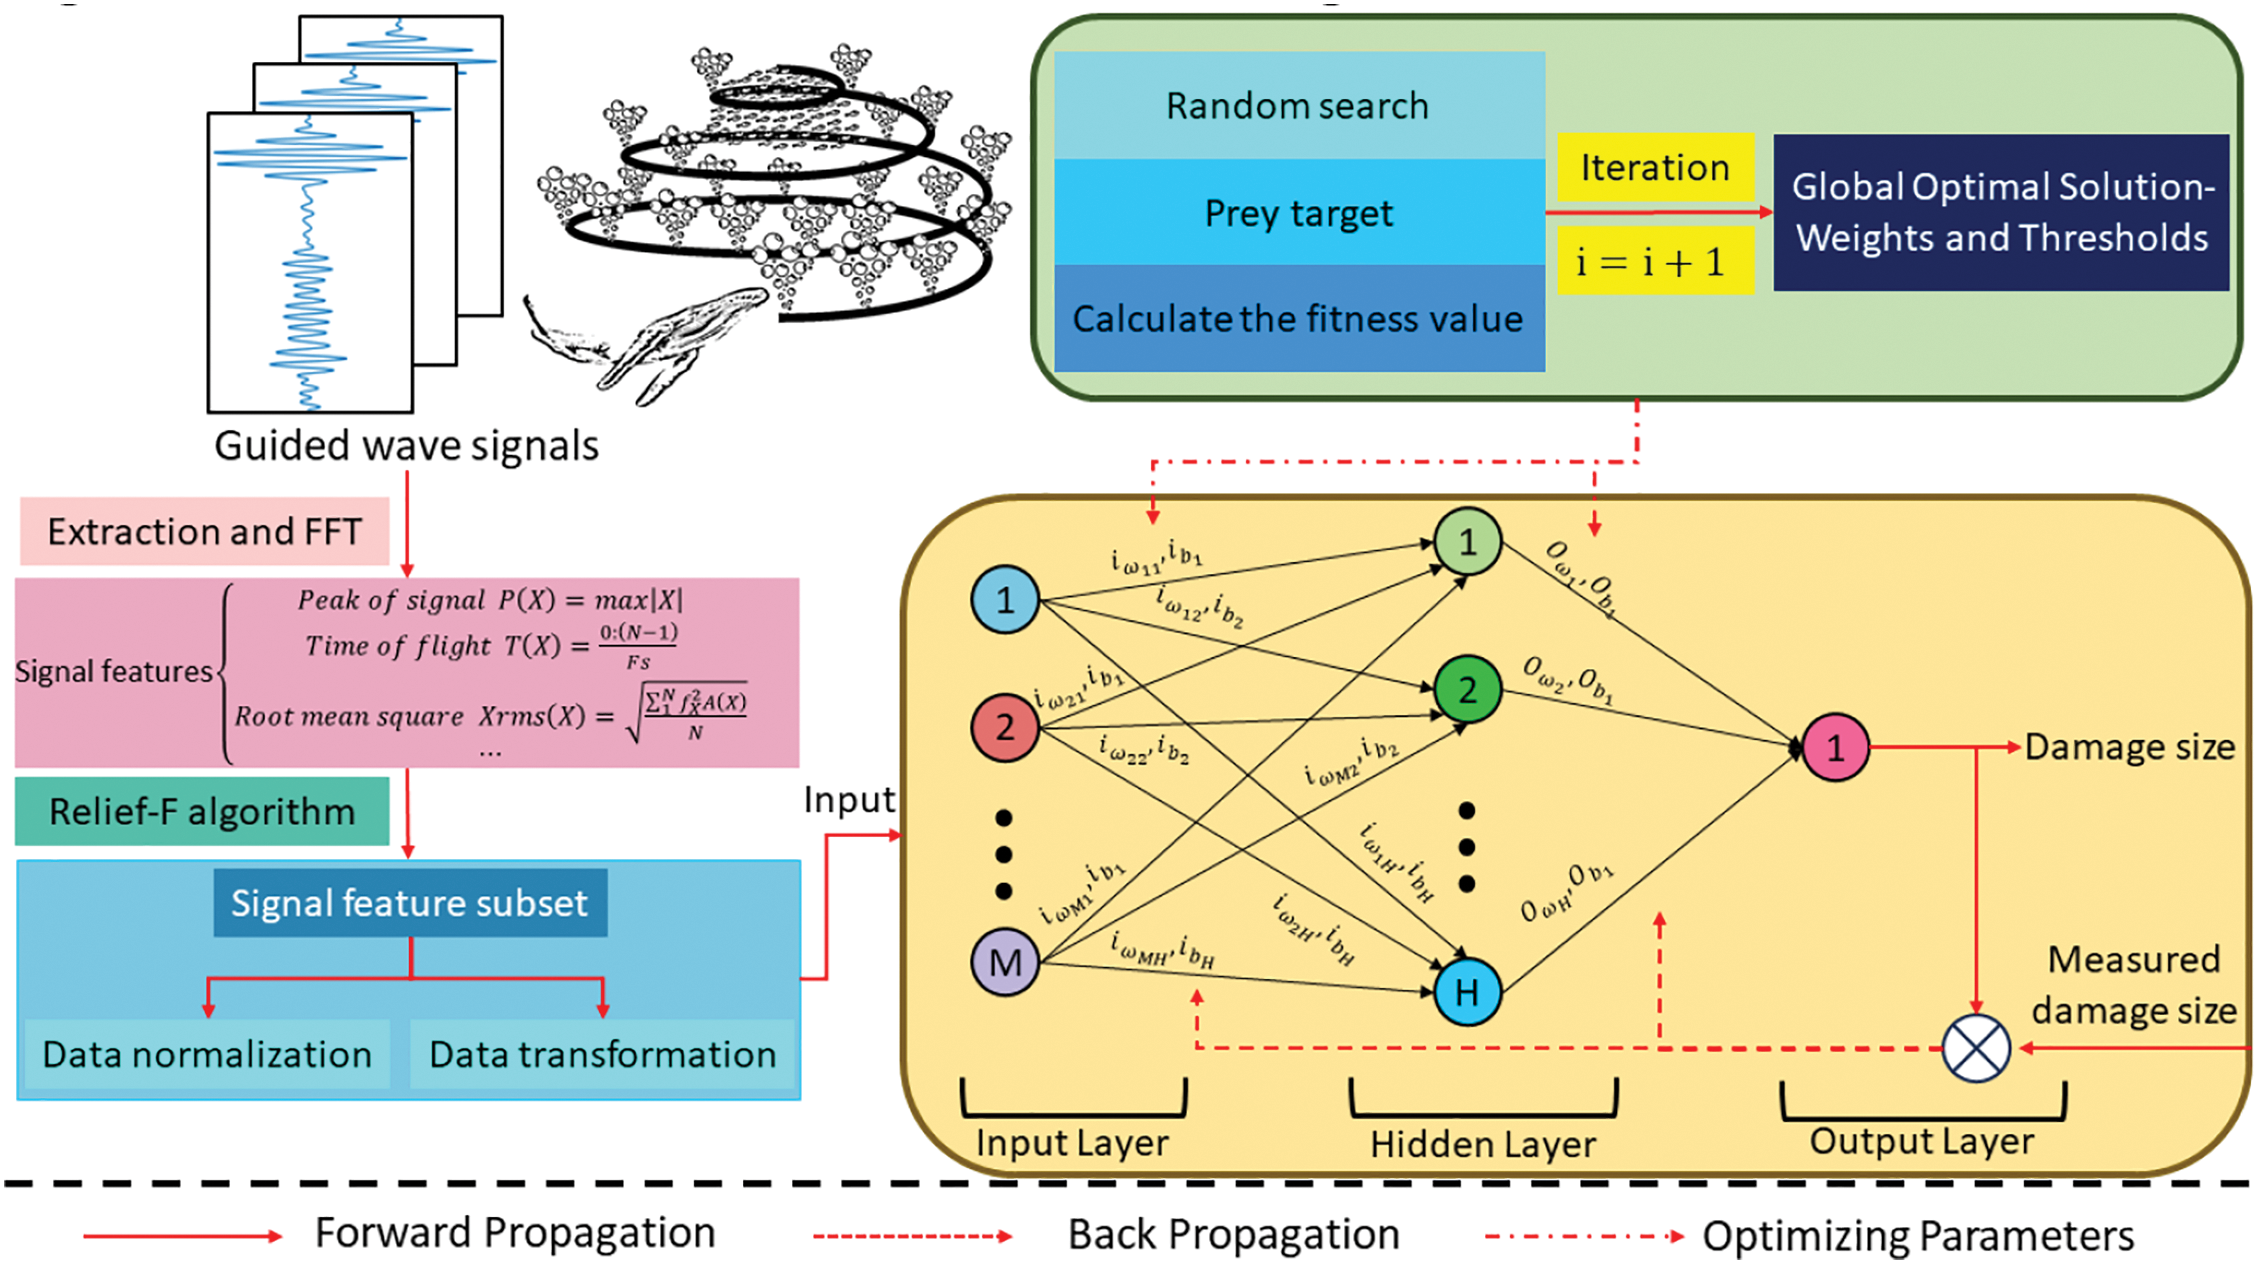
Figure 3: Damage monitoring model flow chart of Relief-F algorithm combined with WOA-BP neural network
As shown in Fig. 3, in the damage monitoring method, the complete feature set data is first input, the Relief-F algorithm is used for feature selection, the optimal feature subset is obtained, and the data is preprocessed. Then, the weights and thresholds of the BP neural network are initialized. According to the training results of the BP neural network, the initial weights and thresholds are converted into the position vector of WOA, and other basic parameters of the WOA algorithm are initialized. WOA algorithm is used to randomly search and prey on targets, calculate individual fitness value, and find out the position of the optimal fitness value by judging whether the output is stable, so as to obtain the optimal weight and threshold value. Finally, the weight and threshold values are constantly updated by calculating errors, and the optimization algorithm is terminated when the maximum number of iterations is met or the error accuracy is reached. The current optimal parameters are assigned to the BP neural network, and the output is obtained to obtain the WOA-BP model. The main role of the WOA algorithm is to overcome the tendency of BP neural networks to fall into local optimal solutions. In this paper, the damage recognition accuracy of the model is tested by fatigue damage monitoring tests of composite materials.
In the figure,
3 Fatigue Loading Damage Diagnostic Test of Composite Materials
This paper uses the data set of fatigue aging tests of CFRP composites conducted by the Stanford Structure and Composites Laboratory (SACL) in collaboration with the Prediction Center of Excellence (PCoE) at NASA Ames Research Center [37]. In this test, a group of specimens was subjected to a tensile fatigue test under cyclic load control with a frequency of 5.0 Hz and a stress ratio of R = 0.14, as shown in Fig. 4.
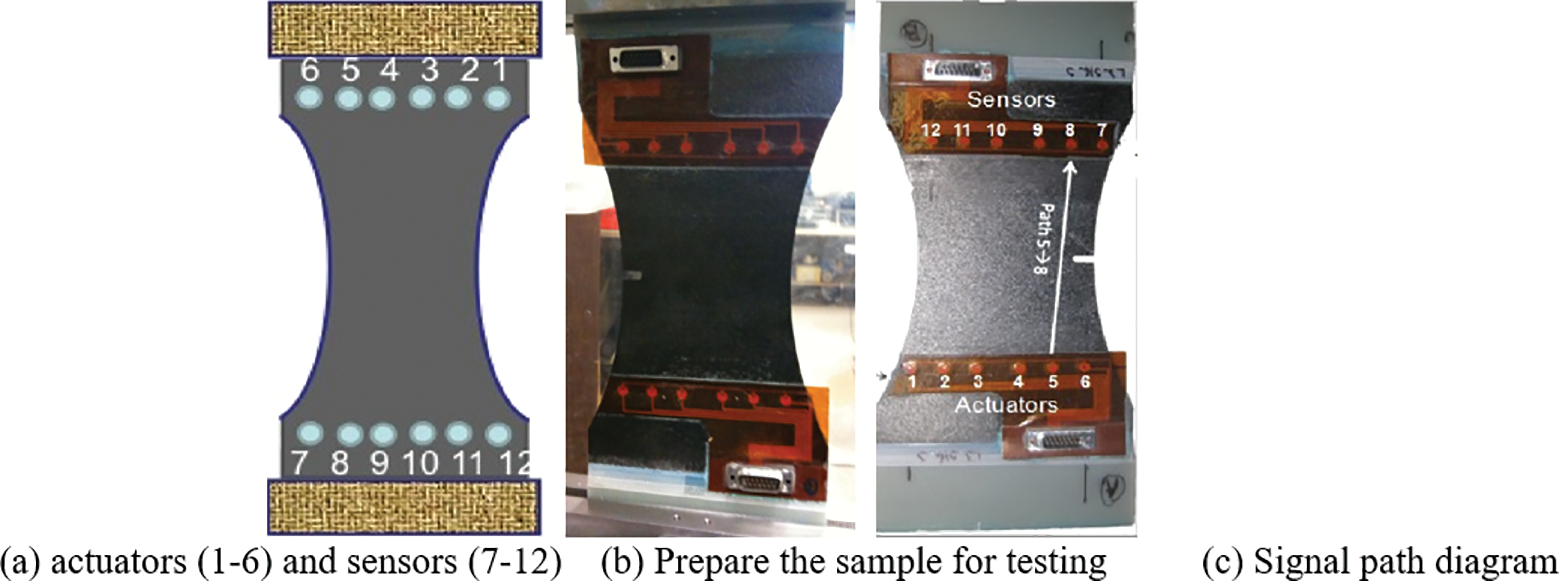
Figure 4: Schematic diagram of the specimen
The specimen was made of Torayca T700G uniaxial carbon prepreg with a size of 15.24 cm × 25.4 cm and a geometric shape of a dog bone. A 5.08 mm × 19.3 mm notch was created in the specimen to induce stress concentration. Three composite material samples with different lay-up configurations were tested. In this paper, the Layup1: [02/904]s was selected for specimen L1S19.
All tests were performed on MTS test machines in accordance with ASTM standards D3039 and D3479. The ultrasonic guided wave signal is transmitted and received through 12 PZT sensor SMART Layer (including 6 actuators and 6 sensors). The 36 “actuator→sensor” paths in the range of 150–450 KHz at 50 KHz intervals produce 7 excitation frequencies with an average input voltage of 50V. The fatigue cycle test was stopped at a specific fatigue cycle number, PZT sensor data for all paths and frequencies were collected, and X-ray imaging of the specimen was performed.
The fatigue data of the samples were collected under three different boundary conditions: 1) The samples were loaded with average load; 2) The sample was unloaded but supported; 3) The specimen was removed from the (absolute 0 load) test machine. In the data file, the experimental record file describes the state of the specimen and the loading process in detail, including the sound emitted by the specimen during the loading process, the surface shape of the specimen, and the abnormal response of the guided wave signal.
When the fatigue load is applied to the composite structure, fatigue damage such as matrix micro-cracks and delamination will occur in the structure. During guided wave propagation, these local defects can be captured into the sensor signal, allowing us to detect and locate them within the structure. Specifically, the path away from the damaged area is considered to be in a healthy state, while the path directly through the damaged area is considered to be in a damaged state [38]. Therefore, in this paper, three signal features of the “actuator-sensor” path, 4#→9#, 5#→8#, 6#→7#, which can reflect the damage state of specimens, are selected respectively to form the sample library.
Fig. 5 shows the Lamb wave signal of specimen L1S19 with path 6#→7# and 150 kHz under different fatigue cycles. As shown in the figure, with the increase of load times, the amplitude and energy of the signal both decrease in the process of the specimen being gradually destroyed, and finally decay to zero. At the same time, with the expansion of damage, the signal energy of signal path 6 #→7 #, 5 #→8 #, 4 #→9 # gradually decays. The trend of decreasing energy is related to the distance between the path and the damage center.

Figure 5: Lamb wave signals under different cycle fatigue times and different signal paths: (a) Lamb wave signal under signal path 6#→7# at 150 kHz; (b) Lamb wave signal under signal path 5#→8# at 150 kHz; and (c) Lamb wave signal under signal path 4#→9# at 150 kHz
3.2 Fatigue Damage Characterization of Specimens
The X-ray images of specimen L1S19 after 1, 10,000, 100,000, and 125,000 fatigue cycles are shown in Fig. 6.
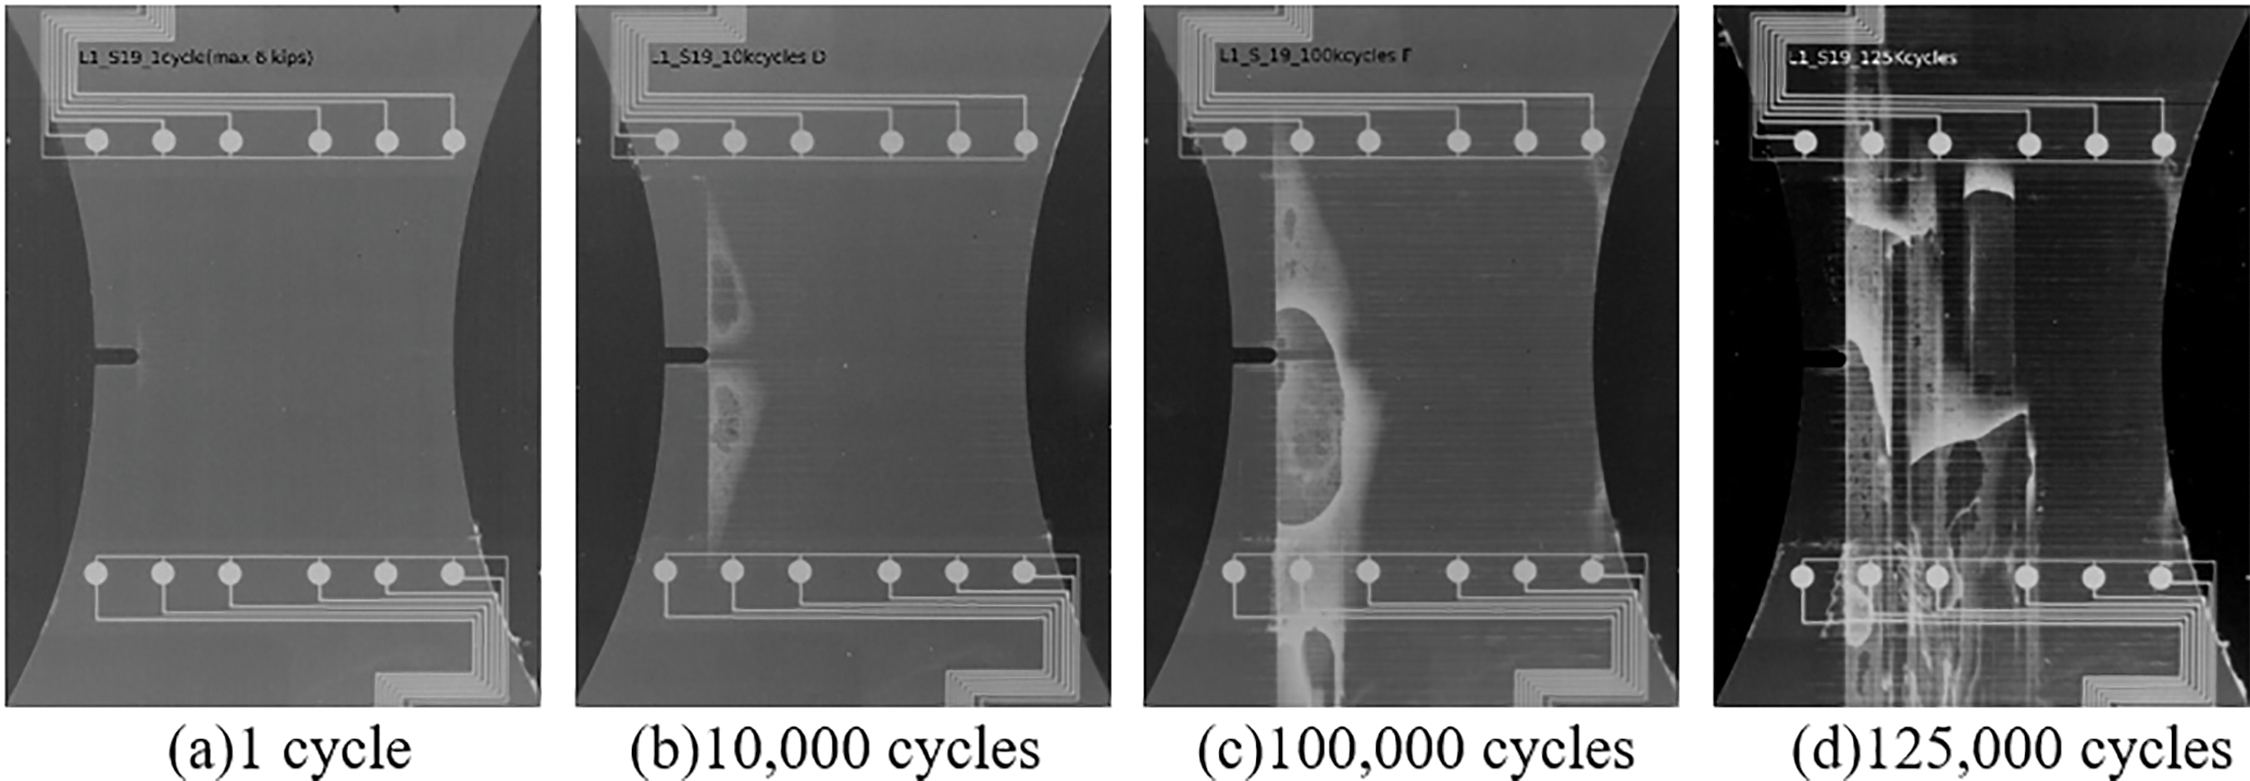
Figure 6: X-ray images of specimens under different cyclic fatigue times
From the X-ray diagram, it can be intuitively seen that with the increase of fatigue cycles, the damage extends from signal path 6#→7# to path 1#→12# along the prefabricated gap, and the damage area keeps increasing. The damage forms are various, including matrix crack, delamination and fiber fracture, and finally the failure of the specimen structure.
A general rectangular frame contour damage measurement method is used in the field of nondestructive testing for standard damage size sampling, as shown in Fig. 7a. According to X-ray images, the damage expansion trend of different cycles was measured, as shown in Fig. 7b.
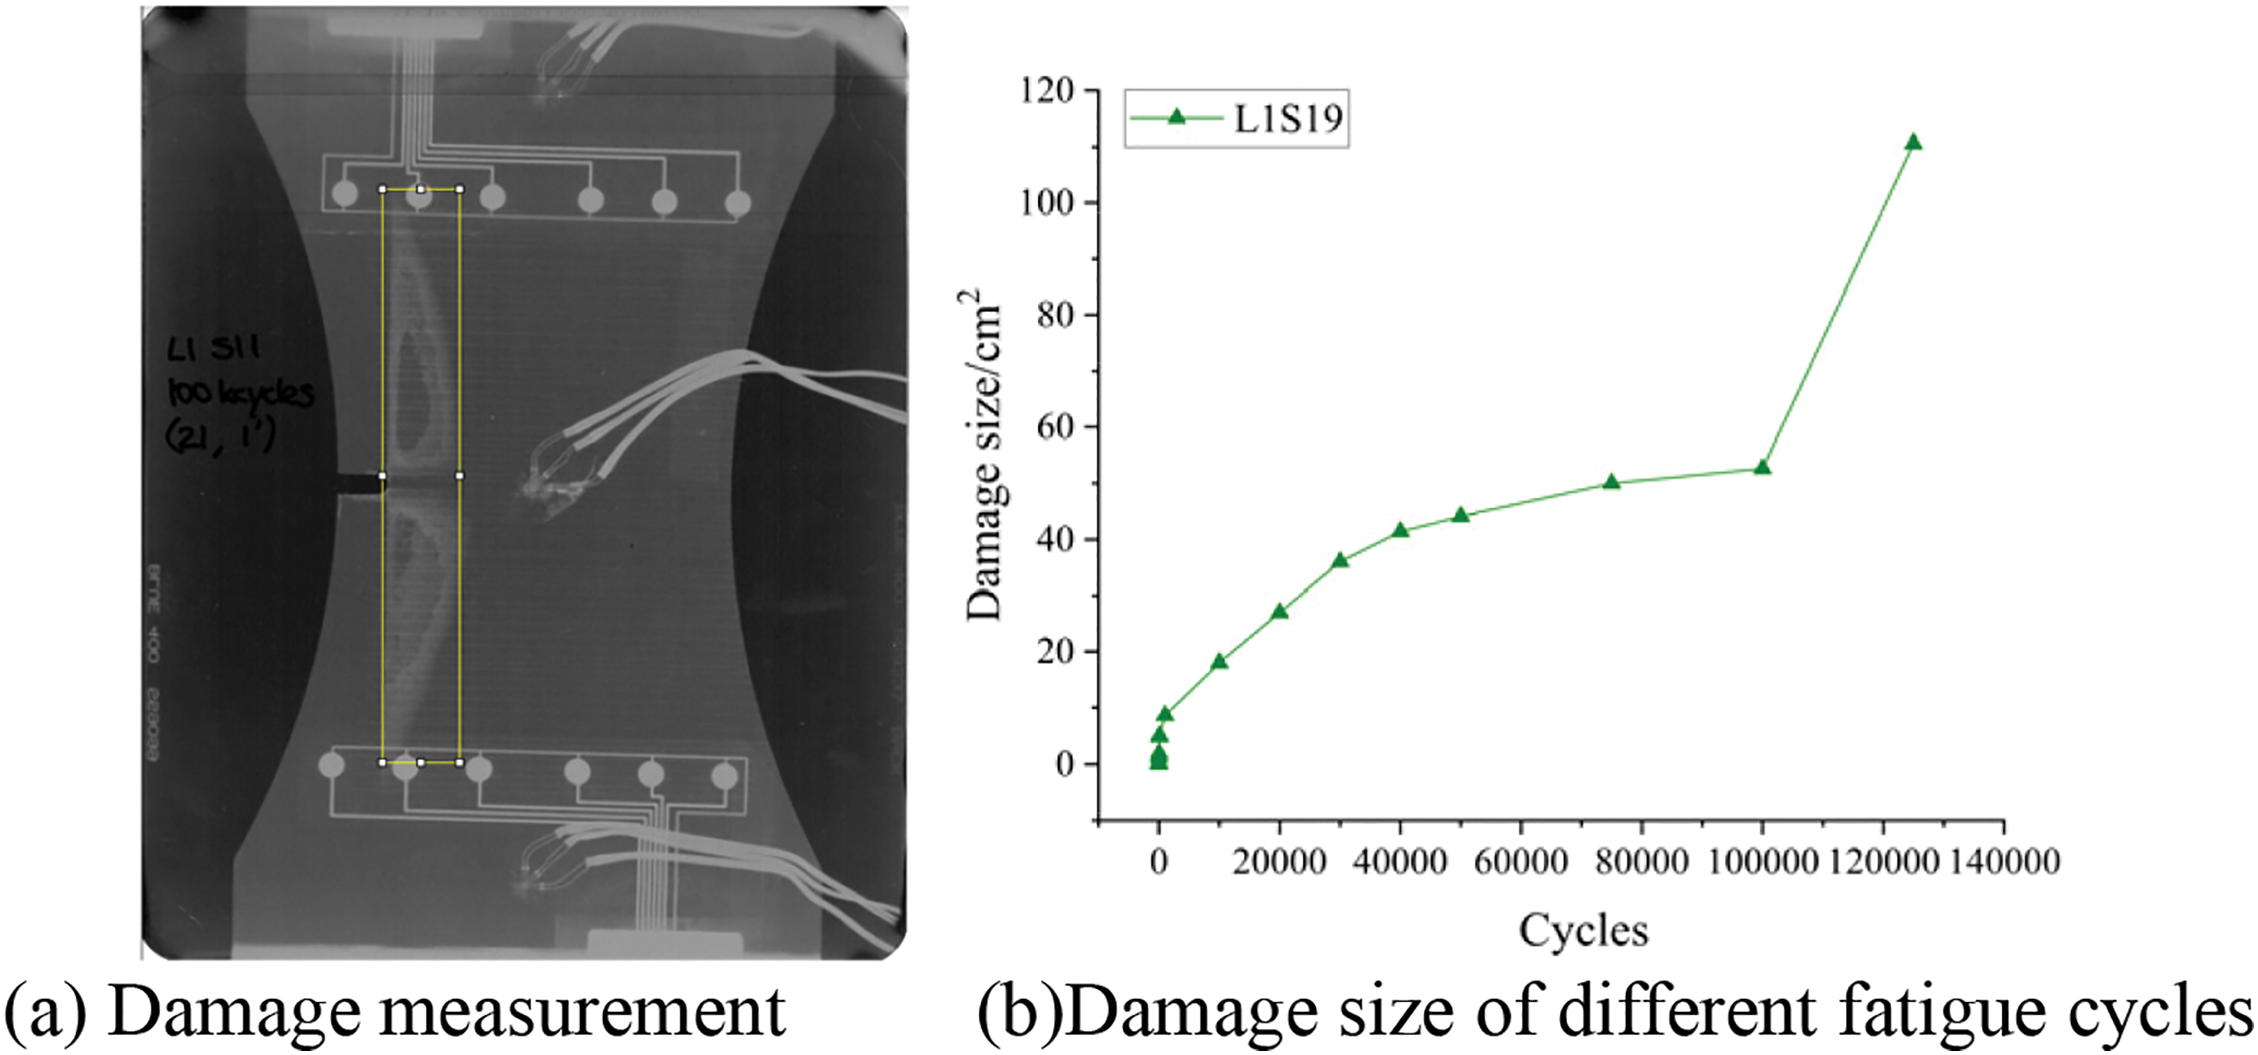
Figure 7: Measurement of specimen damage size
The damage size of coupon with different fatigue cycles is shown in Table 2. Among them, after 100,000 cycles of fatigue loading, the damage area suddenly increases, which occurs mainly due to the fatigue characteristics of composite materials. Under the action of fatigue loading, three main modes of matrix cracking, delamination and fiber fracture are induced within the structure of composite structures. Under the action of fatigue loading, the above forms of damage appear one after another in a staggered manner. A damage zone containing multiple damage forms is formed, and the expansion lacks regularity. Overall failure often occurs suddenly.

According to the field description, specimen L1S19 broke after more than 125,000 cycles, the load no longer increased during loading, and Lamb wave data could not be collected. After unloading, X-ray results showed that there was a large area of stratification inside the structure, and most sensors were damaged after detection, so it was determined that the structure completely failed when the fatigue load times reached 125,000 times.
4.1 Results of the Relief-F Algorithm
Ten signal features, including signal peak value, TOF value, RMS value and ±25 kHz frequency band energy (the main lobe bandwidth of the device is 50 kHz), were selected for the full set of signal features by the Relief-F algorithm, and several signal features with greater weight were selected to form a signal feature subset. For modeling purposes, the value of each feature in the above feature set containing ten signal features are normalized.
The Relief-F algorithm results are shown in Table 3. The feature complete set includes ten signal features (5 time domain features and 5 frequency domain features). Therefore, the signal weight average 0.1 is selected as the threshold value to screen the signal feature subset, and the signal peak value, TOF value and ±25 kHz frequency band energy are combined to form the signal feature subset to train the model.

Mean absolute percentage error (MAPE) and root mean square error (RMSE) were used to evaluate the accuracy of the prediction model.
In the formula is the number of samples,
4.2 WOA-BP Neural Network Prediction Model Results
The signal feature subset and complete set were used as inputs to the WOA-BP neural network algorithm to predict damage size. The accuracy of damage size prediction of the selected signal feature subset and complete set of the signal feature was compared to verify the suitability of the Relief-F algorithm.
In the construction of WOA-BP neural network model, according to experience and experiments, the parameters of WOA-BP neural network in this paper are set as follows: The initial population size is 30, the maximum evolutionary algebra is 500, the training times are 1000, the learning rate is 0.01, the target minimum error is 0.00001, the display frequency is 25, the momentum factor is 0.01, the minimum performance gradient is 1e−6, and the maximum number of failures is 6. The sample L1S19 selected in this paper has a total of 82 working conditions, 67 of which are randomly selected as training sets to establish the WOA-BP neural network model, and the remaining 15 are used as test sets to test the accuracy of the constructed WOA-BP neural network model, RMSE was used as the loss function to describe the iterative process of the WOA-BP neural network model, and the results are shown in Fig. 8.
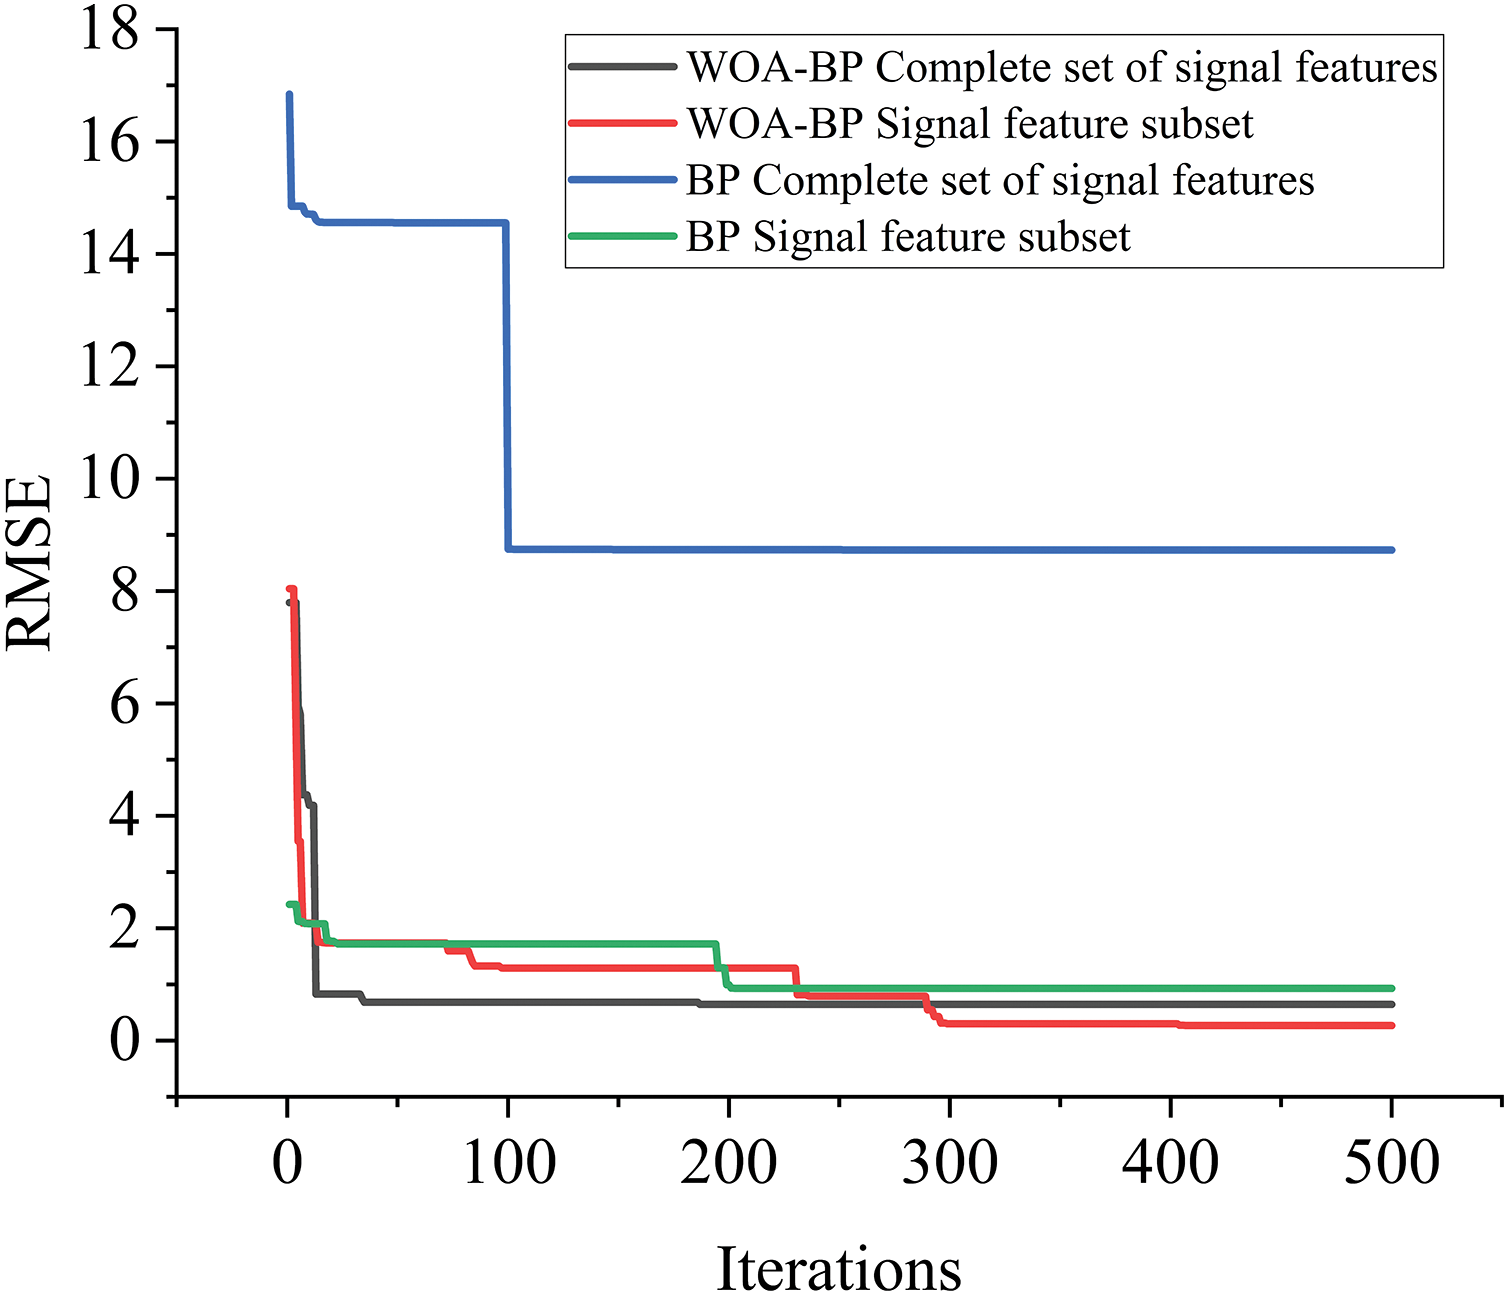
Figure 8: WOA-BP and BP neural network model training process based on the complete set and subset of signal features with RMSE as loss function
The loss function is used to measure the difference between the predictions of the model and the true value, and the smaller the value of the loss function, the better the performance of the model. Usually, the loss function convergence condition is that the fluctuation of the value of the loss function in the training process tends to approach 0, and the overall form of change tends to stabilize, and is no longer significantly reduced [39]. As can be seen in Fig. 8, the trend of the loss function RMSE gradually decreases during the training process, and after the maximum number of iterations of 500 times, The fluctuations of the loss function RMSE converge to 0, have stabilized and are no longer significantly decreasing.
The predicted values, sample values and errors of the BP neural network and WOA-BP neural network models established by the complete set and subset of signal features are shown in Fig. 9.
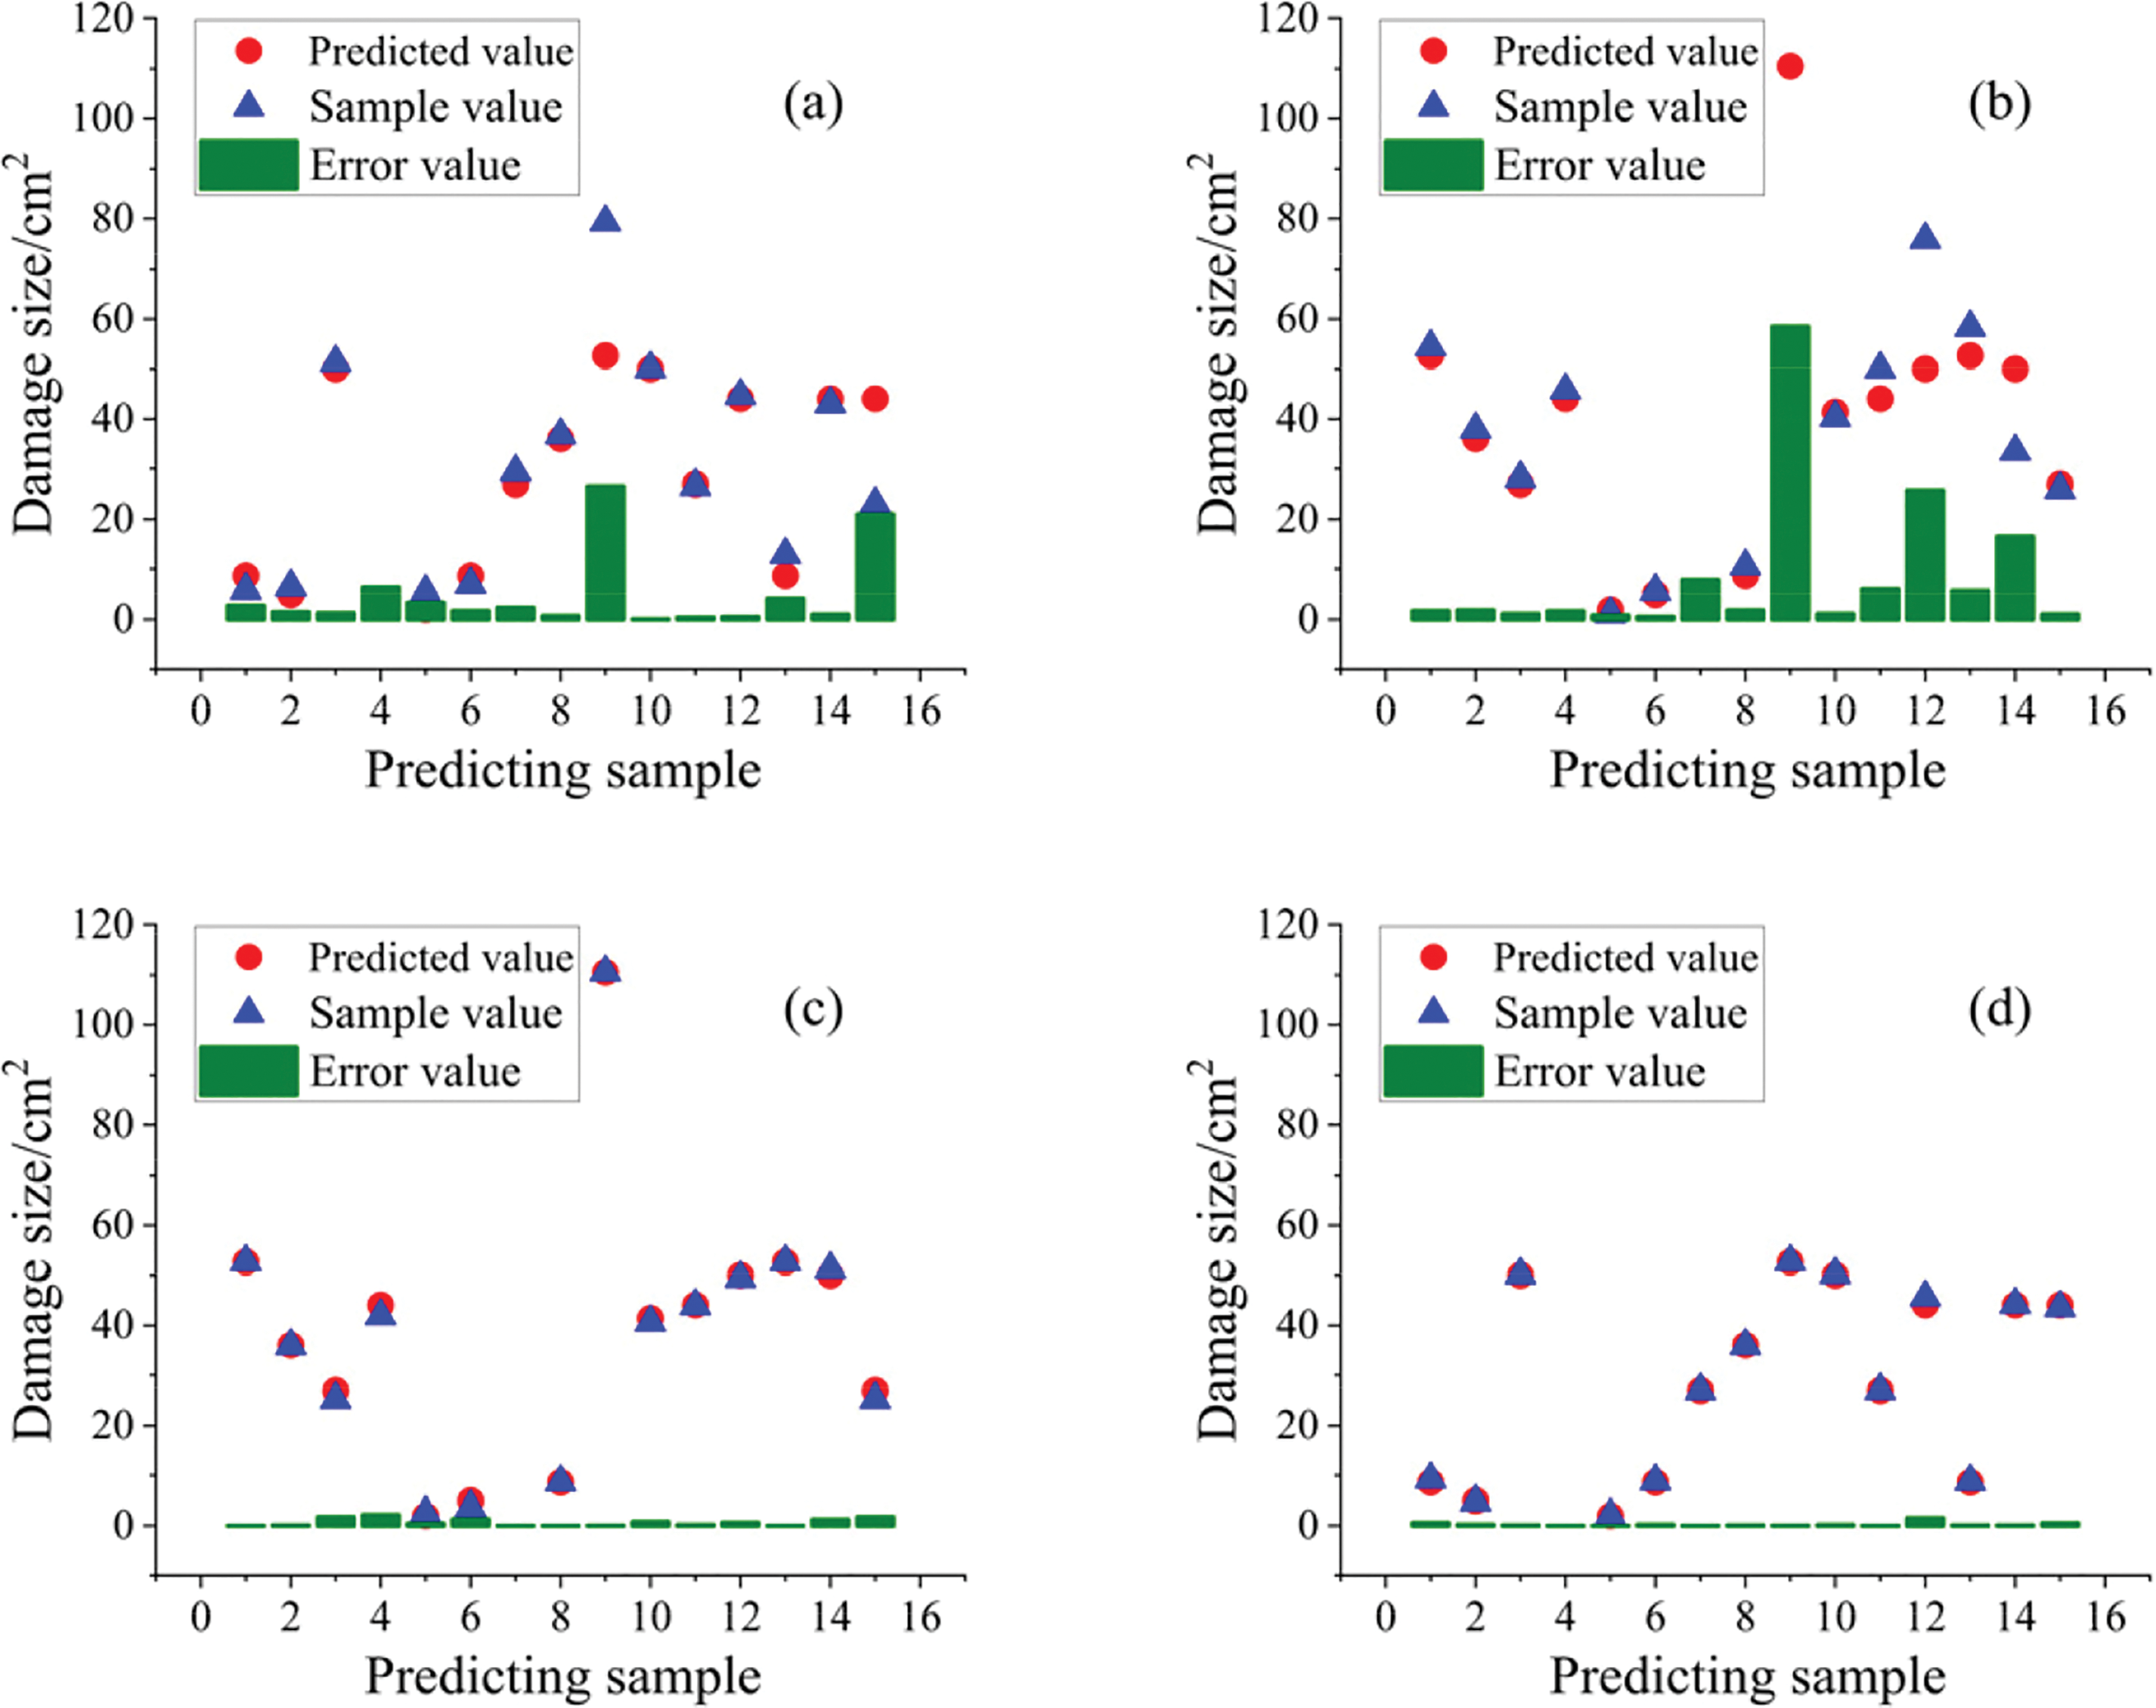
Figure 9: Predicted values, sample values, and errors of WOA-BP and BP neural network models constructed with a complete set and subset of signal features: (a) BP neural network constructed with a complete set of signal features; (b) BP neural network constructed by signal feature subset; (c) WOA-BP neural network constructed with a complete set of signal features; (d) WOA-BP neural network constructed by signal feature subset
As shown in Fig. 9, compared with the complete set of signal features, the signal feature subset can better describe the mapping relationship between sensing signals and damage dimensions, which proves the suitability of the Relief-F algorithm. At the same time, the model training results of the WOA-BP neural network and BP neural network are compared, and the error between the predicted value and the sample value obtained by the WOA-BP neural network model is smaller than that of the BP neural network model, which proves that WOA-BP neural network model has better global search ability.
As shown in Fig. 10 and Table 4, for the same signal feature set, the MAPE and RMSE of the WOA-BP neural network are smaller than that of the BP neural network model, indicating that the WOA-BP neural network has higher prediction accuracy than the BP neural network.
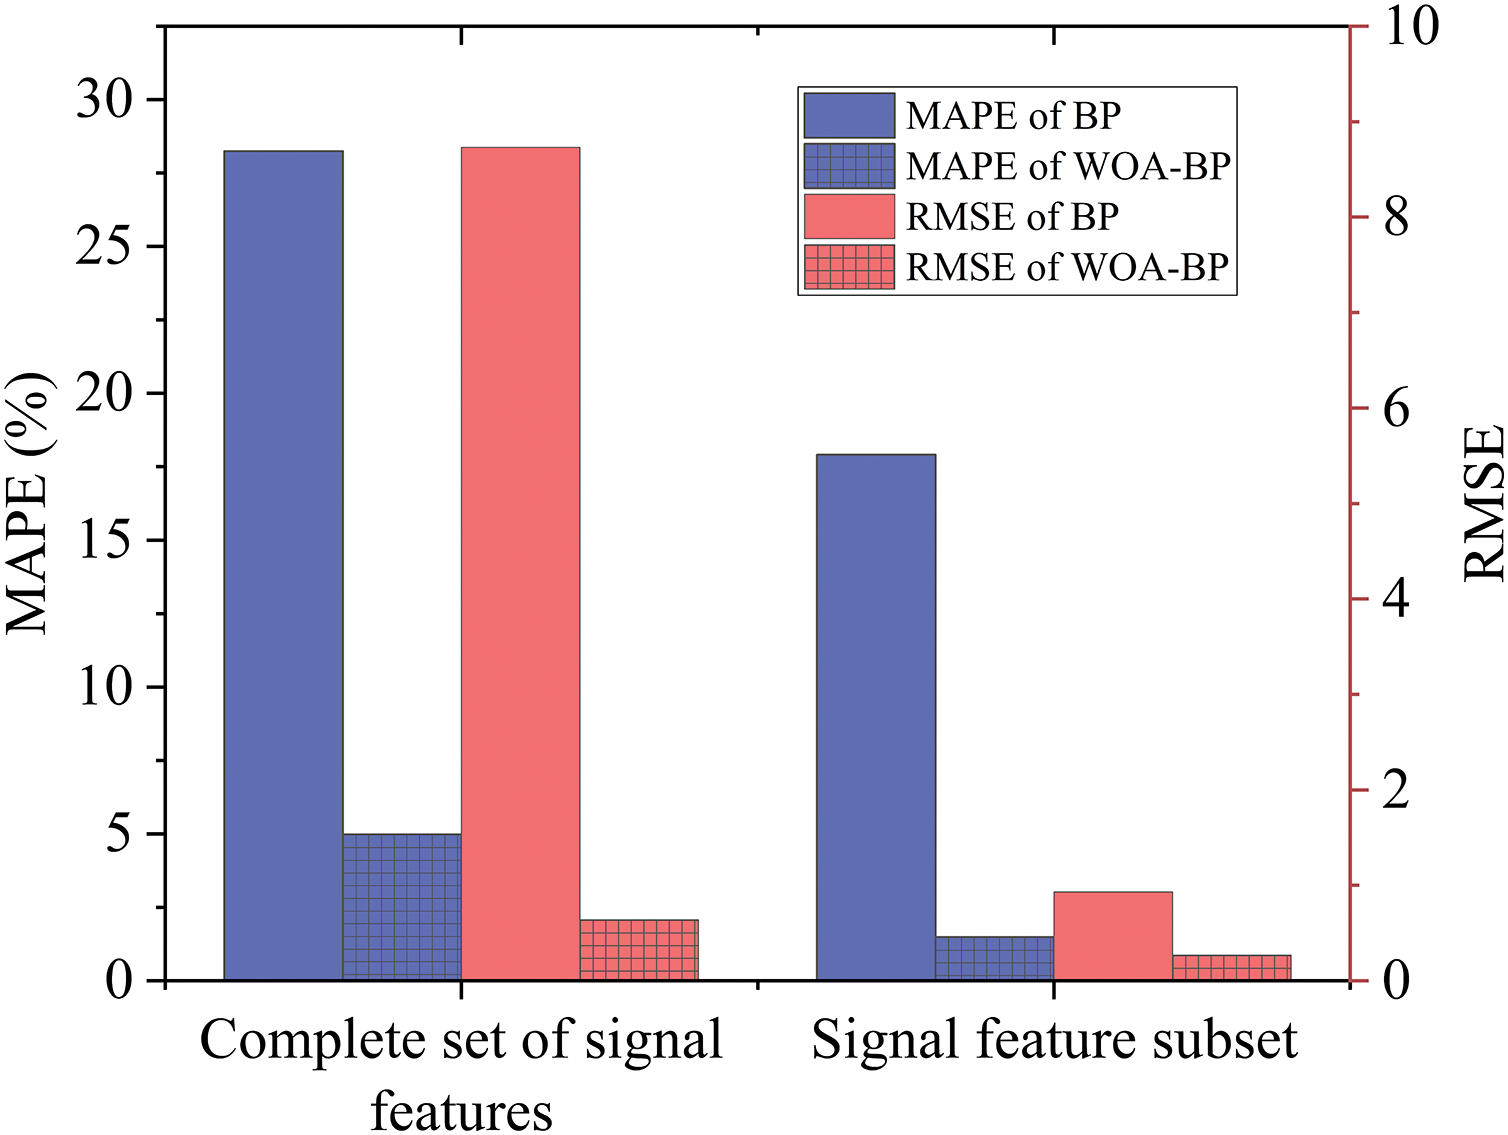
Figure 10: Comparison of MAPE and RMSE of WOA-BP and BP neural network models established by the complete set and subset of signal features

At the same time, the prediction accuracy of the model established by different sensor path signal characteristics is compared, and the results are shown in the figure below.
As shown in Fig. 11 and Table 5, comparing the prediction accuracy of the model established by the signal characteristics of 3 different “exciter-receiver” paths 4#→9#, 5#→8#, 6#→7#, the prediction accuracy of the model established by the 4#→9# path signal characteristics is significantly higher than that of the model established by the 5#→8# and 6#→7# path signal characteristics. This is because the 4#→9# path of the “actuator to sensor” passes through the damaged area is larger, so the model recognition accuracy is higher according to the 4#→9# path.
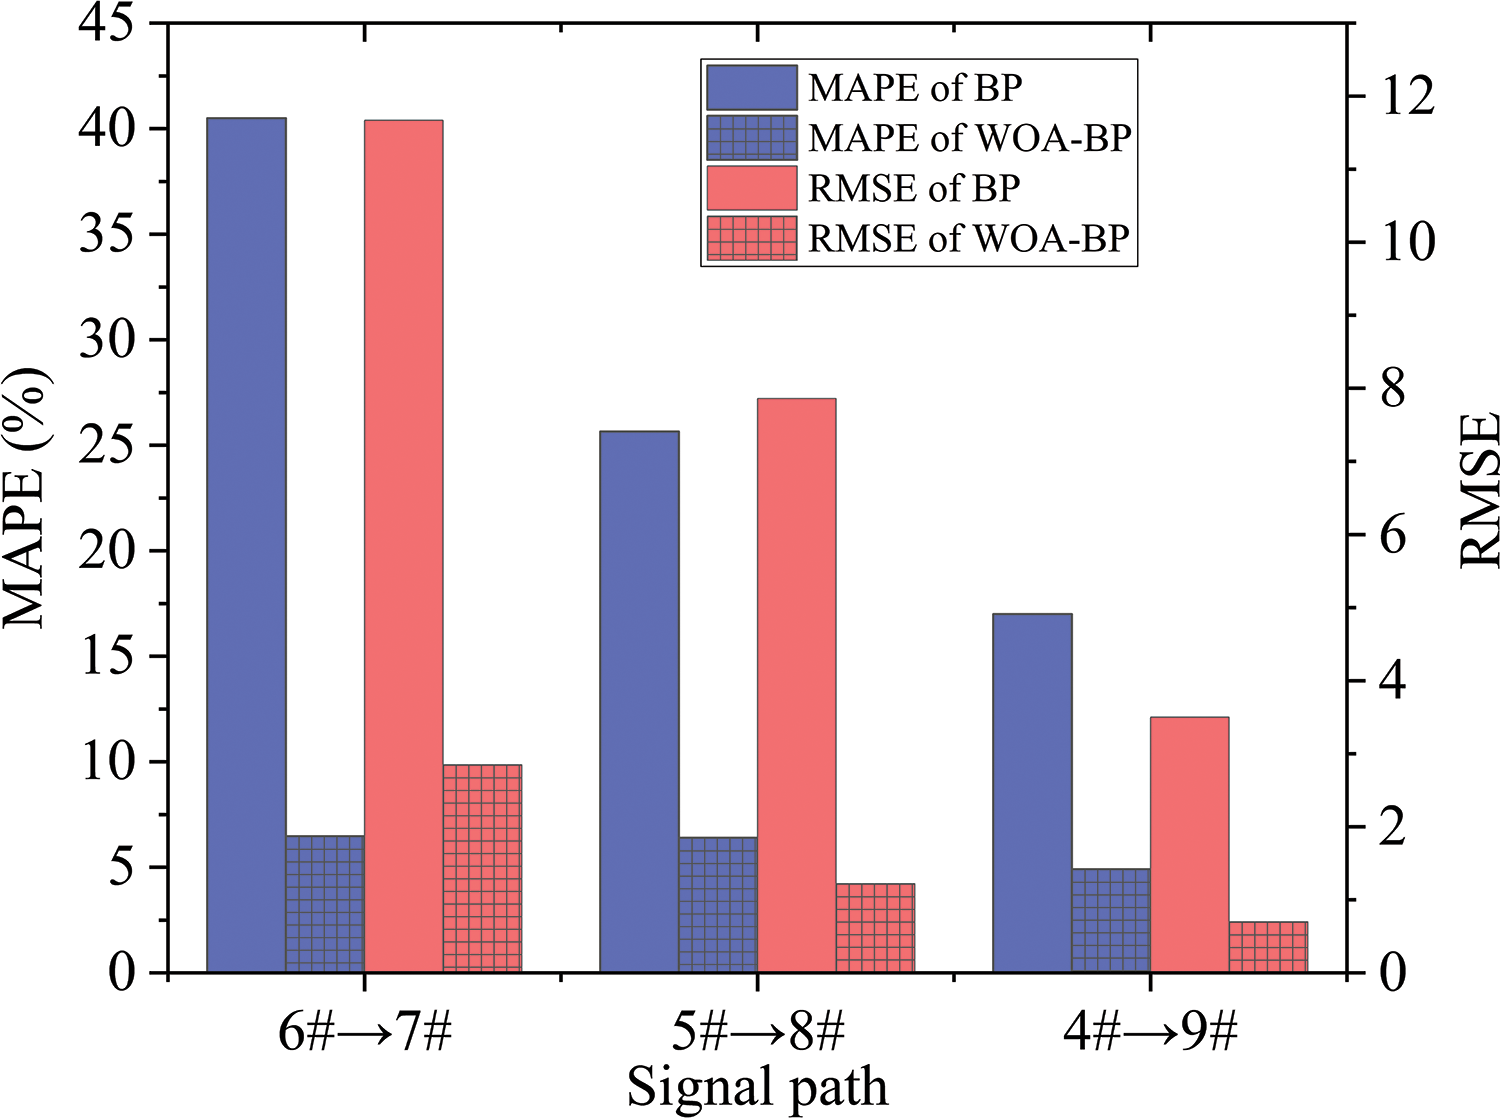
Figure 11: Comparison of MAPE and RMSE of WOA-BP and BP neural network models established according to signal feature subsets under different paths

In this paper, a fatigue damage monitoring method of composite structures based on machine learning is proposed. A set of actuators and a set of receivers are arranged on both sides of the composite structure to form multiple Lamb wave signal paths, and the Lamb wave signal paths are screened according to the damaged area of the composite structure. The sample library is composed of the signal features of Lamb wave signals obtained by the screened path, and the signal features in the sample library are selected by the Relief-F algorithm to extract the subset of signal features related to the structural damage size. The WOA-BP neural network model is constructed and trained by the signal feature subset, and the trained WOA-BP neural network model is used to predict the fatigue damage of the composite structure, and the prediction accuracy of the model is expressed by MAPE.
The results show that:
1. The weights of ten signal features are obtained according to the Relief-F algorithm, and the signal features with weights greater than the threshold value 0.1 are screened out. In other words, the signal peak value, TOF value, and ±25 kHz signal band energy are used as the subset of signal features to establish the damage prediction model of the WOA-BP neural network;
2. From the model prediction results, compared with the complete set of signal features, the MAPE and RMSE of the BP neural network decrease from 28.25% and 2.69637% to 17.91% and 1.28143%, respectively. The MAPE and RMSE of the WOA-BP neural network decreased from 4.98% and 2.35052% to 1.49% and 0.67658%, respectively, indicating that the signal feature subset can better describe the mapping relationship between sensing signal and damage size.
3. At the same time, compared with the BP neural network, the MAPE, and RMSE of the WOA-BP neural network based on signal feature subset decreased from 17.91% and 1.28143% to 1.49% and 0.67658, respectively. The results show that the WOA-BP neural network has higher prediction accuracy than the BP neural network;
4. According to the signal characteristics of three different “actuator to sensor” paths 4#→9#, 5#→8#, 6#→7#, the prediction accuracy of the model is also different. In terms of model prediction accuracy, the model # established by signal path 4#→9# is higher than the model established by signal path 5#→8# and 6#→7#.
The results show that the structural damage identification method proposed in this paper, which combines feature engineering and optimized machine learning algorithms, has higher precision and stronger global searching ability. The proposed fatigue damage monitoring method can effectively identify the damage expansion process.
Meanwhile, the limitation of the method proposed in this paper is that it is not validated on different datasets with different physical arrangements for each test piece, which involves migration learning. Work on migration learning will be considered in subsequent research. Other machine learning algorithms will also be utilized to compare with the WOA-BP neural network model as a way to improve our work.
Acknowledgement: None.
Funding Statement: This research was funded by the Key Program of the National Natural Science Foundation of China (U2341235), Youth Fund for Basic Research Program of Jiangnan University (JUSRP123003), Postgraduate Research & Practice Innovation Program of Jiangsu Province (SJCX23_1237) and the National Key R&D Program of China (2018YFA0702800), Key Technologies R&D Program of CNBM (2023SJYL01).
Author Contributions:: The authors confirm contribution to the paper as follows: study conception and design: Borui Wang, Dongyue Gao, Zhanjun Wu; data collection: Borui Wang, Mengke Ding, Haiyang Gu; analysis and interpretation of results: Borui Wang, Dongyue Gao; draft manuscript preparation: Borui Wang. All authors reviewed the results and approved the final version of the manuscript.
Availability of Data and Materials: Data openly available in a public repository. The data that support the findings of this study are openly available in https://www.nasa.gov/intelligent-systems-division/discovery-and-systems-health/pcoe/pcoe-data-set-repository/ (accessed on 15 November 2024).
Ethics Approval: Not applicable.
Conflicts of Interest: The authors declare no conflicts of interest to report regarding the present study.
References
1. Yan G, Raetz S, Chigarev N, Gusev VE, Tournat V. Cumulative fatigue damage in thin aluminum films evaluated non-destructively with lasers via zero-group-velocity Lamb modes. NDT E Int. 2020;116:102323. [Google Scholar]
2. Liang B, Boisse P. A review of numerical analyses and experimental characterization methods for forming of textile reinforcements. Chin J Aeronaut. 2021;34(8):21. [Google Scholar]
3. Wielhorski Y, Mendoza A, Rubino M, Roux S. Numerical modeling of 3D woven composite reinforcements: a review. Compos Part A: Appl Sci Manuf. 2022;154:106729. [Google Scholar]
4. Chakrapani SK, Barnard DJ. Fatigue damage evaluation of carbon fiber reinforced composites using nonlinear resonance spectroscopy. NDT&E Int. 2020;116:102331. doi:10.1016/j.ndteint.2020.102331. [Google Scholar] [CrossRef]
5. Rocha H, Semprimoschnig C, Nunes JP. Sensors for process and structural health monitoring of aerospace composites: a review. Eng Struct. 2021;237:112231. doi:10.1016/j.engstruct.2021.112231. [Google Scholar] [CrossRef]
6. Gao D, Jiao Y, Wu Z, Zheng Y, Zhang Y Impedance- and lamb-waves-based health condition monitoring approach for composite cryotanks. J Spacecr Rockets. 2020;57(6):1–10. doi:10.2514/1.A34718. [Google Scholar] [CrossRef]
7. De Luca A, Perfetto D, De Fenza A, Petrone G, Caputo F. Guided wave SHM system for damage detection in complex composite structure. Theor Appl Fract Mec. 2020;105:102408. [Google Scholar]
8. Andreades C, Meo M, Ciampa F. Fatigue testing and damage evaluation using smart CFRP composites with embedded PZT transducers. Mater Today: Proc. 2021;34:260–5. [Google Scholar]
9. Kulakovskyi A, Mesnil O, Chapuis B, d'Almeida O, Lhémery A. Statistical analysis of guided wave imaging algorithms performance illustrated by a simple structural health monitoring configuration. J Nondestruct Eval Diagn Progn Eng Syst. 2021;4(3):1–13. doi:10.1115/1.4049571. [Google Scholar] [CrossRef]
10. Capriotti M, Cui R, Lanza di Scalea F. Guided wave techniques for damage detection and property characterization in composite aerospace structures. In: Proceeding of the Health Monitoring of Structural and Biological Systems XIII; 2019; Denver, Colorado, USA.doi:10.1117/12.2514072. [Google Scholar] [CrossRef]
11. Yaacoubi S, McKeon P, Ke W, Declercq N, Dahmene F. Towards an ultrasonic guided wave procedure for health monitoring of composite vessels: application to hydrogen-powered aircraft. Materials. 2017;10:1097. doi:10.3390/ma10091097. [Google Scholar] [PubMed] [CrossRef]
12. Hu Y, Zhu YP, Tu XT, Lu J, Li FC. Dispersion curve analysis method for Lamb wave mode separation. Struct Health Monit-Int J. 2020;19:1590–601. [Google Scholar]
13. Xia R, Zhu J, Yi J, Shao S, Li Z. Guided wave propagation in multilayered periodic piezoelectric plate with a mirror plane. Int J Mech Sci. 2021;204:106539. doi:10.1016/j.ijmecsci.2021.106539. [Google Scholar] [CrossRef]
14. Niu X, Duan W, Chen H-P, Marques HR. Excitation and propagation of torsional T (0, 1) mode for guided wave testing of pipeline integrity. Measurement. 2019;131:341–8. doi:10.1016/j.measurement.2018.08.021. [Google Scholar] [CrossRef]
15. Wu J, Jiang C, Fang H, Ng C-T. Damage detection in the T-welded joint using Rayleigh-like feature guided wave. NDT E Int. 2023;135(4):102806. doi:10.1016/j.ndteint.2023.102806. [Google Scholar] [CrossRef]
16. Zhanjun W, Kehai L, Yishou W, Zheng Y. Validation and evaluation of damage identification using probability-based diagnostic imaging on a stiffened composite panel. J Intell Mater Syst Struct. 2015;26(16):2181–95. doi:10.1177/1045389X14549873. [Google Scholar] [CrossRef]
17. Sergio C-C, Khalid MM, Dimitrios C, Chiachío J. Bayesian damage localization and identification based on a transient wave propagation model for composite beam structures. Compos Struct. 2021;267:113849. doi:10.1016/j.compstruct.2021.113849. [Google Scholar] [CrossRef]
18. Miorelli R, Fisher C, Kulakovskyi A, Chapuis B, Mesnil O, D’Almeida O. Defect sizing in guided wave imaging structural health monitoring using convolutional neural networks. NDT&E Int. 2021;122:102480. doi:10.1016/j.ndteint.2021.102480. [Google Scholar] [CrossRef]
19. Kim YW, Park KJ. The interaction of fundamental torsional guided waves from axial and oblique defects in pipes. Insight Non-Destr Test Cond Monit. 2021;63(6):334–40. doi:10.1784/insi.2021.63.6.334. [Google Scholar] [CrossRef]
20. Yun H, Wang R, Rayhana R, Pant S, Genest M, Liu Z. WaveCLR: contrastive learning of guided wave representations for composite damage identification. IEEE Trans Instrum Meas. 2024;73:1–14. [Google Scholar]
21. Zargar SA, Yuan FG. Impact diagnosis in stiffenoved structural panels using a deep learning approach. Struct Health Monit. 2021;20(2):681–91. [Google Scholar]
22. Ma M, Yu J, Fan W, Cao DZ. Damage detection of carbon fiber reinforced polymercomposite materials based on one-dimensional multi-scale residual convolution neural network. Rev Sci Instrum. 2022;93:034701. doi:10.1063/5.0076826. [Google Scholar] [PubMed] [CrossRef]
23. Chen J, Wu W, Ren Y, Yuan S. Fatigue crack evaluation with the guided wave-convolutional neural network ensemble and differential wavelet spectrogram. Sensors. 2021;22(1):307. doi:10.3390/s22010307. [Google Scholar] [PubMed] [CrossRef]
24. Zhang B, Hong X, Liu Y. Multi-task deep transfer learning method for guided wave-based integrated health monitoring using piezoelectric transducers. IEEE Sens J. 2020;20(23):14391–400. [Google Scholar]
25. Zhang B, Liu JY, Zhong YH, Li XL, Hao MM, Li X, et al. A BP neural network method for grade classification of loose damage in semirigid pavement bases. Adv Civil Eng. 2021;2021:6658235. [Google Scholar]
26. Oh BK, Lee SH, Park HS. Damage localization method for building structures based on the interrelation of dynamic displacement measurements using convolutional neural network. Struct Control Health Monit. 2020;27(8):1–23. [Google Scholar]
27. Paral A, Roy DKS, Samanta AK. Application of a mode shape derivative-based damage index in artificial neural network for structural damage identification in shear frame building. J Civ Struct Health Monit. 2019;9(3):411–23. doi:10.1007/s13349-019-00342-x. [Google Scholar] [CrossRef]
28. Azam SE, Rageh A, Linzell D. Damage detection in structural systems utilizing artificial neural networks and proper orthogonal decomposition. Struct Control Health Monit. 2019;26(2):1–24. [Google Scholar]
29. Mirjalili S, Lewis A. The whale optimization algorithm. Adv Eng Softw. 2016;95:51–67. [Google Scholar]
30. Yang Y, Zou L, Cao X, Yang X, Sun Y. A modified Manson-Halford model based on improved WOA for fatigue life prediction under multi-level loading. Int J Damage Mech. 2024;33:774–807. doi:10.1177/10567895241245869. [Google Scholar] [CrossRef]
31. Huang M, Wan Z, Cheng X, Xu Z, Lei Y, Pan D. Two-stage damage identification method based on fractal theory and whale optimization algorithm. Adv Struct Eng. 2022;25(11):2364–81. [Google Scholar]
32. Dehcheshmeh MM, Hosseinzadeh AZ, Amiri GG. Feasibility study on model-based damage detection in shear framesusing pseudo modal strain energy. Smart Struct Syst. 2020;25(1):47–56. [Google Scholar]
33. Chen ZX. Yu LA novel WOA-based structural damageidentification using weighted modal data and flexibility assurancecriterion. Struct Eng Mech. 2020;75(4):445–54. [Google Scholar]
34. Chen HL, Yang CJ, Heidari AA. An efficient doubleadaptive random spare reinforced whale optimization algorithm. Expert Syst Appl. 2020;154:113018. [Google Scholar]
35. Sun H, Peng L, Lin J, Wang S, Zhao W, Huang S. Microcrack defect quantification using a focusing high-order SH guided wave EMAT: the physics-informed deep neural network GuwNet. IEEE Trans Industr Inform. 2021;18:3235–47. [Google Scholar]
36. Zhou L, Chen SX, Ni YQ, Jiang L. Pitch-catch UGW-based multiple damage inference: a heterogeneous graph interpretation. Smart Mater Struct. 2022;31:015005. doi:10.1088/1361-665X/ac36b0. [Google Scholar] [CrossRef]
37. Saxena A, Goebel K, Larrosa CC, Chang F-K. CFRP composites data set. In: NASA prognostics data repository. Moffett Field, CA: NASA Ames Research Center; 2011. [Google Scholar]
38. Xu X, Liu C. Physics-guided deep learning for damage detection in CFRP composite structures. Compos Struct. 2024;331:117889. [Google Scholar]
39. Xu S, Wang X, Tang J, Lan S, Tian Y. Generalized robust loss functions for machine learning. Neural Netw. 2024;171:200–14. [Google Scholar]
Cite This Article
 Copyright © 2025 The Author(s). Published by Tech Science Press.
This work is licensed under a Creative Commons Attribution 4.0 International License , which permits unrestricted use, distribution, and reproduction in any medium, provided the original work is properly cited.


 Submit a Paper
 Propose a Special lssue
 View Full Text
 Download PDF
 Downloads
 Citation Tools