
 Submit a Paper
 Propose a Special lssue
 Open Access
ARTICLE

FHGraph: A Novel Framework for Fake News Detection Using Graph Contrastive Learning and LLM
1 School of Cyber Science and Engineering, Southeast University, Nanjing, 210096, China
2 Key Laboratory of Computer Network and Information Integration (Southeast University), Ministry of Education, Nanjing, 210096, China
* Corresponding Author: Sanfeng Zhang. Email:
Computers, Materials & Continua 2025, 83(1), 309-333. https://doi.org/10.32604/cmc.2025.060455
Received 01 November 2024; Accepted 08 January 2025; Issue published 26 March 2025
 View Full Text
 Download PDF
Abstract
Social media has significantly accelerated the rapid dissemination of information, but it also boosts propagation of fake news, posing serious challenges to public awareness and social stability. In real-world contexts, the volume of trustable information far exceeds that of rumors, resulting in a class imbalance that leads models to prioritize the majority class during training. This focus diminishes the model’s ability to recognize minority class samples. Furthermore, models may experience overfitting when encountering these minority samples, further compromising their generalization capabilities. Unlike node-level classification tasks, fake news detection in social networks operates on graph-level samples, where traditional interpolation and oversampling methods struggle to effectively generate high-quality graph-level samples. This challenge complicates the identification of new instances of false information. To address this issue, this paper introduces the FHGraph (Fake News Hunting Graph) framework, which employs a generative data augmentation approach and a latent diffusion model to create graph structures that align with news communication patterns. Using the few-sample learning capabilities of large language models (LLMs), the framework generates diverse texts for minority class nodes. FHGraph comprises a hierarchical multiview graph contrastive learning module, in which two horizontal views and three vertical levels are utilized for self-supervised learning, resulting in more optimized representations. Experimental results show that FHGraph significantly outperforms state-of-the-art (SOTA) graph-level class imbalance methods and SOTA graph-level contrastive learning methods. Specifically, FHGraph has achieved a 2% increase in F1 Micro and a 2.5% increase in F1 Macro in the PHEME dataset, as well as a 3.5% improvement in F1 Micro and a 4.3% improvement in F1 Macro on RumorEval dataset.Keywords
The swift growth of social networks has made our daily lives more convenient, yet it has also turned into a breeding ground for the proliferation of fake news. The proliferation of such false information poses a real threat to key areas such as politics [1], and economy [2]. For example, during the COVID-19 (Coronavirus disease 2019) pandemic, the spread of false health information could significantly impact public health decisions, promoting erroneous prevention and treatment practices [3]. Therefore, developing effective methods for detecting fake news has become an important and urgent task, with the aim of identifying and minimizing the serious consequences of such misinformation.
In the realm of fake news detection, despite the promise shown by deep learning methods such as Convolutional Neural Networks (CNNs), Recurrent Neural Networks (RNNs) [4], and Transformer-based models like BERT (Bidirectional Encoder Representations from Transformers) [5] in automatic learning and text feature extraction, these approaches often neglect the social context in which news is disseminated. To bridge this gap, graph neural network (GNN)-based detection methods have emerged as critical tools in the extraction of contextual information related to news dissemination [6]. GNNs effectively capture dynamic associations and dissemination patterns by modeling nodes (e.g., news articles and replies) and edges (propagation paths) within the news dissemination network, offering a vital perspective on the spread of misinformation through social networks.
By providing a structured way to view interactions and propagation paths, graph-based approaches allow for a deeper understanding of the complex challenges involved in modeling information spread. For example, TRMCPM [7] utilizes GraphSAGE to encode the propagation graph, while BiGCN [8] adopts a dual graph approach, modeling news propagation patterns from top-down and bottom-up perspectives. These innovations underscore the evolving nature of fake news detection, highlighting the need for models that can adapt to the intricacies of social interactions and the mutable nature of news spread.
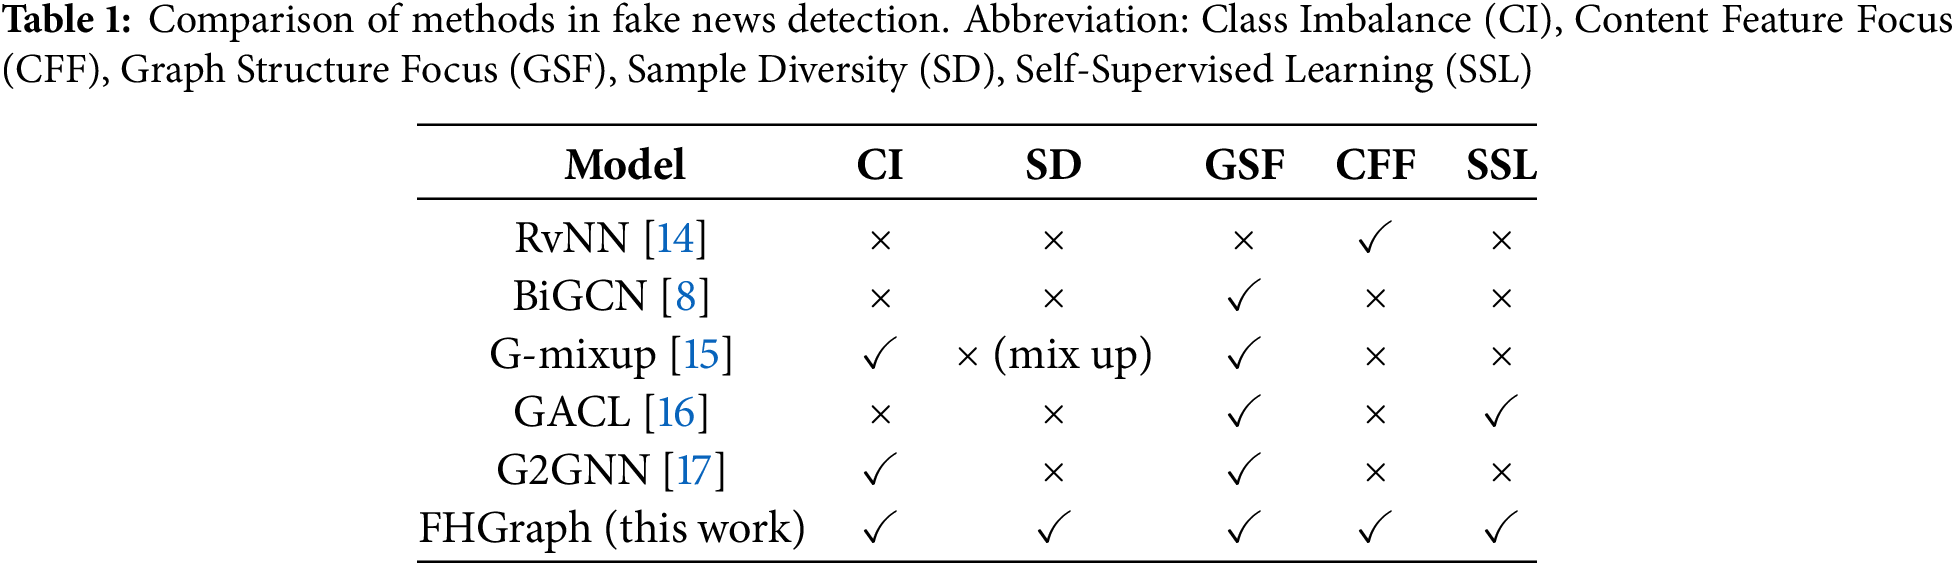
One significant challenge in fake news detection is the imbalance among graph-level categories. In real online environments, the number of rumors is substantially lower than that of nonrumors, making it difficult for detection models to develop effective recognition capabilities from limited rumor samples [9,10]. Currently, addressing this challenge involves several issues. First, existing graph-level minority class sample enhancement methods rely primarily on oversampling [11] and interpolation synthesis [12,13], which often result in a lack of diversity and difficulty in generating high-quality samples. Although resampling can balance the data set by adjusting the proportion of samples across categories, it risks overfitting the model to duplicate samples, thereby diminishing its generalizability to new data. Furthermore, interpolation methods, such as GraphSMOTE [13], may introduce artificial features that do not align with the actual distribution, increasing noise. Therefore, an effective strategy should enhance sample diversity while maintaining data representativeness. Second, due to the limited number of rumor samples, the models struggle to capture their diversity and complexity, which can lead to overfitting on a small number of samples and reduced generalization capacity for minority classes. We summarize the most representative and relevant studies in Table 1.
To address these challenges, this paper introduces a novel learning framework called FHGraph (Fake News Hunting Graph), designed to mitigate class imbalance while enhancing the model’s dynamic recognition and generalization capabilities for fake news. Specifically, to generate samples from the minority class, we develop a dynamic sample generator that uses the robust generative capabilities of the latent diffusion model [18] to create graph structures that align with the news dissemination patterns, informed by the statistical features of these structures. By integrating the few-sample learning capabilities of large language models (LLMs), we can effectively combine structural information and generate diverse text content, thereby alleviating the scarcity of rumor samples.
For rumor feature learning, we implement a hierarchical graph contrastive learning module that performs self-supervised learning through two views and three levels, allowing for a deep exploration of the consistency between source news content and dissemination content. This approach promotes the model’s ability to learn effectively from limited samples. We conducted extensive experiments on two benchmark datasets from real social networks, and the results demonstrated that FHGraph outperforms existing methods in imbalanced fake news detection tasks. By efficiently detecting false information, FHGraph can serve as an effective tool for social media platforms, government agencies, and public organizations, helping to promptly address the spread of misinformation, enhance social trust, and increase the transparency of public decision-making.
The contributions of this paper are summarized as follows:
1. Graph-level sample generation method: We propose a method that utilizes a latent diffusion model to generate graph structures informed by statistical features. By integrating the few-sample learning capabilities of LLM, we achieve a tight coupling between graph structure and news content, dynamically generating diverse minority class samples. This approach effectively mitigates the decline in false news detection performance caused by class imbalance.
2. Augmentation strategy of the text attribute graph data using LLM: For the text attribute graph associated with the news content, we employ an LLM chain generation method to create contextually relevant text based on neighboring information within the graph structure. Additionally, we introduce a method that improves LLM-generated complete graph data by supplementing attributes with contextual information.
3. Hierarchical multiview graph-level contrastive learning method: We explore the structural consistency between the source news text and dissemination content, implementing a three-level, multiview comparative self-supervised learning approach. This method focuses on the relationships between nodes, node-graph interactions, and graph-graph comparisons, enhancing the model’s learning capabilities.
Deep learning models for detecting fake news can be categorized primarily into text-based and social networks-based approaches. Text-based detection models rely on the semantic features of news articles to differentiate between true and false information. For example, Ajao et al. employ emotional features of news texts for the detection of fake news [19]. Luvembe et al. improve detection accuracy by integrating the dual emotional characteristics of news publishers with social emotions [20]. Zhu et al. improve the generalization capabilities of fake news detection models by extracting entities from news texts and constructing a debiased framework [21]. However, these methods predominantly focus on textual content, limiting the range of available information for analysis.
In contrast, models based on social networks leverage news dissemination patterns on social networks to identify fake news. Bian et al. utilize two Graph Convolutional Networks (GCNs) to capture bottom-up and top-down propagation patterns, thereby fully modeling news dissemination [8]. He et al. introduce a data augmentation strategy that randomly modifies propagation graphs (e.g., by removing edges or masking subgraphs) and trained GCN models using contrastive learning [22]. Yin et al. develop an unsupervised graph autoencoder that employs the context and content of news dissemination as self-supervised signals through masking and contrastive learning, reducing reliance on labeled datasets [23]. Fang et al. proposed a novel propagation tree variational autoencoder model that reconstructs sentiment labels along the propagation tree of factual tweets and uses a cross alignment method to align the tree structure and propagation features [24]. Che et al. proposed a fake news detection method based on social content categories, which constructs a third-order tensor through the links and interactions of social networks, and employs a sparse and graph-regularized tensor decomposition learning method to effectively reveal the complex relationships between users and news [25].
2.2 Solutions for Imbalanced Graph Dataset
Data imbalance classification poses a significant challenge in the realm of graph neural networks. Although the issue of node-level class imbalance has garnered considerable attention, research on graph-level class imbalance has emerged primarily in the past two years. G-Mixup applies the mixup technique to combine different categories of graphs, generating composite graphs as additional training data. However, this method often lacks diversity in the characteristics of the generated sample [15].
G2GNN addresses the graph imbalance problem by establishing a graph of graphs (GOG) that integrates global neighboring graph information with local random enhancements based on kernel similarity [17]. Similarly, ImbGNN introduces an optional enhancement strategy for the average degree distribution, based on G2GNN to tackle both class imbalance and structural imbalance simultaneously [26]. However, both methods rely on GOG implementations and may not be suitable for graph datasets lacking correlation between samples.
Moreover, there is a scarcity of research specifically addressing class imbalance in the context of fake news detection. SynDGN utilizes a dual graph network to fuse news text and user information features for rumor detection, employing synthetic embedding techniques to mitigate data imbalance problems [27]. However, this synthesis method has limitations in terms of sample diversity.
2.3 Graph Contrastive Learning
Contrastive learning is a discriminative method focused on generating similar representations for similar samples while distancing the representations of dissimilar samples. Graph contrastive learning seeks to develop an encoding model that encodes similar nodes (or graphs) to yield similar representations while separating those of dissimilar samples. However, research on graph-level contrastive learning is relatively limited compared to node-level contrastive learning.
GraphCL, proposed by You et al., implements an instance-based node-level graph contrastive learning framework for graph-level contrastive learning. This approach generates positive samples by defining different augmented representations of the same graph and creates negative samples using representations of other graphs within the same batch [28]. Luo et al. were the first to proactively train negative samples to enhance graph contrastive learning effectiveness [29]. Liang et al. introduced Implicit Graph Contrastive Learning (iGCL), which improves graph-level contrastive learning by reconstructing graph topology and leveraging the hidden space learned through variational graph autoencoders, thereby eliminating the need for manual dataset tuning and enhancement [30]. On this basis, extending the concept of graph contrastive learning to the field of fake news detection, Li et al. proposed a novel rumor detection model called graph contrastive learning with feature augmentation (FAGCL), which injects noise into the feature space and learns contrastively by constructing asymmetric structures [31].
We define a dataset
4.1 Overview of the Proposed FHGraph Framework
Fig. 1 illustrates the overall structure of our proposed FHGraph framework. FHGraph aims to solve the imbalance problem in fake news detection through sample generation and self-supervised learning. First, it adopts a collaborative large language model and a diffusion model as a graph-level sample generator to dynamically create diverse rumor samples. This combined approach can leverage the powerful text generation capabilities of LLMs and the structure generation capabilities of diffusion models to work together to generate graph structures and text content that are consistent with the news dissemination model. This not only improves the diversity of samples but also enhances the model’s ability to identify minority-class samples.
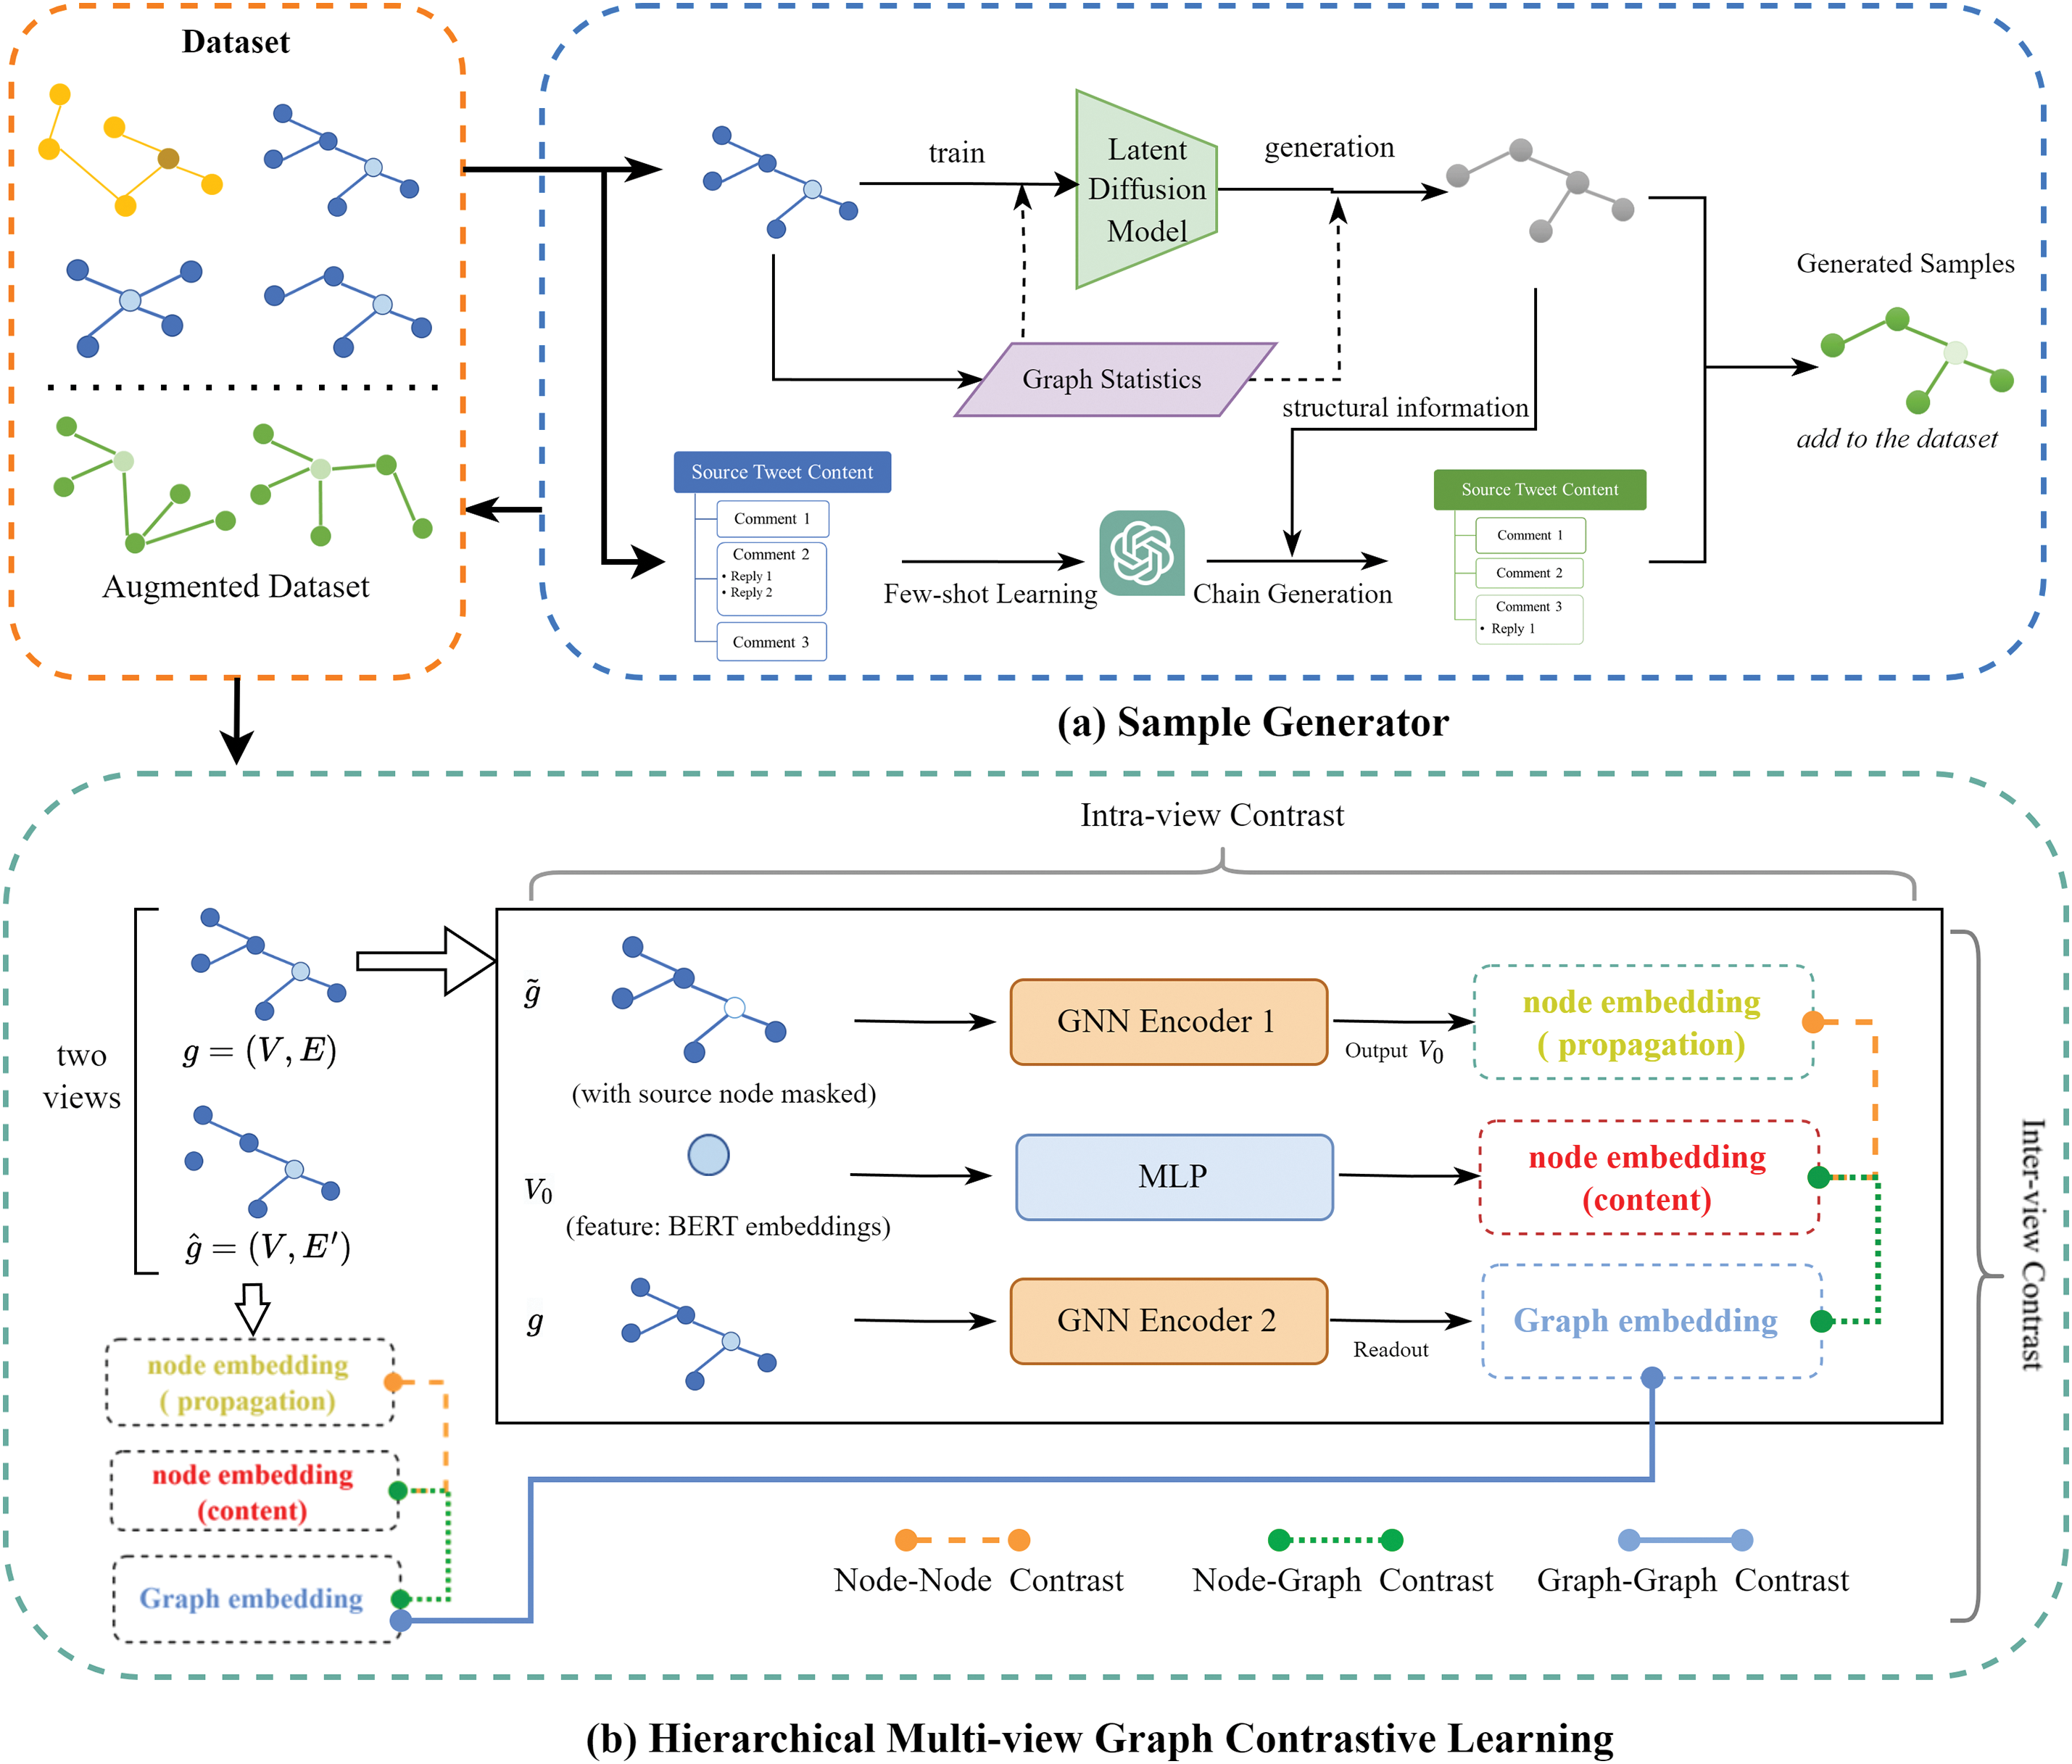
Figure 1: Overview of the FHGraph framework. This framework addresses the class imbalance in fake news detection using a sample generator and a hierarchical multi-view graph contrast learning module. Initially, FHGraph utilizes the latent diffusion model’s structured information to create sample structures, and chain generation from LLMs to enhance the dataset with synthesized sample node content. In the contrast learning phase, the graph is perturbed to create an enhanced view, improving graph representation through dual-view and three-level contrast learning. The process culminates in a binary classification task at the graph level
Second, FHGraph incorporates a hierarchical multiview graph-level contrastive learning module to enhance graph representation through contrastive learning across dual-view and three-level graphs. This module performs self-supervised learning through two horizontal views and three vertical levels to optimize representation learning between nodes, node graphs, and graphs. This multiview structure allows information from various perspectives to complement each other, improving the model’s overall performance.
Finally, the collaboration between modules significantly improves the overall performance of the system: the dynamic and diverse graph-level samples provided by the sample generator provide rich training materials for the contrastive learning module, which through its layering and multi-view. The mechanism effectively learns the deep graph structure and node content consistency from these samples, further improving the model’s ability to identify news authenticity in binary classification tasks at the graph level.
4.2 Graph-Level Sample Generator Based on LLM and Diffusion Model
In real social networks, the distribution of news samples is often uneven, with fake news usually accompanied by a significant amount of genuine content. Additionally, merely generating new samples through oversampling can undermine the model’s dynamic adaptability. To enhance the dynamic recognition capabilities of the model in the presence of imbalanced samples, this paper proposes a collaborative sample generator that integrates the LLM and diffusion model.
From a network structure perspective, we employ a pre-trained latent space diffusion model that uses the statistical features of the graph as guiding conditions to dynamically generate the network structure of the target sample. For node content generation, we leverage LLM-based prompt engineering to utilize its few-sample generation capabilities, creating coherent discussion and reply chains based on the target network structure. This approach deeply integrates the content generated by the LLM with the structure produced by the diffusion model, resulting in robust, dynamic, and diverse minority class samples.
4.2.1 Graph Structure Generator Based on Latent Diffusion Model
Inspired by the work of [18], we design a conditionally guided latent diffusion model to generate dissemination graph structures. Instead of merely expanding minority class samples through resampling, the latent diffusion model generates graph structures in an innovative way by capturing and simulating news dissemination patterns. This allows for the creation of graph structures not found in the training set yet still conforming to realistic news dissemination patterns. This approach not only enhances the diversity of the generated data, but also avoids potential repetition and bias in the sampling process.
As illustrated in Fig. 2, the graph structure generator consists of three main components: an autoencoder, a latent diffusion model, and diffusion guidance conditions. The encoder initially transforms the input data into a representation within a hidden space. During the forward propagation of the diffusion model, noise is progressively added to perturb this hidden space representation. Subsequently, Gaussian noise is sampled, and a denoising network is employed to iteratively reduce the noise based on the learned conditional probabilities. The resulting denoised vector is then transformed into a generated image through a decoder.
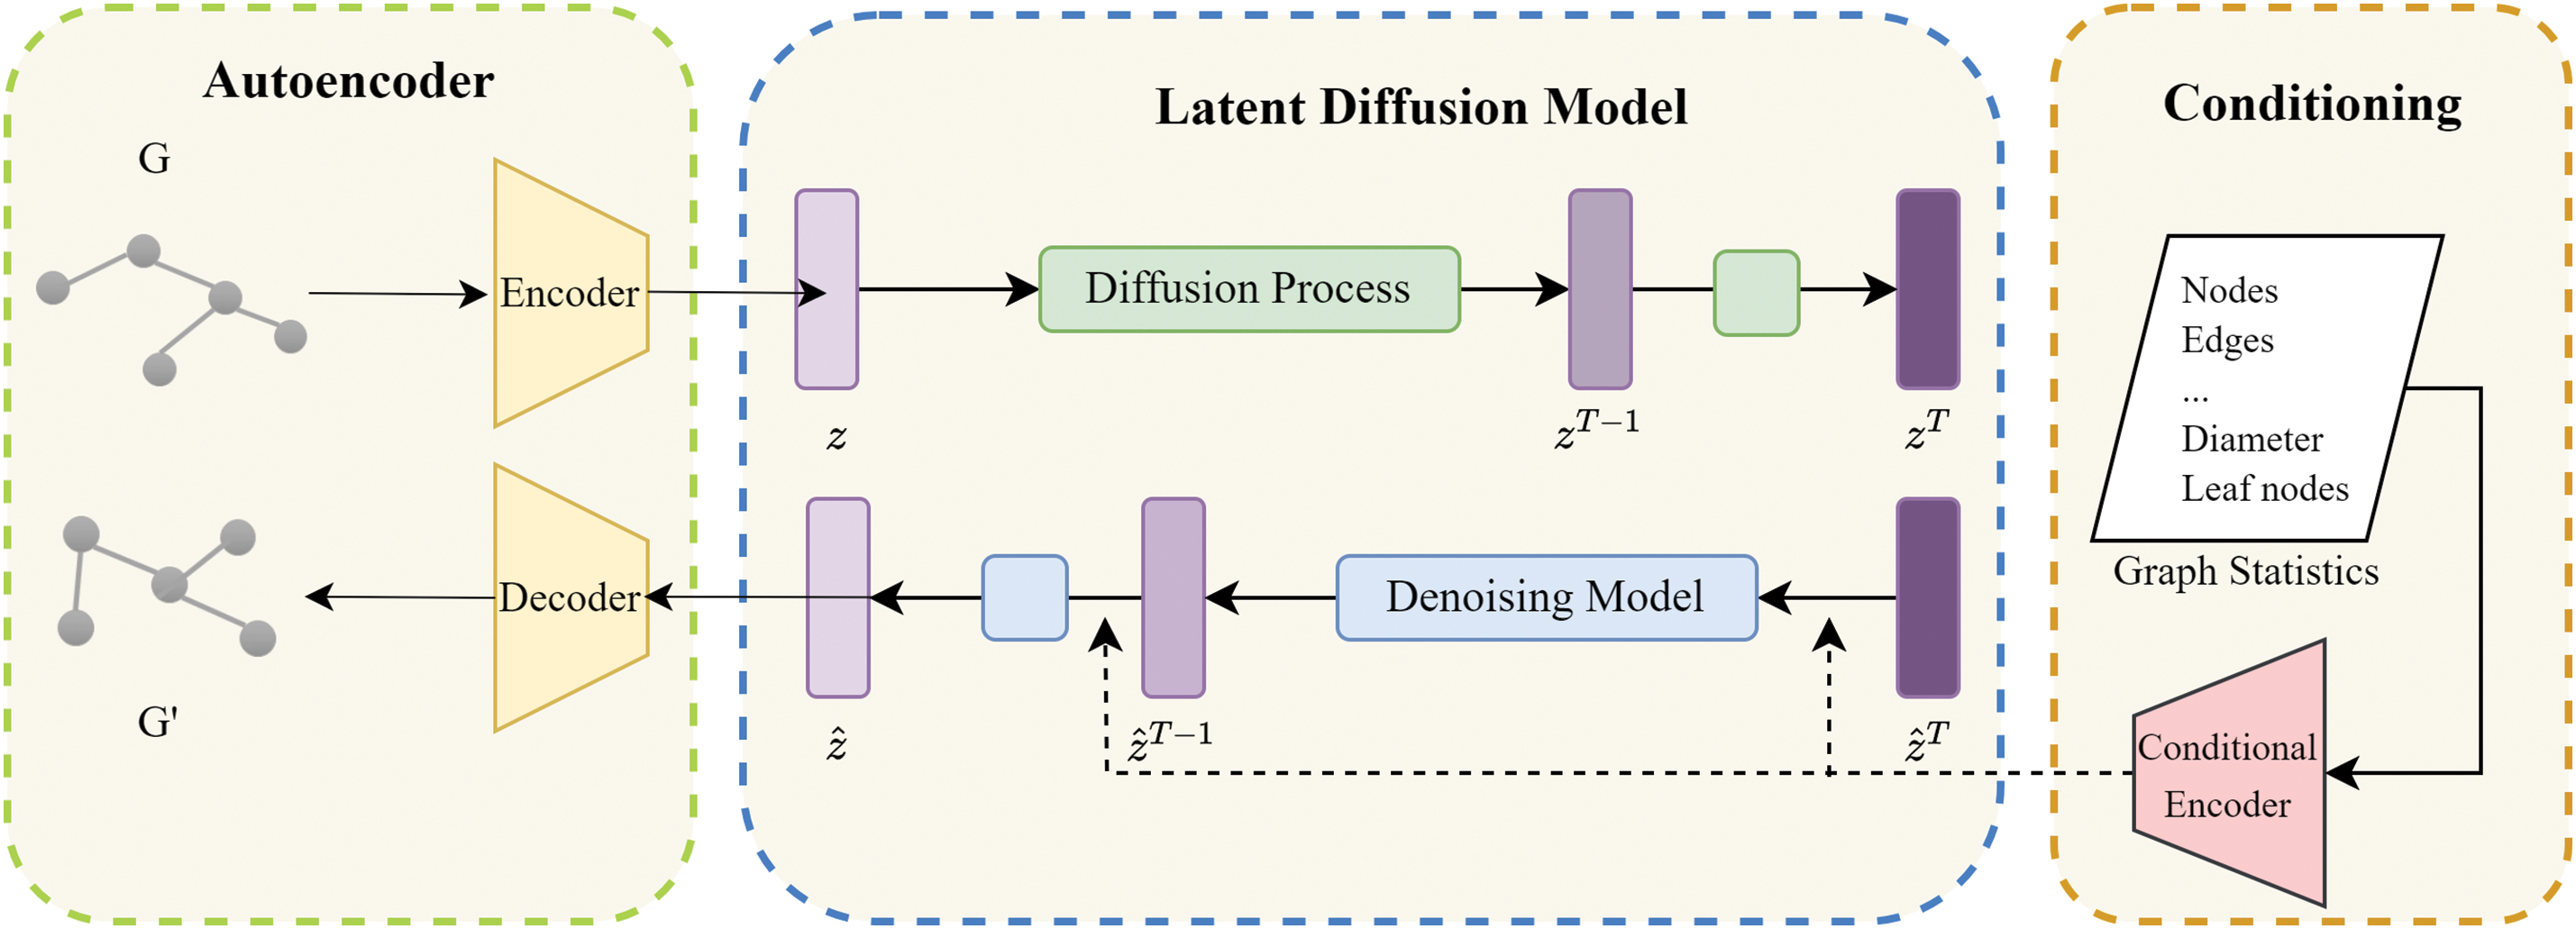
Figure 2: Graph structure generator based on latent diffusion model. This diagram depicts the main components of the generator: an autoencoder, a latent diffusion model, and conditioning on graph statistics. Initially, the autoencoder transforms a graph G into a latent space. This representation is then altered through a diffusion process that incrementally adds noise, which is subsequently refined by a denoising model using learned conditional probabilities. The process culminates with the decoder reconstructing the denoised latent representation into a synthetic graph
a) The autoencoder comprises both an encoder and a decoder. The encoder
Encoder. To mitigate the high variance in hidden space caused by traditional autoencoders, we employ a Variational Autoencoder (VAE). Using fully connected layers
Here,
Decoder. The decoder
Here,
b) Latent Space Diffusion Model: After training the autoencoder, it effectively maps graph data into low-dimensional embeddings that capture both the local and global characteristics of the input graph. The key benefit of the latent diffusion model, compared to traditional diffusion models, is its increased efficiency due to lower dimensionality, which speeds up the diffusion process. The latent diffusion model comprises two components: an additive noise model and a denoising network.
Noise model incrementally degrades the latent embedding
Here,
Denoising network. The objective of denoising networks is to predict the noise added at each state during the forward diffusion process, specifically inferring the ratio of raw data to noise incrementally. To train the denoising network, we aim to reduce the discrepancy between the true noise
We implemented a multilayer perceptron (MLP) as a denoising neural network
c) Guiding Conditions: The hidden diffusion model can represent the conditional distribution by incorporating additional conditional information c during the denoising process. Specifically, various information such as statistical features can be embedded in a hidden space to customize the model to generate output with intended attributes. Considering the information noted as
Here,
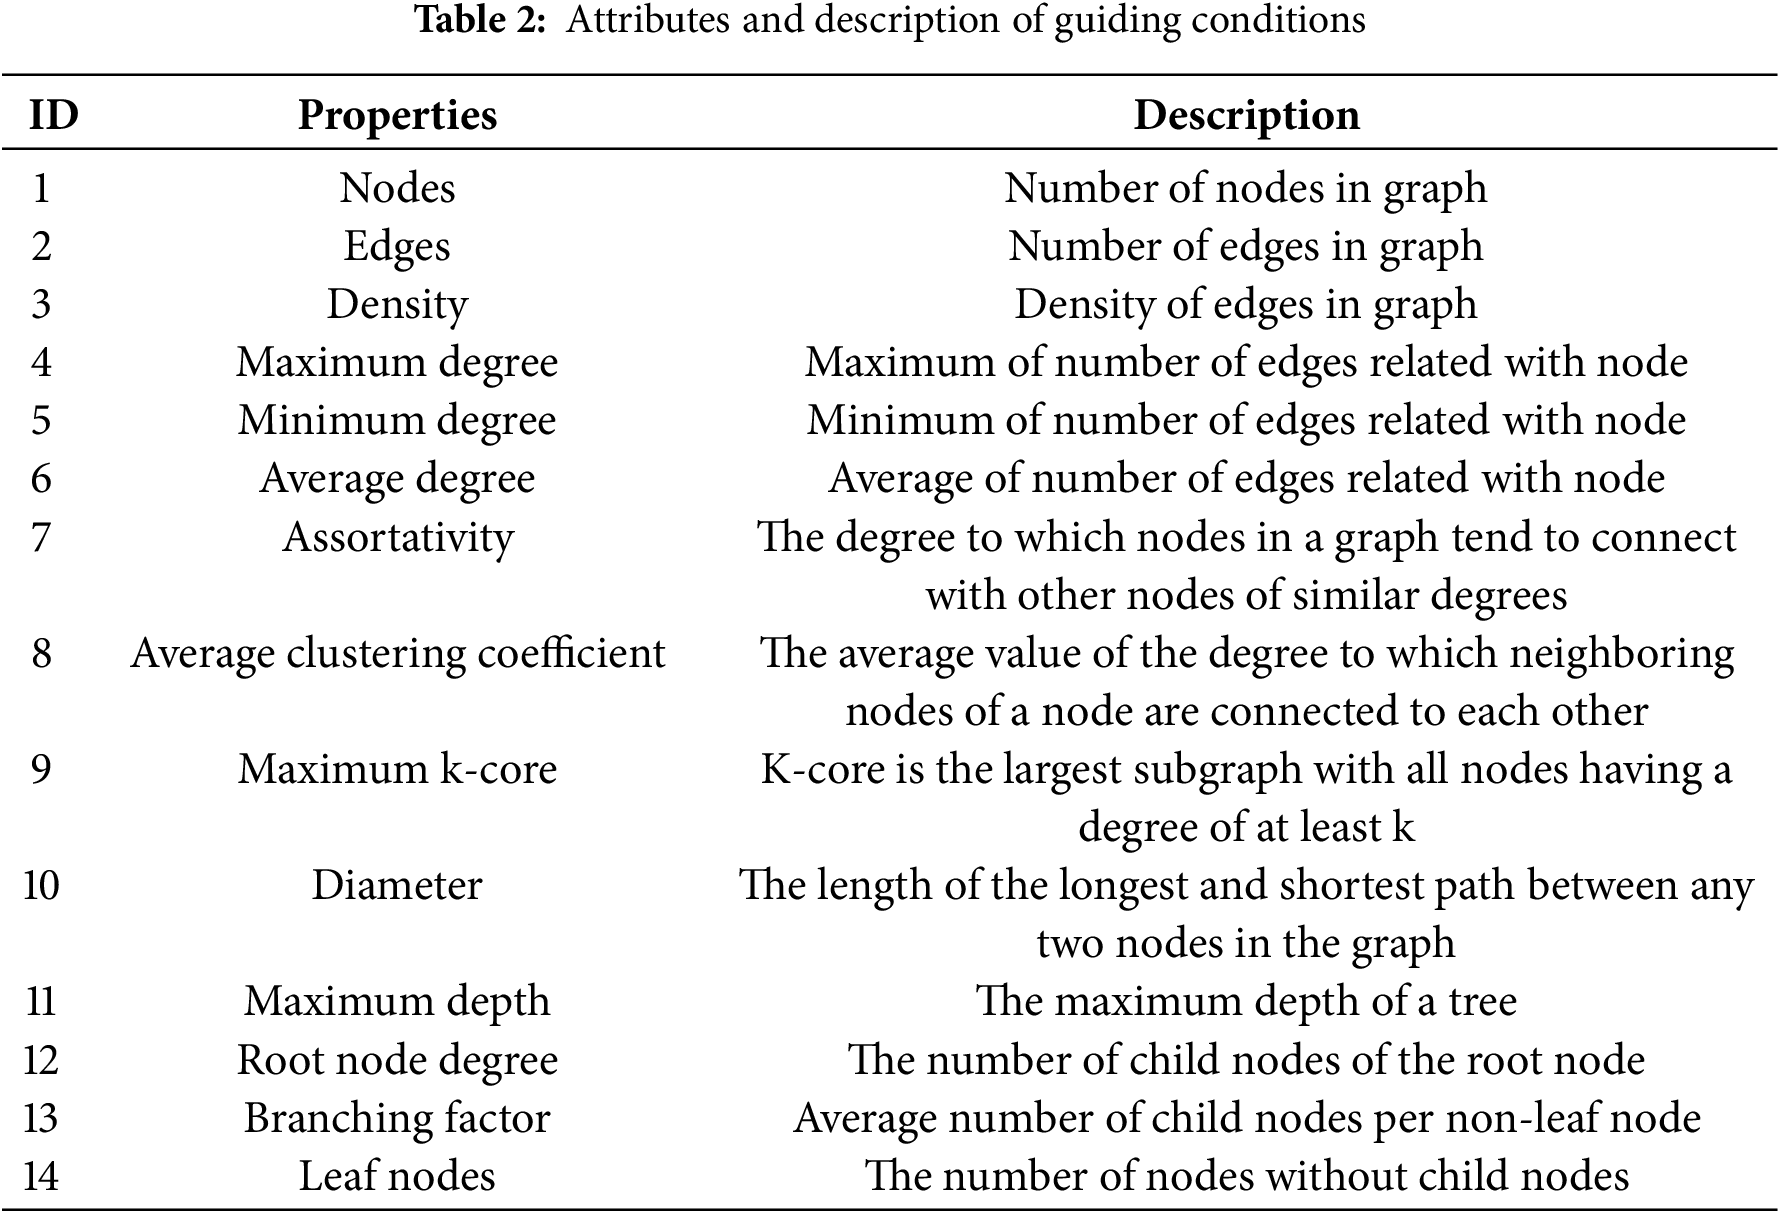
In this paper, the conditional information comprises the statistical features of the input propagation graph, detailed in Table 2. We selected 14 specific statistical attributes. These features cover multiple dimensions of the graph, aiding in our understanding of its topology, internode relationships, and information propagation patterns. We have chosen 14 specific statistical attributes based on the following considerations:
1. Global Graph Characteristics: Key attributes like the number of nodes, edges, and graph density provide essential information about the size and connectivity of the graph. These help us to understand how densely connected the graph is and how quickly information might spread.
2. Node Connectivity: Important metrics such as maximum degree, minimum degree, average degree, and assortativity indicate how nodes are connected and highlight important nodes within the network. These nodes are often crucial in the propagation of false information, making them key targets in the detection of fake news.
3. Information Propagation Routes: Measures like the average clustering coefficient, the maximum k-core, and diameter gauge the intensity and lengths of the pathways for the spread of information. A higher clustering coefficient suggests tight clusters of connections, k-core analysis reveals important substructures, and the diameter shows the longest distance between two nodes, impacting the spread’s efficiency and scope.
4. Tree-Like Structures: In news spread, especially with fake news, the diffusion often follows a tree-like structure. Characteristics such as maximum depth, degree of root nodes, branching factor, and number of leaf nodes allow us to see the hierarchical organization and the spread paths, crucial for tracing and understanding the dissemination of false information.
4.2.2 Node Content Generation Based on LLM Prompt
LLMs have demonstrated remarkable capabilities in text content generation, particularly in few-shot and zero-shot scenarios. Using their generative strengths, LLMs can produce coherent and logically structured text even with minimal or no sample prompts. This paper presents two approaches for generating node content for new graph samples using LLM, which are categorized into a direct generation strategy and an enhancement strategy. For detailed strategies and the corresponding prompts utilized in these approaches, refer to Table 3.
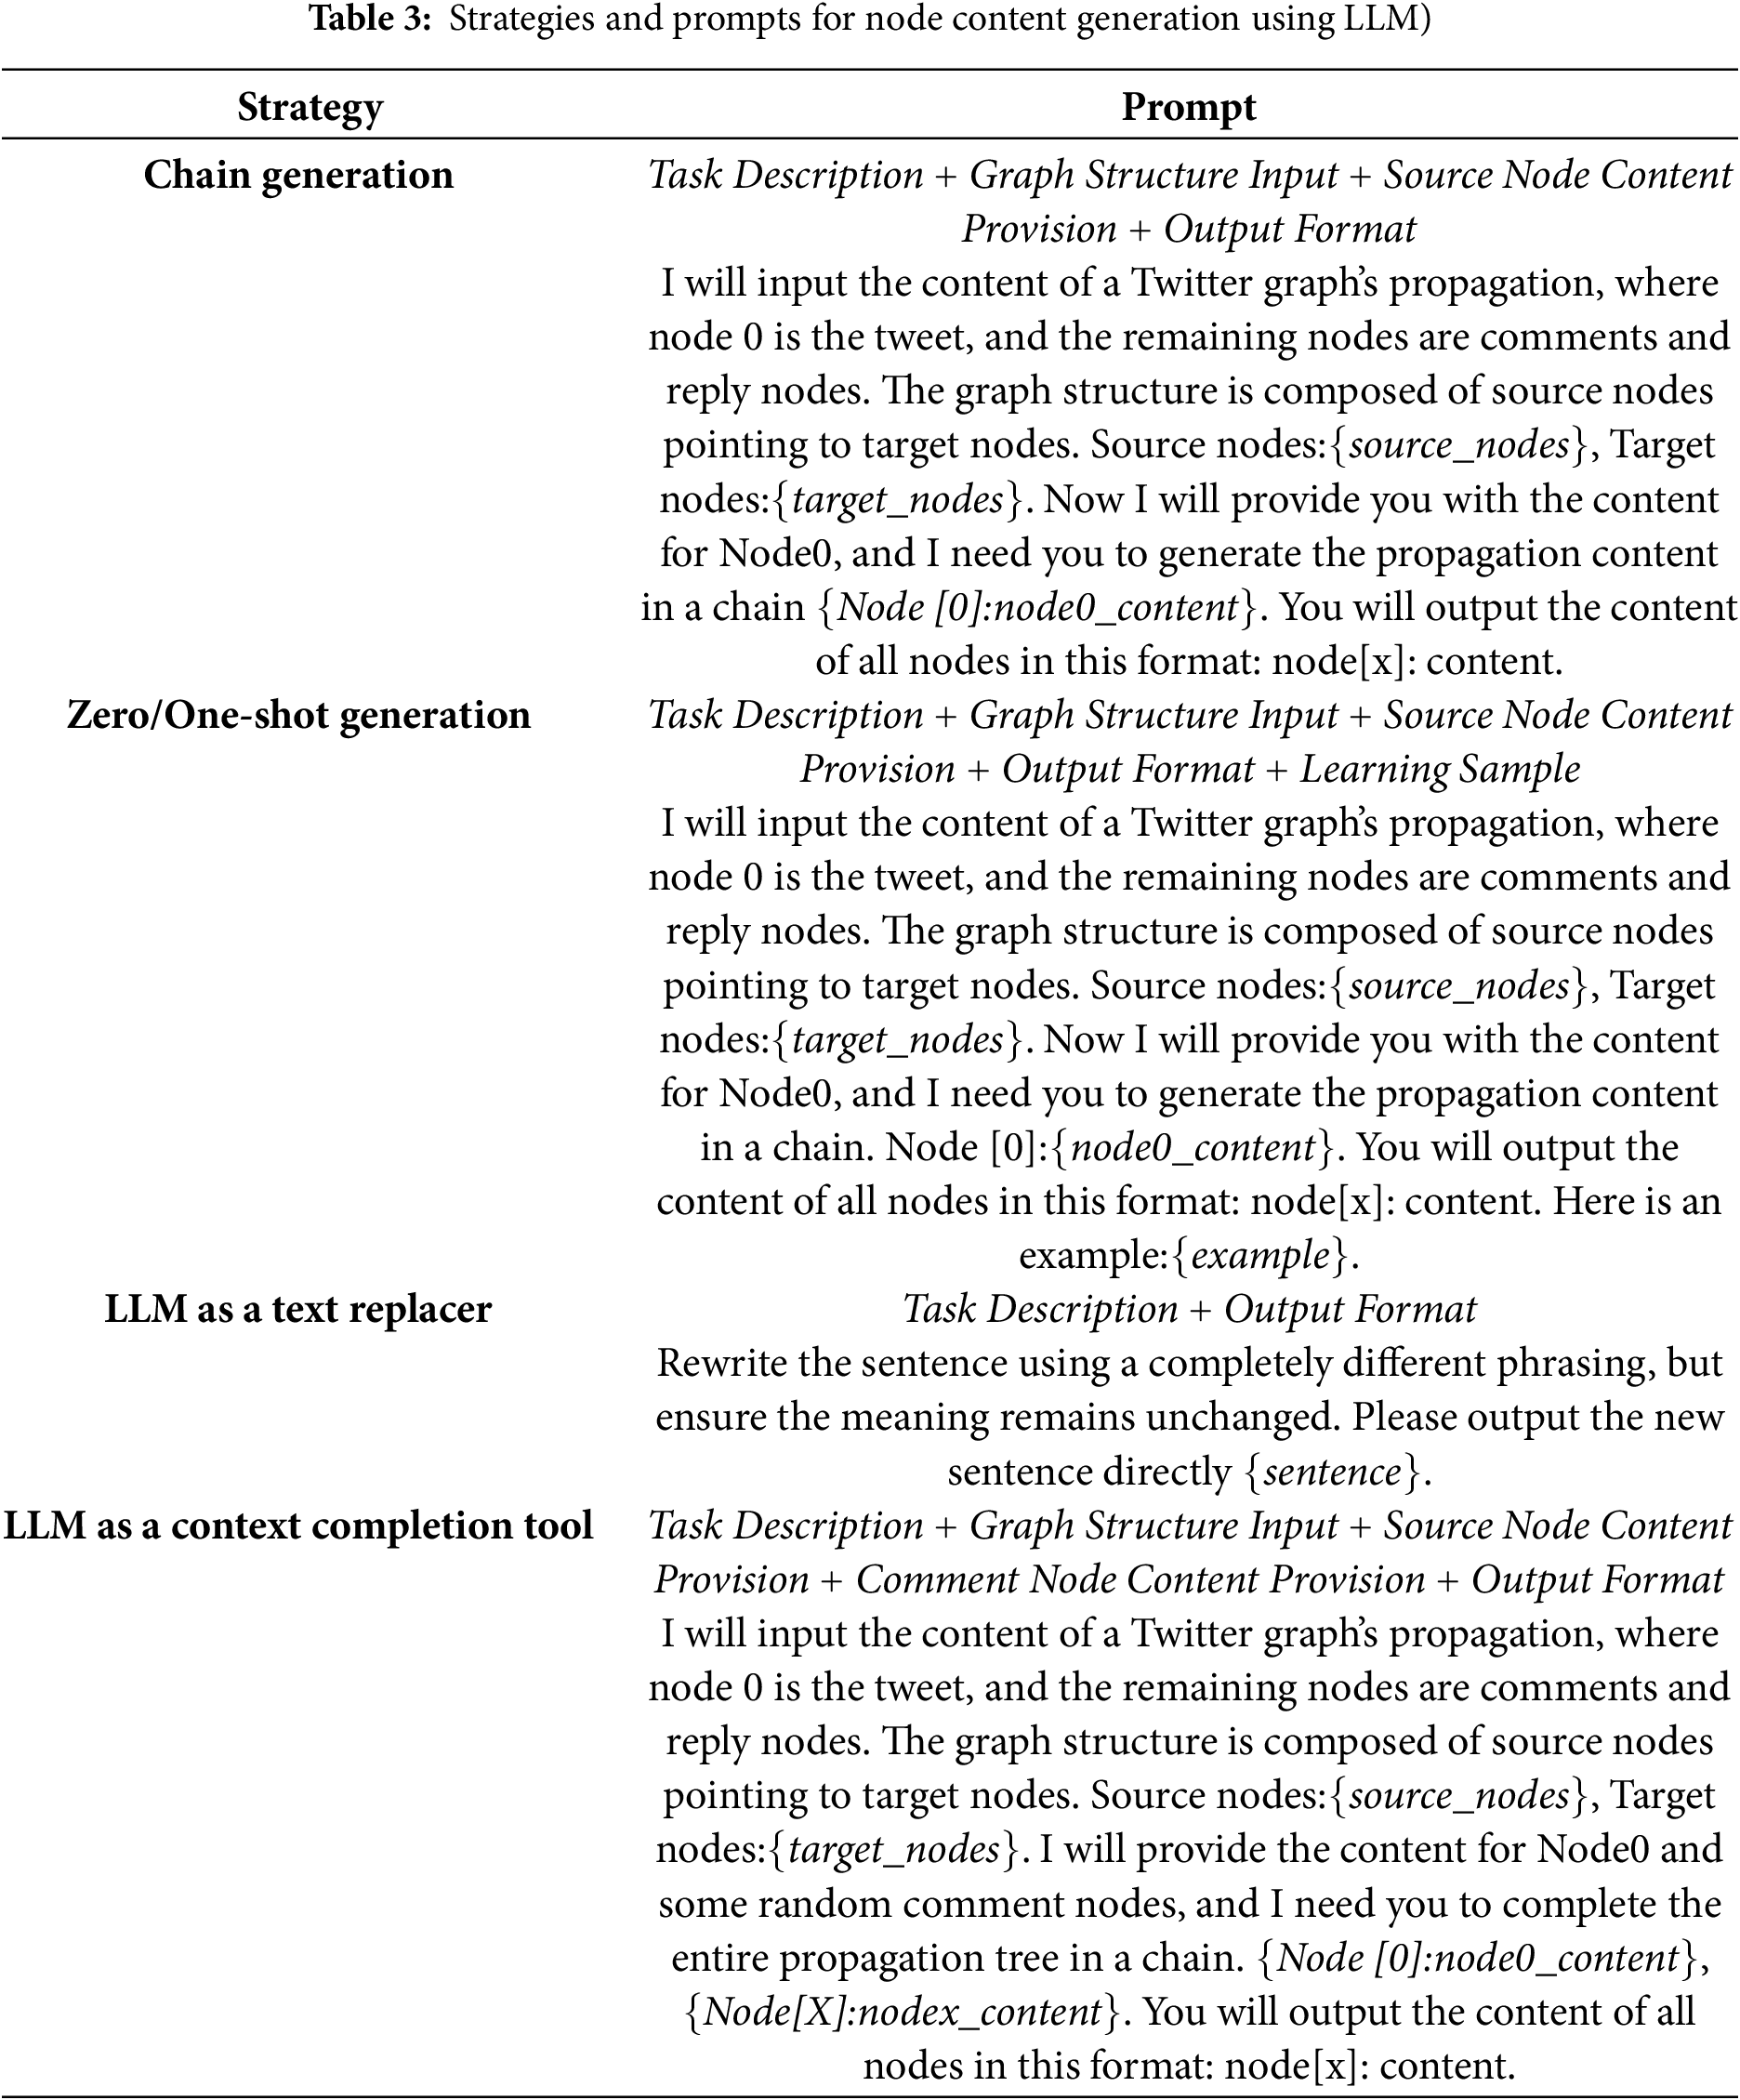
Generation Strategies:
1. Chain Generation: This strategy is designed to handle related content, such as source news articles, comments, and their replies-often a significant challenge for traditional text generation systems. However, LLMs, with their exceptional memory and comprehension abilities, can generate a series of coherent replies using simple prompts, mimicking real Twitter conversations. Specifically, based on the graph structure outlined in Section 4.2.1, we input (source node, endpoint node) pairs and instruct the LLM to ensure that the content of the endpoint node is closely related to that of the source node. The LLM then outputs the content for all nodes sequentially.
2. Zero/One-Shot Generation: The one-shot generation strategy enables the model to produce content based on a task description after receiving a single example. In contrast, the zero-shot generation strategy allows the model to generate content based solely on task descriptions without specific sample guidance. For example, in a zero-shot scenario, we can instruct the LLM to generate a complete Twitter spread map, including the source news, based on the core content of a news story. In a one-shot scenario, we might provide a simple graph containing four nodes and their textual relationships as a learning sample for the LLM to guide its content generation.
Enhancement Strategy:
1. LLM as a Text Replacer: The LLM can replace wording and sentence structures in the text while preserving the semantic consistency of the original content. This capability is particularly valuable for enhancing news articles, as it increases text diversity and robustness. In this approach, text content from a propagation graph is randomly selected from the original dataset, and the LLM is used as a sentence replacer to generate new text. The newly generated text serves as the node content in the graph.
2. LLM as a Context Completion Tool: Given its strong contextual understanding and reasoning abilities, the LLM can be employed to automatically complete the text content in a propagation graph. The method involves randomly selecting a graph from the original dataset and sampling a proportion of node content. This sampled content is then filled in some nodes of the generated graph. Subsequently, the graph structure information is provided to the LLM in the form of (source node, endpoint node) pairs, with instructions to ensure that the endpoint node content is closely related to the source node content. Through this approach, the LLM can effectively establish contextual associations and automatically complete the text content for all nodes.
4.3 Hierarchical Multi-View Graph Level Contrastive Learning
We develop a hierarchical multiview graph contrastive network that generates enhanced views by perturbing the input graph, facilitating comparisons at three levels: node-node, node-graph and graph-graph across two views. The first two types of comparison occur within the same view, whereas information from different views is integrated using a balance index. The node-node comparison primarily captures the correlation between the content of the source news text and the structural propagation content. In contrast, the graph-graph comparison operates between the two views, optimizing the embedding information of the graph, which significantly enhances the node-subgraph level comparisons. Fig. 3 illustrates the framework of hierarchical multiview graph contrastive learning.
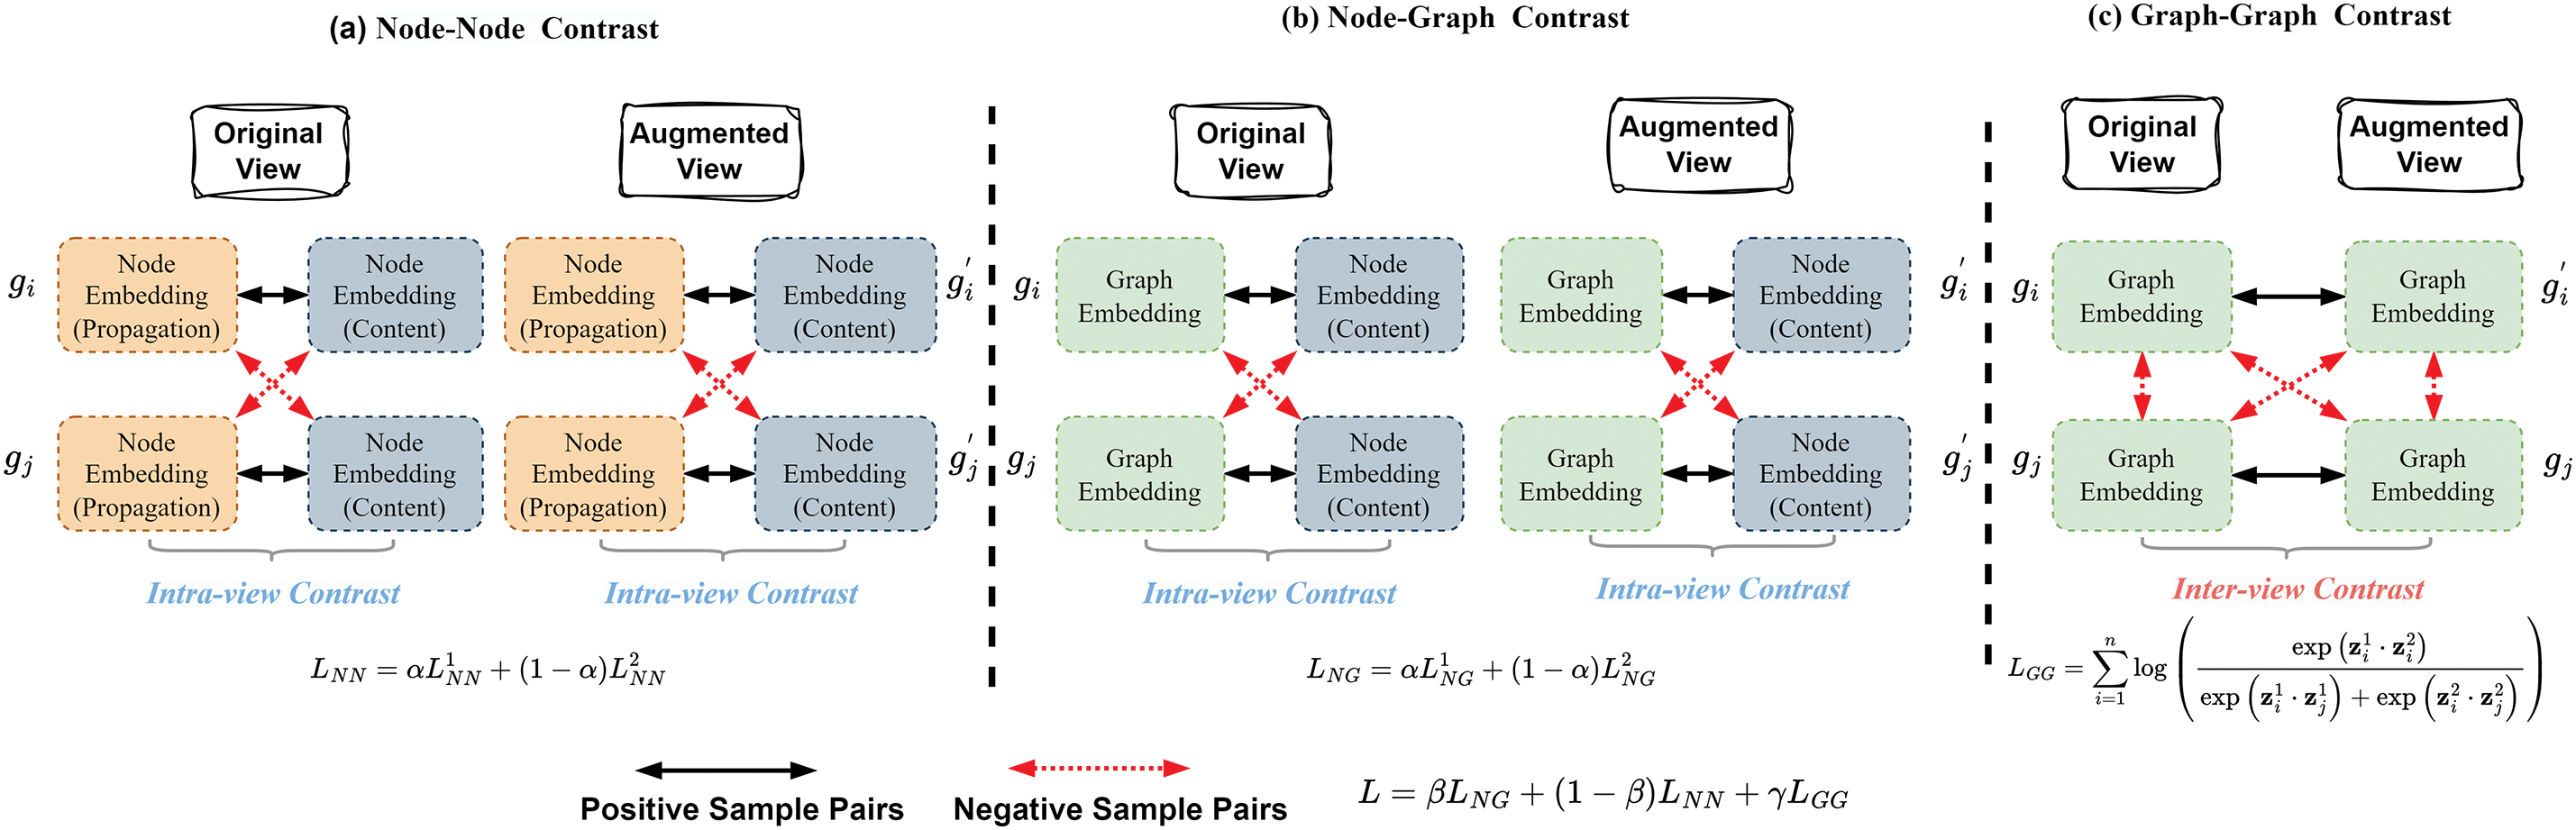
Figure 3: Architecture of hierarchical multi-view graph level contrastive learning
4.3.1 Node-Node Embedding Contrastive Learning
The dissemination patterns of fake news typically differ from those of real news, and discussions in the comments can help identify fake news. Comparing text embeddings with propagation embeddings allows us to learn the correlation and consistency between the source news content and the content of comment nodes. This forms the basis for our node-node-level comparison.
In this context, the source news is represented as the source node
The dissemination characteristics of the news cover both the dissemination structure and the content of the comments. These characteristics can be extracted by masking the features of the input graph
The hidden states at the l + 1 and l-th layers are denoted by
In each view, text embeddings and propagation embeddings derived from the same graph constitute positive sample pairs, whereas embeddings from different graphs form negative sample pairs. This paper employs a bilinear model to assess the similarity between
In general, text embeddings and propagation embeddings exhibit opposite characteristics, with
Here,
Similarly, similarity
where
4.3.2 Node-Graph Embedding Contrastive Learning
The node graph embedding contrast facilitates an effective cross-level comparison, allowing the learning of semantic consistency between the source news nodes and the entire propagation graph by aligning the representations at various levels of granularity. The representation of the source node
To derive the embedding for the input graph, we employ a new Graph Convolutional Network encoder that maps features from all nodes in the input graph to the embedding space. The hidden layer representation of subgraphs is defined as Eq. (12):
where
Next, we apply the READOUT function to obtain the graphical representation
Here, READOUT(
Consequently, the representation of the source node
where
We can similarly derive the similarity
Notably, the fusion parameter
4.3.3 Graph-Graph Embedding Contrastive Learning
To enhance the input graph
The graph representation of
Here,
To leverage the strengths of the three comparison types, we optimize a joint loss function. The total loss function for hierarchical multiview contrastive learning at the graph level incorporates three levels of contrastive loss: point-point, point-graph, and graph-graph as Eq. (18):
In this equation, the weight parameters
Following the self-supervised graph contrastive learning, we apply the learned hidden layer representations of the source nodes for the detection and classification of fake news. During the classification phase, we employ MLP as the downstream classification model. The MLP effectively processes the high-dimensional feature vectors generated through graph contrastive learning and abstracts these complex data for classification via its multi-layer architecture. Ultimately, the final prediction
Here,
4.5 Computational Complexity Analysis
In the sample generation stage, the FHGraph framework primarily involves the generation of the graph structure and node content. The generation of graph structure includes the encoding and decoding operations of all nodes in each graph, with a computational complexity of
In the hierarchical multiview graph contrastive learning stage, the algorithm deals with both intergraph and intragraph contrastive learning. Firstly, by randomly perturbing edges to generate enhanced views, the computational complexity of this part is
Experimental Environment. All experiments were carried out on computers running the Windows 10 operating system, each equipped with one Intel Core i7-13490F processor, one NVIDIA GeForce RTX 3060 Ti G6X graphics card with 8 GB of VRAM, and 32 GB of system memory. The experiments utilized two open-source frameworks: PyTorch 2.0.1 and PyTorch Geometric 2.5.3.
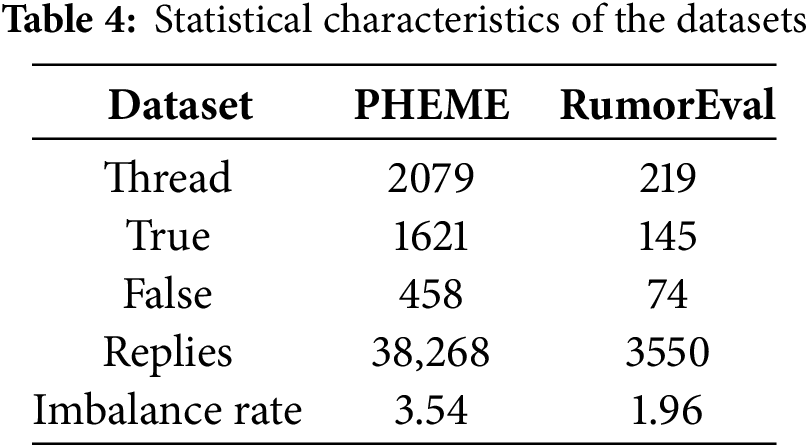
Dataset. To evaluate the performance of the proposed framework, FHGraph, we conducted experiments on two widely used real-world datasets: PHEME [32] and RumorEval [33]. These datasets consist of conversation threads collected from Twitter and Reddit, respectively, including source tweets, their tree-structured replies (comments), and authenticity labels (fake or real). Table 4 presents statistical information for both PHEME and RumorEval, which exhibit slight class imbalances.
Baseline Methods. We employed 10 random seeds to train each baseline model, selecting the model parameters that achieved the best performance in the validation set for classifying the test data. We evaluated representative baselines for fake news detection using F1 Macro and F1 Micro scores, focusing on three main categories: (1) Deep Learning Methods: SVM, CNN, RvNN; (2) Advanced Graph Neural Network Methods Based on GCN: BiGCN, EBGCN; (3) Graph-Level Class Imbalance methods: G-mixup, G2GNN. (4) Contrastive learning methods:GACL, iGCL. The baseline methods are as follows:
(a) SVM [34]: Support Vector Machine is a traditional supervised learning algorithm effective in classification and regression tasks. Although SVM performs well with low-dimensional features, its effectiveness may be limited in high-dimensional and nonlinear contexts.
(b) CNN [35]: Convolutional Neural Networks utilize convolutional kernels to extract local features to identify key patterns, making them widely applicable in text analysis and other one-dimensional data.
(c) RvNN [14]: This method recursively processes data to capture hierarchical structures, making it particularly suitable for data with clear hierarchical formats, such as language and sentences.
(d) BiGCN [8]: This approach employs two GCN modules that operate in both descending and ascending directions to capture the news dissemination patterns on social networks.
(e) EBGCN [36]: The Edge Enhanced Graph Convolutional Network improves traditional GCNs by enhancing edge feature representation, thus capturing more robust structural representations.
(f) G-mixup [15]: A sample generation technique that employs category primitives for graph-level interpolation, generating soft samples with mixed labels to balance category distribution.
(g) G2GNN [17]: This method connects independent graphs based on kernel similarity, improving representation learning for minority classes through additional signals propagated between graphs, thus addressing class imbalance.
(h) GACL [16]: This method leverages contrastive learning within the loss function to differentiate between positive and negative samples, thereby improving the robustness of the model and improving the detection of fake news.
(i) iGCL [30]: This method improves graph-level contrastive learning by reconstructing the graph topology and leveraging the hidden space learned through variational graph auto-encoders.
Hyperparameters. In the sample generation phase of the latent diffusion model, we first pretrain the model using a synthetic tree-structured graph dataset and then fine-tune it on a real news dataset. During the pre-training phase, the learning rate is set to 0.001, while in the fine-tuning phase, the learning rate is adjusted to 0.0001. The batch size is set to 128, with 800 epochs for autoencoder training, 500 epochs for denoising training, and 300 diffusion steps. The dimension of the latent space is set to 32. In the graph contrastive learning module, we utilized a unified hidden dimension size of 128, a batch size of 128, Adam optimizer, a learning rate of 0.005, a dropout rate of 0.5, and a maximum of 250 epochs with an early stopping strategy. For other parameters in the baseline methods, we applied the recommended values specific to each approach. The data set was randomly divided into training, validation and testing sets with a ratio of 8:1:1.
Prompt selection. In this study, we utilized OpenAI’s ChatGPT-3.5-turbo API as our LLM to perform these tasks. We cross-used the generation and enhancement prompt strategies to ensure contextual relevance and accuracy. Specifically, when processing source news content, we mainly adopted the “LLM as a text replacer” strategy, and replaced the tweet content with the help of the prompt engineering “rewrite while retaining the original semantics”. For the generation of node content, we adopted the “one-shot generation” and “LLM as a Context Completion Tool” strategies.
The number of generated samples. We determine the number of generated news samples using a mathematical formula, adjusting the sample size based on different class balance requirements. The number of samples generated varies under different balance settings due to the different ratios needed for each setting. The number of minority class samples to be added, X, is calculated by:
Performance Metrics. In the task of dealing with class imbalance, we selected two commonly used performance metrics: F1 Micro and F1 Macro. These two metrics can effectively evaluate the performance of the model in multi-class classification, especially when dealing with imbalanced class distribution.
The F1 Micro score is the weighted average of precision and recall across all classes:
where
Here,
The F1 Macro score is calculated by first determining the F1 score for each class individually and then taking the arithmetic mean of these F1 scores:
where N represents the number of classes and
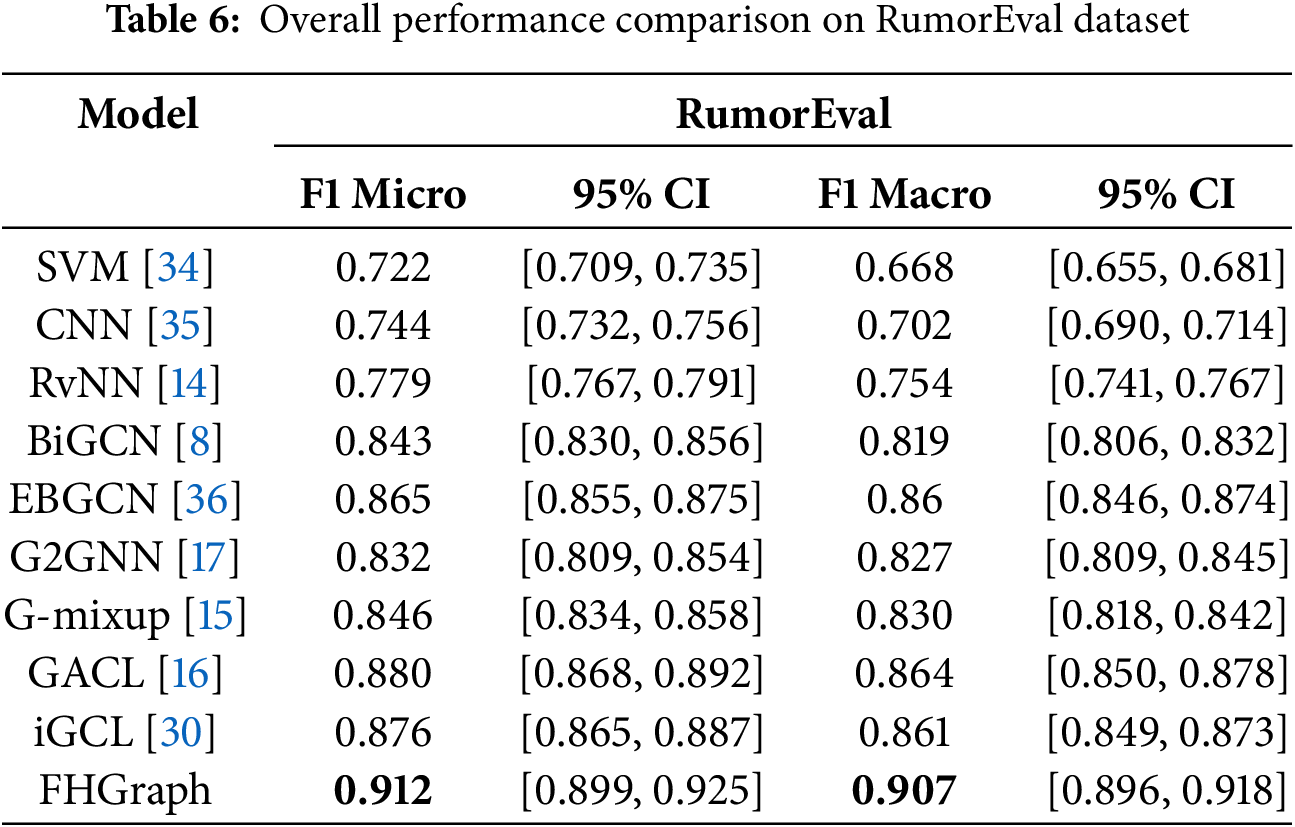
Tables 5 and 6 present a performance comparison between our proposed FHGraph framework and several benchmark methods on the two datasets. The results include not only the F1 Macro and F1 Micro scores but also the 95% confidence intervals for these metrics, providing a more comprehensive view of model performance. The tables highlight that our model significantly outperforms the benchmark models in both F1 Macro and F1 Micro scores, as indicated in bold. In addition, the inclusion of 95% confidence intervals help to illustrate the statistical significance and reliability of our results.
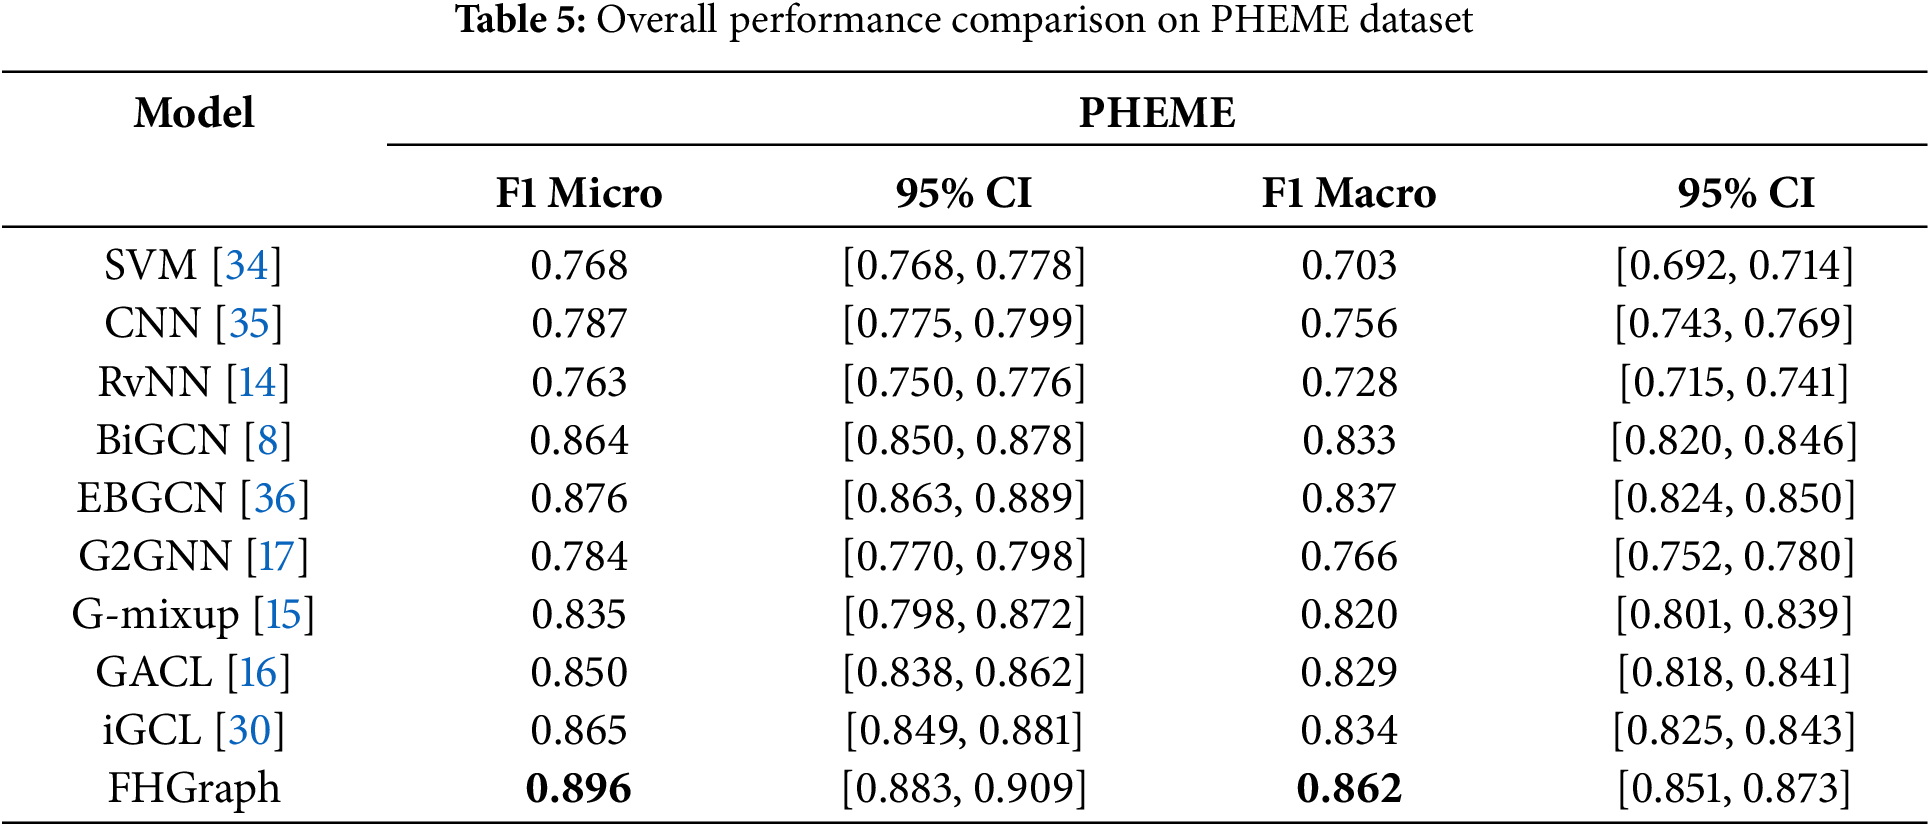
As expected, traditional learning methods based on low-dimensional features, such as SVMs, show the poorest performance. Deep learning methods like CNNs focus only on local spatial features. Although RvNN can analyze top-down and bottom-up propagation relationships in news dissemination trees, they perform poorly due to only considering Euclidean distances, losing structural information in non-Euclidean graph data.
Graph-based models such as BiGCN and EBGCN perform better on two datasets. In particular, EBGCN, which incorporates an edge-enhanced Bayesian Graph Convolutional Network, captures more robust structural features, achieving a suboptimal F1 Micro score of 0.876 on the PHEME dataset. This suggests that graph-based methods may be more effective in handling complex relationships.
In methods addressing graph-level class imbalance, G-mixup, as an augmentation strategy to expand decision boundaries, shows positive effects. However, as an interpolation synthesis method, the performance of G-mixup depends on the quality of the synthesized samples. When the structural and embedding differences between two target samples are significant (e.g., large vs. small dissemination graphs, or news content from different domains), the interpolated samples fall in between, not conforming to realistic patterns, thus leading to significant performance variability. This can be observed in the broad confidence intervals for the F1 Macro scores in Table 5. G2GNN, based on the GOG architecture and graph homogeneity theory to propagate minority class information, shows notably reduced performance in the PHEME data set due to a low homogeneity rate of about 60% in the constructed GOG graph, where low-quality connections introduce significant noise.
Graph-level contrastive learning methods, such as GACL and iGCL, generally achieve superior performance. Particularly in the RumorEval dataset, where data volume is smaller, graph contrastive learning strategies enable the model to self-learn from limited samples and explore better optimization representations, thus achieving suboptimal results in both metrics. The graph-level contrastive strategy effectively narrows the distance between samples with the same labels while distancing those with different labels, enhancing model performance by deeply mining sample label information. However, both methods primarily rely on perturbations in graph structure to form different views of the same graph as positive samples, without deeply integrating text content, thus hitting a performance bottleneck.
Ultimately, FHGraph stands out among all models, especially in achieving the highest F1 Macro and F1 Micro scores in both inherently imbalanced datasets. Improves the instability of traditional graph-level class imbalance methods by effectively generating diverse independent minority class samples. By employing hierarchical multiview graph contrastive learning, which deeply integrates graph structure and text content to mine graph-text consistency, it breaks through the traditional bottlenecks of graph-level contrastive learning methods, significantly enhancing the model’s generalization ability and accuracy in recognizing minority class samples. Compared to state-of-the-art (SOTA) graph-level class imbalance methods and SOTA graph-level contrastive learning methods, FHGraph has improved by 2% in F1 Micro score and 2.5% in F1 Macro score on the PHEME dataset, and by 3.5% in F1 Micro score and 4.3% in F1 Macro score on the RumorEval dataset.
5.3 Results on Class Imbalance
We compared the performance of FHGraph with baseline methods in the context of class imbalance. In the experiment, we set the sample size of fake news to a specific proportion (k) of the real news data to simulate scenarios where real information significantly exceeds false information in social networks, specifically
In this imbalanced setting, the F1 Macro score becomes particularly important as it provides a fair evaluation of the model’s classification performance across all categories, irrespective of the sample size for each category. Consequently, we focused on comparing the F1 Macro scores of different methods, with the results presented in Fig. 4. As the k value decreases from high to low, the challenges faced by the models gradually increase because a lower k value means fewer fake news samples in the dataset, thus making it more difficult for the models to recognize and correctly classify these minority class samples.
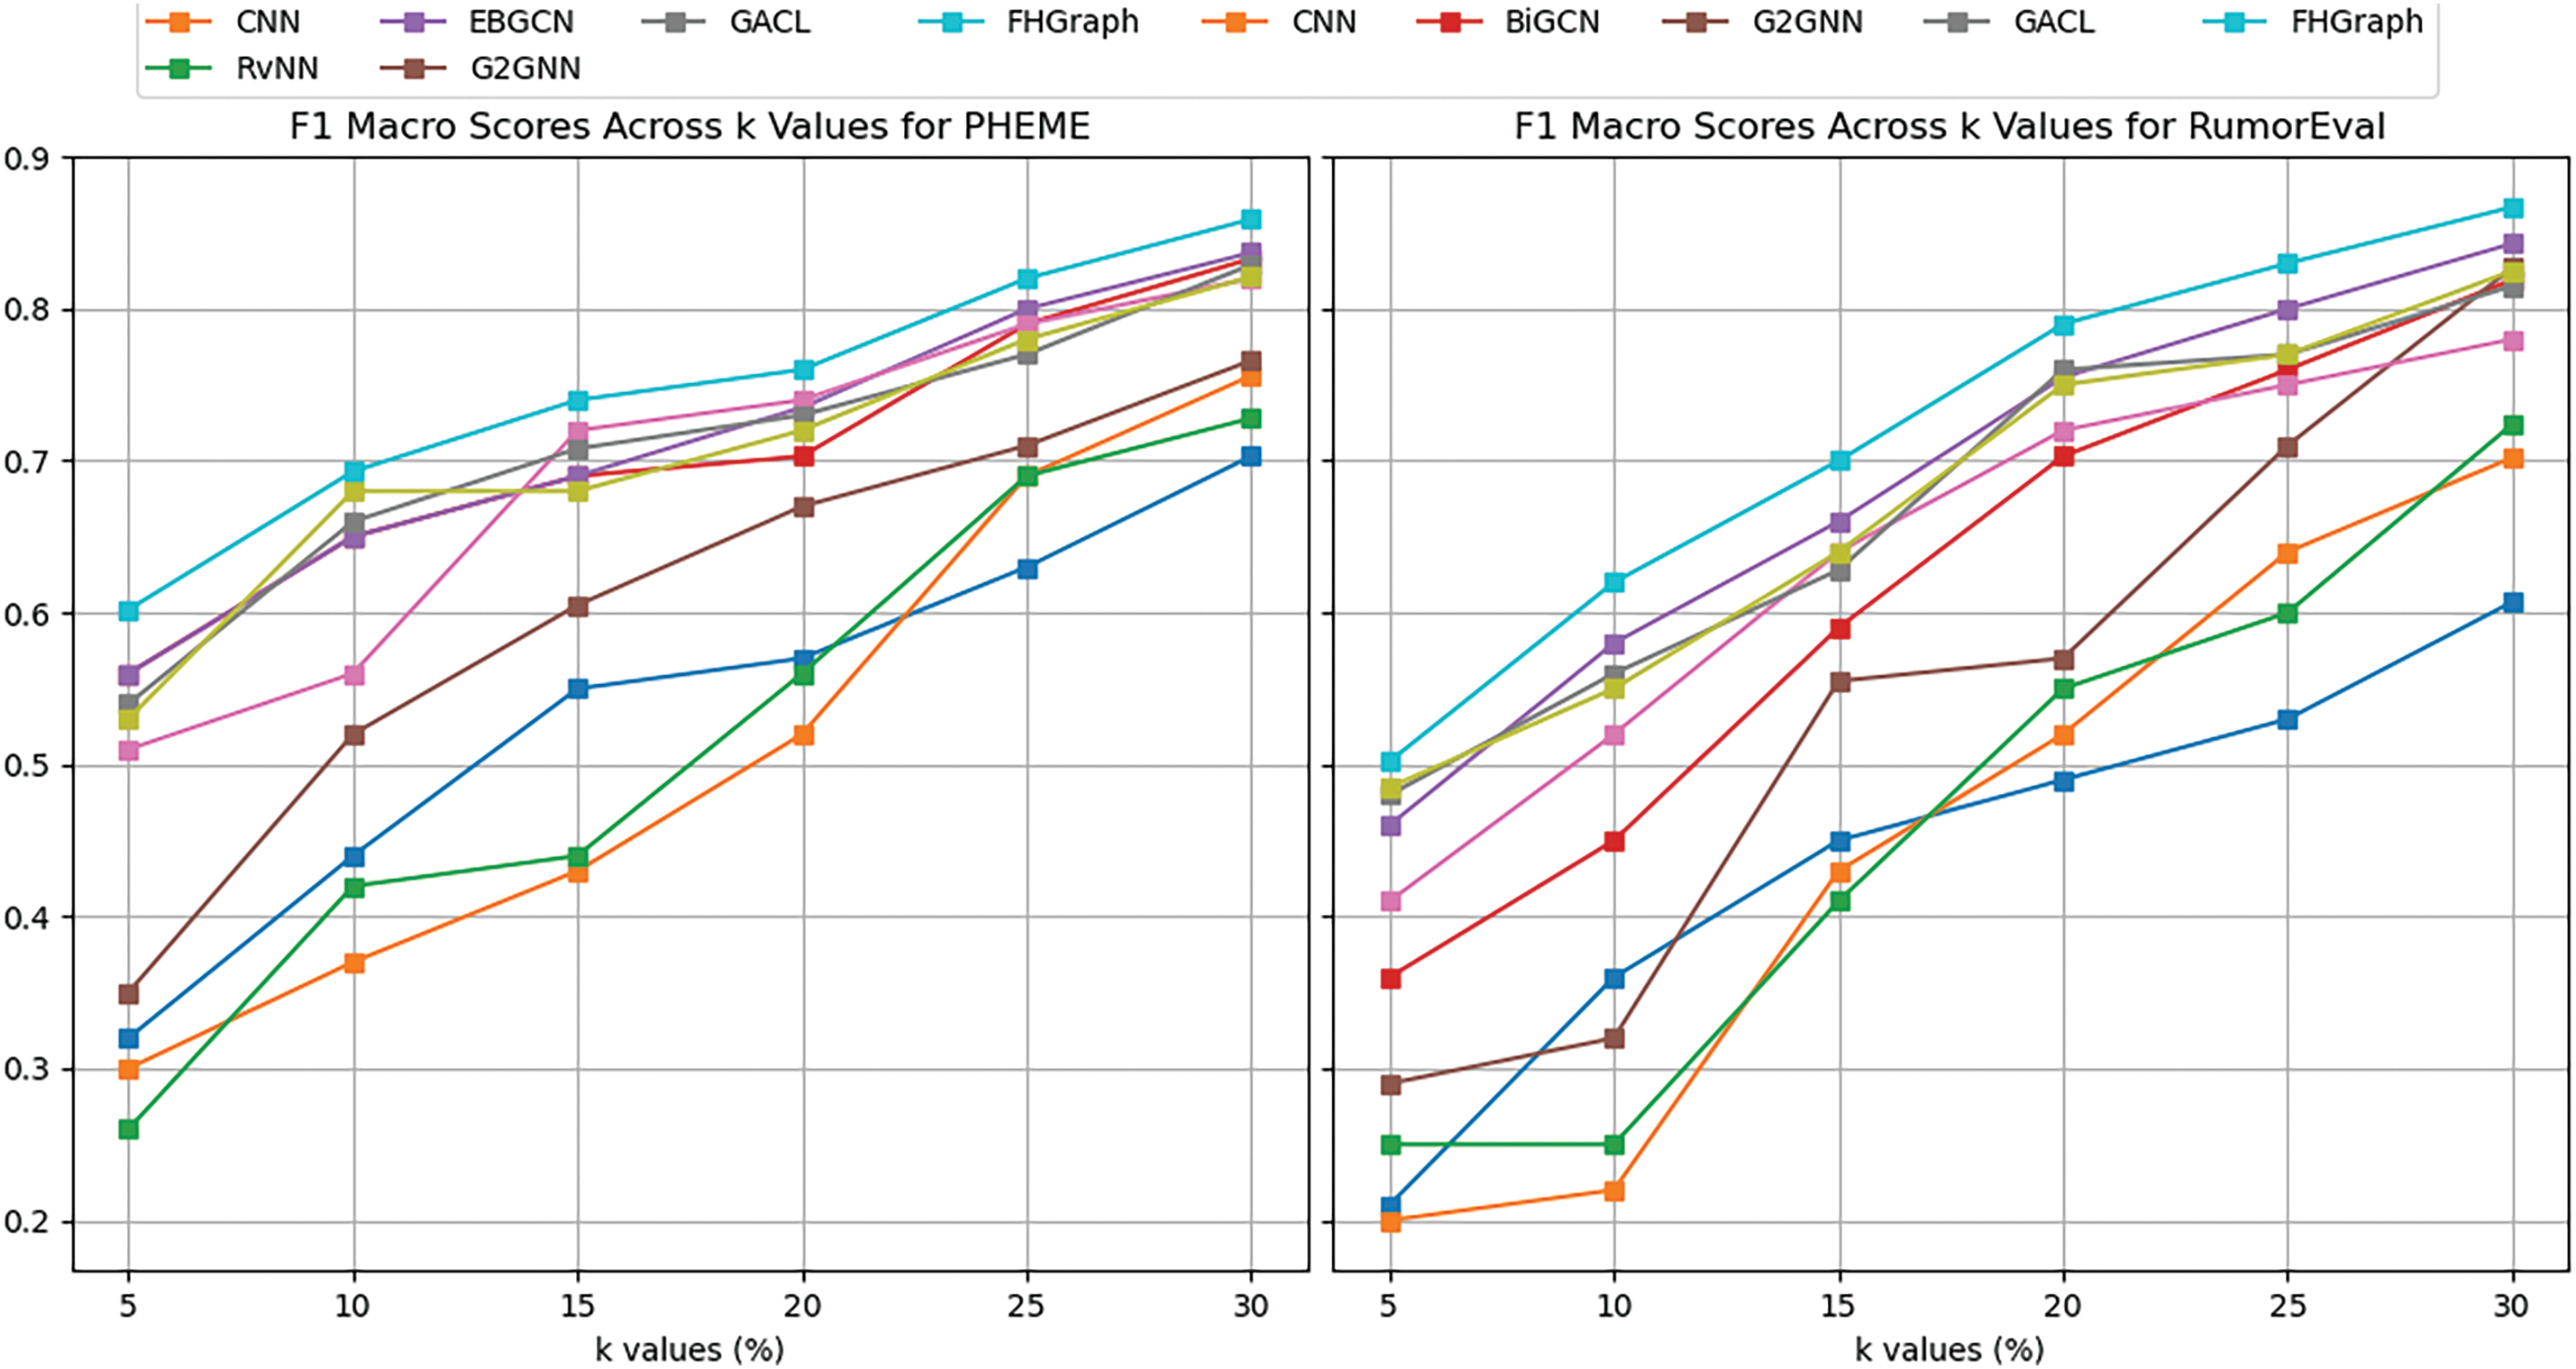
Figure 4: F1 Macro scores of different methods across
From the results shown in Fig. 4, it is evident that when the k value is high, meaning that there are more fake news samples, most models achieve higher F1 Macro scores, indicating better classification performance. However, as the k value decreases, particularly to extremely imbalanced situations such as
Graph-level class imbalance methods like G-mixup and graph-level contrastive methods maintain good performance even under severe imbalance. The former alleviates imbalance by interpolating to generate new samples, while the latter enhances the optimization representation of the minority class through deep graph contrastive learning. From an experimental perspective, both types of method are beneficial in enhancing the model’s ability to handle imbalances, improving the model’s generalization and robustness. Our model is designed in fact on the basis of these two ideas.
FHGraph exhibits the best performance across all
Overall, as the
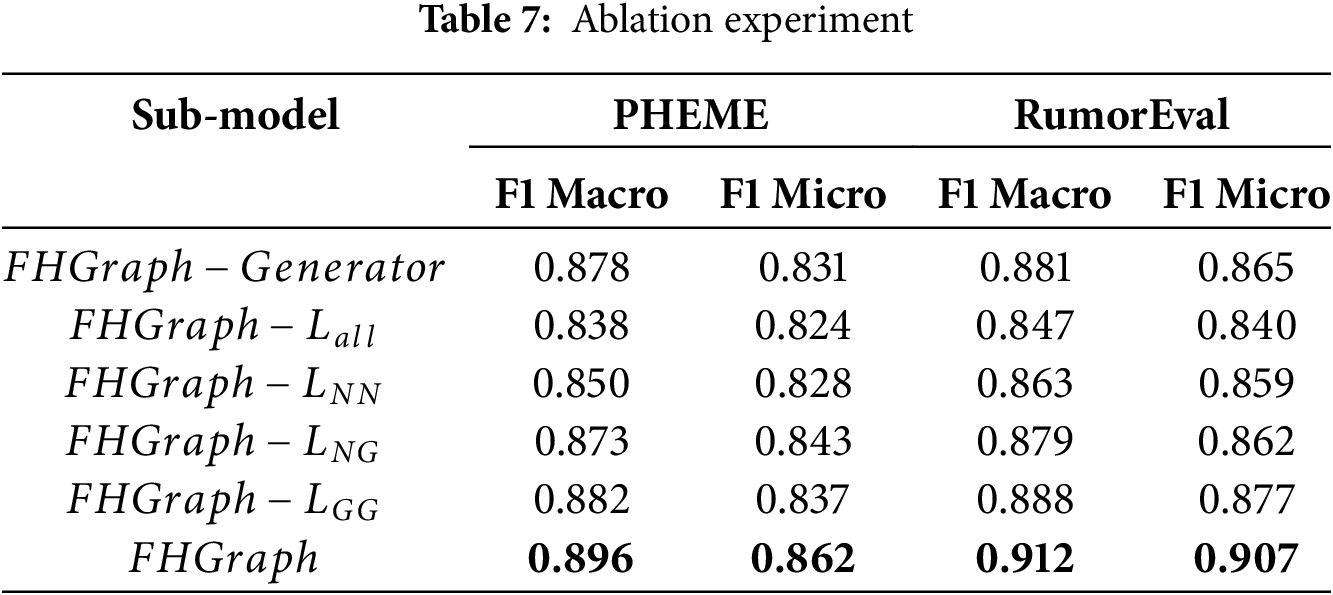
In this section, we conduct ablation studies to clarify the importance of each element within our proposed FHGraph model. The purpose of this analysis is to determine the role of each component by systematically eliminating them and observing the effect on the overall performance of the model. We then benchmark FHGraph against its variants:
(a)
(b)
(c)
The results presented in Table 7 indicate that each module positively impacts the model’s predictive performance, with the hierarchical multi-view graph contrastive learning module demonstrating the most significant contribution. This module allows the model to effectively learn the alignment between graph structure and text content at three different granularities, thereby enhancing the generation of optimized graph representations. Additionally, the minority class sample generator exhibited a greater performance improvement on the RumorEval dataset compared to the PHEME dataset. This disparity can be attributed to the smaller size of the RumorEval dataset, which leads to both sample imbalance and label scarcity issues. Our proposed sample generator leverages the knowledge base of large language models to generate diverse and high-quality samples from a limited set of examples, effectively mitigating the performance loss associated with sample scarcity and class imbalance.
In this section, we discuss the limitations of the FHGraph model.
(1) Challenges with Extreme Class Imbalance. Although FHGraph performs excellently in handling graph-level imbalances, its performance can still be affected in cases of extreme class imbalance. Specifically, when the dataset contains a severely limited number of positive samples, the model may struggle to learn effectively due to the insufficient number of positive examples. Although we address this issue by synthesizing minority-class samples through the use of a latent diffusion model combined with a large language model (LLM), the generated samples may still be insufficient to adequately represent the entire minority class distribution, especially when the number of fake news samples is extremely low. This can hinder the model’s learning ability.
(2) Challenges in Identifying Out-of-Distribution Fake News. FHGraph has been trained to cover a wide range of fake news propagation patterns and news domains, thus performing well in simulating and learning from known fake news samples. However, when faced with unseen fake news patterns or content from unknown domains, the model’s generalization ability may be impacted, particularly in the graph contrastive learning module, which is more susceptible to the effects of unknown domain content. Although the introduction of LLM brings in external knowledge and increases diversity, the knowledge introduced remains domain specific. This limitation means that the model’s performance may degrade when encountering entirely new and unknown domains in real-world applications.
We integrate several future directions to demonstrate the potential and challenges of FHGraph in the field of fake news detection:
(1) Real-Time Fake News Detection: While FHGraph performs well on static datasets, real-time fake news detection presents unique challenges, especially on social media and news platforms where information spreads rapidly and fake news is almost instantly generated and disseminated. Future research could explore the extension of FHGraph to real-time fake news detection, focusing on processing real-time data streams, dynamic model updates, and efficient information flow processing.
(2) Multilingual Adaptation: Adapting FHGraph for multilingual fake news detection involves not only processing multilingual text, but also capturing cross-cultural communication patterns. This involves understanding and analyzing the patterns of information dissemination across different cultural backgrounds, further enhancing the model’s applicability globally.
(3) Cross-Domain Fake News Detection: Given the widespread dissemination of fake news across various fields such as healthcare, finance, and politics, FHGraph could explore cross-domain fake news detection capabilities. Enhancing domain adaptation abilities through methods such as transfer learning or domain adaptation can enable FHGraph to leverage knowledge from different domains and effectively identify domain-specific patterns of false information dissemination.
(4) Incorporating External Knowledge Bases and Real-Time Data: To address unseen fake news content, future plans include incorporating external knowledge bases (such as real-time news, fact-checking databases, etc.) to further enhance the authenticity and diversity of the generated text, helping the model better capture false patterns.
FHGraph is a graph-level framework designed for fake news detection that leverages graph contrastive learning and generative learning. It effectively detects fake news in social networks and can be adapted for misinformation detection in healthcare and finance, particularly for text attribute graphs. In node-level detection, FHGraph uses the h-hop subgraph of a node.
In healthcare, false information, such as incorrect drug recommendations or health rumors, spreads through various channels like academic articles, forums, and news reports. FHGraph excels by tracing complex information dissemination paths within graph structures, incorporating text attributes to effectively manage textual and graphical data. This enhances its ability to identify false health information, crucial when data on health falsehoods are limited.
In finance, the spread of false information can severely affect markets, involving fake financial reports, stock manipulation, or investment scams. FHGraph addresses this by dynamically generating high-quality false financial information samples and using graph contrastive learning to model how such information spreads across markets, ensuring accurate detection and tracing of financial misinformation.
In discussing the FHGraph model, it is important to address ethical concerns related to its powerful analytical capabilities. Although the model can serve legitimate purposes, such as combating misinformation, it also has the potential for misuse in areas such as privacy invasion and information manipulation. Ensuring the transparent and responsible use of such technology is essential. Developers and users must maintain transparency in the FHGraph application process, rigorously review and supervise model outputs, and adhere to ethical standards. Establishing robust legal and ethical frameworks to guide the development and application of AI technologies is crucial to maximizing their benefits while preventing potential harms.
This paper introduces a novel framework for the detection of fake news that uses graph-level generative data augmentation and graph-level contrastive learning. The primary motivation behind this approach is to tackle the challenge of degraded model performance due to the significant imbalance between the abundance of real samples and the scarcity of fake news samples. The proposed FHGraph firstly employs a space-diffusion model to create graph structures that accurately reflect news dissemination patterns. Then FHGraph produces a series of diverse texts corresponding to the minority class nodes leveraging the few-sample learning capabilities of LLMs. The FHGraph framework also implements a sophisticated learning strategy that utilizes hierarchical multiview graph contrastive learning. The experimental results, derived from public datasets, demonstrate that FHGraph significantly outperforms baseline methods in various data imbalance scenarios. The results of the ablation studies further affirm that each component of the framework contributes positively to overall predictive performance. In particular, the hierarchical multiview graph contrastive learning module stands out for its ability to align different granularities of data, leading to substantial improvements in model accuracy. Moreover, the sample generator, which leverages the extensive knowledge base of large language models, is particularly effective in generating high-quality and diverse samples, especially evident in the smaller RumorEval dataset. This capability allows the framework to excel even when the available fake news samples are limited, highlighting its potential for real-world applications in combating misinformation. Despite its strong performance, FHGraph may face challenges in handling out-of-distribution (OOD) samples. To address these limitations, future research could explore enhancing FHGraph’s capabilities for detecting OOD samples, extending FHGraph to cross-domain news detection, accommodating diverse cultural and linguistic contexts, could further broaden its applicability and utility in combating misinformation on a global scale.
Acknowledgement: The authors would like to thank the editor-in-chief, the editor, and the reviewers for their valuable comments and suggestions.
Funding Statement: This work is supported by the National Key R&D Program of China (Grant No. 2022YFB3104601) and the Big Data Computing Center of Southeast University.
Author Contributions: Study conception and design: Yuanqing Li, Mengyao Dai; data collection: Mengyao Dai; analysis and interpretation of results: Mengyao Dai, Yuanqing Li, Sanfeng Zhang; draft manuscript preparation: Mengyao Dai, Yuanqing Li; supervision: Sanfeng Zhang; funding acquisition: Yuanqing Li. All authors reviewed the results and approved the final version of the manuscript.
Availability of Data and Materials: The authors confirm that the data supporting the findings of this study are derived from publicly available datasets, which have been acknowledged within the article.
Ethics Approval: Not applicable.
Conflicts of Interest: The authors declare no conflicts of interest to report regarding the present study.
References
1. Fisher M, Cox JW, Hermann P. Pizzagate: from rumor, to hashtag, to gunfire in DC. Washington Post. 2016;6:8410–5. [Google Scholar]
2. Hirst M. Towards a political economy of fake news. Politi Econ Commun. 2017;5(2):82–94. [Google Scholar]
3. Apuke OD, Omar B. Fake news and COVID-19: modelling the predictors of fake news sharing among social media users. Telematics Inform. 2021;56(2):101475. doi:10.1016/j.tele.2020.101475. [Google Scholar] [PubMed] [CrossRef]
4. Li Z, Liu F, Yang W, Peng S, Zhou J. A survey of convolutional neural networks: analysis, applications, and prospects. IEEE Trans Neural Netw Learn Syst. 2021;33(12):6999–7019. doi:10.1109/TNNLS.2021.3084827. [Google Scholar] [PubMed] [CrossRef]
5. Devlin J. Bert: pre-training of deep bidirectional transformers for language understanding. arXiv:181004805. 2018. [Google Scholar]
6. Zhou X, Zafarani R. A survey of fake news: fundamental theories, detection methods, and opportunities. ACM Comput Surv. 2020;53(5):1–40. doi:10.1145/3395046. [Google Scholar] [CrossRef]
7. Li J, Sujana Y, Kao HY. Exploiting microblog conversation structures to detect rumors. In: Proceedings of the 28th International Conference on Computational Linguistics; 2020; Praha, Czech Republic. p. 5420–9. [Google Scholar]
8. Bian T, Xiao X, Xu T, Zhao P, Huang W, Rong Y, et al. Rumor detection on social media with bi-directional graph convolutional networks. Proc AAAI Conf Artif Intell. 2020;34(1):549–56. doi:10.1609/aaai.v34i01.5393. [Google Scholar] [CrossRef]
9. Chen X, Zhu D, Lin D, Cao D. Rumor knowledge embedding based data augmentation for imbalanced rumor detection. Inf Sci. 2021;580(9):352–70. doi:10.1016/j.ins.2021.08.059. [Google Scholar] [CrossRef]
10. Sheng Q, Cao J, Zhang X, Li R, Wang D, Zhu Y. Zoom out and observe: news environment perception for fake news detection. arXiv:220310885. 2022. [Google Scholar]
11. Moreo A, Esuli A, Sebastiani F. Distributional random oversampling for imbalanced text classification. In: Proceedings of the 39th International ACM SIGIR Conference on Research and Development in Information Retrieval; 2016; New York, NY, USA. p. 805–8. [Google Scholar]
12. Wen J, Tang X, Lu J. An imbalanced learning method based on graph tran-smote for fraud detection. Sci Rep. 2024;14(1):16560. doi:10.1038/s41598-024-67550-4. [Google Scholar] [PubMed] [CrossRef]
13. Zhao T, Zhang X, Wang S. Graphsmote: imbalanced node classification on graphs with graph neural networks. In: Proceedings of the 14th ACM International Conference on Web Search and Data Mining; 2021; New York, NY, USA. p. 833–41. [Google Scholar]
14. Ma J, Gao W, Wong KF. Rumor detection on twitter with tree-structured recursive neural networks. In: Proceedings of the 56th Annual Meeting of the Association for Computational Linguistics (ACL 2018); 2018; Melbourne, Australia: Association for Computational Linguistics. [Google Scholar]
15. Han X, Jiang Z, Liu N, Hu X. G-mixup: graph data augmentation for graph classification. In: International Conference on Machine Learning; 2022; New York, NY, USA: PMLR. p. 8230–48. [Google Scholar]
16. Sun T, Qian Z, Dong S, Li P, Zhu Q. Rumor detection on social media with graph adversarial contrastive learning. In: Proceedings of the ACM Web Conference 2022; 2022; New York, NY, USA. p. 2789–97. [Google Scholar]
17. Wang Y, Zhao Y, Shah N, Derr T. Imbalanced graph classification via graph-of-graph neural networks. In: Proceedings of the 31st ACM International Conference on Information & Knowledge Management; 2022; New York, NY, USA. p. 2067–76. [Google Scholar]
18. Evdaimon I, Nikolentzos G, Chatzianastasis M, Abdine H, Vazirgiannis M. Neural graph generator: feature-conditioned graph generation using latent diffusion models. arXiv:240301535. 2024. [Google Scholar]
19. Ajao O, Bhowmik D, Zargari S. Sentiment aware fake news detection on online social networks. In: ICASSP 2019-2019 IEEE International Conference on Acoustics, Speech and Signal Processing (ICASSP); 2019; New York, NY, USA: IEEE. p. 2507–11. [Google Scholar]
20. Luvembe AM, Li W, Li S, Liu F, Xu G. Dual emotion based fake news detection: a deep attention-weight update approach. Inform Process Manag. 2023;60(4):103354. doi:10.1016/j.ipm.2023.103354. [Google Scholar] [CrossRef]
21. Zhu Y, Sheng Q, Cao J, Li S, Wang D, Zhuang F. Generalizing to the future: mitigating entity bias in fake news detection. In: Proceedings of the 45th International ACM SIGIR Conference on Research and Development in Information Retrieval; 2022; New York, NY, USA. p. 2120–5. [Google Scholar]
22. He Z, Li C, Zhou F, Yang Y. Rumor detection on social media with event augmentations. In: Proceedings of the 44th International ACM SIGIR Conference on Research and Development in Information Retrieval; 2021; New York, NY, USA. p. 2020–4. [Google Scholar]
23. Yin S, Zhu P, Wu L, Gao C, Wang Z. GAMC: an unsupervised method for fake news detection using graph autoencoder with masking. Proc AAAI Conf Artif Intell. 2024;38(1):347–55. doi:10.1609/aaai.v38i1.27788. [Google Scholar] [CrossRef]
24. Fang L, Feng K, Zhao K, Hu A, Li T. Unsupervised rumor detection based on propagation tree VAE. IEEE Trans Knowl Data Eng. 2023;35(10):10309–23. doi:10.1109/TKDE.2023.3267821. [Google Scholar] [CrossRef]
25. Che H, Pan B, Leung MF, Cao Y, Yan Z. Tensor factorization with sparse and graph regularization for fake news detection on social networks. IEEE Trans Comput Soc Syst. 2023;11(4):4888–98. [Google Scholar]
26. Xu W, Wang P, Zhao Z, Wang B, Wang X, Wang Y. When imbalance meets imbalance: structure-driven learning for imbalanced graph classification. In: Proceedings of the ACM on Web Conference 2024; 2024; New York, NY, USA. p. 905–13. [Google Scholar]
27. Lu YW, Chen CY, Li CT. Dual graph networks with synthetic oversampling for imbalanced rumor detection on social media. In: Companion Proceedings of the ACM on Web Conference 2024; 2024; New York, NY, USA. p. 750–3. [Google Scholar]
28. You Y, Chen T, Sui Y, Chen T, Wang Z, Shen Y. Graph contrastive learning with augmentations. Adv Neural Inf Process Syst. 2020;33:5812–23. [Google Scholar]
29. Luo X, Ju W, Gu Y, Mao Z, Liu L, Yuan Y, et al. Self-supervised graph-level representation learning with adversarial contrastive learning. ACM Trans Knowl Discov Data. 2023;18(2):1–23. doi:10.1145/362401. [Google Scholar] [CrossRef]
30. Liang H, Du X, Zhu B, Ma Z, Chen K, Gao J. Graph contrastive learning with implicit augmentations. Neural Netw. 2023;163(518):156–64. doi:10.1016/j.neunet.2023.04.001. [Google Scholar] [PubMed] [CrossRef]
31. Li S, Li W, Luvembe AM, Tong W. Graph contrastive learning with feature augmentation for rumor detection. IEEE Trans Comput Soc Syst. 2023;11(4):5158–67. [Google Scholar]
32. Zubiaga A, Liakata M, Procter R. Exploiting context for rumour detection in social media. In: Social Informatics: 9th International Conference, SocInfo 2017; 2017 Sep 13–15; Oxford, UK: Springer; 2017. p. 109–23. [Google Scholar]
33. Derczynski L, Bontcheva K, Liakata M, Procter R, Hoi GWS, Zubiaga A. SemEval-2017 Task 8: RumourEval: determining rumour veracity and support for rumours. arXiv:170405972. 2017. [Google Scholar]
34. Enayet O, El-Beltagy SR. NileTMRG at SemEval-2017 task 8: determining rumour and veracity support for rumours on Twitter. In: Proceedings of the 11th International Workshop on Semantic Evaluation (SemEval-2017); 2017; Kerrville, TX, USA. p. 470–74. [Google Scholar]
35. Chen YC, Liu ZY, Kao HY. Ikm at semeval-2017 task 8: convolutional neural networks for stance detection and rumor verification. In: Proceedings of the 11th International Workshop on Semantic Evaluation (SemEval-2017); 2017; Kerrville, TX, USA. p. 465–69. [Google Scholar]
36. Wei L, Hu D, Zhou W, Yue Z, Hu S. Towards propagation uncertainty: edge-enhanced bayesian graph convolutional networks for rumor detection. arXiv:210711934. 2021. [Google Scholar]
Cite This Article
 Copyright © 2025 The Author(s). Published by Tech Science Press.
This work is licensed under a Creative Commons Attribution 4.0 International License , which permits unrestricted use, distribution, and reproduction in any medium, provided the original work is properly cited.
 Downloads
 Citation Tools