
 Submit a Paper
 Propose a Special lssue
 Open Access
ARTICLE

Target Detection-Oriented RGCN Inference Enhancement Method
1 School of Internet of Things Engineering, Wuxi University, Wuxi, 214105, China
2 College of Computer Science and Engineering, Changchun University of Technology, Changchun, 130012, China
3 Computer Science and Technology at Guohao Academy, Tongji University, Shanghai, 200092, China
4 China North Vehicle Research Institute, Beijing, 100072, China
* Corresponding Author: Yutong Jiang. Email:
(This article belongs to the Special Issue: Novel Methods for Image Classification, Object Detection, and Segmentation)
Computers, Materials & Continua 2025, 83(1), 1219-1237. https://doi.org/10.32604/cmc.2025.059856
Received 18 October 2024; Accepted 21 January 2025; Issue published 26 March 2025
 View Full Text
 Download PDF
Abstract
In this paper, a reasoning enhancement method based on RGCN (Relational Graph Convolutional Network) is proposed to improve the detection capability of UAV (Unmanned Aerial Vehicle) on fast-moving military targets in urban battlefield environments. By combining military images with the publicly available VisDrone2019 dataset, a new dataset called VisMilitary was built and multiple YOLO (You Only Look Once) models were tested on it. Due to the low confidence problem caused by fuzzy targets, the performance of traditional YOLO models on real battlefield images decreases significantly. Therefore, we propose an improved RGCN inference model, which improves the performance of the model in complex environments by optimizing the data processing and graph network architecture. Experimental results show that the proposed method achieves an improvement of 0.4% to 1.7% on mAP@0.50, which proves the effectiveness of the model in military target detection. The research of this paper provides a new technical path for UAV target detection in urban battlefield, and provides important enlightenment for the application of deep learning in military field.Keywords
At present, military target recognition in complex battlefield environments is a key technology for battlefield intelligence acquisition. How to accurately identify battlefield units in complex, instantaneous and changeable battlefield environments has become a research hotspot in recent years [1]. In the urban combat environment, buildings, obstacles, vegetation and facilities are ubiquitous, and the target is often difficult to detect because of maneuvering, evading, or hiding, which brings the threat of surprise attack. These objects blur the image due to fast movement or occlusion, and although the detector can identify the object, the confidence of the detection results is often low due to insufficient feature information and high fuzziness. Such targets exist in a large number of battlefield environments, which brings great challenges to target detection.
This paper aims to improve the recognition of military targets in the battlefield environment, especially in the complex urban battlefield. Based on the current research methods of reasoning through semantic relations between objects in the field of visual reasoning, we notice that in the battlefield combat environment, various objects are not only visually related but also closely related in their spatial positions and functions.
Aiming at this characteristic, we propose an integrated model that combines knowledge inference and object detection. First, we build a graph based on the results of YOLO (You Only Look Once) object detection, where the detected objects act as nodes in the graph and the position relationships between objects act as edges between nodes. Next, we recalculate and assign a suitable confidence for each fuzzy object, storing it in the graph structure as an additional property of the node. Then, we input this graph into the modified graph neural network RGCN (Relational Graph Convolutional Network) [2] and focus on the fuzzy target processing, so that the graph neural network RGCN can learn the relationship between the fuzzy object and other objects and their appropriate confidence levels. Finally, through this process, we can recalculate the confidence of the fuzzy target, thus improving the accuracy of the detection results.
Our approach introduces key innovations:
Combining Knowledge Reasoning with Object Detection: We propose a method that integrates knowledge reasoning and object detection using a Graph Neural Network (RGCN), addressing ambiguous targets by incorporating both visual features and spatial-functional relationships, thus improving object recognition accuracy.
Graph Structure from YOLO Detection: We design a graph structure based on YOLO detection results, treating detected objects as nodes and their spatial relationships as edges. This structure leverages semantic and spatial connections, improving confidence calculation and resolving ambiguity in complex battlefield environments.
Creation of the VisMilitary Dataset: We combined military images with the VisDrone2019 dataset to create VisMilitary, a dataset aimed at improving drone-based object detection in urban battlefield settings, providing a more realistic foundation for research.
Traditional target recognition technology has low recognition accuracy, cumbersome calculations, and may produce multiple recognition results, which is extremely dangerous for military target recognition. Currently, deep learning-based target detection algorithms can be categorized into two types. The first type includes two-stage algorithms that rely on candidate regions, such as Faster R-CNN (Regions with Convolutional Neural Networks) and R-CNN. These algorithms offer high accuracy but suffer from slower detection speeds due to the intensive computation required. The second type consists of one-stage algorithms based on regression, such as SSD (Single Shot MultiBox Detector) and the YOLO series. While these algorithms may not achieve the same level of accuracy as the two-stage ones, they excel in faster detection speeds. In military target recognition, which demands high real-time performance, the two-stage algorithms struggle to meet the required speed. As a result, one-stage detection algorithms have gained popularity among researchers in this field, thanks to their faster detection capabilities, making them widely applied in military target recognition tasks.
Reference [3] proposes the YOLO-G2S algorithm, which replaces the 2nd to 4th C3 modules in YOLOv5’s backbone with C3G2 modules, achieving lightweight performance for small target detection in military identification. Reference [4] introduces the DET-YOLO (Detection YOLO) algorithm based on YOLOv8, replacing the C2f component with a new feature extraction module (C2f_DEF) and embedding a DAT (Detection Attention) module to improve military aircraft detection accuracy. Reference [5] presents a target recognition algorithm for hyperspectral images, adding 5 anchor boxes per grid and incorporating a BN layer and residual network to accelerate convergence and prevent degradation. Reference [6] proposes a real-time detection method for CCTV (closed-circuit television) autonomous weapons using YOLOv4 with an SCSP-ResNet (Spatial Cross Stage Partial-ResNet) backbone, a receptive field enhancement module, and a combination of synthetic and real-world datasets to improve detection performance. There has also been a lot of research on YOLO for military target recognition [7–10].
Although a series of improvements in the YOLO series network, such as lightweight feature extraction network, loss function optimization, and model structure redesign, have achieved better detection accuracy and speed, they still face great challenges when dealing with fuzzy targets, low-quality images, or targets in complex backgrounds. This is mainly because the existing networks often fail to fully consider the spatial relationship and context information between targets when they rely solely on visual information for target recognition, especially in dynamic complex environments such as battlefield and visual signal interference. To solve this problem, simply improving the network structure often has limited effect. If the association between the context information in the image and the target can be modeled at a deeper level, combined with the understanding of the timing information and the scene background, it may be able to better deal with problems such as ambiguity and occlusion, and improve the performance of target recognition in complex environments.
2.2 Research on Visual Reasoning
In current research, detecting objects in images is usually considered an independent task, but images contain rich contextual information, and ignoring the semantic relationship between objects will inevitably be inherently limited. Detectors cannot use local and global relationships of objects for reasoning like humans do. Therefore, it is necessary to improve the ability of target detectors by simulating human recognition and reasoning processes [11].
Reference [12] introduced a global and local attention mechanism (GAL) for combining local feature analysis with a global context. Reference [13] proposed a contextual dependence mining network (CDMN) for low-cost feature construction. Reference [14] added an extra shallow feature (ESF) mapping to enhance context. There are also many studies that improve the model’s ability to aggregate information by adding context-aware modules [15–17]. In visual reasoning, many integrate human prior knowledge with target detection, enabling better reasoning. Reference [18] proposed a framework integrating knowledge graphs to optimize semantic consistency, while reference [19] used WordNet for semantic mapping. Reference [20] uses the transformer’s End to End target detection (DETR) as the basic model and enhances it with an expanded encoder module to obtain multi-scale characteristics of the target. Reference [21] constructs a corpus of textual descriptions and builds graph structures between regions to learn key spatial and semantic relationships. It then introduces a joint relation reasoning module that enhances the reliability of small-lens target features by focusing on the influence of different relations. This end-to-end method learns relationships from common sense knowledge, enabling the detector to reason about all categories. References [22,23] point out that in object detection tasks, convolutional neural networks mainly focus on feature extraction and fail to fully explore high-level relationships between objects. To solve this problem, the researchers designed a graph-based relational-perception network, which significantly improves the performance of baseline detectors and highlights the important role of graph networks in visual reasoning.
Most of the current research on visual reasoning tasks uses two-stage detectors because two-stage detectors separate category and frame predictions in order to combine context and common sense in the middle of the detection and recognition process. In contrast, single-stage detectors combine classification and regression, limiting similar enhancements. Given the speed advantage of the YOLO series in military target recognition, this paper focuses on improving YOLO to leverage its efficiency while enhancing detection accuracy. Reference [24] proved that changing the detection confidence can bring performance gains to the unipolar target detector. For this reason, we think that after the detector has recognized the picture, we can continue to reason according to the results given by the detector and get a final more accurate result.
The deep learning framework that integrates graph neural networks with YOLO, as depicted in Fig. 1, includes three components: the YOLO object detection module, the data processing module, and the heterogeneous graph network reasoning module. Our objective is to further enhance this system by focusing on the design and optimization of the latter two modules.

Figure 1: Overall framework flowchart of this article
After obtaining data through object detection, which includes the target categories, coordinates, and confidence levels, we need to organize this information to build a training dataset for a heterogeneous graph neural network. In the heterogeneous graph neural network, we treat these targets as nodes in the graph, and the edges between nodes are defined based on spatial or logical relationships between the targets. This structured dataset will be used in the training process to enable the model to learn and predict the corresponding attributes for new data.
We first assign a unique identifier to each detected object, with the number number in Fig. 2 (1) starting at 1. Targets are then classified according to initial confidence: targets whose confidence exceeds the confidence threshold are marked as “trusted” and confirmed (such as targets numbered 1 through 4), and targets whose confidence falls between the confidence threshold and the fuzzy threshold are marked as “fuzzy” and require further processing (such as targets numbered 5 through 11). Objects with a confidence level below the fuzzy threshold are excluded (for example, the object numbered 12, which we removed). For fuzzy targets, we calculate the Intersection over Union (IoU) between the detected boundary box and the actual target box to evaluate their accuracy, as shown in Fig. 2 (2). Next, we create a node file ours.content that includes the unique identifier for each object, the predicted category, the initial confidence (if available), and the true confidence value. The relationship between objects is determined by their class and spatial proximity. These relationships are classified as “overlapping,” “near,” or “far,” based on the distance between an object’s bounding box overlap or center points. For example, if the central point distance between a “person” and a “car” is less than a defined multiple of the person’s width, they are considered “close.” Multiple adjustments based on the size and type of the object ensure consistent relational classification at different image scales. Finally, we generate an edge file ours.cites that records the relationships between the objects, including their unique identifiers and relationship types. Only “overlap” and “proximity” relations are considered, and “far” relations are excluded from the construction of the graph, as in (4) “far” is excluded.

Figure 2: Overall framework flowchart of this article
By following a series of precise processing steps, we can efficiently extract meaningful information from the original object detection data. The heterogeneous graph neural network starts by loading the ours.content file, where each object is represented as an individual node. The attributes of each node include the object’s unique ID, its predicted category, initial confidence score, and a possible true confidence value. The network then reads the ours.cites file, which contains edge information based on the spatial relationships between objects. These edges are defined by the IDs of the object nodes, specifying which nodes (objects) are connected and the type of relationship between them, such as intersection, proximity, or distance. Through this process, the heterogeneous graph neural network constructs a comprehensive graph, where nodes represent detected objects and edges represent spatial relationships. During the prediction phase, the data is processed in a manner similar to training, with the exception that we do not compute the true confidence. Instead, the network is relied upon to infer and output this value, allowing for the evaluation of the prediction’s accuracy and reliability.
3.2 Change the Heterogeneous Graph Neural Network RGCN
RGCN is a variation of graph neural networks (GNN) specifically designed to handle graph data with multiple types of relationships.
Relational Graph Convolutional Networks. RGCN represents a directed multigraph as
RGCN is mainly to extend the GCN that can only operate in the local graph neighborhood to large-scale relational data. It can be understood as a special case of a simple differentiable messaging framework.
where
The propagation model of the forward update of RGCN is as follows:
where
Intuitively, Formula (3) summarizes the transform eigenvectors of neighbor nodes by means of normalized summation. Choosing the linear transformation form A, which depends only on the neighbor nodes, brings important computational advantages: First, RGCN does not need to store edge-based intermediate representations, which saves a lot of memory; Second, this enables RGCN to implement Formula (3) in a vectorized way by efficient sparse-dense matrix multiplication with a time complexity of B. Unlike regular GCN, RGCN introduces relationship-specific transformations that depend on the type and orientation of the edge. To ensure that the representation of nodes at layer C can be affected by the corresponding representation at layer D, RGCN adds a special type of self-connected edge to each node.
Regularization. The core problem of applying RGCN forward propagation formula to multi-relational data is that with the rapid increase of the number of relations and parameters in the graph, overfitting is caused on rare relations or very large models. For this purpose, RGCN introduces two separate methods to regularize the weights of each layer of RGCN, namely the basis decomposition method and the block diagonal decomposition method. Through the basis decomposition method, each
In the block-diagonal decomposition method, for block-diagonal matrices, RGCN lets each
Therefore,
The basis function decomposition can be seen as an efficient method of weight sharing across different relation types, while the block decomposition acts as a sparsity constraint on the weight matrix for each relation pair. Both approaches help reduce the number of parameters required to learn complex, multi-relational data, such as a realistic knowledge base.
Data processing. Since the node classification task is different from the regression task, we have made corresponding adjustments in the input data processing and loss function selection of the model. For the node classification task, the cross entropy loss function is usually used, and the label form of single thermal coding is adopted. For the regression task, where continuous values need to be predicted, we selected the mean square error (MSE) loss function to quantify the discrepancy between the predicted and actual values. At the conclusion of each training cycle, we assess the model’s performance and store the current model state along with the node data. This ensures that the best-performing model is available for predictions after training, maintaining both accuracy and stability in real-world applications. In terms of data reading, we pre-processed the raw data appropriately to make it more suitable for regression tasks. Specifically, we load a dataset containing node characteristics (such as initial confidence) and true confidence and transform it into a format suitable for the model input. In addition, we have introduced a masking mechanism into the model to ensure that only the initial confidence of those fuzzy targets is calculated during training.
Neighbor aggregation. In the process of neighbor aggregation, we adopt the aggregation method in RGCN. However, unlike traditional node classification tasks, the goal of our regression task is to predict a continuous value, so the node type is not something we want to predict directly. On this basis, we do not do a single thermal coding process on the node types, but use them as auxiliary information to help build the structure of the graph and as one of the input features. In the neighbor aggregation step, we mainly pass the “initial confidence” attribute, because the main purpose of the model is to predict the “true confidence” based on the initial confidence of the nodes in the graph and the relationship between them. The neighbor aggregation step in RGCN uses a list of all relational adjacency matrices, which we change to a dictionary. Each label corresponds to an adjacency matrix of a set of relationships. This way, each label has a specific set of adjacency matrices, providing a more flexible way to store adjacency matrices. This means that for different tags, the operation of neighbor aggregation will be different depending on the tag.
Feature projection. The feature projection is carried out through the weight matrix. The weight matrix for each relation transforms linearly to the input features. Our changed model continues to use the weight matrix for feature projection, but now each label has an independent set of weight matrices, and for each label, the corresponding weight matrix is used for projection operations. As a result, feature projection becomes more flexible in the modified code because each label has its own projection matrix, and different feature projection modes can be learned for each label.
Semantic fusion. In the original RGCN, the aggregate results of all relationships are directly added, meaning that the outputs of different relationships are fused by addition. At this point, for each relation
• For each label, the aggregate result of each relationship (
• The final feature is not just a sum of relations, the modified code will also add the input feature
To ease the computation, we reduced the number of label categories and relationship types to three each. Regularization techniques are often used to prevent overfitting or computationally complex models when there are too many labels or relation categories. Since we have reduced the amount of computation in this task by reducing the number of classes, regularization techniques are no longer used. Fig. 3 shows the convolution operation of our changed RGCN. Edges are aggregated according to different types and orientations. Different types of edges share different weights.

Figure 3: The changed RGCN network model
With these changes, our model not only performs better on regression tasks, but also better captures the complex relationships between nodes and their neighbors, thereby improving prediction accuracy and model generalization ability.
4.1 Dataset and Experimental Settings
Public data set VisDrone2019. The VisDrone2019 dataset, collected by AISKYEYE’s team at Tianjin University’s Machine Learning and Data Mining Lab, contains a wide range of objects in urban and rural road traffic scenes captured by drones. It includes categories such as pedestrians, cars, bicycles, and other objects, with a significant number of small objects. This dataset is commonly used in experiments aimed at improving the detection of small targets and covers many urban scenes, making it highly relevant to urban detection tasks. However, VisDrone2019 has limitations in terms of its focus on road traffic and non-military objects, and the scale of its targets, particularly small objects, may not fully align with the needs of military-related applications, such as detecting fast-moving or camouflaged targets in complex environments.
Self-built dataset. In contrast, our study focuses on detecting fast-moving targets in urban battlefield environments, where the target categories include people, cars, trucks, guns, and tanks. Currently, there are no publicly available datasets specifically for military targets due to the sensitive nature of military resources. We collected 4,016 images of military assets such as fighters, guns, and combat vehicles. However, the scale of these targets does not match the small target scale typically found in drone-captured urban traffic scenes, as seen in VisDrone2019. To address this, we augmented our dataset with 2080 images randomly selected from VisDrone2019, resulting in the creation of the VisMilitary dataset.
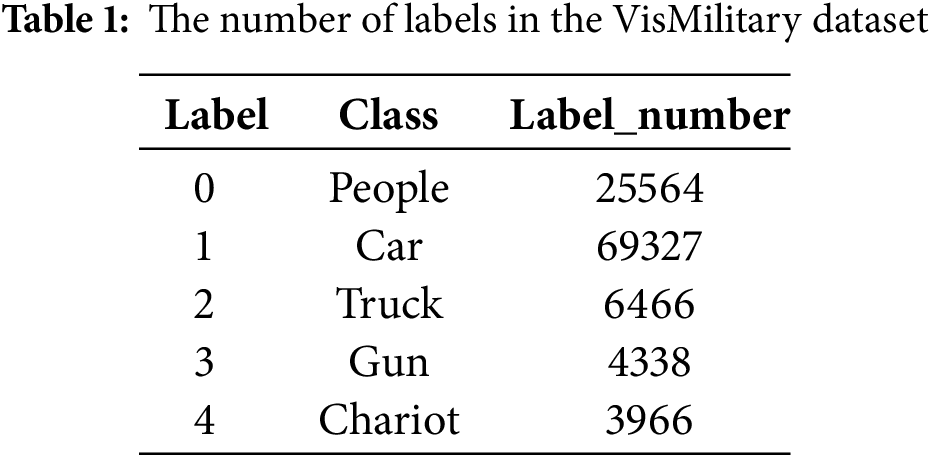
The key difference between VisDrone2019 and VisMilitary lies in the types of targets and the contexts they represent: VisDrone2019 primarily focuses on civilian road traffic, while VisMilitary includes military targets in urban battlefield settings. This difference in target types and environments affects the generalization ability of models trained exclusively on VisDrone2019, as they may struggle to adapt to military scenarios, which involve faster-moving, camouflaged, or more complex targets. By combining both datasets, our model can learn a broader range of features from different target sizes, environments, and viewing angles, improving its robustness and adaptability. This approach not only enhances the modelś ability to generalize across diverse real-world scenarios but also mitigates potential sample biases inherent in a single-source dataset. Thus, the VisMilitary dataset offers a more comprehensive and versatile training set for urban battlefield detection, boosting model performance in more dynamic and challenging environments. Table 1 presents the label categories and quantities in the dataset.
In order to more accurately replicate real-world combat environments, we sourced 506 urban images from the web, offering more authentic backgrounds and interactions compared to the VisMilitary dataset. These images, which feature higher levels of occlusion and blurring, will be used to build heterogeneous graphs for training and inference with a graph neural network, to improve model performance. A sample image is shown in Fig. 4.

Figure 4: Dataset image display
Experimental setup and evaluation metrics. The experiments are conducted in an environment with Ubuntu 20.04 server, Nvidia 3090 GPU, CUDA 11.6, utilizing the PyTorch framework with Python.
For each YOLO version, 300 iterations are run with a batch size of 8.
Evaluation metrics: The performance is measured based on accuracy, recall, average precision, frame rate, the number of parameters (in millions), and GFLOPS (giga floating-point operations).
4.2 Evaluate Self-Built Datasets Using the YOLO Model
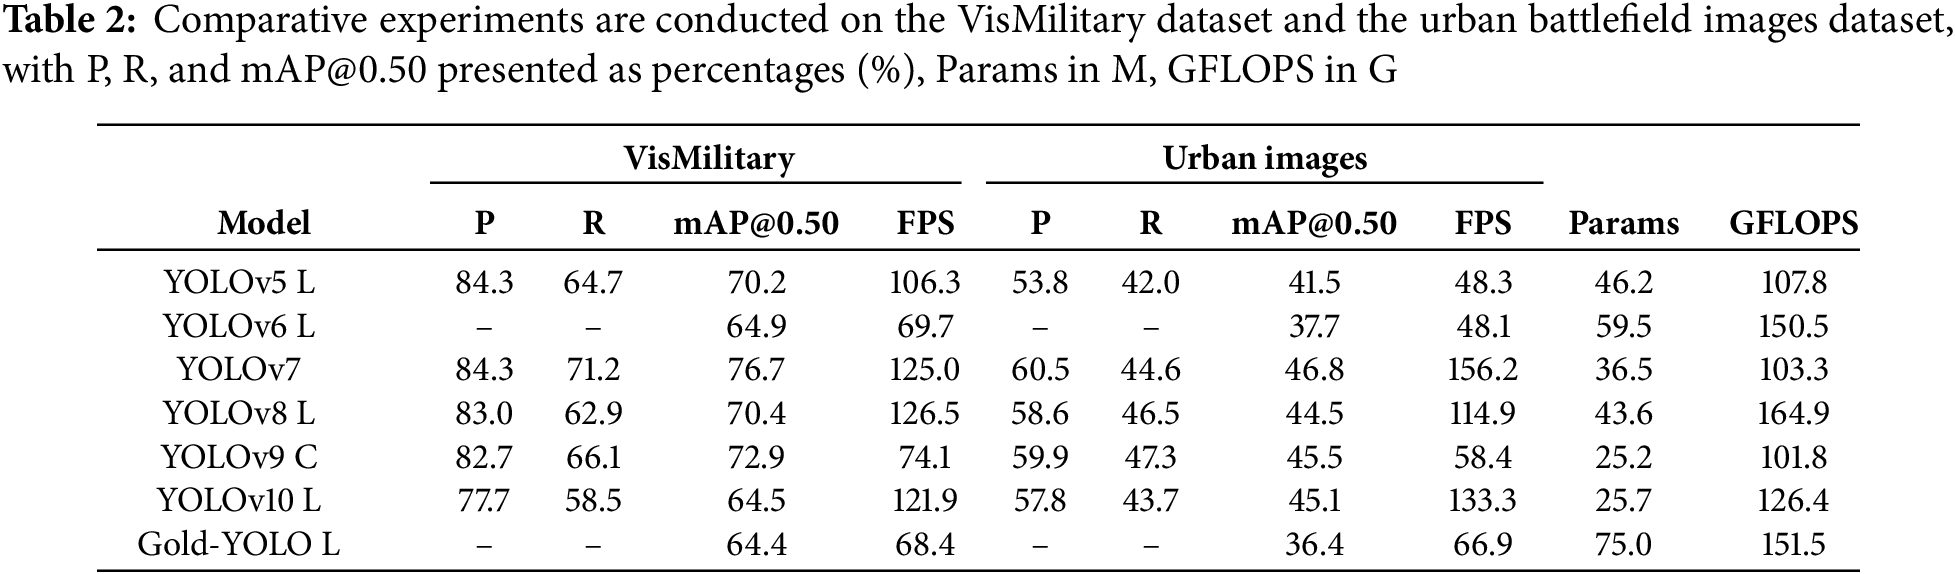
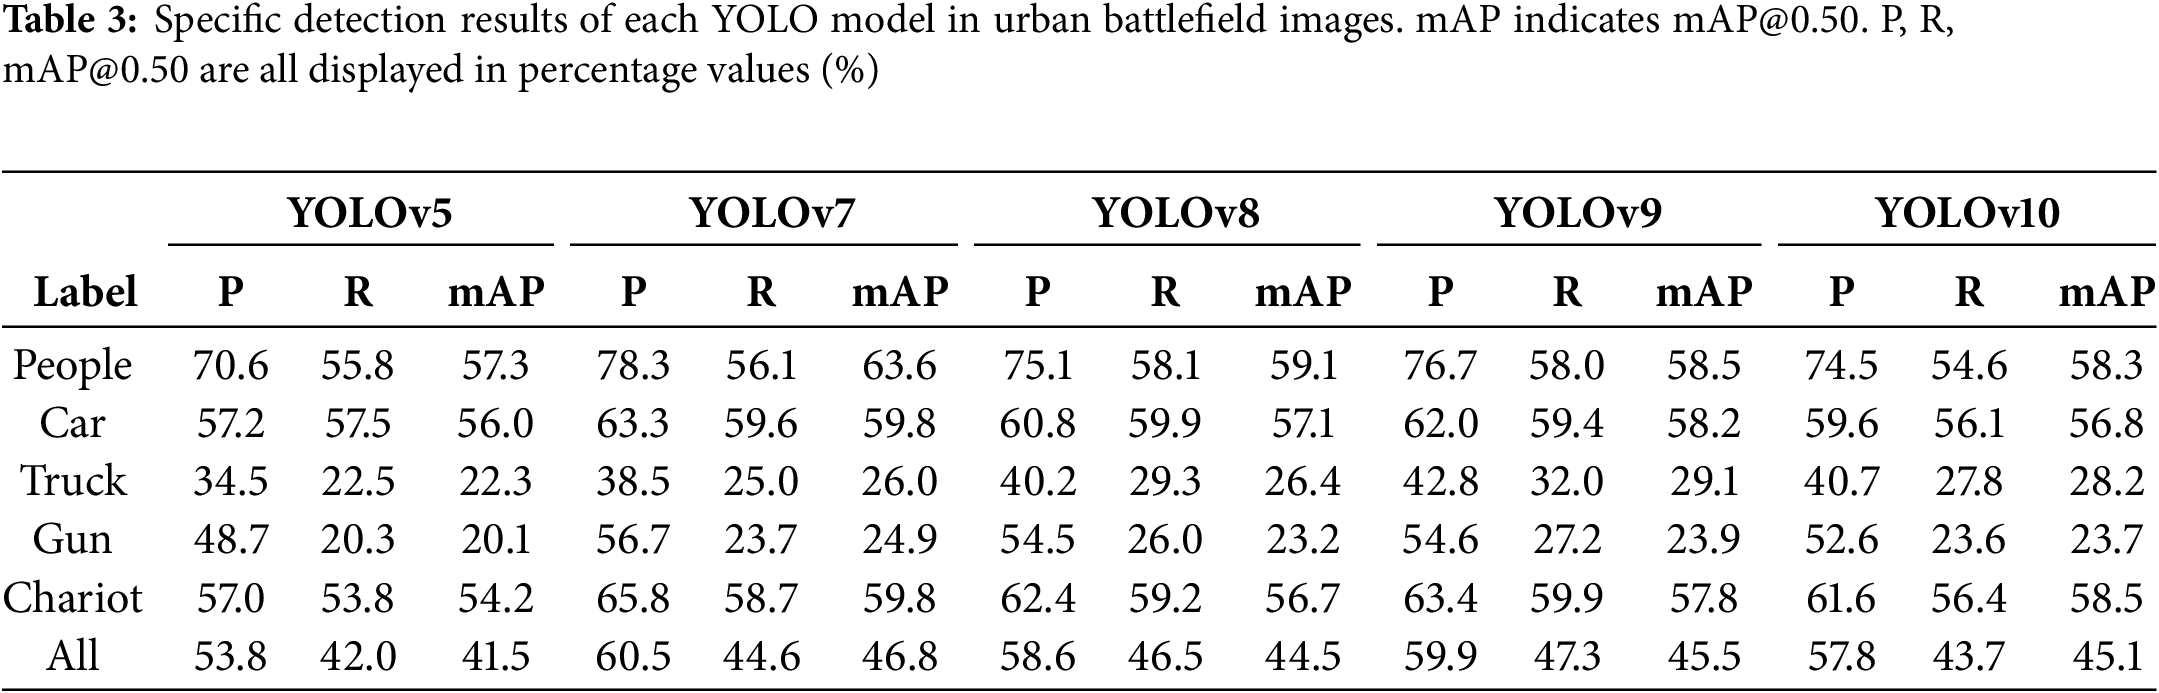
We tested several popular YOLO versions, including YOLOv5 to YOLOv10 [25] and Gold-YOLO [26], on the VisMilitary dataset, and the results are shown in Table 2. The mAP@0.50 of these models ranged from 64.4% to 76.7%, with precision generally above 77% and recall somewhat lower, with a maximum of 71.2%. Overall, the top-performing models achieved an mAP@0.50 above 70%. However, when these trained models were applied to urban battlefield images, their performance significantly dropped. As shown in Table 2, the mAP@0.50 range decreased to 36.4% to 46.8%, P dropped to 53.8% to 60.5%, and R declined to 42.0% to 47.3%. We have removed the YOLOv6 model and Gold-YOLO model with the worst performance, and Table 3 shows the detailed detection results of each label category when the remaining 5 models are tested on urban battlefield images. Detection of “truck” and “gun” showed particularly poor performance, with very low recall rates across all models. These comparative results indicate that although the models performed well on the VisMilitary dataset, they struggle with blurred targets in urban battlefield images due to target ambiguity and environmental interference.
4.3 Data Processing Experiment
In Table 2, we observed that the detection accuracy and recall were suboptimal due to target ambiguity. To address this, we performed a series of experiments focused on fine-tuning parameters, with the aim of refining the confidence score using only the predicted bounding box coordinates and the initial confidence value. Our objective is to recalibrate the confidence scores to more appropriate levels, ensuring that subsequent reasoning on heterogeneous graphs is based on more accurate target values, thus enhancing the overall performance of the detection system.
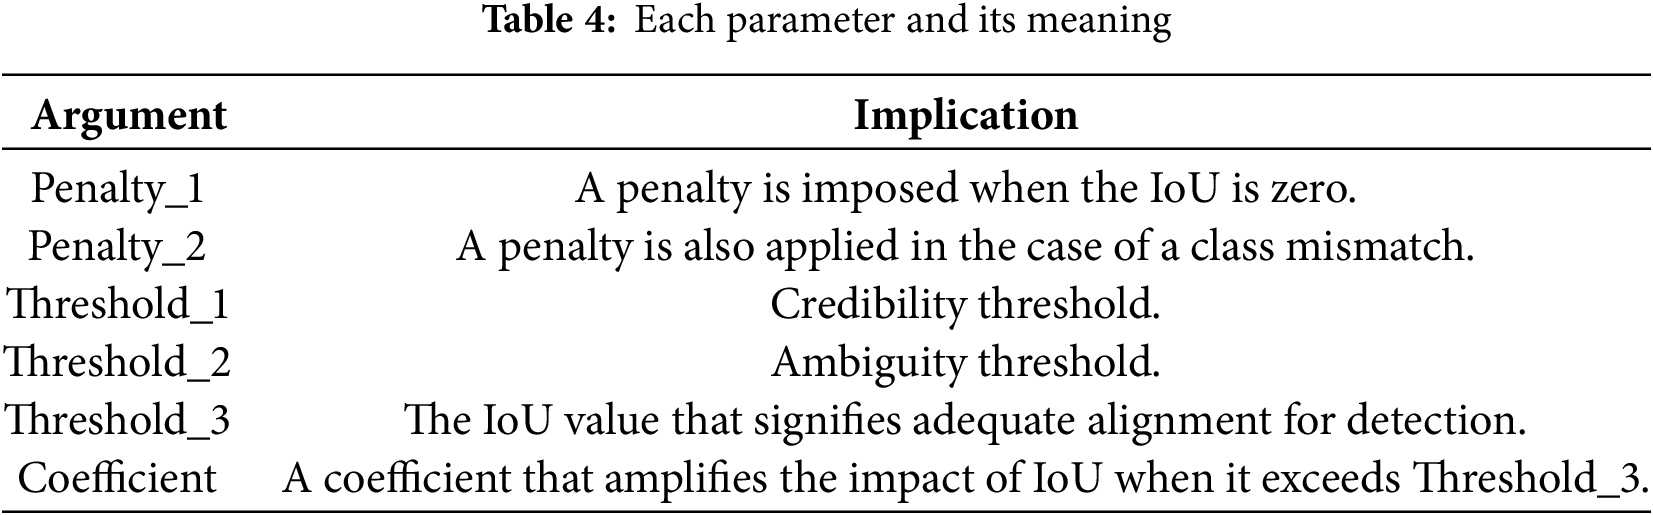
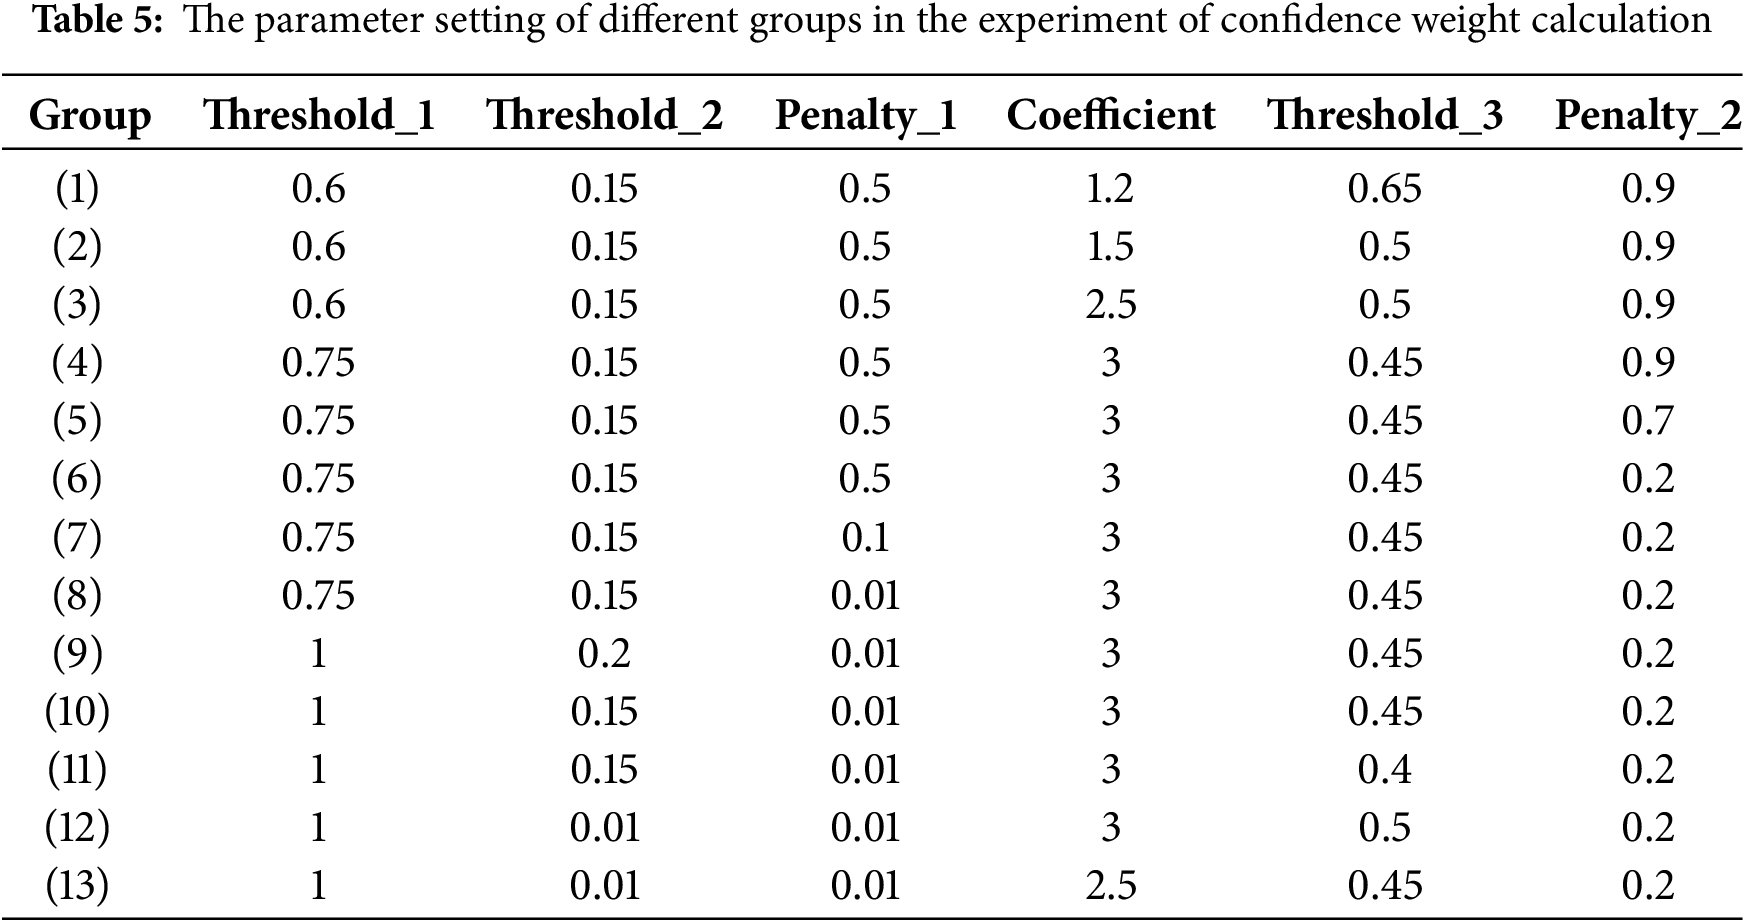
The parameters we set and their meanings are shown in Table 4. Table 5 shows the groups with different parameter configurations, numbered from (1) to (13). The configuration of these parameters is obtained by experiment. Table 6 shows the parameter values obtained from the detection results of each YOLO model, along with the improved performance. In the data from Group (8) in Table 6, we significantly improved the performance of each model by recalculating the confidence. Specifically, YOLOv5’s mAP@0.50 increased from 41.5% to 46.7%, an improvement of 5.2%; YOLOv7’s [27] mAP@0.50 increased from 46.8% to 52.3%, an improvement of 5.5%; YOLOv8’s mAP@0.50 increased from 44.5% to 50.4%, an improvement of 5.9%; YOLOv9’s [28] mAP@0.50 increased from 45.5% to 54.4%, an improvement of 8.9%; and YOLOv10’s mAP@0.50 increased from 45.1% to 52.7%, an improvement of 7.6%. These results not only validate the effectiveness of the parameter settings but also confirm the preliminary feasibility and practical value of the confidence recalculation strategy.
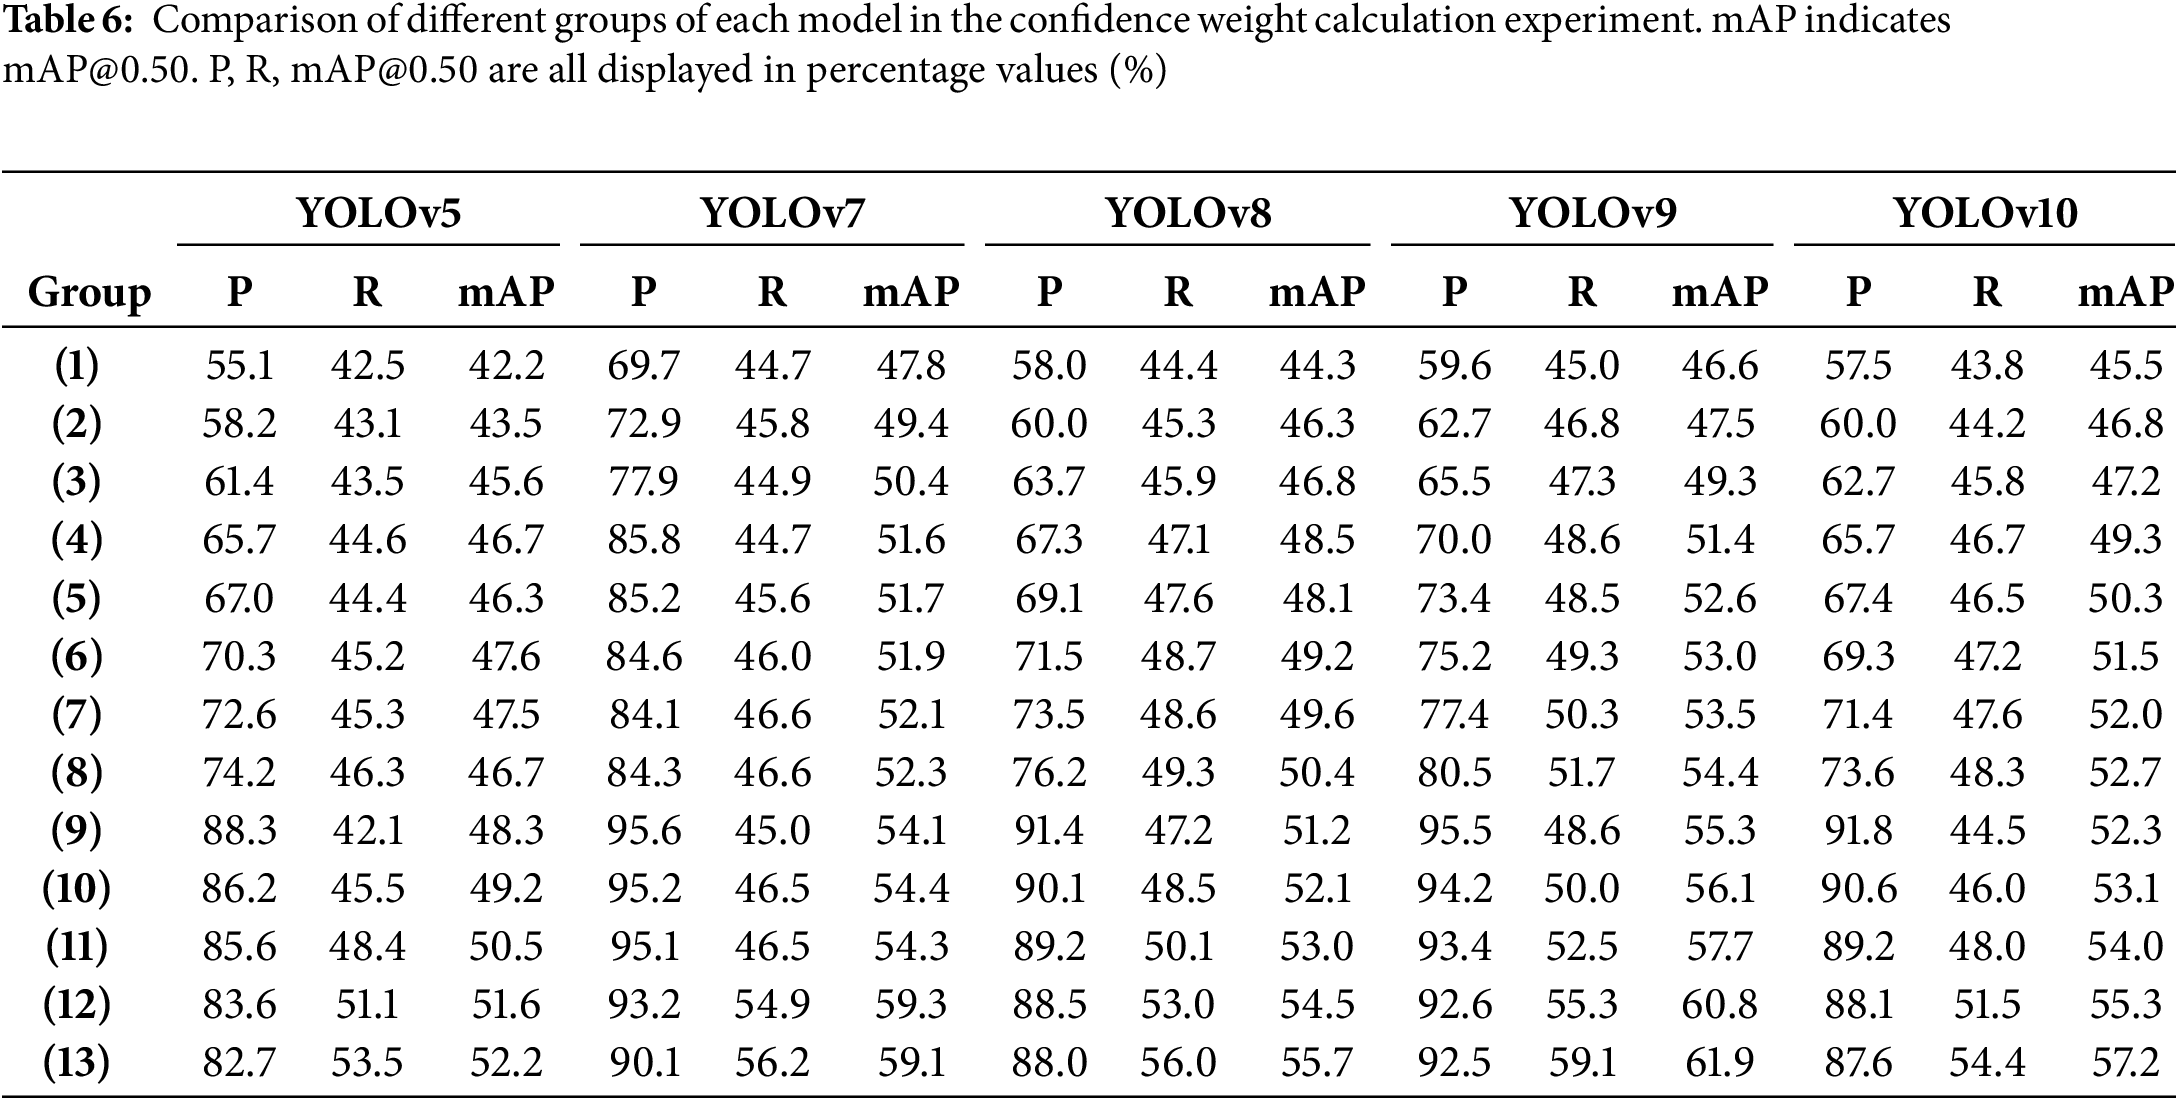
In order to further explore the potential of this method, we expanded the threshold range to 1 to 0.01, covering almost all the detection results, as shown in Group (13). Under this setting, the mAP@0.50 of each model increased by 10.7% to 16.4%. Fig. 5 shows a comparison of the YOLOv7 and YOLOv9 models before and after recalculating confidence scores. The YOLOv7 model successfully detected five “person” targets. After recalculating the confidence scores, the confidence values of 0.73 and 0.60 for the “people” targets were adjusted to 0.99 and 0.82, respectively, because the detection boxes were relatively accurate and the classification was correct. Compared to YOLOv7, YOLOv9 successfully detected three additional “person” targets and one “gun” target, but also made an error by misclassifying a tree as a “person”. After recalculating the confidence scores, higher confidence was assigned to six relatively accurate and correctly classified “person” targets, while lower confidence was given to the misclassified “person” target. Although the “gun” target was correctly classified, its predicted bounding box was not accurate enough, so its confidence score was adjusted from 0.41 to 0.29.

Figure 5: Confidence recalculation before and after comparison chart. Detection is performed on urban battlefield images. The chart shows the detection results of the YOLOv7 and YOLOv9 models, as well as the confidence recalculation results for both models
These experimental results clearly show that, without altering the existing model architecture, optimizing the confidence can significantly enhance model performance. The effectiveness of this method is not limited to a single dataset or model, and it has wide applicability and practicality. This strategy provides an economically efficient and easily implementable approach to improving model accuracy and robustness in complex environments.
4.3.1 Heterogeneous Graph Reasoning Experiment
In the previous step, we recalculated the initial confidence of the object and obtained a more appropriate set of confidence values. These updated values are fed into the heterogeneous graph neural network and used as target values. At this time, a graph relationship consisting of clear objects and fuzzy objects is formed in the graph neural network. The graph neural network’s powerful ability to capture relationships between nodes is used to perform inference calculations on the confidence of fuzzy objects, thereby simulating the process of human inference based on the category and location relationships of objects.
We train through the training set and validation set. We compared using different activation functions and learning rates. The relationship between learning rate and loss value is shown in Fig. 6. Curve 1 declines faster at the beginning, but after reaching the lowest point, there are some fluctuations. Although the overall loss value is lower, the frequency of fluctuations is higher. Curve 2 declines more slowly in the early stages and fluctuates significantly throughout the training process, resulting in relatively poor performance. Curve 3 decreases quickly at the beginning, but fluctuates greatly throughout the training process. Curve 4 has the fastest decline at the beginning and reaches a lower loss value early on, and then has smaller fluctuations and performs best. To this end, we set the learning rate to 0.05 and used the relu loss function to test on the test set. The results of heterogeneous graph inference are shown in Table 7.

Figure 6: Learning rate and loss value relationship diagram
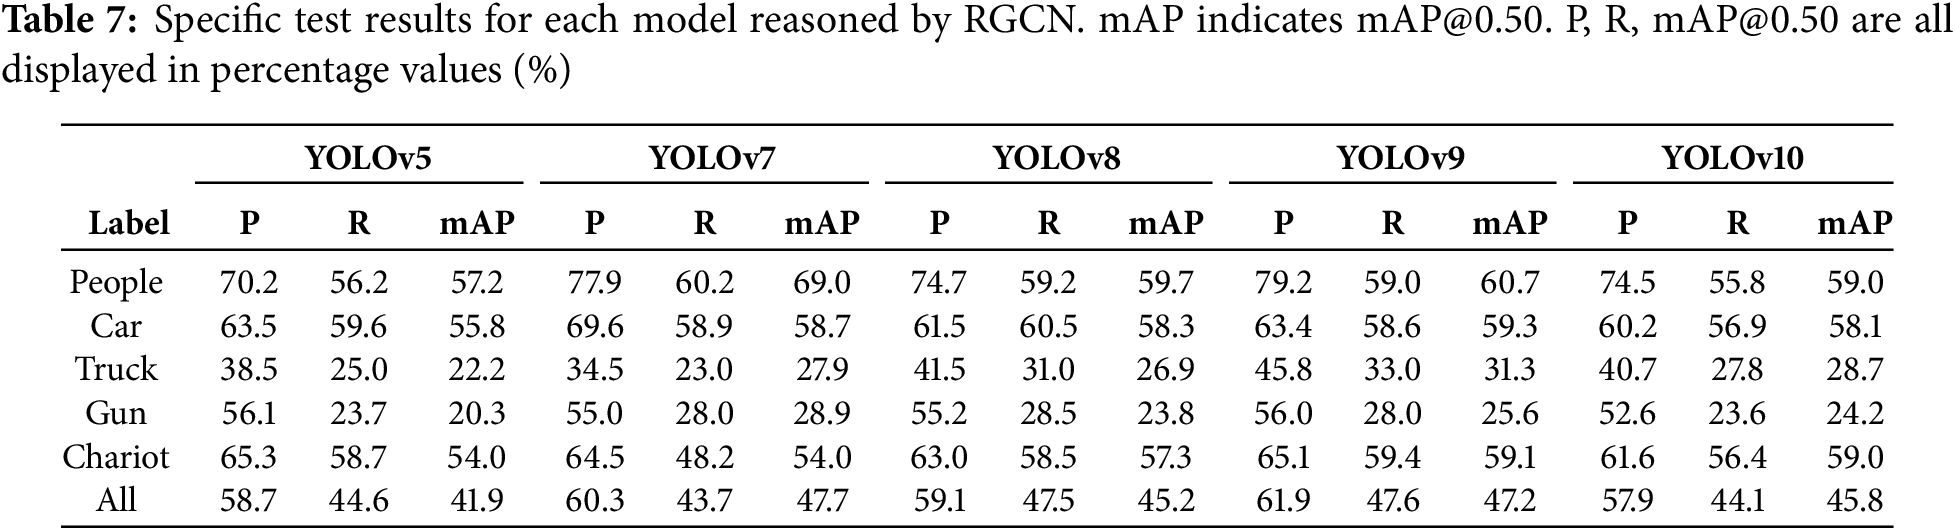
According to the data in Table 7, after inference processing by heterogeneous graph neural network, mAP@0.50 of YOLOv5 is increased by 0.4%, mAP@0.50 of YOLOv7 is increased by 0.9%, mAP@0.50 of YOLOv8 and YOLOv10 is increased by 0.7%. YOLOv9’s mAP@0.50 has seen the most significant increase, up 1.7%. Different models performed slightly differently in different categories, but overall accuracy improved significantly, especially in the ‘people’ and ‘gun’ categories. We used the YOLOv9 model with a better enhancement effect to show the comparison of our inference results in Fig. 7. In the first group of pictures, after RGCN inference, the dim and fuzzy “person” with the original confidence level of 0.16 was re-deduced to score 0.31. In the second set of pictures, the small target “person” with scores of 0.54 and 0.64 was re-deduced to 0.68 and 0.76. In the third set of pictures, the three ‘guns’ with scores of 0.29, 0.57, and 0.19 were re-deduced to score 0.41, 0.71, and 0.38. Although the inference result is not as obvious as the recalculation effect in Table 6, we can observe that the model has initially grasped the trend of target confidence adjustment, showing the potential effect and potential. We believe that reasoning through spatial location relationships can provide more contextual information and help filter out some error-detected or low-confidence objects, thereby improving accuracy. However because objects are more closely filtered, the recall rate is lower.
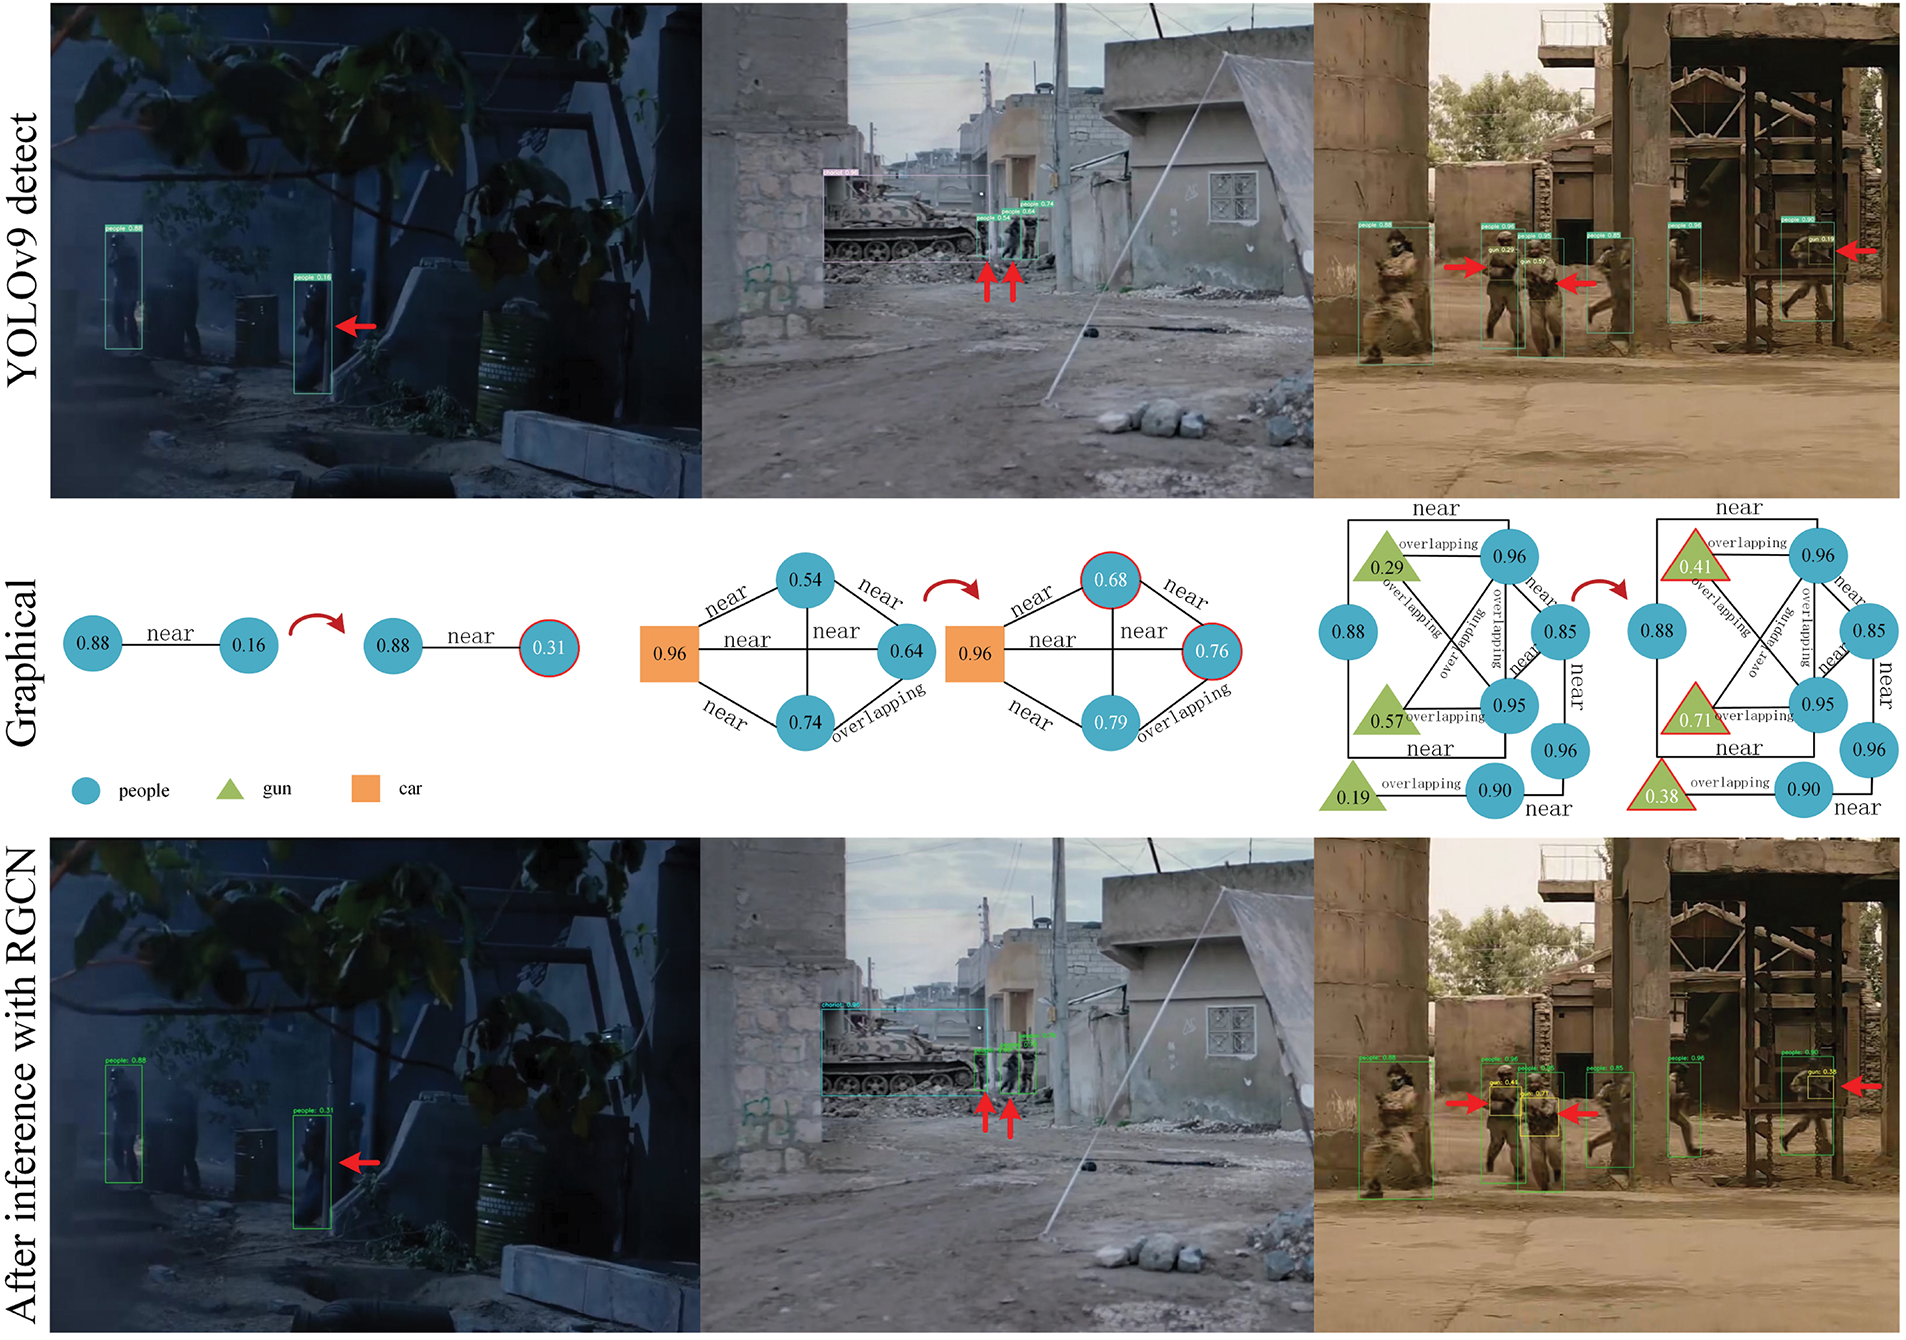
Figure 7: A comparison of the detection results on the test set of battlefield images is presented. The figure displays the inspection results of the YOLOv9 model alongside the final inference outcomes from the heterogeneous graph neural network. The graphic visualization section shows how graphics can improve the relationship between objects to improve detection results
The results show that our method can effectively filter out some false detection objects, thus improving the precision of the system and the quality of the detection results, which preliminatively proves the feasibility of our idea. Due to the small amount of data in urban battlefields, this brings some limitations to our research. In order to avoid insufficient sample quantity due to excessive node types and relationship types when inputting heterogeneous graph neural network, we combine the three categories of car, truck and chariot into one category. While this merging helps to increase the sample size, it also limits the further improvement of the model in fine-grained classification.
In addition, our model mainly performs inference through position relationships and types. Although this method is effective, its accuracy is usually not as accurate as the result calculated directly based on the relationship between the detection frame and the real frame. The currently used graph neural network is mainly designed for node classification tasks. Although we have made adaptive modifications to the network structure to support regression tasks, its ability to support such tasks is still limited in nature, which also requires further optimization and design direction.
The loss of information and data simplification during training is a key factor in the fact that a significant improvement of 5.2% to 8.9% can be achieved on the raw data at mAP@0.50, while the improvement after network training is only 0.4% to 1.7%. In the raw data processing stage, we may have used a more direct and accurate method to calibrate and optimize the target. However, during network training, especially when the amount of data is insufficient and multiple types must be combined, it is difficult for the model to fully learn all subtle changes and complex relationships. Although these limitations have caused the actual performance improvement to fail to reach the expected level, the improvements we have obtained have shown that the current model has shown good performance when processing complex urban battlefield data. Especially in terms of the model’s ability to capture complex relationships between nodes, it has been able to effectively simulate and infer the confidence of fuzzy targets, showing the effectiveness and adaptability of the model. This proves that our model design is feasible and competitive in meeting the challenges of practical application scenarios.
Our model demonstrates a certain level of capability in distinguishing false positive targets, primarily by leveraging positional relationships for recognition. However, when it comes to false negatives, particularly in cases where YOLO fails to detect an object, our model is unable to mitigate this issue. This limitation arises because our model’s performance is contingent upon the detections provided by YOLO. Therefore, a potential solution to address false negatives would be to enhance the detection ability of the YOLO model itself. Improving the robustness of YOLO in detecting objects more reliably would directly benefit the overall performance of our system and reduce the occurrence of false negatives in the detection process.
In this paper, we merge military images collected from our sources with the publicly available VisDrone2019 dataset to form a new dataset named VisMilitary, aimed at enhancing the detection task of fast-moving military targets from a drone’s perspective in urban battlefield settings. We trained and tested several popular YOLO-based models on this dataset, achieving promising results. However, when these detectors were tested on images more closely resembling real battlefield conditions, their performance sharply declined, particularly when detecting blurred objects. Upon investigation, we found that this was primarily due to the low confidence score resulting from blurred objects.
To resolve this issue, we propose an RGCN-based inference model designed specifically for object detection. Through improvements in data processing and modifications to the architecture of the heterogeneous graph neural network, we experimentally validated the feasibility of this approach and observed significant improvements. However, the limited size of the military dataset, due to the sensitivity of the data and the difficulty in obtaining urban battlefield images, may cause underfitting during training of the heterogeneous graph network, which could impact the model’s overall performance.
Although we have modified the network to better support regression tasks, its intrinsic capability to handle such tasks remains constrained. This suggests that further optimization of the model architecture and training strategies is required. We will continue to adjust and enhance the model, aiming to improve its performance in real-world applications, ensuring its reliability and robustness in unpredictable and complex real-world environments. In addition, we will conduct more cross-validation experiments to further validate and optimize the accuracy of the model. This will provide more accurate and reliable technical support for military target detection in urban battlefield environments.
In general, the research in this paper not only provides a new technical path and practical experience for UAV target detection in urban battlefield environment but also provides valuable enlightenment for deep learning application in the target detection field, especially in the military field. With the establishment of more high-quality data sets in the future and the continuous development of new technologies, we believe that this research direction will play an increasingly important role in military intelligence and UAV battlefield applications.
The use of this technology must adhere to international law and be limited to defensive purposes. Researchers and developers have a moral responsibility to prevent its misuse in aggressive or unlawful activities. Strict oversight, regulation, and transparency are crucial to avoid harm to civilians and ensure compliance with global ethical standards. It should be used only to prioritize security, peace, and the protection of life, in line with international humanitarian law.
Acknowledgement: The authors would like to thank the editors and reviewers.
Funding Statement: This work is partially supported by the National Natural Science Foundation of China (61806024, 62206257), the Jilin Province Science and Technology Development Plan Key Research and Development Project (20210204050YY), the Wuxi University Research Start-up Fund for Introduced Talents (2023r004, 2023r006), Jiangsu Engineering Research Center of Hyperconvergence Application and Security of IoT Devices, Jiangsu Foreign Expert Workshop, Wuxi City Internet of Vehicles Key Laboratory.
Author Contributions: The authors confirm contribution to the paper as follows: study conception and design: Xiaoyu Wang, Yutong Jiang; data collection: Xiaoyu Wang, Songtao Zhang, Dongming Li, Weichen Sun; analysis and interpretation of results: Lijuan Zhang, Xiaoyu Wang; draft manuscript preparation: Lijuan Zhang, Xiaoyu Wang, Yutong Jiang. All authors reviewed the results and approved the final version of the manuscript.
Availability of Data and Materials: The self-built military target detection dataset VisMilitary cannot be publicly disclosed due to data sensitivity, but all data used in this study can be obtained from the corresponding author upon reasonable request.
Ethics Approval: Not applicable.
Conflicts of Interest: The authors declare no conflicts of interest to report regarding the present study.
References
1. Wang D, Zhang J, Zheng S. Multi-source information data fusion method under complex battlefield situation. J Phy: Conf Ser. 2020;1631:012113. doi:10.1088/1742-6596/1631/1/012113. [Google Scholar] [CrossRef]
2. Schlichtkrull M, Kipf TN, Bloem P, Van Den Berg R, Titov I, Welling M. Modeling relational data with graph convolutional networks. In: The Semantic Web: 15th International Conference, ESWC 2018; 2018 Jun 3–7; Heraklion, Crete, Greece: Springer; 2018. p. 593–607. [Google Scholar]
3. Wang H, Han J. Research on military target detection method based on YOLO method. In: 2023 IEEE 3rd International Conference on Information Technology, Big Data and Artificial Intelligence (ICIBA); 2023; Chongqing, China. Vol. 3, p. 1089–93. doi:10.1109/ICIBA56860.2023.10165623 [Google Scholar] [CrossRef]
4. Chen X, Jiang H, Zheng H, Yang J, Liang R, Xiang D, et al. DET-YOLO: an innovative high-performance model for detecting military aircraft in remote sensing images. IEEE J Sel Top Appl Earth Obs Remote Sens. 2024;17:17753–71. doi:10.1109/JSTARS.2024.3462745. [Google Scholar] [CrossRef]
5. Ying J, Yin S, Yang W, Liu H, Li X. Hyperspectral image target recognition based on YOLO model. In: Zuo C, Xu J, editors. Sixth Conference on Frontiers in Optical Imaging and Technology: Imaging Detection and Target Recognition; 2024; Nanjing, China: SPIE. Vol. 13156. doi:10.1117/12.3016421. [Google Scholar] [CrossRef]
6. Wang G, Ding H, Duan M, Pu Y, Yang Z, Li H. Fighting against terrorism: a real-time CCTV autonomous weapons detection based on improved YOLO v4. Digit Signal Process. 2023;132(2):103790. doi:10.1016/j.dsp.2022.103790. [Google Scholar] [CrossRef]
7. Wang S, Du Y, Zhao S, Gan L. Multi-scale infrared military target detection based on 3X-FPN feature fusion network. IEEE Access. 2023;11(2):141585–97. doi:10.1109/ACCESS.2023.3343419. [Google Scholar] [CrossRef]
8. Kwon H, Lee S. Novel rifle number recognition based on improved YOLO in military environment. Comput Mater Contin. 2024;78(1):249–63. doi:10.32604/cmc.2023.042466. [Google Scholar] [CrossRef]
9. You Y, Wang J, Yu Z, Sun Y, Peng Y, Zhang S, et al. A fine-grained detection network model for soldier targets adopting attack action. IEEE Access. 2024;12:107445–58. doi:10.1109/ACCESS.2024.3436709. [Google Scholar] [CrossRef]
10. Ajay Kumar Goud P, Mohit Raj G, Rahul K, Vijaya Lakshmi A. Military aircraft detection using YOLOv5. In: Intelligent communication technologies and virtual mobile networks. Singapore: Springer; 2023. p. 865–78. [Google Scholar]
11. Chen S, Li Z, Tang Z. Relation R-CNN: a graph based relation-aware network for object detection. IEEE Signal Process Lett. 2020;27:1680–4. doi:10.1109/LSP.2020.3025128. [Google Scholar] [CrossRef]
12. Li Y, Zhou Z, Qi G, Hu G, Zhu Z, Huang X. Remote sensing micro-object detection under global and local attention mechanism. Remote Sens. 2024;16(4):644. doi:10.3390/rs16040644. [Google Scholar] [CrossRef]
13. Xie X, Cheng G, Rao C, Lang C, Han J. Oriented object detection via contextual dependence mining and penalty-incentive allocation. IEEE Trans Geosci Remote Sens. 2024;62:1–10. doi:10.1109/TGRS.2024.3385985. [Google Scholar] [CrossRef]
14. Xi LH, Hou JW, Ma GL, Hei YQ, Li WT. A multiscale information fusion network based on PixelShuffle integrated with YOLO for aerial remote sensing object detection. IEEE Geosci Remote Sens Lett. 2024;21:1–5. doi:10.1109/LGRS.2024.3353304. [Google Scholar] [CrossRef]
15. Ullah I, Hussain S, Shaheed K, Ali W, Khan SA, Yin Y, et al. CMGNet: context-aware middle-layer guidance network for salient object detection. J King Saud Univ-Comput Inf Sci. 2024;36(1):101838. doi:10.1016/j.jksuci.2023.101838. [Google Scholar] [CrossRef]
16. Lan Z, Zhuang F, Lin Z, Chen R, Wei L, Lai T, et al. MFO-Net: a multiscale feature optimization network for UAV image object detection. IEEE Geosci Remote Sens Lett. 2024;21:1–5. doi:10.1109/LGRS.2024.3382090. [Google Scholar] [CrossRef]
17. Lang K, Cui J, Yang M, Wang H, Wang Z, Shen H. A convolution with transformer attention module integrating local and global features for object detection in remote sensing based on YOLOv8n. Remote Sens. 2024;16(5):906. doi:10.3390/rs16050906. [Google Scholar] [CrossRef]
18. Fang Y, Kuan K, Lin J, Tan C, Chandrasekhar V. Object detection meets knowledge graphs. In: International Joint Conferences on Artificial Intelligence; Melbourne, Australia; 2017. p. 1661–7. [Google Scholar]
19. Zhang F, Fan H, Wang K, Zhao Y, Zhang X, Ma Y. Research on intelligent target recognition integrated with knowledge. IEEE Access. 2021;9:137107–15. doi:10.1109/ACCESS.2021.3116866. [Google Scholar] [CrossRef]
20. Zhang K, Lou W, Wang J, Zhou R, Guo X, Xiao Y, et al. PA-DETR: end-to-end visually indistinguishable bolt defects detection method based on transmission line knowledge reasoning. IEEE Trans Instrum Meas. 2023;72:1–14. doi:10.1109/TIM.2023.3330226. [Google Scholar] [CrossRef]
21. Zhang S, Song F, Liu X, Hao X, Liu Y, Lei T, et al. Text semantic fusion relation graph reasoning for few-shot object detection on remote sensing images. Remote Sens. 2023;15(5):1187. doi:10.3390/rs15051187. [Google Scholar] [CrossRef]
22. Li J, Tan G, Ke X, Si H, Peng Y. Object detection based on knowledge graph network. Appl Intell. 2023;53(12):15045–66. doi:10.1007/s10489-022-04116-9. [Google Scholar] [CrossRef]
23. Chen C, Li J, Zhou HY, Han X, Huang Y, Ding X, et al. Relation matters: foreground-aware graph-based relational reasoning for domain adaptive object detection. IEEE Trans Pattern Anal Mach Intell. 2022;45(3):3677–94. doi:10.1109/TPAMI.2022.3179445. [Google Scholar] [PubMed] [CrossRef]
24. Wang Z, Zhao W, Xu L. Improving object detection by enhancing the effect of localisation quality evaluation on detection confidence. IET Comput Vis. 2024;18(1):97–109. doi:10.1049/cvi2.12227. [Google Scholar] [CrossRef]
25. Wang A, Chen H, Liu L, Chen K, Lin Z, Han J, et al. YOLOv10: real-time end-to-end object detection. arXiv:2405.14458. 2024. [Google Scholar]
26. Wang C, He W, Nie Y, Guo J, Liu C, Wang Y, et al. Gold-YOLO: efficient object detector via gather-and-distribute mechanism. Adv Neural Inf Process Syst. 2024;36:51094–112. [Google Scholar]
27. Wang CY, Bochkovskiy A, Liao HYM. YOLOv7: trainable bag-of-freebies sets new state-of-the-art for real-time object detectors. In: Proceedings of the IEEE/CVF Conference on Computer Vision and Pattern Recognition; Los Alamitos, CA, USA; 2023. p. 7464–75. [Google Scholar]
28. Wang CY, Yeh IH, Liao HYM. YOLOv9: learning what you want to learn using programmable gradient information. arXiv:240213616. 2024. [Google Scholar]
Cite This Article
 Copyright © 2025 The Author(s). Published by Tech Science Press.
This work is licensed under a Creative Commons Attribution 4.0 International License , which permits unrestricted use, distribution, and reproduction in any medium, provided the original work is properly cited.
 Downloads
 Citation Tools