
 Submit a Paper
 Propose a Special lssue
 Open Access
ARTICLE

Second Nearest-Neighbor Modified Embedded Atom Method Interatomic Potential for Cu-Ni-Sn Ternary System
1 School of Materials Science and Engineering, Guizhou Minzu University, Guiyang, 550025, China
2 Guangdong Key Laboratory for Advanced Metallic Materials Processing and Forming, National Engineering Research Center of Near-Net-Shape Forming for Metallic Materials, South China University of Technology, Guangzhou, 510640, China
3 Faculty of Electronic and Information Engineering, Anshun University, Anshun, 561000, China
4 Faculty of Materials Science and Engineering, Kunming University of Science and Technology, Kunming, 650093, China
5 College of Materials Science and Engineering, Chongqing University, Chongqing, 400044, China
* Corresponding Authors: Zhongxue Feng. Email: ; Jun Tan. Email:
(This article belongs to the Special Issue: Advances in Computational Materials Science: Focusing on Atomic-Scale Simulations and AI-Driven Innovations)
Computers, Materials & Continua 2025, 83(1), 65-77. https://doi.org/10.32604/cmc.2025.059727
Received 15 October 2024; Accepted 10 February 2025; Issue published 26 March 2025
 View Full Text
 Download PDF
Abstract
To explore atomic-level phenomena in the Cu-Ni-Sn alloy, a second nearest-neighbor modified embedded-atom method (2NN MEAM) potential has been developed for the Cu-Ni-Sn system, building upon the work of other researchers. This potential demonstrates remarkable accuracy in predicting the lattice constant, with a relative error of less than 0.5% when compared to density functional theory (DFT) results, and it achieves a 10% relative error in the enthalpy of formation compared to experimental data, marking substantial advancements over prior models. The bulk modulus is predicted with a relative error of 8% compared to DFT. Notably, the potential effectively simulates the processes of melting and solidification of Cu-15Ni-8Sn, with a simulated melting point that closely aligns with the experimental value, within a 7.5% margin. This serves as a foundation for establishing a 2NN MEAM potential for a flawless Cu-Ni-Sn system and its microalloying systems.Keywords
Cu-Ni-Sn alloys have garnered significant attention due to their non-toxicity, low cost, and superior mechanical properties [1–5], among these, Cu-15Ni-8Sn alloys are particularly notable for their exceptional high strength and elastic modulus, with applications in electronic parts, maritime engineering, and aerospace [6,7]. However, the low melting point of Sn (504.89 K) compared to Ni (1726 K) and Cu (1356.4 K) leads to severe macroscopic segregation during solidification, which can weaken the alloy’s properties and limit its applications [8]. To mitigate segregation, it is essential to study the macro-segregation behaviors and mechanisms in detail, which requires the study of the atomic behaviors between different elements during the crystallization process, both through experiments and atomistic simulations. But conducting accurate and specific experiments is difficult due to the need for real-time, high-resolution, and high-temperature atomic measurements. Regarding this situation, the atomistic simulation study can provide an efficient and powerful method to study atomic behaviors.
Among the various atomic simulation methods, density functional theory (DFT) based on first-principle calculations can accurately predict atomic behaviors and material properties [9]. However, DFT is computationally intensive and only suitable for small-scale atomic simulations (hundreds of atoms), making it impractical for large-scale simulations such as those involving solidification processes. In contrast, the Molecular Dynamics (MD) method is effective for simulating large-scale atomic systems and predicting their properties [10,11]. MD simulations based on the second nearest-neighbor modified embedded-atom method (2NN MEAM) potentials [12–15] have been successfully applied to various systems, including Mg-Zn-Ca [16], FeCo [17], NiTi [18], Cu-Ni [19], Cu-Sn [20–22], Ni-Sn [20], Cu [21], Ni [23], and Sn [24], among others. These simulations have reasonably predicted the fundamental behaviors of materials. However, no reports exist on the development of a 2NN MEAM potential for the Cu-Ni-Sn system.
In this work, we developed a 2NN MEAM interatomic potential for the Cu-Ni-Sn ternary system based on existing unary and binary interatomic parameters. First, the accuracy of this potential was verified by DFT. Subsequently, the potential was used to simulate the melting process and XRD patterns of Cu-15Ni-8Sn, and the results were compared with experimental data to evaluate the rationality of the potential parameters.
The MEAM formalism has been comprehensively and formally explained in previous articles [25–30]. In the modified 2NN MEAM [31,32] formula, the second nearest-neighbor interaction is considered, which is affected by the adjustment of the screening parameter, making the many-body screening (
where
The basic idea for the screening is that if atom
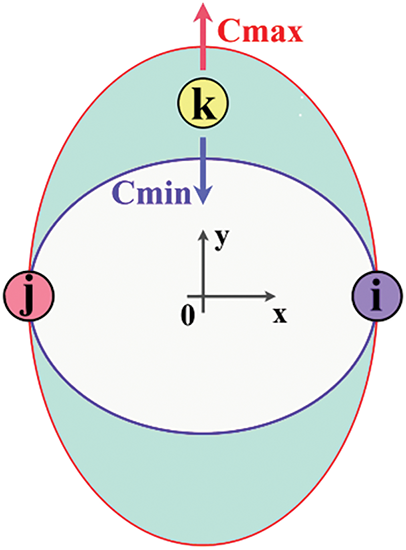
Figure 1: The screening schematic diagram of the three cases for the ternary system. In this diagram, the symbols
For each atom, the total energy value
where
In Eqs. (2)–(4), the cohesive energy
2.2 Development of the Cu-Ni-Sn Ternary 2NN MEAM Potentials
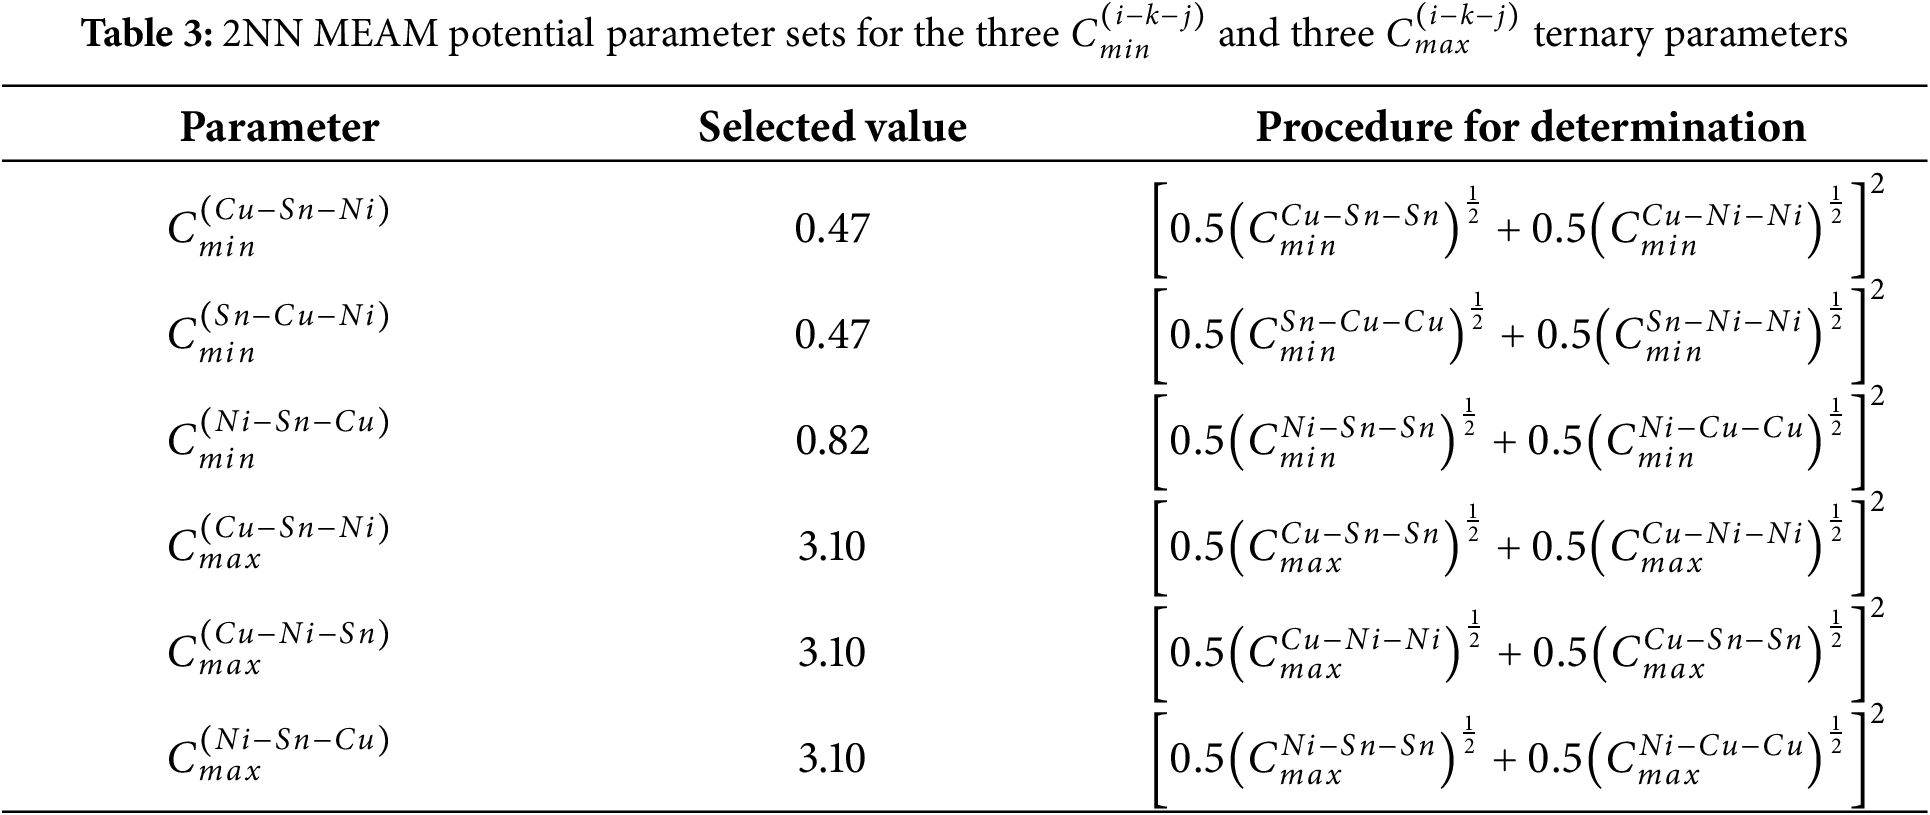
The 2NN MEAM potential for ternary system is derived from the unary and binary potentials, incorporating three
For the parameters
To validate the potential, the fundamental material properties of different Cu-Ni-Sn compounds computed by MD and DFT were compared. Furthermore, the MD simulation of melting and solidification process of the Cu-15Ni-8Sn alloy was compared with the experimental data to confirm the potential’s applicability. The simulations included energy minimization, equilibration steps (10 ps at 300 K), and heating/cooling steps (heating rate of 1 K/ps from 300 K to 2500 K and cooling rates of 1 K/ps back to 300 K, respectively). Large-scale atomic/molecular massively parallel simulator (LAMMPS) [38] is used for MD simulations, and the potentials used in the calculations are the ones established in this paper. The velocity Verlet algorithm was employed to unify Newton’s equations of motion. The timestep used was 1 fs. The simulations were performed in the NVT ensemble (constant number of particles, constant volume, constant temperature). The atom types and phase structures were identified using the OVITO software [39]. The Vienna Ab initio Simulation Package (VASP) [40–42] was used to the calculate DFT, which were based on the Projector Augmented-Wave (PAW) method [43], and the improved Perdew-Burke-Ernzerhof (PBE) [44] gradient was used to estimate the exchange-correlation function. The energy cutoff (Ecut) for plane-wave basis set was at 400 eV. Dense k-point meshes in the first Brillouin zone with a Monkhorst-Pack scheme were employed, with a sample of 8*8*8 for each structure mentioned above.
Cu-15Ni-8Sn alloy was obtained using vacuum induction melting using high-purity electrolytic copper (99.99 wt.%), electrolytic Ni (99.99 wt.%), and industrial pure Sn (99.99 wt.%). As indicated by the pseudo-binary phase diagram (Fig. 2) of the Cu-15Ni-8Sn alloy [45], the alloy exhibits a melting point of approximately 1400 K. The precise chemical composition is detailed in Table 4.
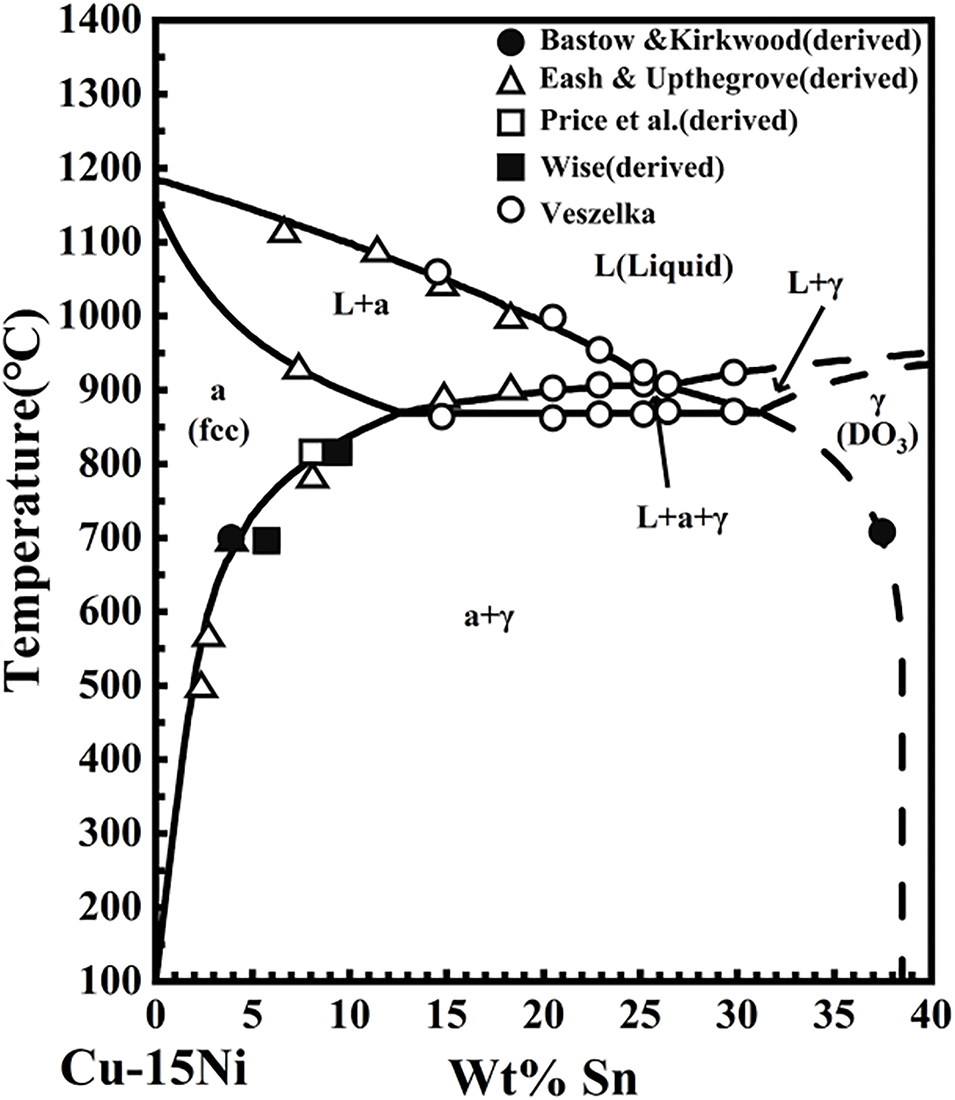
Figure 2: Pseudo-binary phase diagram of Cu-Ni-Sn (at the isopleth of 15 wt.% Ni) alloy

Test samples were extracted from the ingot center. The metallographic sample surfaces were polished suing abrasive SiC papers and subsequently etched with a solution composed of 95 mL C2H5OH, 5 mL HCl, 5 g FeCl3 to reveal the microstructure under scanning electron microscopy (SEM). The materials’ phase structure was characterized using XRD analytical, utilizing Cu-Ka radiation within the 20° to 100° (2θ) range at a scan rate of 10°/min. The resultant data were processed utilizing JADE software.
3.1 Cu-Ni-Sn Ternary System Property Parameters and Contrast with DFT
To verify e the reliability of the established ternary potential parameters, the property parameters (lattice constant, bulk modulus, and enthalpy of formation) for the compounds
where
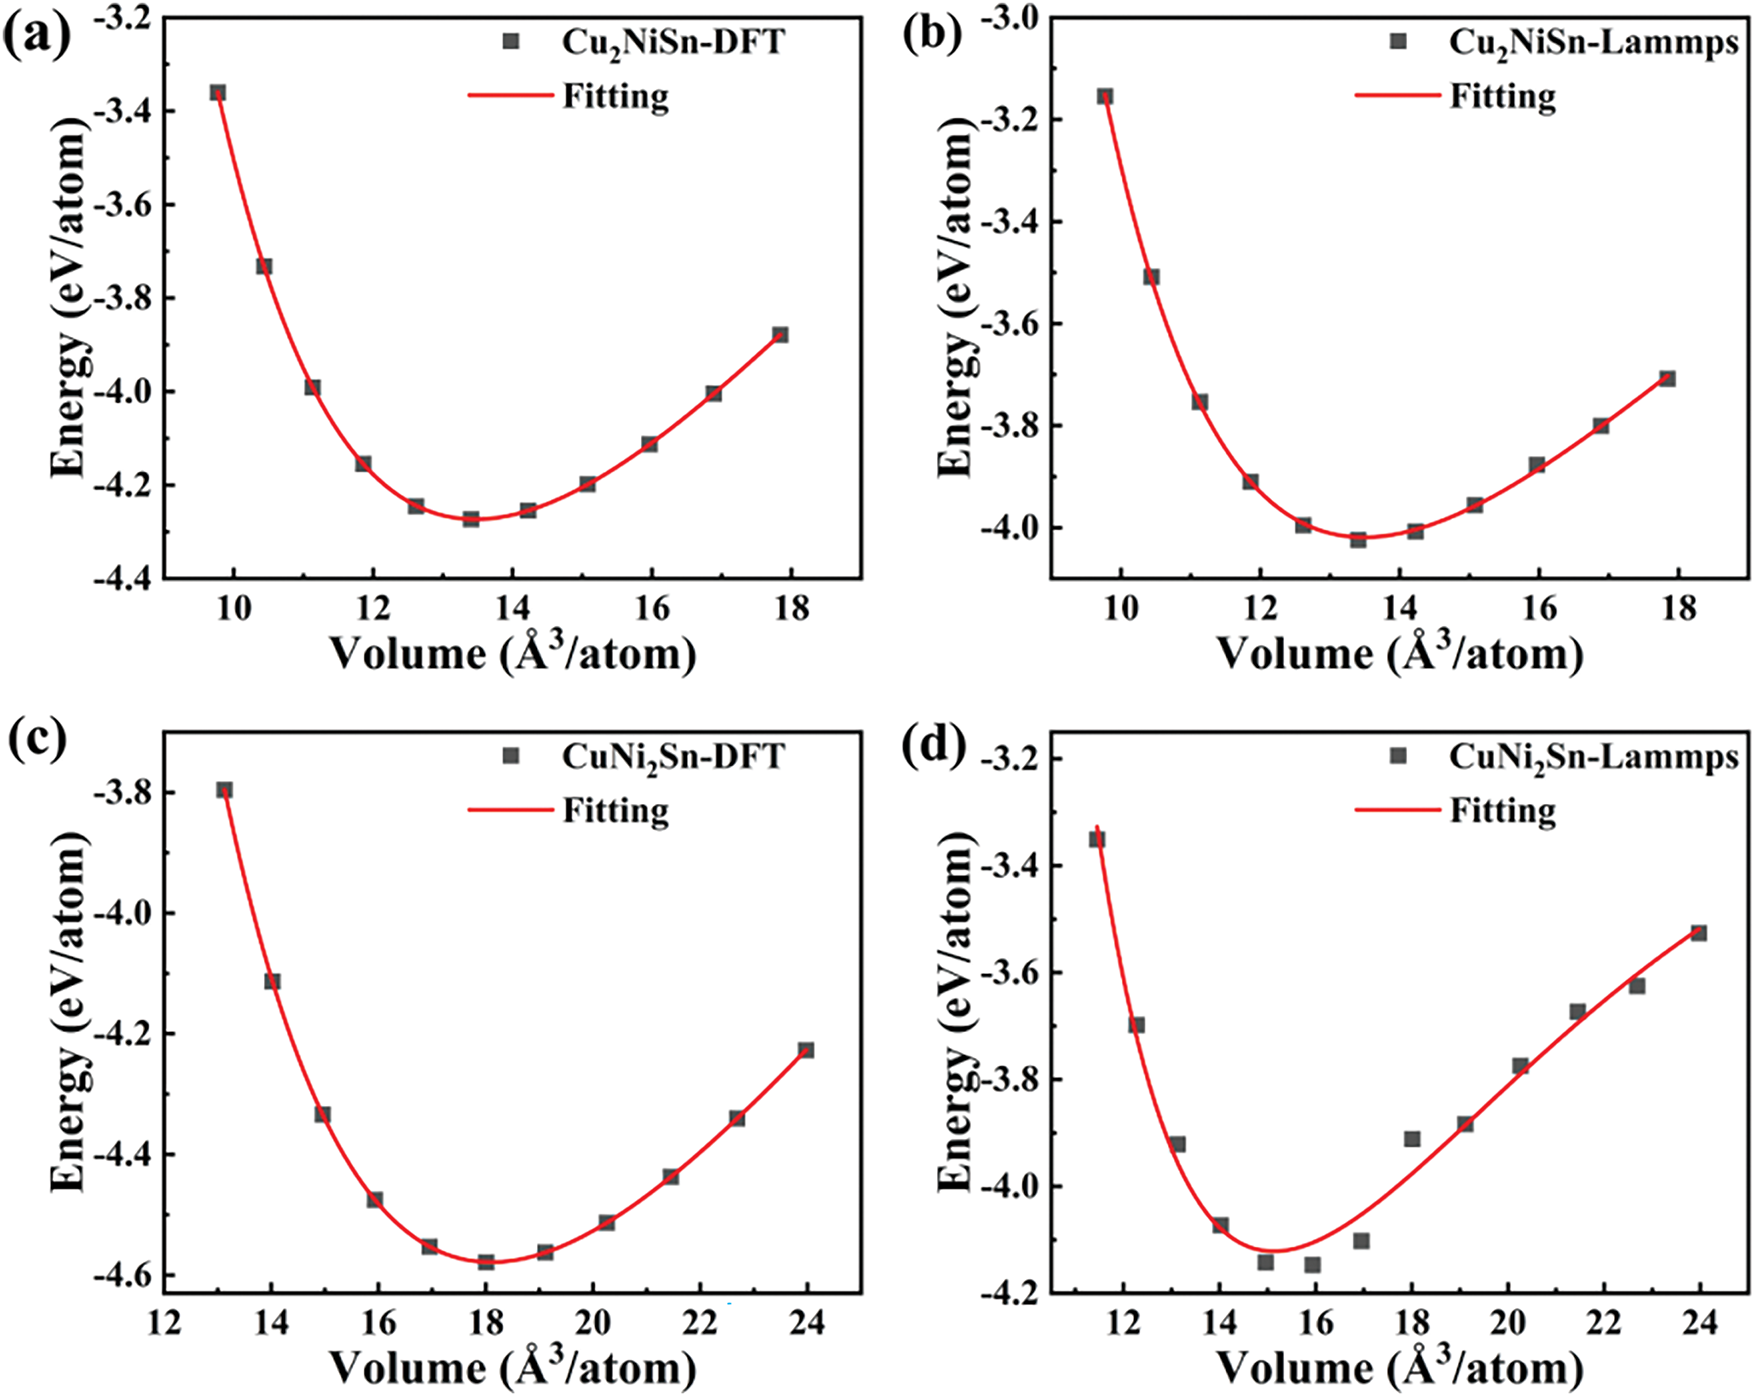
Figure 3: The E-V curves of different Cu-Ni-Sn intermetallic compounds were calculated by DFT and MD. (a) The
The results of the property parameters of Cu-Ni-Sn ternary compounds calculated by DFT and MD are shown in Table 5. The lattice constants and bulk modulus calculated by MD are consistent with those calculated by DFT. This indicates that the potential parameter can effectively reproduce the atomic simulation of the ternary system, thereby confirming the feasibility of this parameter.

3.2 Comparison of Simulation and Experimental Results of the Melting and Solidification Processes of Cu-15Ni-8Sn Alloy
The melting and solidification behaviors of the Cu-15Ni-8Sn alloy were investigated via molecular dynamics (MD) simulations, utilizing the established potential to determine the simulated melting point, XRD patterns, and Sn segregation during solidification. To facilitate the statistical analysis of Sn fractions at grain boundaries, a random substitution atom model based on a symmetric grain boundary structure was constructed. The atomic model, depicted in Fig. 4a, comprises 5760 atoms, of which 273 are Sn atoms. The structural model is illustrated in Fig. 4b, where the white regions represent the grain boundaries. The system was initially equilibrated at a temperature of 300 K and a pressure of 0 bar, subsequently heated to 2500 K, and then cooled back to 300 K. The grain boundary region is defined based on the atomic coordinates and the Voronoi tessellation method. Atoms with a high number of Voronoi faces (typically more than 7) were identified as grain boundary atoms. Simulated snapshots capturing the structural evolution during the solidification process are presented in Fig. 4c and d.
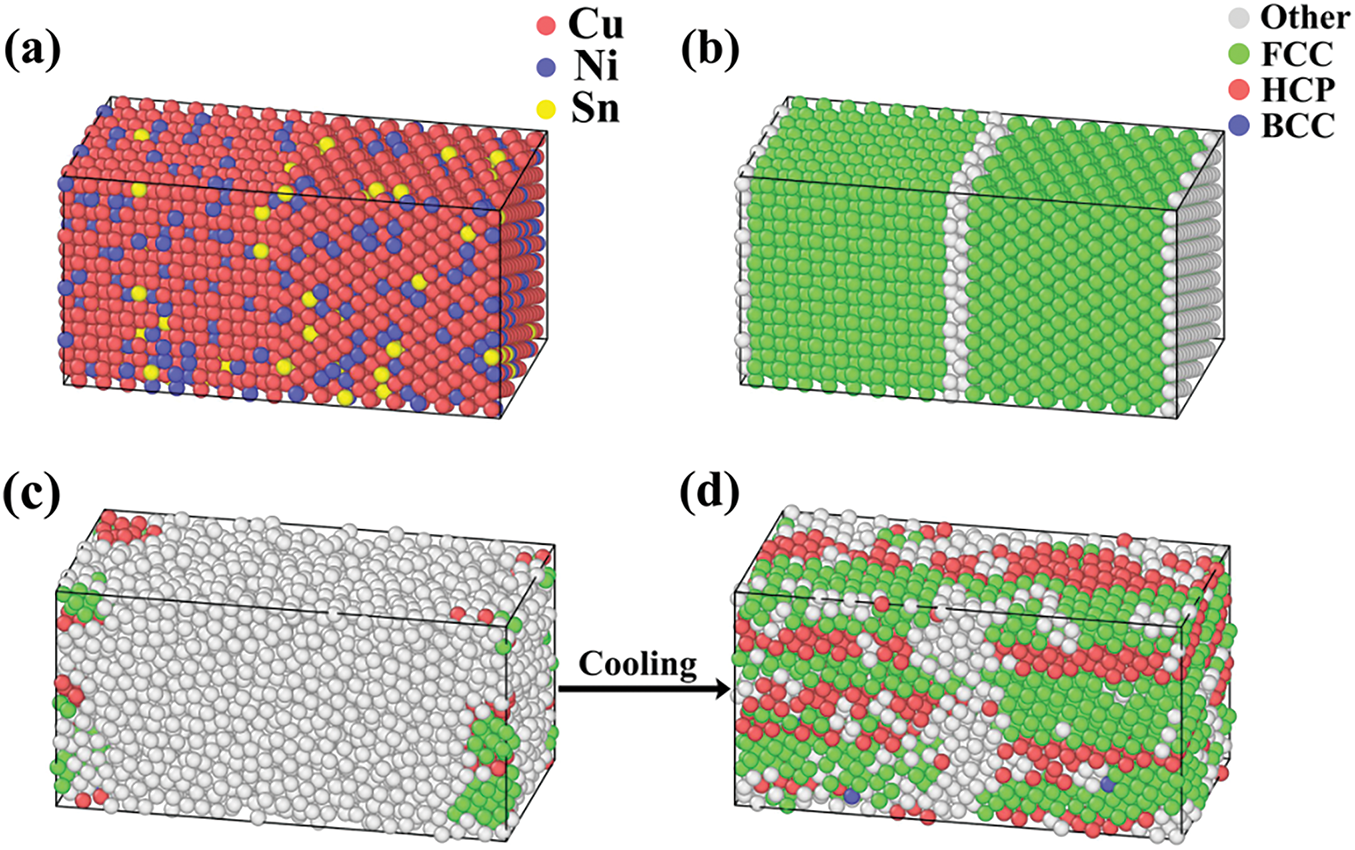
Figure 4: (a) atomic model of the Cu-15Ni-8Sn alloys at initial; (b) structural model of the Cu-15Ni-8Sn alloys at initial; (c) simulation snapshot at 1140 K during solidification; (d) simulation snapshot at 1092 K during solidification
The average potential energy—temperature curve (as shown in Fig. 5a) indicates that the potential energy of the Cu-15Ni-8Sn alloy undergoes significant changes at ~1140 K during the heating stage and at ~1850 K during the cooling stage The molecular dynamics simulations were conducted with a heating rate of 1 K/ps and a cooling rate of 0.5 K/ps. Furthermore, it suggests that at low temperatures, the configuration during heating stage has a higher energy than that during cooling stage. This finding highlights that the initial configuration during heating possess higher energy, whereas the configuration during cooling process is characterized by lower energy. These observations provide crucial insights into the phase transition and structural evolution of the Cu-15Ni-8Sn alloy, aligning well with the fundamental physical processes of thermal activation, structural rearrangement, and solidification.
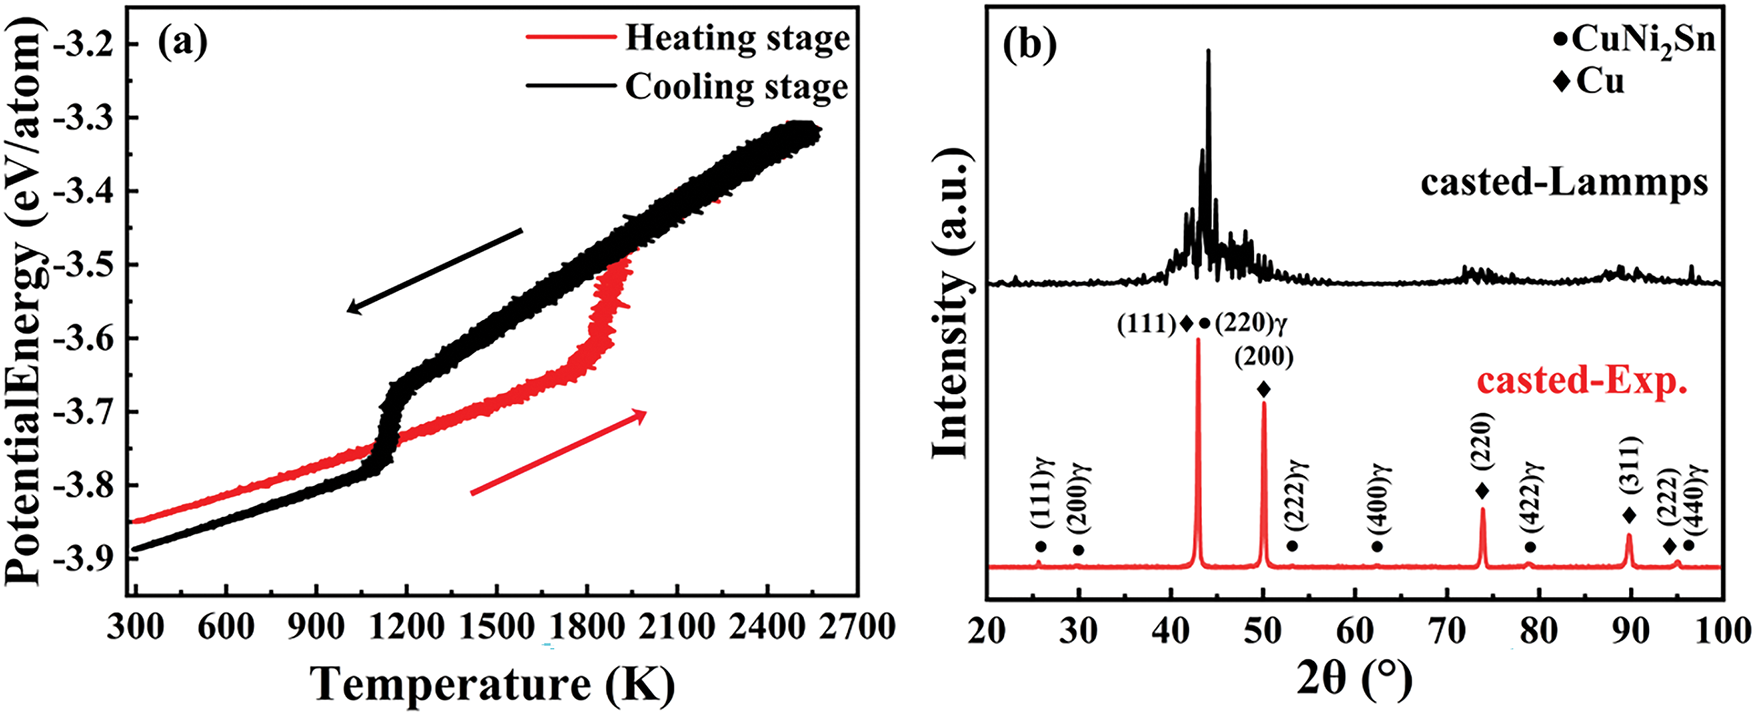
Figure 5: (a) The 2NN MEAM potential was employed to simulate the temperature-dependent variation of potential energy for the Cu-15Ni-8Sn alloy. (b) XRD of Cu-15Ni-8Sn alloy samples cast Experiment and MD simulation
Based on Eq. (6) [48–51], the simulated melting point of the Cu-15Ni-8Sn alloy is approximately 1538 K, which corresponds to a maximum deviation of about 9.8% from the melting point reported in Fig. 2 (approximately 1400 K). Fig. 5b presents the XRD results, which demonstrate a strong correlation between the simulated and experimental data, thereby validating the accuracy and reliability of the simulation approach.
where
An investigation was conducted on the relationship between temperature and the Sn proportions at grain boundary during the solidification, and the proportion of Sn at the grain boundaries was recorded every 1000 steps, as shown in Fig. 6. Among them, the proportion of Sn atoms in the grain boundary tends to increase with temperature decreasing and increases sharply at 1140 K. It is evident that Sn enrichment occurs at grain boundaries during the solidification.
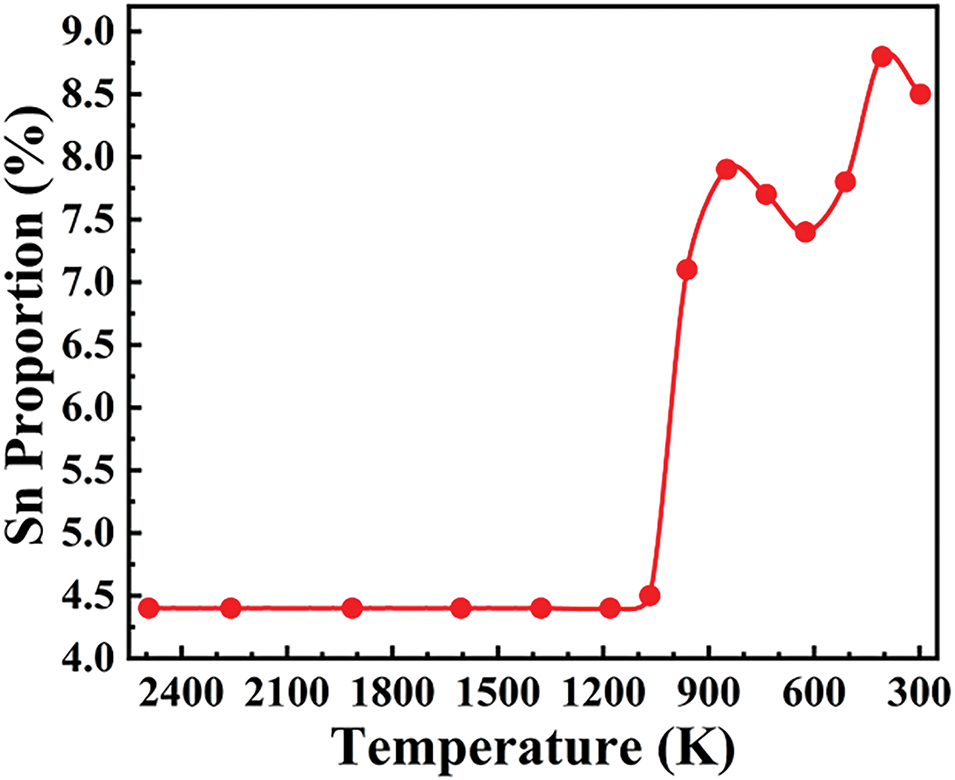
Figure 6: The proportion of Sn at grain boundaries during solidification for the Cu-15Ni-8Sn alloy
The microstructure of the as-cast Cu-15Ni-8Sn alloy is illustrated in Fig. 7a. The alloy displays a typical dendritic structure, which is composed of three main components: a dark dendritic matrix (α-Cu), a white irregular structure (γ-DO3), and a grey interdendritic region (coexistence of α and γ phases). The corresponding EDS results are summarized in Table 6. The Sn content in the α-matrix is 6.41 wt.%, which is 2.1 wt.% lower than the average value of the alloy (8.52 wt.%). In contrast, the Sn content in both the white irregular γ phase and the lamellar γ phase is higher than the average value of the alloy. Notably, the γ phase adopts a white irregular morphology when the Sn content exceeds a critical value of approximately 39.44 wt.%.
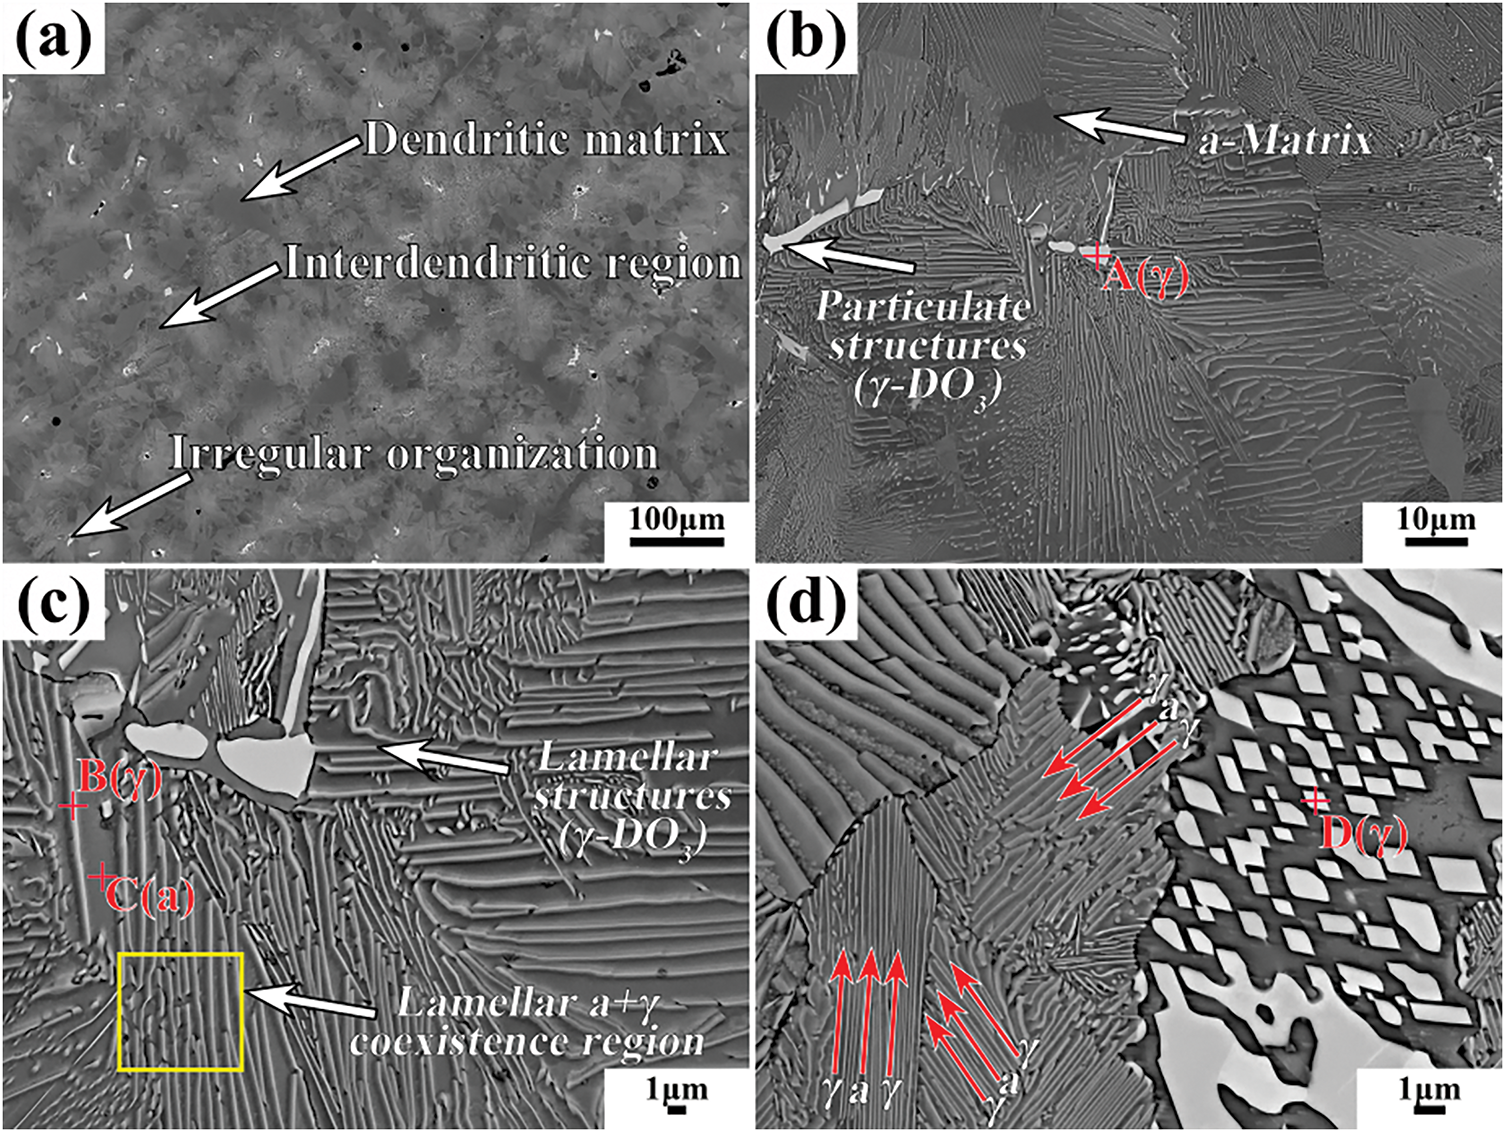
Figure 7: Microstructure of as-cast Cu-15Ni-8Sn alloys at different magnifications: (a) 150×, (b) 1000×, (c) 3000×, and (d) 5000×

In summary, the established potential has good applicability for simulating the melting and solidification processes of the Cu-15Ni-8Sn alloy. However, the differences may exist when applying other simulations, and further optimization is still needed.
In this study, the Cu-Ni-Sn ternary system 2NN MEAM potential was developed, and used to simulate and calculate the relevant property parameters of the compound, the melting temperature of the Cu-15Ni-8Sn alloy, XRD patterns, and the Sn segregation at grain boundaries. The results were consistent with the DFT calculation and experiments, respectively. In summary, Cu-Ni-Sn ternary system 2NN MEAM potential presented in this article demonstrates excellent applicability in simulating the melting and solidification processes of Cu-15Ni-8Sn alloys, thereby facilitating the development of a perfect potential for the Cu-Ni-Sn system and its microalloying systems.
Acknowledgement: Not applicable.
Funding Statement: This work was sponsored by the Science and Technology Foundation of Guizhou Provincial Education Department (No. QJJ [2024]60), Guizhou Provincial Basic Research Program (Natural Science) (No. QKHJC [2024]Youth 214), Science and Technology Foundation of Guizhou Minzu University (No. GZMUZK [2024] QD21), and Research Projects of Anshun University (No. asxybsjj202413).
Author Contributions: The authors confirm contribution to the paper as follows: study conception and design: Jialiang Dong; data collection: Xuemao Dong; analysis and interpretation of results: Zhongxue Feng; draft manuscript preparation: Jialiang Dong and Zhongxue Feng; software, methodology: Caiju Li and Jianhong Yi; writing, review and editing: Zhongxue Feng and Jun Tan. All authors reviewed the results and approved the final version of the manuscript.
Availability of Data and Materials: The raw/processed data required to reproduce these findings cannot be shared at this time, as the data also form part of an ongoing study.
Ethics Approval: Not applicable.
Conflicts of Interest: The authors declare no conflicts of interest to report regarding the present study.
References
1. Yang M, Hu YL, Li XN, Li ZM, Zheng YH, Li NJ, et al. Compositional interpretation of high elasticity Cu–Ni–Sn alloys using cluster-plus-glue-atom model. J Mater Res Technol. 2022;17:1246–58. doi:10.1016/j.jmrt.2022.01.075. [Google Scholar] [CrossRef]
2. Xie G, Wang Q, Mi X, Xiong B, Peng L. The precipitation behavior and strengthening of a Cu-2.0wt% Be alloy. Mater Sci Eng: A. 2012;558:326–30. doi:10.1016/j.msea.2012.08.007. [Google Scholar] [CrossRef]
3. Eash JT, Upthegrove C. The copper-rich alloys of the copper-nickel-tin system. USA: University of Michigan; 1932 [cited 2024 Dec 30]. Available from: https://babel.hathitrust.org/cgi/pt?id=mdp.39015071604305. [Google Scholar]
4. Peng G, Gan X, Jiang Y, Li Z, Zhou K. Effect of dynamic strain aging on the deformation behavior and microstructure of Cu-15Ni-8Sn alloy. J Alloys Comp. 2017;718:182–7. doi:10.1016/j.jallcom.2017.05.127. [Google Scholar] [CrossRef]
5. Zhang J, Wang Z, Miao S, Zhang Y, Fu Y, Dong Y, et al. Effect of defect strengthening on the mechanical properties of a novel Cu–15Ni–8Sn alloy. Mater Sci Eng: A. 2023;868:144777. doi:10.1016/j.msea.2023.144777. [Google Scholar] [CrossRef]
6. Wang N, Shen Y, An Q, Reddy KM, Jin M, Karre R, et al. Microstructure evolution and mechanical property of Cu-15Ni-8Sn-0.2Nb alloy during aging treatment. J Mater Sci Technol. 2021;86:227–36. doi:10.1016/j.jmst.2021.01.034. [Google Scholar] [CrossRef]
7. Guo Z, Jie J, Liu S, Zhang Y, Qin B, Wang T, et al. Effect of V addition on microstructures and mechanical properties of Cu-15Ni-8Sn alloy. Mater Sci Eng: A. 2019;748(9):85–94. doi:10.1016/j.msea.2019.01.084. [Google Scholar] [CrossRef]
8. Li J, Zhang Z, Xu W, Yang Y, Xue P, Teng Q, et al. Hot isostatic pressing of Cu–15Ni–8Sn alloy with suppressed Sn macro-segregation and enhanced mechanical properties. Mater Sci Eng: A. 2022;855(5):143866. doi:10.1016/j.msea.2022.143866. [Google Scholar] [CrossRef]
9. Perdew JP, Zunger A. Self-interaction correction to density-functional approximations for many-electron systems. Phys Rev B. 1981;23(10):5048. doi:10.1103/PhysRevB.23.5048. [Google Scholar] [CrossRef]
10. Fracchia F, Del Frate G, Mancini G, Rocchia W, Barone V. Force field parametrization of metal ions from statistical learning techniques. J Chem Theory Comput. 2018;14(1):255–73. doi:10.1021/acs.jctc.7b00779. [Google Scholar] [PubMed] [CrossRef]
11. Thompson MW, Gilmer JB, Matsumoto RA, Quach CD, Shamaprasad P, Yang AH, et al. Towards molecular simulations that are transparent, reproducible, usable by others, and extensible (TRUE). Mol Phys. 2020;118(9–10):e1742938. doi:10.1080/00268976.2020.1742938. [Google Scholar] [PubMed] [CrossRef]
12. Jang HS, Seol D, Lee BJ. Modified embedded-atom method interatomic potentials for Mg–Al–Ca and Mg–Al–Zn ternary systems. J Magnes Alloys. 2021;9(1):317–35. doi:10.1016/j.jma.2020.09.006. [Google Scholar] [CrossRef]
13. Mahata A, Mukhopadhyay T, Asle Zaeem M. Modified embedded-atom method interatomic potentials for Al-Cu, Al-Fe and Al-Ni binary alloys: from room temperature to melting point. Comput Mater Sci. 2022;201:110902. doi:10.1016/j.commatsci.2021.110902. [Google Scholar] [CrossRef]
14. Zhou H, Dickel D, Baskes MI, Mun S, Asle Zaeem M. A modified embedded-atom method interatomic potential for bismuth. Modelling Simul Mater Sci Eng. 2021;29(6):065008. doi:10.1088/1361-651X/ac095c. [Google Scholar] [CrossRef]
15. Wang J, Lee BJ. Second-nearest-neighbor modified embedded-atom method interatomic potential for V-M (M = Cu, Mo, Ti) binary systems. Comput Mater Sci. 2021;188(10):110177. doi:10.1016/j.commatsci.2020.110177. [Google Scholar] [CrossRef]
16. Jang HS, Seol D, Lee BJ. Modified embedded-atom method interatomic potential for the Mg-Zn–Ca ternary system. Calphad. 2019;67:101674. doi:10.1016/j.calphad.2019.101674. [Google Scholar] [CrossRef]
17. Muralles M, Oh JT, Chen Z. Molecular dynamics study of FeCo phase transitions and thermal properties based on an improved 2NN MEAM potential. J Mater Res Technol. 2022;19:1102–10. doi:10.1016/j.jmrt.2022.05.100. [Google Scholar] [CrossRef]
18. Weng Z, Zhang F, Xu C, Zhou J. The effect of incident energy, incident angle and substrate temperature on surface morphology and atomic distribution of NiTi films. Mater Des. 2020;187:108350. doi:10.1016/j.matdes.2019.108350. [Google Scholar] [CrossRef]
19. Lee BJ, Shim JH. A modified embedded atom method interatomic potential for the Cu-Ni system. Calphad. 2004;28(2):125–32. doi:10.1016/j.calphad.2004.06.001. [Google Scholar] [CrossRef]
20. Kim Y, Lee BJ. Second nearest-neighbor modified embedded atom method interatomic potentials for Na-M−Sn (M = Cu, Mn, Ni) ternary systems. Comput Mater Sci. 2022;206(38):111305. doi:10.1016/j.commatsci.2022.111305. [Google Scholar] [CrossRef]
21. Ko WS, Lee JS, Kim DH. Atomistic simulations of Ag–Cu–Sn alloys based on a new modified embedded-atom method interatomic potential. J Mater Res. 2022;37(1):145–61. doi:10.1557/s43578-021-00395-z. [Google Scholar] [CrossRef]
22. Aguilar JF, Ravelo R, Baskes MI. Morphology and dynamics of 2D Sn-Cu alloys on (100) and (111) Cu surfaces. Modelling Simul Mater Sci Eng. 2000;8(3):335–44. doi:10.1088/0965-0393/8/3/313. [Google Scholar] [CrossRef]
23. Lee BJ, Shim JH, Baskes MI. Semiempirical atomic potentials for the FCC metals Cu, Ag, Au, Ni, Pd, Pt, Al, and Pb based on first and second nearest-neighbor modified embedded atom method. Phys Rev B. 2003;68(14):144112. doi:10.1103/PhysRevB.68.144112. [Google Scholar] [CrossRef]
24. Ko WS, Kim DH, Kwon YJ, Lee M. Atomistic simulations of pure tin based on a new modified embedded-atom method interatomic potential. Metals. 2018;8(11):900. doi:10.3390/met8110900. [Google Scholar] [CrossRef]
25. Lee BJ, Baskes MI. Second nearest-neighbor modified embedded-atom-method potential. Phys Rev B. 2000;62(13):8564–7. doi:10.1103/PhysRevB.62.8564. [Google Scholar] [CrossRef]
26. Lee BJ, Baskes MI, Kim H, Koo Cho Y. Second nearest-neighbor modified embedded atom method potentials for bcc transition metals. Phys Rev B. 2001;64(18):184102. doi:10.1103/PhysRevB.64.184102. [Google Scholar] [CrossRef]
27. Rose JH, Smith JR, Guinea F, Ferrante J. Universal features of the equation of state of metals. Phys Rev B. 1984;29(6):2963–9. doi:10.1103/PhysRevB.29.2963. [Google Scholar] [CrossRef]
28. Asadi E, Asle Zaeem M, Nouranian S, Baskes MI. Two-phase solid-liquid coexistence of Ni, Cu, and Al by molecular dynamics simulations using the modified embedded-atom method. Acta Mater. 2015;86:169–81. doi:10.1016/j.actamat.2014.12.010. [Google Scholar] [CrossRef]
29. Baskes MI. Application of the embedded-atom method to covalent materials: a semiempirical potential for silicon. Phys Rev Lett. 1987;59(23):2666–9. doi:10.1103/PhysRevLett.59.2666. [Google Scholar] [PubMed] [CrossRef]
30. Baskes MI. Determination of modified embedded atom method parameters for nickel. Mater Chem Phys. 1997;50(2):152–8. doi:10.1016/S0254-0584(97)80252-0. [Google Scholar] [CrossRef]
31. Kim KH, Jeon JB, Lee BJ. Modified embedded-atom method interatomic potentials for Mg–X (X=Y, Sn, Ca) binary systems. Calphad. 2015;48:27–34. doi:10.1016/j.calphad.2014.10.001. [Google Scholar] [CrossRef]
32. Kim YM, Lee BJ. A modified embedded-atom method interatomic potential for the Cu-Zr system. J Mater Res. 2008;23(4):1095–104. doi:10.1557/jmr.2008.0130. [Google Scholar] [CrossRef]
33. Xiang H, Guo W. A newly developed interatomic potential of Nb−Al−Ti ternary systems for high-temperature applications. Acta Mechanica Sinica. 2022;38(1):121451. doi:10.1007/s10409-022-09007-x. [Google Scholar] [CrossRef]
34. Kim HK, Jung WS, Lee BJ. Modified embedded-atom method interatomic potentials for the Fe–Ti–C and Fe–Ti–N ternary systems. Acta Mater. 2009;57(11):3140–7. doi:10.1016/j.actamat.2009.03.019. [Google Scholar] [CrossRef]
35. Kim HK, Jung WS, Lee BJ. Modified embedded-atom method interatomic potentials for the Nb-C, Nb-N, Fe-Nb-C, and Fe-Nb-N systems. J Mater Res. 2010;25(7):1288–97. doi:10.1557/JMR.2010.0182. [Google Scholar] [CrossRef]
36. Ko WS, Lee BJ. Modified embedded-atom method interatomic potentials for pure Y and the V–Pd–Y ternary system. Modelling Simul Mater Sci Eng. 2013;21(8):085008. doi:10.1088/0965-0393/21/8/085008. [Google Scholar] [CrossRef]
37. Wu C, Lee BJ, Su X. Modified embedded-atom interatomic potential for Fe-Ni, Cr-Ni and Fe-Cr-Ni systems. Calphad. 2017;57:98–106. doi:10.1016/j.calphad.2017.03.007. [Google Scholar] [CrossRef]
38. Plimpton S. Fast parallel algorithms for short-range molecular dynamics. J Comput Phys. 1995;117(1):1–19. doi:10.1006/jcph.1995.1039. [Google Scholar] [CrossRef]
39. Stukowski A. Visualization and analysis of atomistic simulation data with OVITO-the Open Visualization Tool. Modelling Simul Mater Sci Eng. 2010;18(1):015012. doi:10.1088/0965-0393/18/1/015012. [Google Scholar] [CrossRef]
40. Kresse G, Furthmüller J. Efficient iterative schemes for ab initio total-energy calculations using a plane-wave basis set. Phys Rev B Condens Matter. 1996;54(16):11169–86. doi:10.1103/PhysRevB.54.11169. [Google Scholar] [PubMed] [CrossRef]
41. Kresse G, Furthmüller J. Efficiency of ab-initio total energy calculations for metals and semiconductors using a plane-wave basis set. Comput Mater Sci. 1996;6(1):15–50. doi:10.1016/0927-0256(96)00008-0. [Google Scholar] [CrossRef]
42. Kresse G, Hafner J. Ab initio molecular-dynamics simulation of the liquid-metal-amorphous-semiconductor transition in germanium. Phys Rev B Condens Matter. 1994;49(20):14251–69. doi:10.1103/PhysRevB.49.14251. [Google Scholar] [PubMed] [CrossRef]
43. Blöchl PE. Projector augmented-wave method. Phys Rev B Condens Matter. 1994;50(24):17953–79. doi:10.1103/PhysRevB.50.17953. [Google Scholar] [PubMed] [CrossRef]
44. Perdew JP, Burke K, Ernzerhof M. Generalized gradient approximation made simple. Phys Rev Lett. 1996;77(18):3865–8. doi:10.1103/PhysRevLett.77.3865. [Google Scholar] [PubMed] [CrossRef]
45. Zhao JC, Notis MR. Spinodal decomposition, ordering transformation, and discontinuous precipitation in a Cu–15Ni–8Sn alloy. Acta Materialia. 1998;46(12):4203–18. doi:10.1016/S1359-6454(98)00095-0. [Google Scholar] [CrossRef]
46. Murnaghan FD. The compressibility of media under extreme pressures. Proc Natl Acad Sci U S A. 1944;30(9):244–7. doi:10.1073/pnas.30.9.244. [Google Scholar] [PubMed] [CrossRef]
47. Birch F. Finite elastic strain of cubic crystals. Phys Rev. 1947;71(11):809–24. doi:10.1103/PhysRev.71.809. [Google Scholar] [CrossRef]
48. Separdar L, Rino JP, Zanotto ED. Molecular dynamics simulations of spontaneous and seeded nucleation and theoretical calculations for zinc selenide. Computat Mater Sci. 2021;187(48):110124. doi:10.1016/j.commatsci.2020.110124. [Google Scholar] [CrossRef]
49. Luo SN, Strachan A, Swift DC. Nonequilibrium melting and crystallization of a model Lennard-Jones system. J Chem Phys. 2004;120(24):11640–9. doi:10.1063/1.1755655. [Google Scholar] [PubMed] [CrossRef]
50. Sankaranarayanan SKRS, Bhethanabotla VR, Joseph B. Molecular dynamics simulation study of the melting of Pd-Pt nanoclusters. Phys Rev B. 2005;71(19):195415. doi:10.1103/PhysRevB.71.195415. [Google Scholar] [CrossRef]
51. Luo SN, Ahrens TJ, Çağın T, Strachan A, Goddard WA, Swift DC. Maximum superheating and undercooling: systematics, molecular dynamics simulations, and dynamic experiments. Phys Rev B. 2003;68(13):134206. doi:10.1103/PhysRevB.68.134206. [Google Scholar] [CrossRef]
Cite This Article
 Copyright © 2025 The Author(s). Published by Tech Science Press.
This work is licensed under a Creative Commons Attribution 4.0 International License , which permits unrestricted use, distribution, and reproduction in any medium, provided the original work is properly cited.
 Downloads
 Citation Tools