
 Submit a Paper
 Propose a Special lssue
 Open Access
ARTICLE

Evolution Analysis of Network Attack and Defense Situation Based on Game Theory
1 College of Software Engineering, Zhengzhou University of Light Industry, Zhengzhou, 450007, China
2 Intelligent Computing Power Research Department, Zhengzhou Xinda Advanced Technology Research Institute, Zhengzhou, 450007, China
* Corresponding Author: Haiyan Sun. Email:
Computers, Materials & Continua 2025, 83(1), 1451-1470. https://doi.org/10.32604/cmc.2025.059724
Received 15 October 2024; Accepted 30 December 2024; Issue published 26 March 2025
 View Full Text
 Download PDF
Abstract
To address the problem that existing studies lack analysis of the relationship between attack-defense game behaviors and situation evolution from the game perspective after constructing an attack-defense model, this paper proposes a network attack-defense game model (ADGM). Firstly, based on the assumption of incomplete information between the two sides of the game, the ADGM model is established, and methods of payoff quantification, equilibrium solution, and determination of strategy confrontation results are presented. Then, drawing on infectious disease dynamics, the network attack-defense situation is defined based on the density of nodes in various security states, and the transition paths of network node security states are analyzed. Finally, the network zero-day virus attack-defense behaviors are analyzed, and comparative experiments on the attack-defense evolution trends under the scenarios of different strategy combinations, interference methods, and initial numbers are conducted using the NetLogo simulation tool. The experimental results indicate that this model can effectively analyze the evolution of the macro-level network attack-defense situation from the micro-level attack-defense behaviors. For instance, in the strategy selection experiment, when the attack success rate decreases from 0.49 to 0.29, the network destruction rate drops by 11.3%, in the active defense experiment, when the interference coefficient is reduced from 1 to 0.7, the network destruction rate decreases by 7%, and in the initial node number experiment, when the number of initially infected nodes increases from 10 to 30, the network destruction rate rises by 3%.Keywords
With the development of 5G networks, the number of Internet of Things (IoT) devices has increased dramatically, leading to more complex, intelligent, and diverse network security threats and attack methods. Traditional passive defense technologies are no longer able to meet the ever-changing network security needs, so there is an urgent need for technologies that can effectively characterize network attack-defense behaviors, accurately predict the evolution trends of network attack-defense situations, and implement active defense. The characteristics of the network attack-defense confrontation process, such as objective opposition, strategy dependence, and non-cooperative relationships, align with the features of game theory [1]. Game theory is considered to be one of the fundamental theories in the discipline of cyberspace security, and can provide an effective way to study network security issues [2]. Therefore, constructing network attack-defense behavior models based on game theory enables an in-depth analysis of the evolution of network attack-defense situations, effectively enhancing the capability to prevent security threats and improving defense efficiency [3].
In network security research, game theory models provide a systematic framework for analyzing and optimizing the selection of attack-defense strategies. According to the degree of completeness of the behavior and gain information grasped by both attackers and defenders, it can be categorized into complete and incomplete information game models [4]. The degree of completeness of information refers to the fact that the attack and defense parties clearly understand all the strategies that the other side may adopt at each stage, and accurately know the benefits of different behaviors or combinations of strategies. In a complete information game model, all participants have complete knowledge of all information. For example, Sun et al. [5] addressed the issue of selecting defense strategies for multi-path combination attacks in network attack and defense, established a non-zero-sum game model based on complete information, optimized the computation method for the gain, and proposed the selection method of the optimal defense strategy. To assess the security status of large-scale cloud networks, Chowdhary et al. [6] constructed a two-player zero-sum Markov game model, which can enhance network security defense capabilities by identifying the attacker’s optimal strategy and forcing the attacker to adopt sub-optimal strategies. Wang et al. [7] addressed the issue of security risk assessment for military information networks and proposed a network security risk assessment method based on complete information game. The method quantified the gains of attack-defense strategies in terms of network security features and provided recommendations for selecting optimal defense strategies on the basis of risk assessment.
In an incomplete information game model, at least one party cannot have certain key information, which can result in information asymmetry. Liu et al. [8] addressed the issue that existing network research focuses on only one of the attack-defense parties, making it difficult to accurately describe and represent the network attack-defense dynamics. They proposed an incomplete information attack-defense game model, and elucidated the temporal evolution of the network attack-defense situations through simulation experiments in various scenarios. However, relying solely on the quantity of a certain type does not intuitively reflect the network attack-defense situation. Yi et al. [9] established an attack-defense tree model for false data injection attacks using economic indicators and attack metrics, calculated the expected gains for both attackers and defenders, and determined the optimal defense strategy through equilibrium analysis. Yan et al. [10] addressed the problem of allocating limited defense resources in complex information-physical power systems to cope with false data injection attacks. They developed an incomplete information zero-sum game model, used the state offset caused by false data injection attacks to quantify the attack-defense gains, and provided the optimal defense resource allocation method through simulation results. However, the unequal gains of both sides were ignored in the gain quantification process. Gao et al. [11] addressed the lack of in-depth analysis of dynamic continuous interactions between multiple attackers and defenders in future wireless networks. They constructed an interaction model based on a differential game, introduced the paralysis threshold, derived the equilibrium strategy using optimal control theory combined with Hamilton’s function, and proposed an optimal decision-making algorithm. However, the model relies on numerous fixed parameters, making it suitable only for short-term attack-defense scenarios. To solve the problem that existing deception resource selection methods based on game theory cannot simulate continuous dynamic attack and defense behaviors when modeling, He et al. [12] constructed a deception resource choice method based on differential game and Deep Q-network (DQN). The method constructed the node state evolution process based on the infectious disease susceptible-infected-removed (SIR) model by analyzing the attacks and defense strategies, giving the main function of the attacks and defenses, and solving the optimal deception resource strategy by the DQN algorithm. However, the DQN algorithm has the problem of overestimation when calculating the Q-value. Aiming at the problem that complex network defense strategies do not fully consider the attack and defense characteristics and the existing algorithms are difficult to adapt to a variety of complex networks, Zhang et al. [13] constructed a potential differential game model for network attack-defense, analyzed node state evolution, quantified attack-defense payoff, and enhanced defense effectiveness, but still faces the challenges of high computational cost and poor scalability. Tang et al. [14] addressed the problem of complex and variable attack behaviors and dynamic changes of the network structure in the network environment. They constructed a Stackelberg hypergame model to describe the conflict in cyberspace, and derived the game evolution by hierarchical multi-intelligence reinforcement learning to form a dynamic and autonomous defense strategy. Their model can effectively respond to the attacks and reasonably allocate resources, but the game model is constructed based on rational assumptions, which makes it fail to fully reflect the real network attack and defense confrontation environment fully. He et al. [15] tackled the problem that existing deception decision models based on game theory ignore the optimal defense timing. They proposed a deception timing method based on the FlipIt game and Proximal Policy Optimization (PPO). By incorporating discount factors and transfer probabilities, the single-stage FlipIt game was extended to a multi-stage version, designed payoff functions, and the optimal deception timing strategy was solved using the PPO algorithm. However, the model is poorly adapted and migrated, and the scope of application is relatively narrow.
In summary, the analysis and optimization of attack-defense strategies based on game theory models demonstrate that each method can provide theoretical guidance for selecting defense strategies. However, existing methods also have certain limitations. Although the complete information game model is simple to construct, easy to reason and analyze, and simple to calculate and solve, in real-world network attack-defense confrontations, both parties find it difficult to fully understand each other’s information. The game model based on incomplete information takes into account the incomplete information mastery of both attack-defense parties, making them more aligned with real-world network attack-defense processes, but it cannot effectively analyze the relationship between attack-defense behaviors and situation evolution.
Therefore, this paper considers the decision-making behavior of network attack-defense nodes as logically simultaneous decisions, establishes an incomplete information static attack-defense game model, and defines the network attack-defense situation by drawing on infectious disease dynamics theory. Through network zero-day virus attack-defense game experiments, we study the evolution trend of network attack-defense situations under different scenarios. The main contributions are as follows:
• A network attack-defense model is constructed based on incomplete information static game theory, proposing methods for payoff quantification, game equilibrium solution, and determination of strategy confrontation results, which aligns with the information incompleteness in real-world network attack-defense scenarios better.
• Drawing on the theory of infectious disease dynamics, the network attack-defense situation is defined through the density of network nodes, and the five state transition paths of network nodes are analyzed, which helps to explain the evolution of the network attack-defense situation from the perspective of attack-defense behaviors.
• Using the improved SIR model, a simulation model for a network attack-defense game is constructed. It simulated the temporal evolution of network attack-defense situations under different strategy combinations, interference methods, and initial numbers, and proposes recommendations to enhance network defense effectiveness.
The remainder of this paper is organized as follows. Section 2 provides the method of revenue quantification, game equilibrium solution, and determination of strategy confrontation results. Section 3 describes the network attack-defense situation definition and evolution analysis. Section 4 presents the setup of the simulation experiments and the analysis of the results. Section 5 concludes this paper.
2 Construction of Network Attack-Defense Game Model
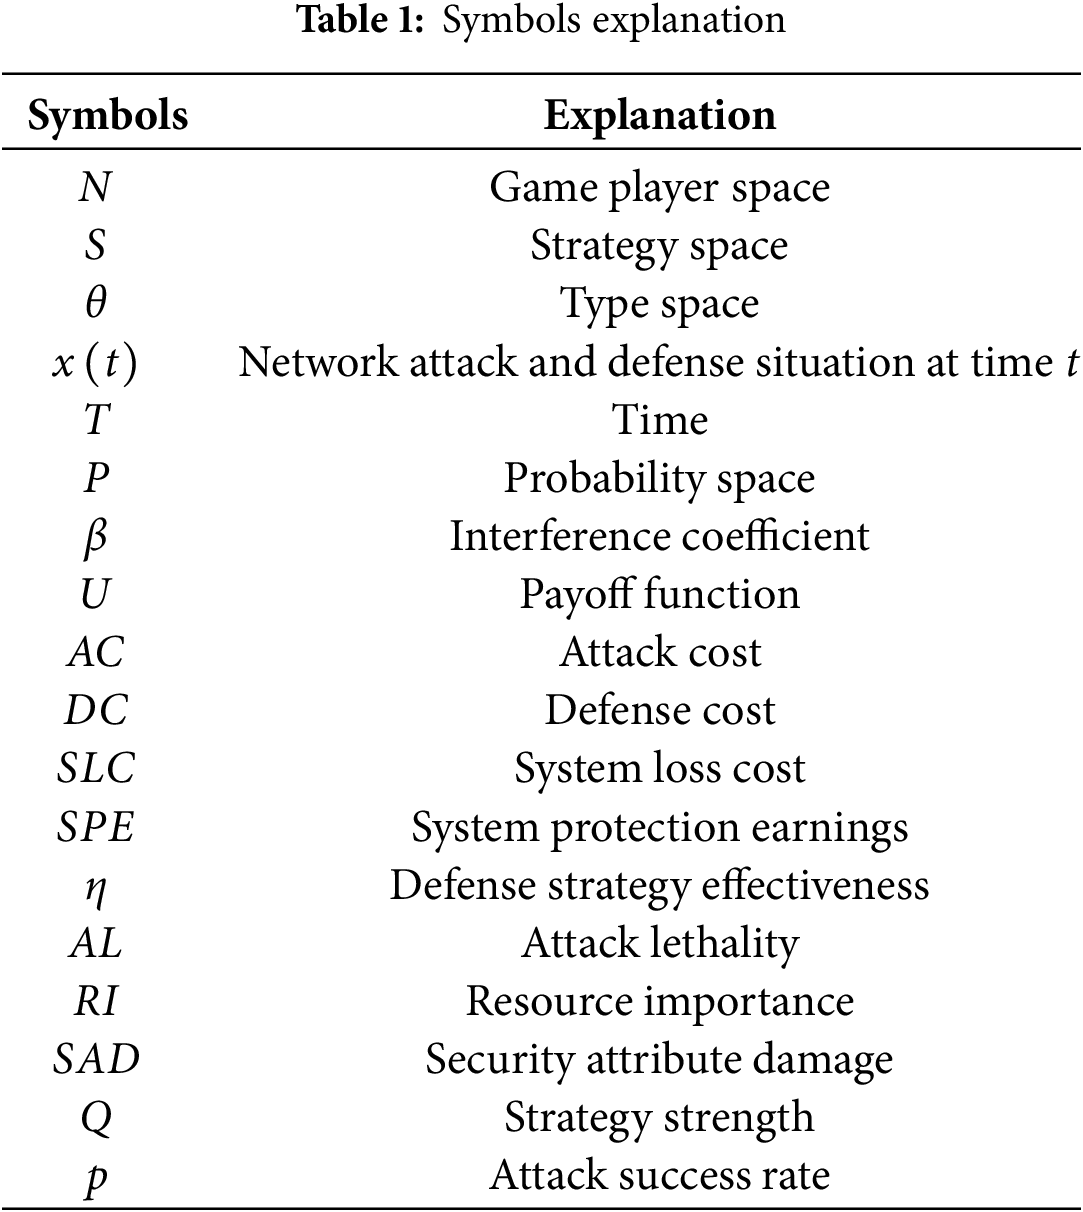
This section describes the construction of the game model used to analyze the evolutionary trend of the network attack-defense situation, which is divided into three main parts: game model definition, game equilibrium solution, and the method for determining attack-defense strategy confrontation results. Before the discussion, in order to facilitate the description, Table 1 lists some of the relevant symbols used in this paper.
In network attack-defense scenarios, the attackers and defenders have completely opposing objectives, resulting in a distinct game structure. This antagonistic relationship makes it difficult for both sides to fully grasp each other’s action strategy information, resulting in both attackers and defenders being constrained by limited rationality. In this environment, the attacker’s attack strategies, attack revenues, and other key information are not visible to the defender. The defender can only analyze the system’s potential vulnerabilities, speculate on the attacker’s possible behaviors, and choose the optimal defense strategy on this basis. Therefore, to effectively construct attack-defense game model, it is generally assumed that both the attacker and the defender are constrained by factors such as capabilities, resources, and preferences. The attack-defense strategies are limited, and both parties aim to maximize their payoffs through appropriate strategy combinations.
Definition 1. The network attack-defense game model (ADGM) can be represented as an eight-tuple,
(1)
(2)
(3)
(4)
(5)
(6)
(7)
(8)
The quantification of attack-defense payoffs is the fundamental basis for equilibrium calculation and inference analysis in game models. To more accurately show the advantages and disadvantages of attack-defense strategies, this paper redefines the quantification of attack cost, defense cost, system loss cost, system protection earnings, and defense strategy effectiveness from the perspective of both attackers and defenders on the basis of existing research [16,17].
Definition 2. Attack cost (AC) refers to the expenses incurred by the attacker in carrying out an attack during the attack-defense process. This includes the cost of creating and deploying zero-day viruses, as well as the penalty incurred when the defender detects the attack.
Definition 3. Defense cost (DC) refers to the expenses incurred by the defender to implement defensive actions for resource protection. This includes the cost of implementing zero-day virus defense strategies and the losses caused by increased system overhead due to taking defensive actions.
Definition 4. System loss cost (SLC) is influenced by the combination of attack-defense strategies, denoted as
Definition 5. System protection earnings (SPE) are influenced by the combination of attack-defense strategies, denoted as
Definition 6. Defense strategy effectiveness
System loss cost
Due to the different implementation costs of the attack-defense strategies, the payoff
ADGM is an incomplete information static game with Bayesian Nash equilibrium, whose existence theorem and proof can be found in the literature [18]. When solving the equilibrium of incomplete information games, the Harsanyi transformation is used to introduce a virtual player, “Nature,” converting the problem into an equilibrium-solving task for a complete but imperfect information game. For the convenience of reasoning and analysis, we assume that the attacker has two types
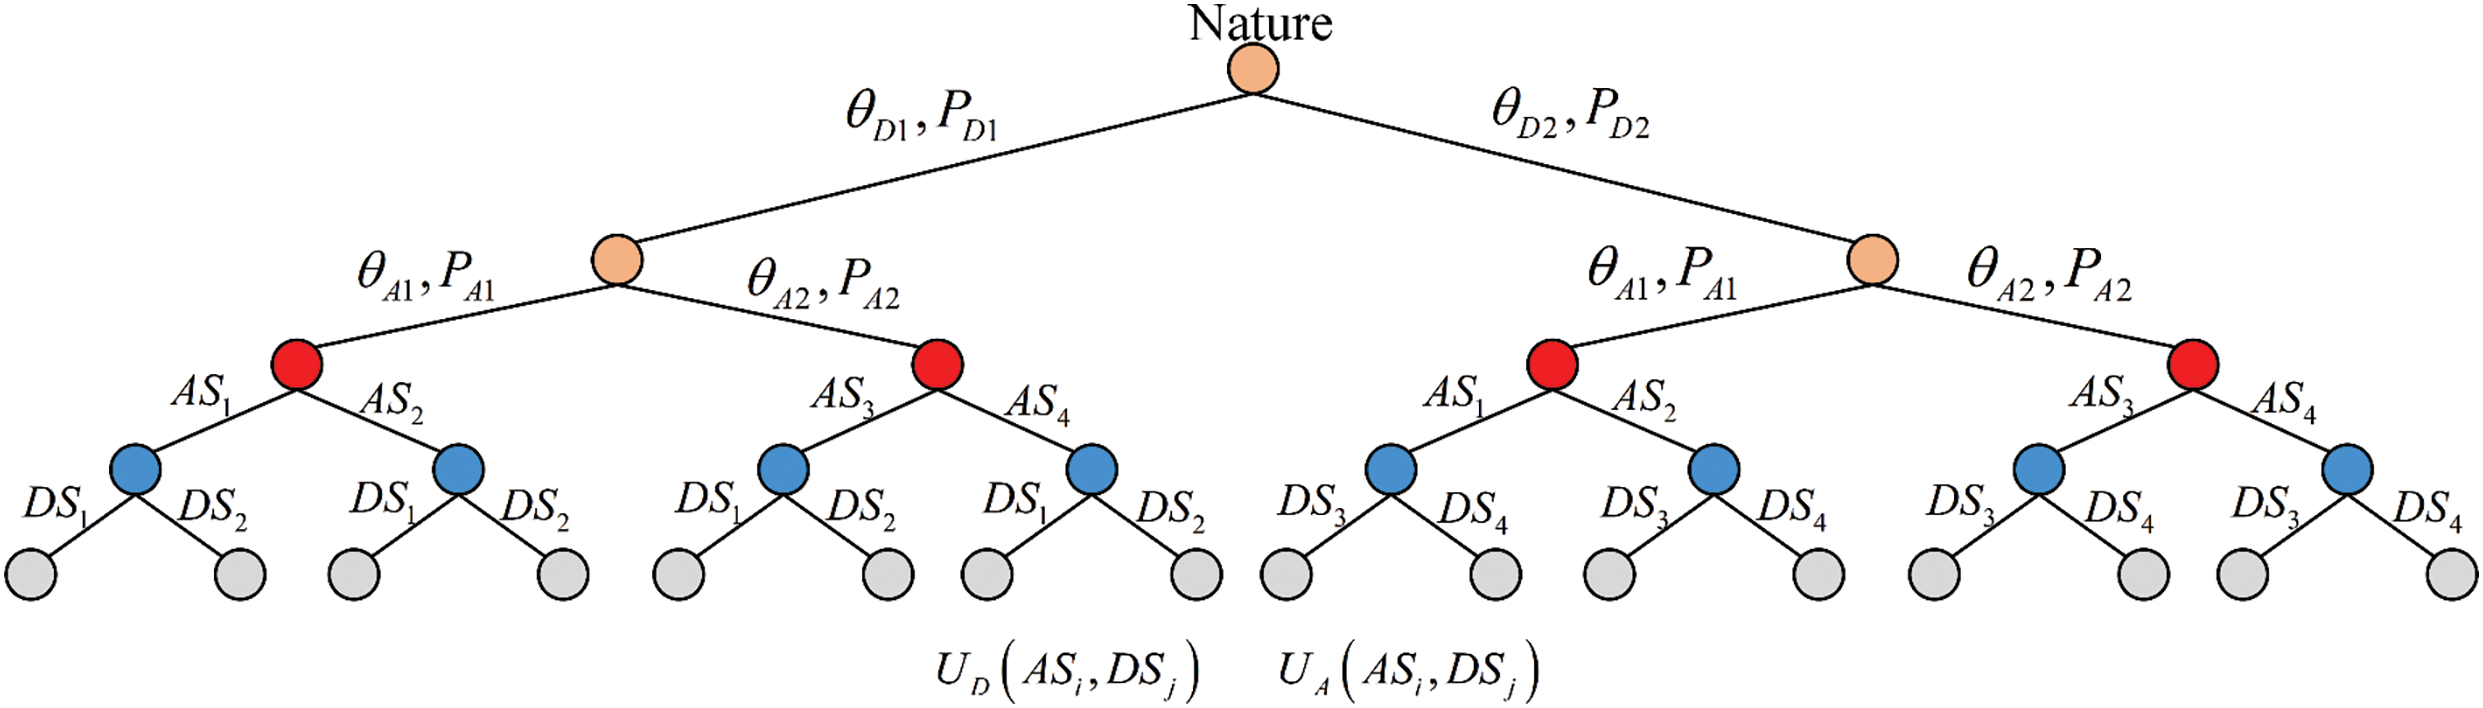
Figure 1: Incomplete information static Bayesian game tree
At time
Similarly, at time
Let
where
Eqs. (3)–(5) are combined to form a system of equations, and the Bayesian Nash equilibrium of the ADGM can be solved using the linear programming method. The equilibrium solution represents the optimal strategy for each party, where no unilateral change in strategy by either party will increase their payoff.
2.3 Determination of Network Attack-Defense Strategy Confrontation Results
Definition 7. The strategy strength
Referring to the common vulnerability scoring system [19], strategy types are categorized based on the strength of attack-defense strategies. According to the attacker’s strategy strength, they are classified into two categories, i.e., strong attack and weak attack, denoted as
Considering that the defender typically use active defense strategies to disrupt attackers’ actions and reduce their success rates. When the interference coefficient
Based on the defender’s strategy strength, their strategy type are classified into two categories, i.e., strong defense and weak defense, denoted as
Definition 8. The attack success rate
3 Network Attack-Defense Situation Definition and Evolution Analysis
Emergence is a natural attribute of network security. Qu et al. [20] pointed out that epidemic models and agent-based simulations are effective methods for studying the emergence of network security. The SIR model is a classic infectious disease model, which is mainly used to analyze the propagation patterns of infectious diseases within a population. The main reason why the infectious disease model is suitable for modeling network attacks is the similarities between the two in terms of propagation characteristics and state transitions. (1) In terms of propagation characteristics, infectious diseases spread through inter-individual contact or other means, whereas network attacks spread through the network via connections between nodes, and infected nodes can become new sources of propagation and continue to trigger spread. (2) In terms of state transitions, infectious individuals undergo a process from susceptibility to infection to recovery, while network nodes undergo a process from susceptibility (vulnerable nodes) to infection to immunity. These similarities enable the infectious disease model to effectively simulate network attack-defense behaviors, predict the spread of attacks, and provide an important reference for the development of network attack prevention and control strategies. While Markov chains and stochastic processes can describe the state transfer of a system, they often fail to reflect the complexity and diversity behind the transfer. In contrast, the susceptible-infected-removal-damaged (SIRD) model portrays the security state evolution of network nodes more comprehensively by introducing multiple security state nodes (e.g., susceptible, infected, removal, and damaged states) and their transfer paths. For example, in a case of an attack on an enterprise network, some employees initially clicked on a malicious link in a phishing email (corresponding to a susceptible state node contacting the source of the infection), which resulted in some of the computers within the enterprise entering the infected state. As the attack continued, the enterprise security team deployed firewalls and intrusion detection systems (corresponding to the defense policy), and some of the infected nodes were quarantined or repaired and transferred to the immune state. However, some new attacks (e.g., zero-day vulnerability attacks) cause repaired nodes to be infected again (similar to removal state nodes changing back to susceptible state due to virus mutation), and some nodes with failed defense suffer data leakage or system corruption (enter the damaged state). The above modeling approach not only better fits the complex dynamics of actual network attack and defense scenarios, but also more accurately predicts the scope and trend of attack propagation. The SIR model, Markov chains, and stochastic process comparison are presented in Table 2.
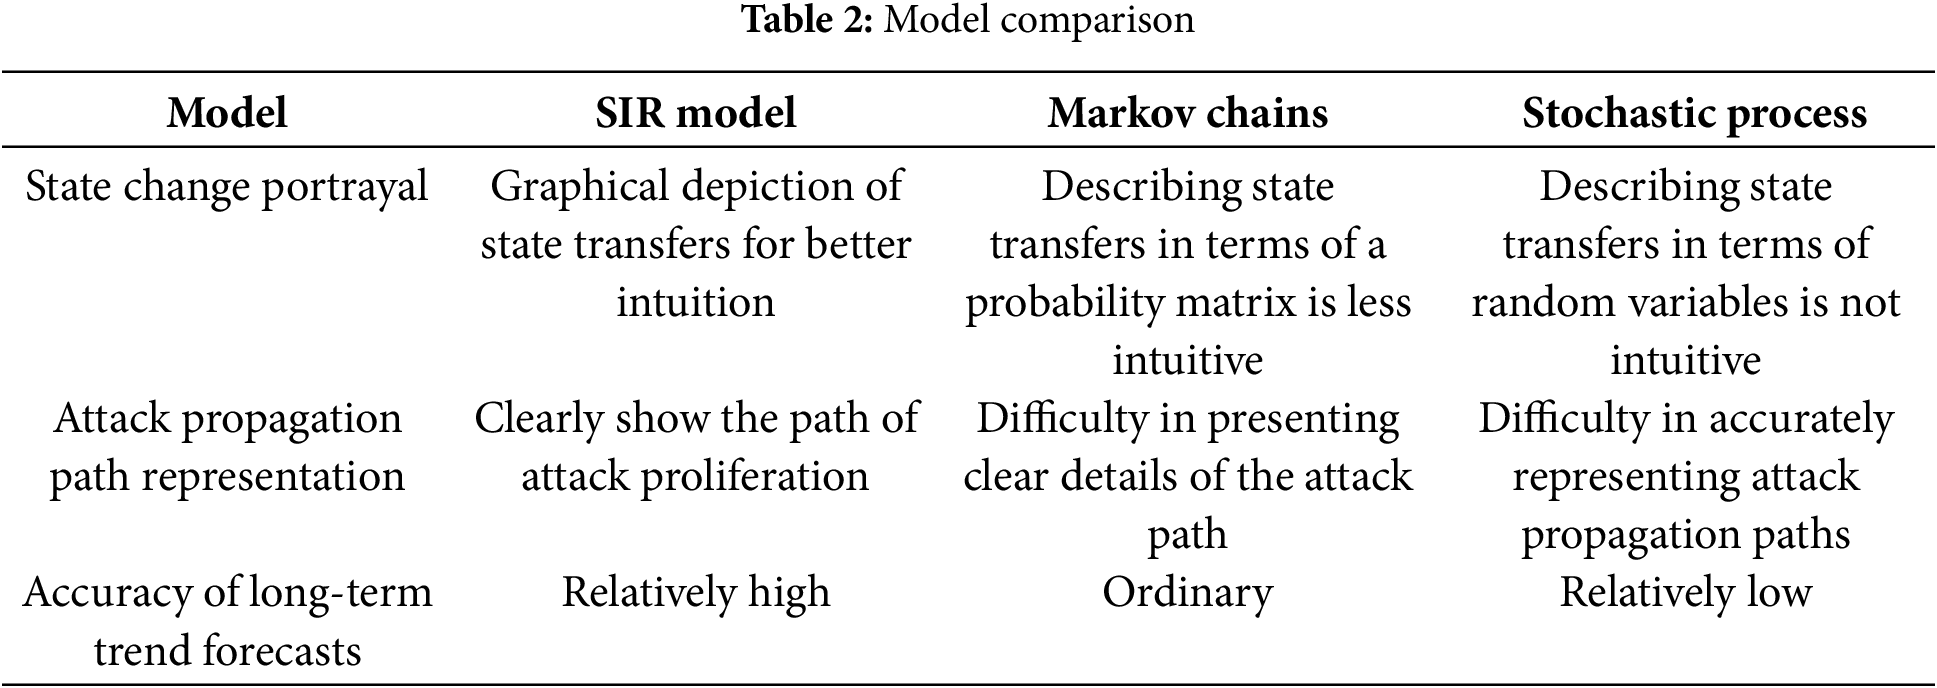
The SIR model has been used to some extent in the area of cybersecurity research. For example, Wang et al. [21] constructed a “Two-go and One-live” type virus propagation model based on the susceptible-infected-removed-susceptible (SIRS) information diffusion model, analyzed the stability of equilibrium points by applying the Routh-Hurwitz stability criterion, and provided countermeasure suggestions to enhance network defense capabilities. Liu et al. [22] established a susceptible-exposed-infected-removal (SEIR) propagation model with mutant viruses based on the infectious disease model. By determining the optimal control variable pair for the repair rates of infected and mutant nodes, the optimal control strategy was proposed. Tang et al. [23] proposed a susceptible-latent-breaking-recovered-susceptible (SLBRS) virus propagation model for scale-free network topology features based on the infectious disease model and gave the optimal control strategy by analyzing the global stability under virus-free equilibrium.
During the confrontation process, the attacker attempts to expand the attack range by deploying the attack strategy to more nodes, and the defender attempts to protect the normal service of network nodes by deploying defense strategies to more nodes. From the emergence perspective, micro-level network attack-defense game behaviors cause changes in network node states, thereby influencing the evolution of network attack-defense situations at the macro-level. In a network system composed of numerous nodes, attack-defense confrontations primarily cause two changes. (1) The security state of individual network nodes changes continuously. (2) The number of network nodes in different security states undergoes ongoing dynamic changes. According to the mechanism of action of network viruses, the zero-day virus propagation process consists of four stages, i.e., susceptibility, virus propagation, virus repair, and damage. Therefore, based on the SIR model, the damaged state is introduced to propose the SIRD model, which defines four types of network node states, i.e., susceptible state
In network attack-defense research, it is generally assumed that the studied network system is fixed, with a constant number of nodes denoted as N. The network attack and defense games can cause node security state transitions and dynamic changes in the number of different types of nodes, but regardless of how the network nodes transition and change, the total number of nodes in the four types of security status at the time
Network node density refers to the proportion of a certain type of node to the total number of nodes. The higher the density of network nodes, the more dominant that type of node is in network attack-defense confrontations. The density of different types of nodes reflects their distribution in the network system at a specific moment, characterizing the network attack-defense situation.
Definition 9. The network attack-defense situation at time
The network nodes in different states are regarded as intelligent agents, respectively, and the phenomenon of network attack-defense situation evolution at the macro level is analyzed through the micro level network attack-defense game behaviors. In the zero-day virus attack-defense situation simulation, the node’s behavior rules are set based on the real network attack-defense scenarios, aiming to simulate the node’s state changes under the effect of attack-defense strategies. Due to the game behaviors between attackers and defenders, the SIRD model has five node security state transition paths, as shown in Fig. 2.
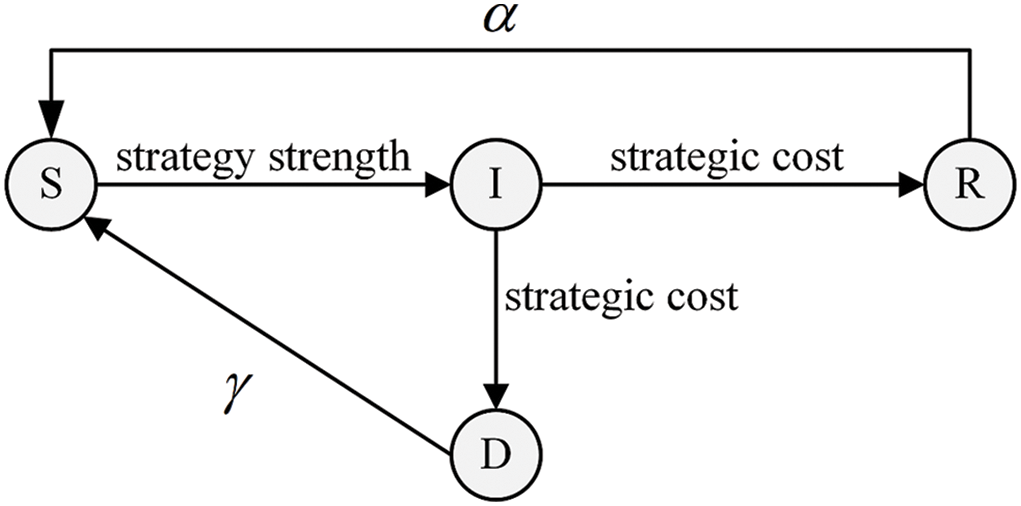
Figure 2: Node security state transition path
4 Simulation Analysis of Network Zero-Day Virus Attack-Defense Cases
4.1 Analysis of Network Zero-Day Virus Attack-Defense Behavior
The zero-day virus is one of the frequently appearing forms of network attacks in recent years, with significant impacts including WannaCry, Bash Shellshock, Log4Shell, and Spring4Shell. The zero-day viruses first use common viruses such as Trojans and worms to hide malicious code for illegal activities and implant it into the target host. Then, they exploit zero-day vulnerabilities to self-replicate and spread to other target hosts. Once a host is infected, attackers can remotely execute malicious code, steal or destroy data, and even take full control of the system. Unlike traditional viruses, zero-day viruses exhibit diverse types, rapid mutation rates, complex propagation mechanisms, strong concealment, and high destructiveness. If defense measures are not updated promptly, it is difficult to defend against them effectively. Therefore, preventing zero-day viruses requires efforts from both technical and management aspects, defense measures include real-time patch updates, vulnerability fixes, strengthening authentication and audit processes, and establishing comprehensive emergency response plans. This paper takes zero-day viruses as an example, constructs the ADGM, and analyzes network attack-defense behaviors.
In the zero-day virus game model, the participants are the zero-day virus attacker


Based on the zero-day virus attack-defense practice, the importance of the resources attacked by
Based on historical data and regression analysis, combined with the experience of security experts, the defense payoff
4.2 Network Zero-Day Virus Attack and Defense Situation Simulation
The network information system consists of numerous nodes, and the attack-defense game behaviors of a single node makes it difficult to effectively show the overall network attack-defense situation, simulation is an effective way to solve the problem. NetLogo is an open-source multi-agent simulation tool capable of simulating intelligent interaction behaviors among numerous nodes simultaneously. In the field of cybersecurity, there are many researches on the characteristics of virus propagation, according to the possibility that the zero-day virus may have behavior such as mutation or user updating the system in the process of spreading, the simulation experiment sets the transformation rate from removal node to susceptible node
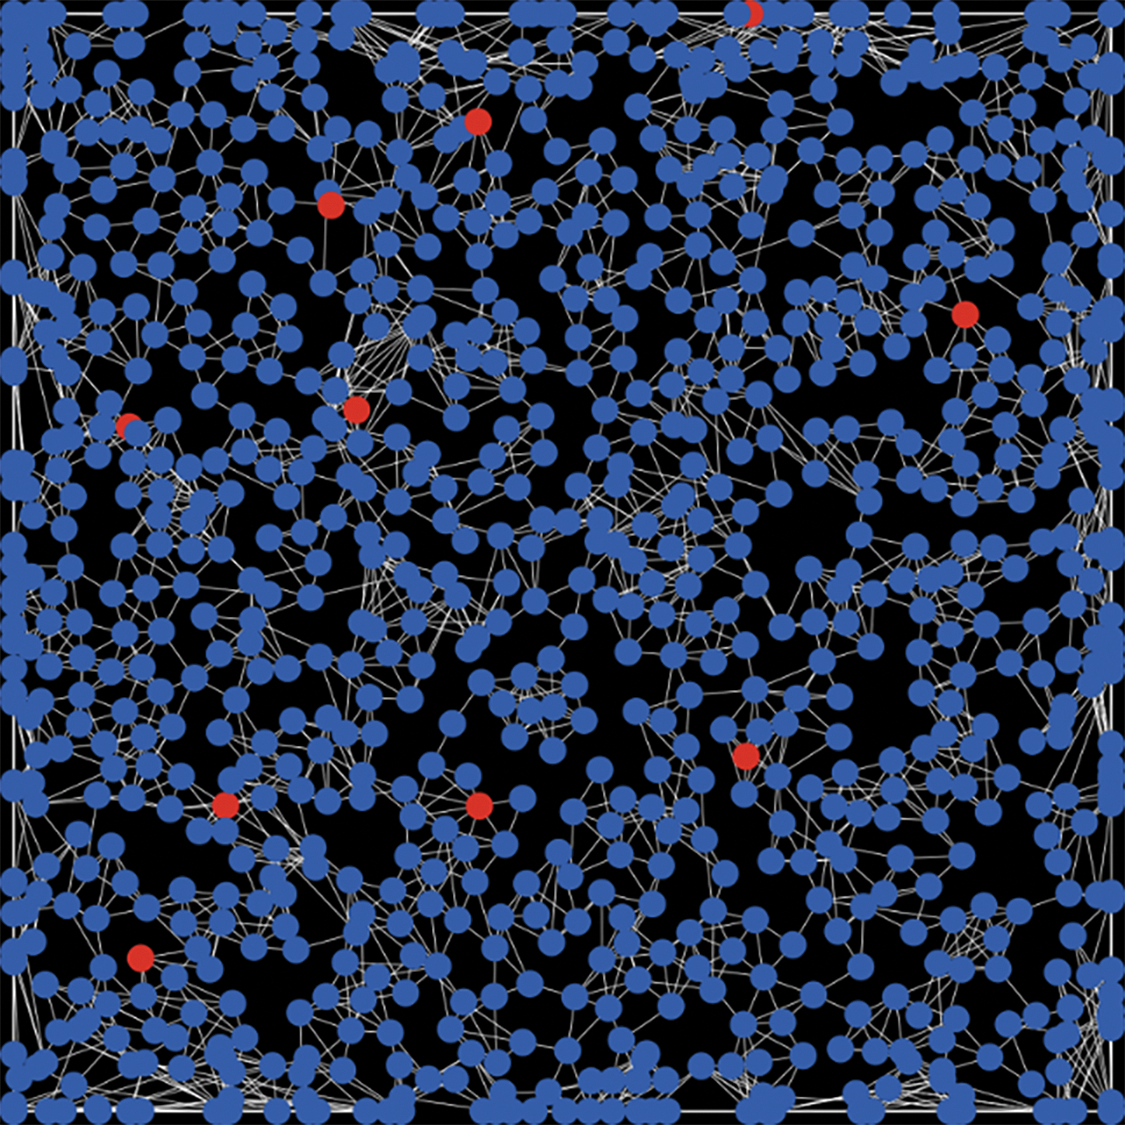
Figure 3: Initial main interface
By setting different simulation parameters, we can dynamically simulate the evolution trend of attack-defense situations over time in scenarios with different strategy combinations, different interference methods, and different initial numbers. When the count of infected nodes in the network system is zero, the count of damaged nodes cannot intuitively reflect the attack-defense situation, while the density of damaged nodes can display attack-defense status at a specific moment. Therefore, the density of damaged nodes is defined as the network destruction rate.
4.2.1 Simulation Experiments on the Impact of Strategy Selection on Attack-Defense Situation
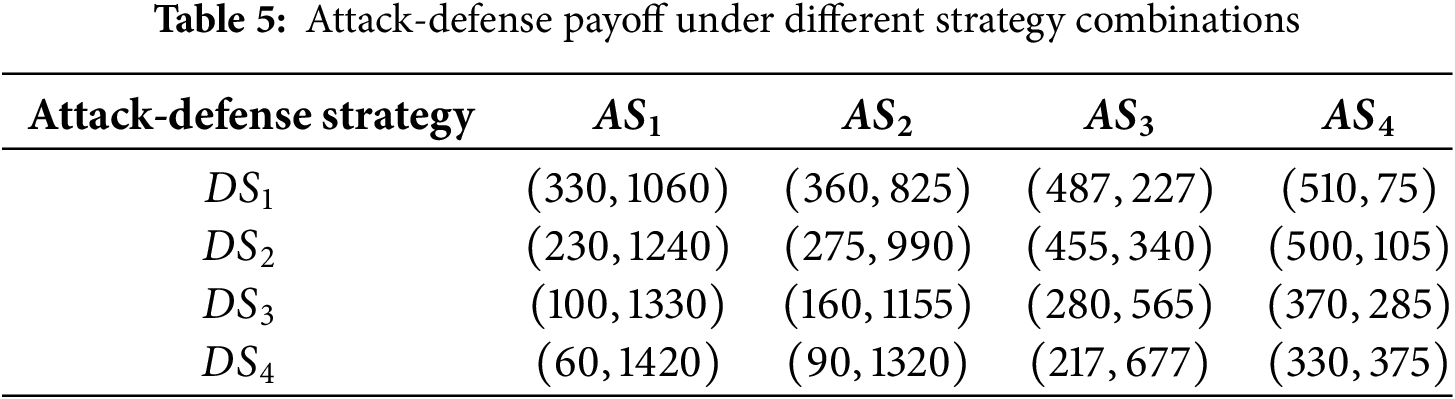
Scenario 1: When the selection probabilities of attack and defense strategies are
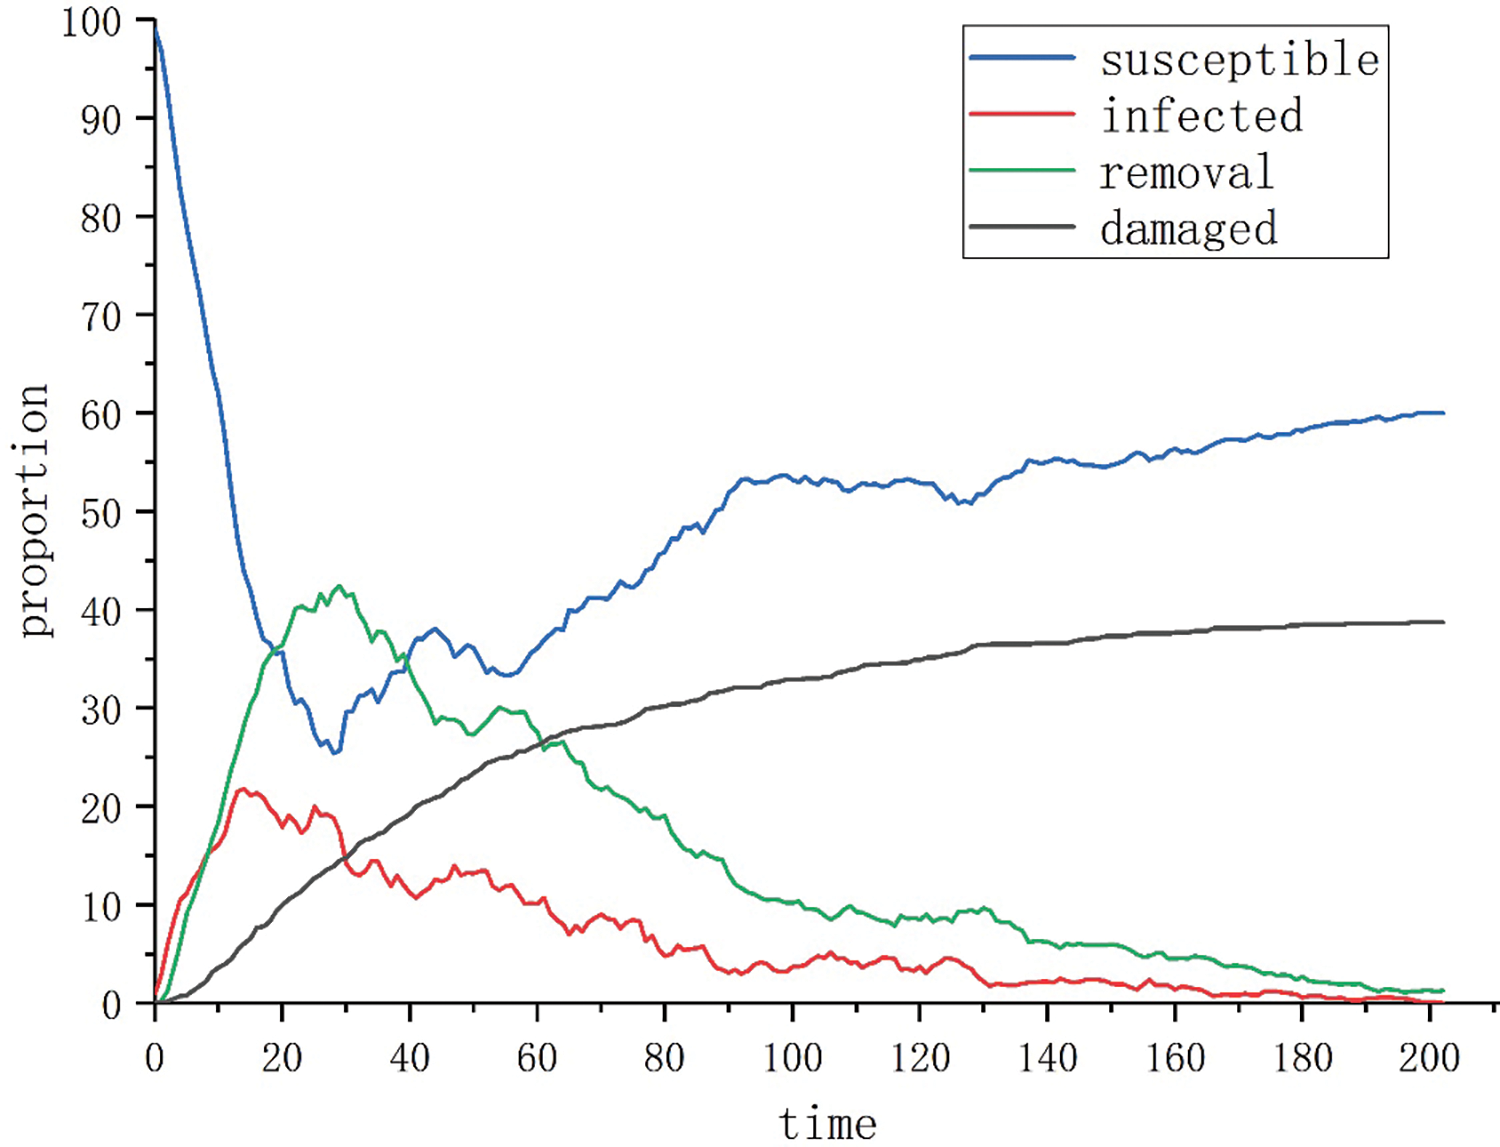
Figure 4: Evolution of the attack-defense situation when
Scenario 2: When the selection probabilities of attack and defense strategies are
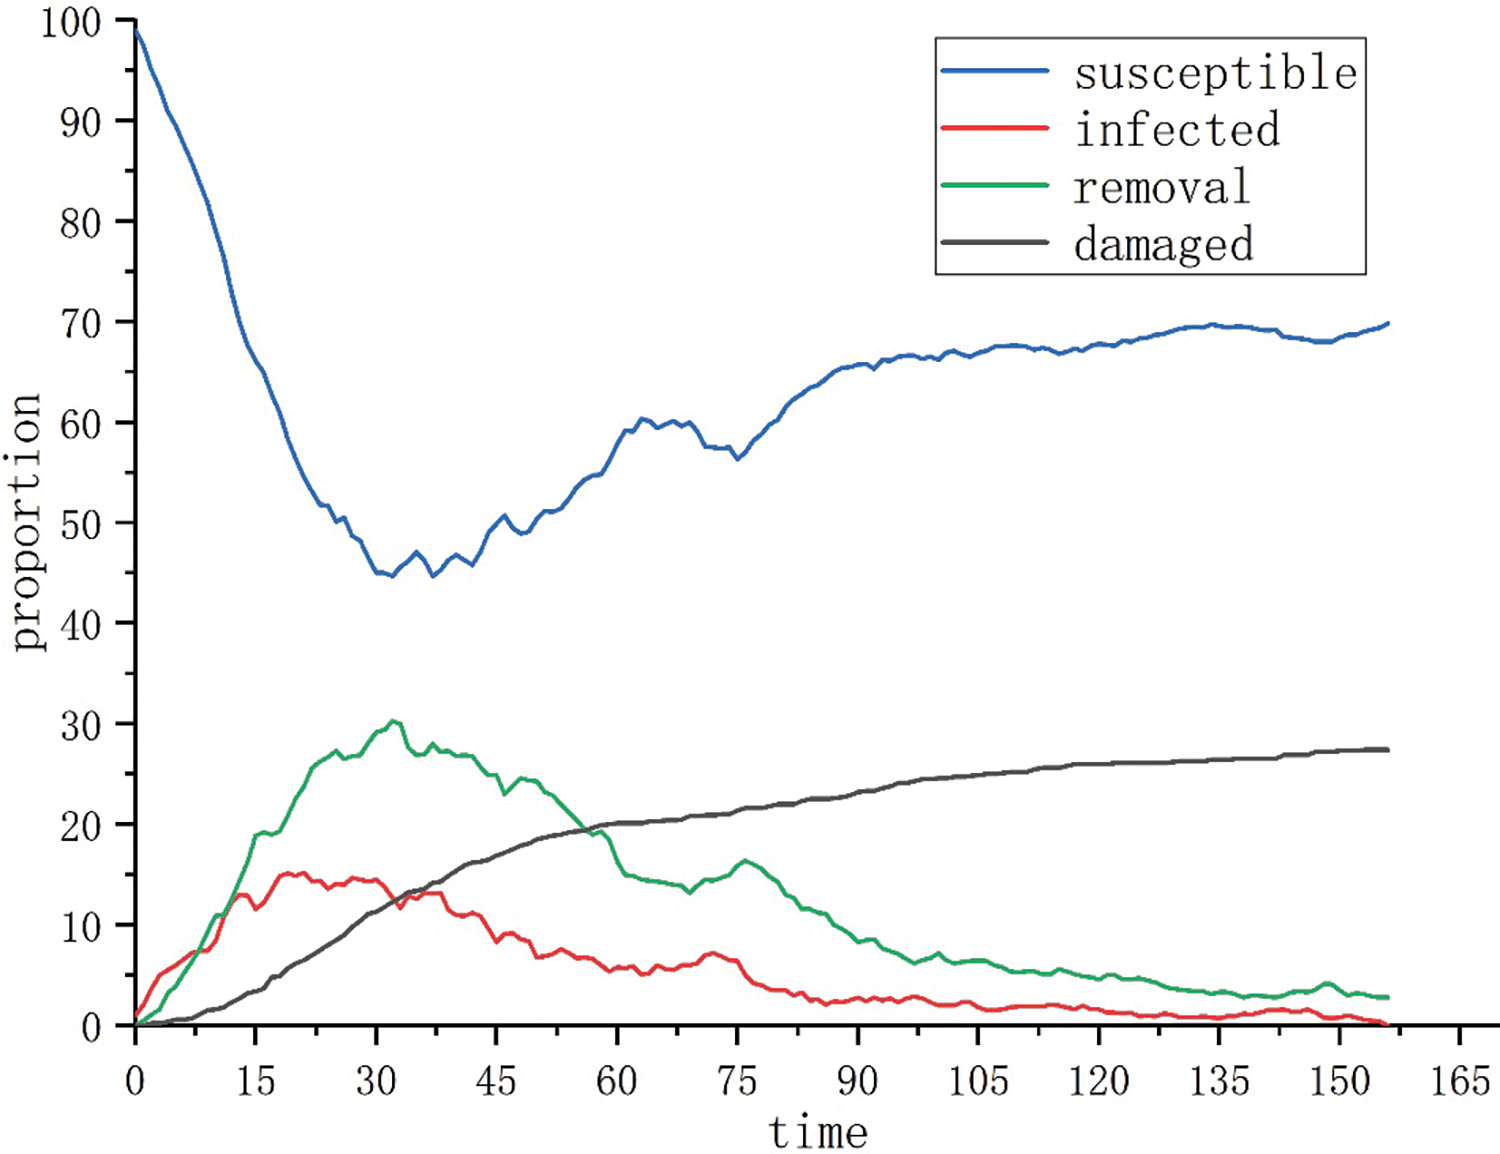
Figure 5: Evolution of the attack-defense situation when
4.2.2 Simulation Experiments on the Impact of Active Defense on the Attack-Defense Situation
Scenario 3: For the comparison experiment, the attacker and defender’s strategy selection probabilities follow the setting of Scenario 1. In this case, the defender employs a weak active defense strategy by releasing false signals to disrupt with the attacker’s judgment, with the interference coefficient
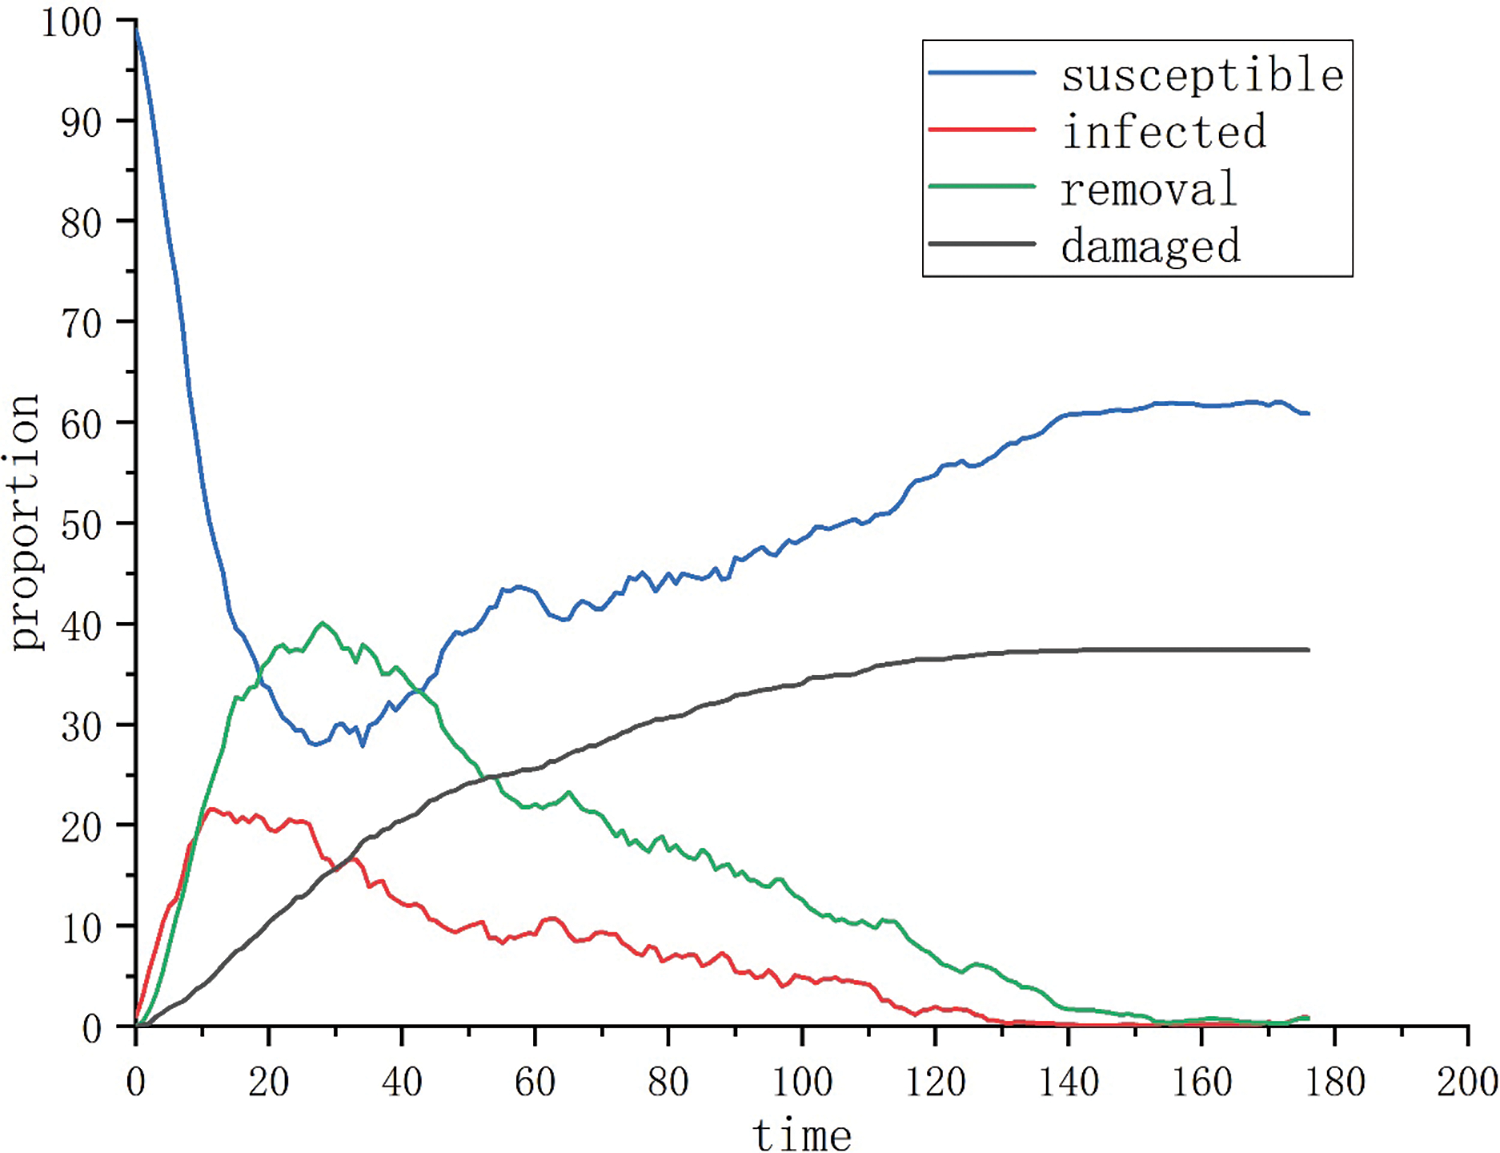
Figure 6: Evolution of the attack-defense situation when
Scenario 4: The attacker and defender’s strategy selection probabilities follow the setting of Scenario 1. In this case, the defender opts for a strong active defense strategy, dynamically adjusting the attack surface to reduce the success rate of the attacker, with the interference coefficient
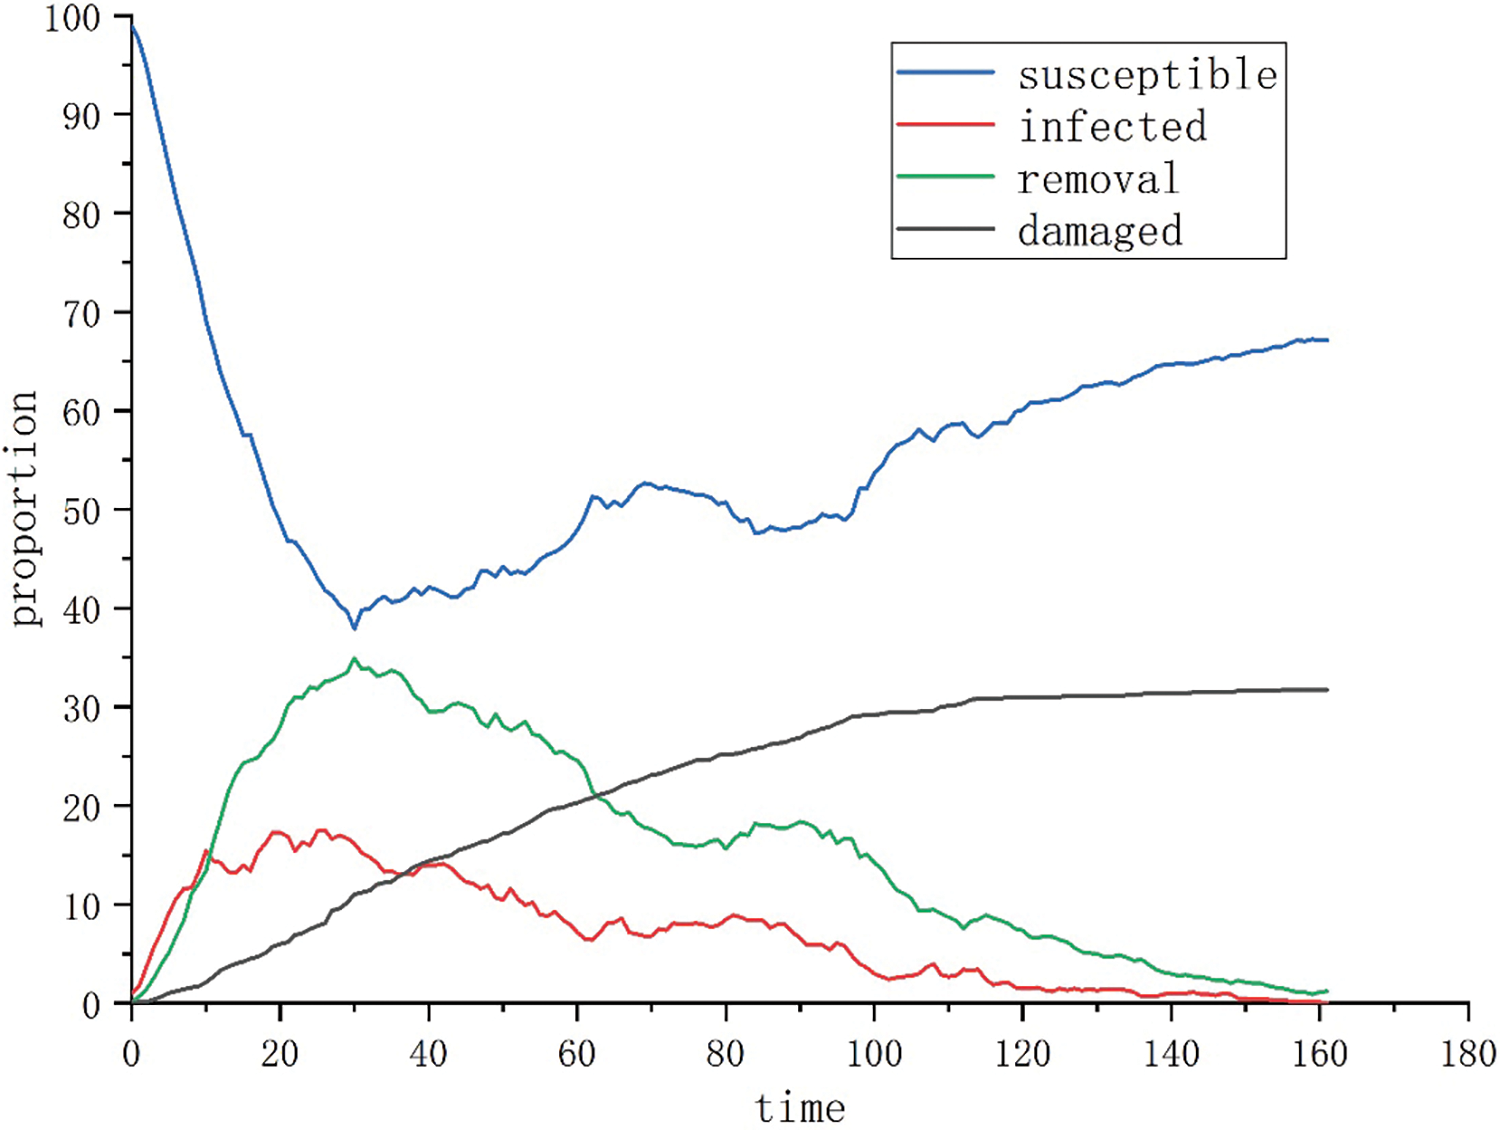
Figure 7: Evolution of the attack-defense situation when
4.2.3 Simulation Experiment on the Impact of the Initial Number of Nodes in Different States on the Attack-Defense Situation
Scenario 5: For the control experiment, the control variable method is adopted, the attacker and defender’s strategy selection probabilities follow the setting of Scenario 1, and the initial number of infected state

Figure 8: Evolution of the attack-defense situation when
Scenario 6: The attacker and defender’s strategy selection probabilities follow the setting of Scenario 1, and the initial number of infected state
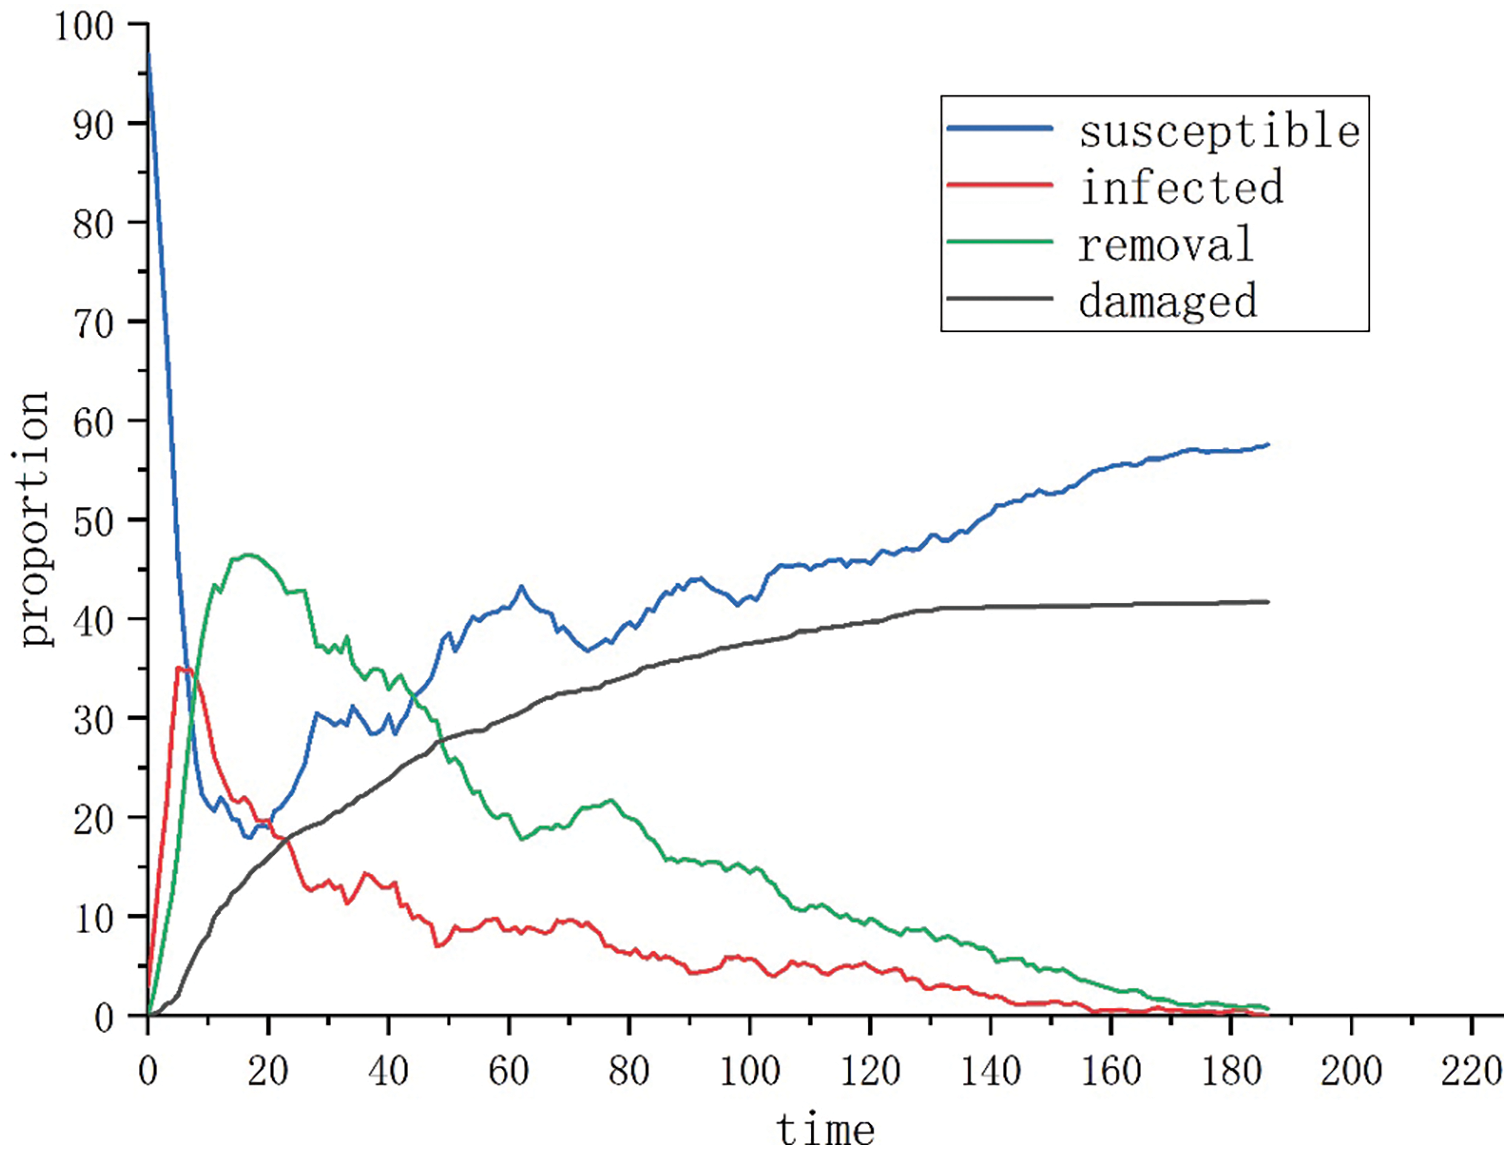
Figure 9: Evolution of the attack-defense situation when
4.3 Simulation Results Analysis
By analyzing the simulation results in the different scenarios mentioned above, the following three countermeasure suggestions to enhance network defense effectiveness can be obtained:
(1) Strengthening the defense capabilities of individual nodes is crucial to reversing the network attack-defense situation. Comparing the experimental results of Scenario 1 and Scenario 2, when
(2) Utilizing active defense technologies can effectively reduce the network destruction rate. Comparing the experimental results of Scenarios 1, 3, and 4, when the interference coefficient
(3) The initial number of infected nodes will affect the macro-level evolution trend of the network attack-defense situation. Comparing the experimental results of Scenario 1, Scenario 5, and Scenario 6, the higher the initial number of infected nodes, the more unfavorable the attack-defense scenarios are to the defender, while the overall number of nodes remains the same. When the initial infected node
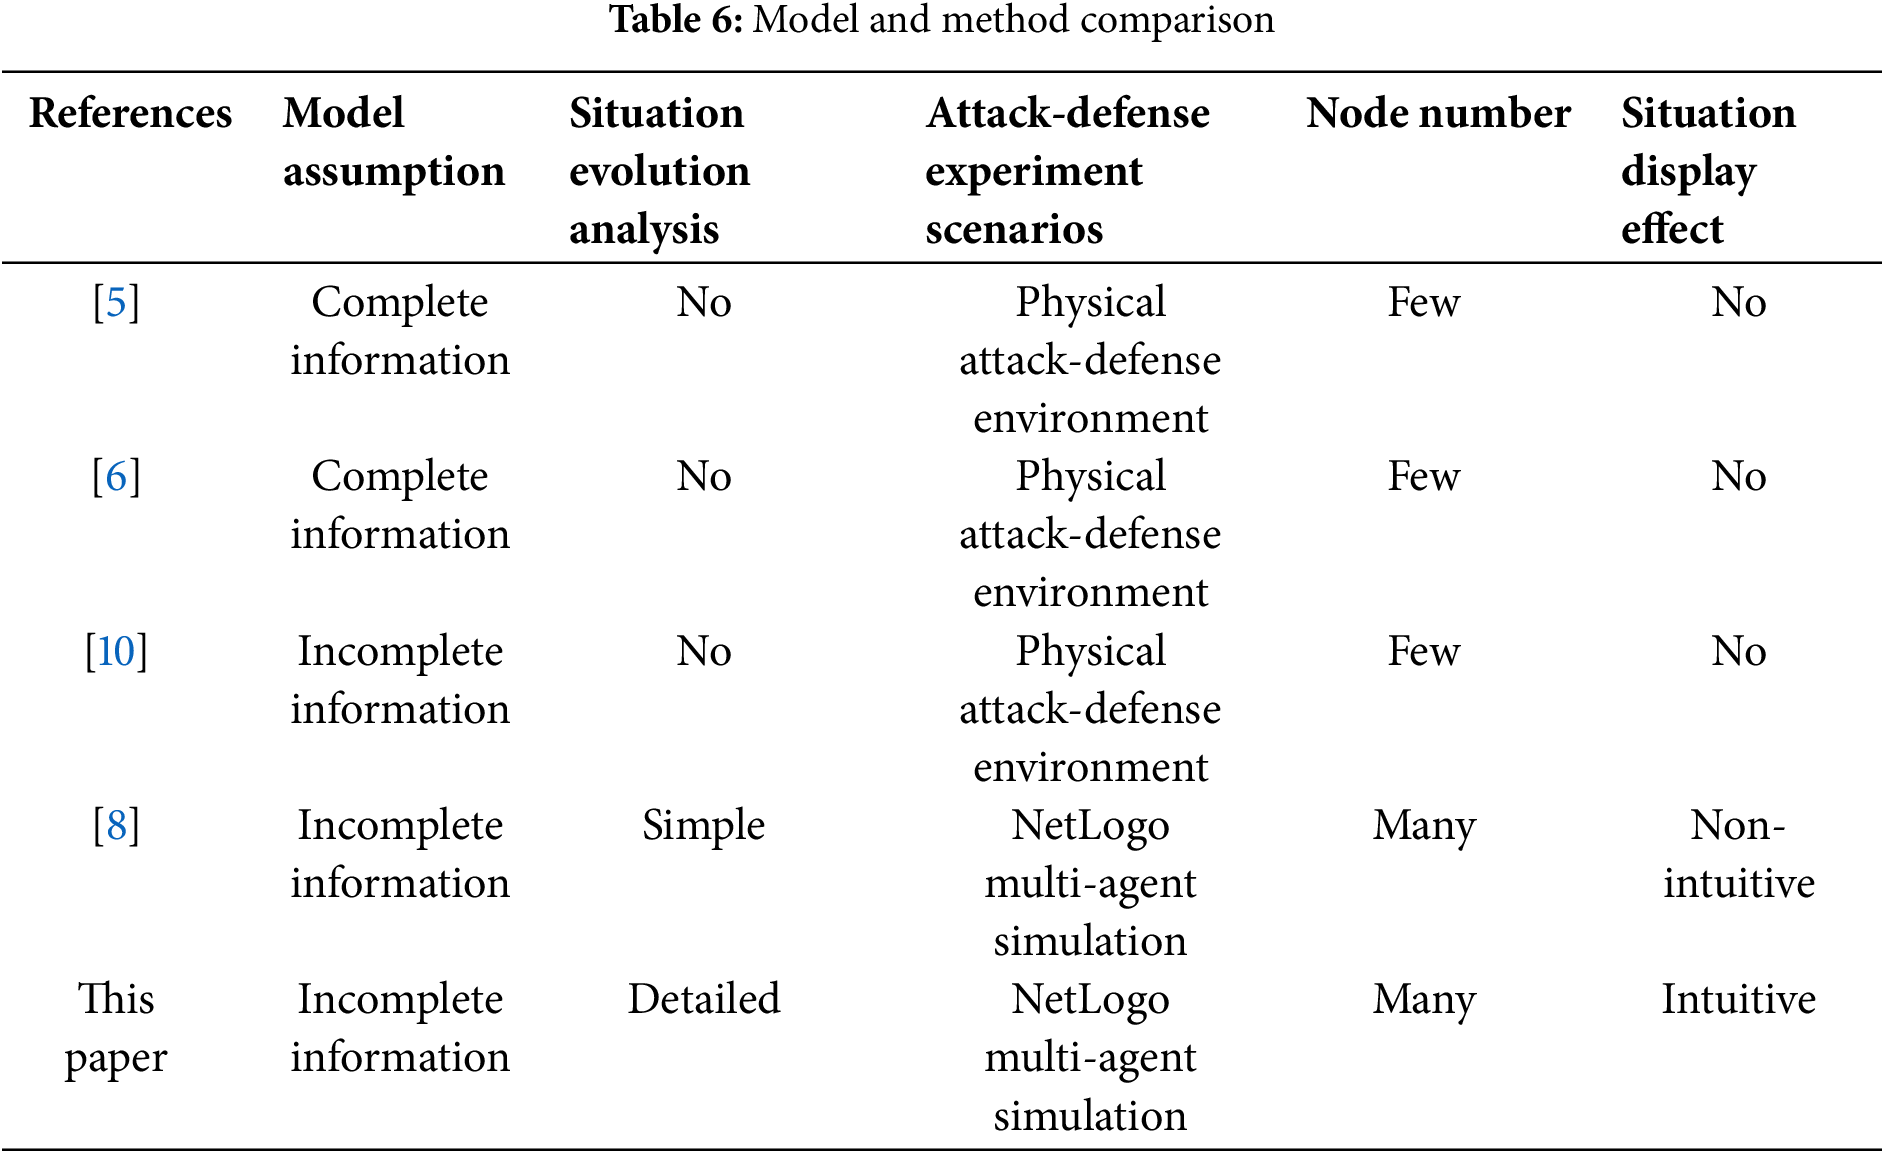
The model and methodology of this paper are compared with the relevant references, as shown in Table 6. The following can be seen:
(1) In terms of model assumptions, the literatures [5,6] are based on the complete information assumption. However, in real-world network attack-defense scenarios, the information on both sides is uncertain. This paper adopts the assumption of incomplete information, making it more aligned with the realities of network attack-defense.
(2) In the analysis of situation evolution, the literature [8] models the attacker and defender as agents and represents the network attack-defense situation through the number of agents. However, this method lacks intuitive visualization. Drawing on the theory of infectious disease dynamics, this paper defines the network attack-defense situation based on the density of network nodes in various security states, providing a more intuitive representation of situational evolution.
(3) In terms of attack-defense experimental scenarios, the literatures [5,6,10] all use physical attack and defense environments with a few number of nodes, strong subjectivity, and a large amount of calculation. This paper uses the NetLogo multi-agent body simulation tool to simulate the evolutionary trend of network attack-defense situations over time. With numerous nodes and low computational requirements, it is well-suited for large-scale scenarios.
With the development of 5G networks, the frequency of cybersecurity incidents has increased, and traditional passive defense is unable to meet the ever-changing cybersecurity needs. Modeling methods can effectively analyze network attack-defense processes and improve network defense capabilities. However, existing network attack-defense models lack the analysis of the relationship between micro-level attack-defense game behaviors and macro-level network attack-defense situations from the game perspective. To address these issues, this paper proposes a network attack -defense game model (ADGM), proposes the SIRD model which introduces the damage state node based on the SIR model, defines the network attack-defense situation by the density of different security state nodes, analyzes the network node security state transition paths by the game results which are used to analyze the network attack-defense situation evolution phenomenon from the network attack-defense behavior level, conducts experiments on the evolution trends of network attack-defense situations over time in different scenarios were using the NetLogo multi-agent simulation tool, and finally provides recommendations for enhancing network defense effectiveness by analyzing and summarizing the experimental results.
Based on the above theoretical modeling, although our method can effectively analyze the evolution trend of network attack-defense situations, it still has the following limitations: firstly, the assumption of static strategy space fails to adequately reflect the actual network environment; secondly, the computational complexity of the Bayesian Nash equilibrium in large-scale network systems has not yet been effectively addressed. To address the above limitations, future work will introduce Asynchronous Advantage Actor-Critic (A3C) technology. A3C combines the advantages of policy gradient and value function, enabling agents to dynamically adjust attack and defense strategies according to changes within network conditions. Additionally, approximation algorithms and distributed computing techniques will be employed to enhance computational efficiency by decomposing large-scale computational tasks into smaller sub-tasks that can be processed in parallel.
Acknowledgement: The authors would like to express their heartfelt gratitude to the editors and reviewers for their detailed review and insightful advice.
Funding Statement: This research is supported by the Major Science and Technology Programs in Henan Province (241100210100), the National Natural Science Foundation of China (62072416), the Key Research and Development Special Project of Henan Province (221111210500), and the Project of Science and Technology in Henan Province (242102211068, 232102210078).
Author Contributions: The authors confirm contribution to the paper as follows: Study conception and design: Haiyan Sun, Chenglong Shao; data collection: Jianwei Zhang; analysis and interpretation of results: Kun Wang, Wanwei Huang; draft manuscript preparation: Chenglong Shao. All authors reviewed the results and approved the final version of the manuscript.
Availability of Data and Materials: The data that support the findings of this study are available from the corresponding authors upon reasonable request.
Ethics Approval: Not applicable.
Conflicts of Interest: The authors declare no conflicts of interest to report regarding the present study.
References
1. Liu L, Tang C, Zhang L, Liao S. A generic approach for network defense strategies generation based on evolutionary game theory. Inf Sci. 2021 Aug;677(3):120875. doi:10.1016/j.ins.2024.120875. [Google Scholar] [CrossRef]
2. Zhang H, Mi Y, Liu X, Zhang Y, Wang J, Tan J. A differential game approach for real-time security defense decision in scale-free networks. Comput Netw. 2023 Apr;224(10):109635. doi:10.1016/j.comnet.2023.109635. [Google Scholar] [CrossRef]
3. Jin H, Zhang S, Zhang B, Dong S, Liu X, Zhang H, et al. Evolutionary game decision-making method for network attack and defense based on regret minimization algorithm. J King Saud Univ-Comput Inf Sci. 2023 Mar;35(3):292–302. doi:10.1016/j.jksuci.2023.01.018. [Google Scholar] [CrossRef]
4. Tan J, Jin H, Zhang H, Zhang Y, Chang D, Liu X, et al. A survey: when moving target defense meets game theory. Comput Sci Rev. 2023 May;48(7):100544. doi:10.1016/j.cosrev.2023.100544. [Google Scholar] [CrossRef]
5. Sun Q, Gao L, Liu T, Yao J, Zhang J, Wang H. Defense decision-making method for multi-path combined attack based on non-zero-sum game. Nat Sci Ed. 2019;49(3):343–50. doi:10.16152/j.cnki.xdxbzr.2019-03-003. [Google Scholar] [CrossRef]
6. Chowdhary A, Sengupta S, Alshamrani A, Huang D, Sabur A. Adaptive MTD security using markov game modeling. In: 2019 International Conference on Computing, Networking and Communications (ICNC); 2009; Honolulu, HI, USA: IEEE; p. 577–81. doi:10.1109/ICCNC.2019.8685647. [Google Scholar] [CrossRef]
7. Wang Z, Lu Y, Li X. Military information network security risk assessment based on attack and defense game. Military Operat Res Syst Eng. 2019;33(2):35–40. [Google Scholar]
8. Liu X, Zhang H, Zhang Y, Ma Z, Lu W. Research on network attack and defense situation based on game theory model and NetLogo simulation. J Syst Simulat. 2020;32(10):1918–26. doi:10.16182/j.issn1004731x.joss.20-fz0290. [Google Scholar] [CrossRef]
9. Yi N, Xu J. Defense strategy selection based on incomplete information game for the false data injection attack. Int J Syst Sci. 2024 Oct;55(14):2897–2913. doi:10.1080/00207721.2024.2363546. [Google Scholar] [CrossRef]
10. Yan B, Jiang Z, Yao P, Yang Q, Li W, Zomaya AY. Game theory based optimal defensive resources allocation with incomplete information in cyber-physical power systems against false data injection attacks. Prot Control Mod Power Syst. 2024 Mar;9(2):115–27. doi:10.23919/PCMP.2023.000138. [Google Scholar] [CrossRef]
11. Gao Q, Wu H, Zhang Y, Tao X. Differential game-based analysis of multi-attacker multi-defender interaction. Sci China Inf Sci. 2021 Dec;64(12):222302. doi:10.1007/s11432-020-3228-8. [Google Scholar] [CrossRef]
12. He W, Tan J, Guo Y, Shang K, Zhang H. A deep reinforcement learning-based deception asset selection algorithm in differential games. IEEE Trans Inform Forensic Secur. 2024;19(2):8353–68. doi:10.1109/TIFS.2024.3451189. [Google Scholar] [CrossRef]
13. Zhang H, Mi Y, Fu Y, Liu X, Zhang Y, Wang J, et al. Security defense decision method based on potential differential game for complex networks. Comput Secur. 2023 Jun;129(1):103187. doi:10.1016/j.cose.2023.103187. [Google Scholar] [CrossRef]
14. Tang Y, Sun J, Wang H, Deng J, Tong L, Xu W. A method of network attack-defense game and collaborative defense decision-making based on hierarchical multi-agent reinforcement learning. Comput Secur. 2024 Jul;142(3):103871. doi:10.1016/j.cose.2024.103871. [Google Scholar] [CrossRef]
15. He W, Tan J, Guo Y, Shang K, Kong G. Flipit game deception strategy selection method based on deep reinforcement learning. Int J Intell Syst. 2023 Sep;2023(1):1–15. doi:10.1155/2023/5560416. [Google Scholar] [CrossRef]
16. Huang S, Zhang H, Wang J, Huang J. Markov differential game for network defense decision-making method. IEEE Access. 2018;6:39621–34. doi:10.1109/ACCESS.2018.2848242. [Google Scholar] [CrossRef]
17. Sun Y, Ji W, Weng J, Zhao B, Li Y, Wu X. Selection of optimal strategy for moving target defense based on signal game. In: Proceedings of the 2020 International Conference on Cyberspace Innovation of Advanced Technologies; 2020 Dec; Guangzhou, China: ACM. p. 28–32. doi:10.1145/3444370.3444543. [Google Scholar] [CrossRef]
18. Zhang H, Yu D, Wang J, Han J, Wang N. Security defence policy selection method using the incomplete information game model. China Commun. 2015;12(S2):123–31. doi:10.1109/CC.2015.7224695. [Google Scholar] [CrossRef]
19. Aggarwal M. A study of CVSS v4.0: a CVE scoring system. In: 2023 6th International Conference on Contemporary Computing and Informatics (IC3I); 2023 Sep; Gautam Buddha Nagar, India: IEEE. p. 1180–6. doi:10.1109/IC3I59117.2023.10397701. [Google Scholar] [CrossRef]
20. Qu L, Xiao R, Shi W, Liang B, Qin B. Cybersecurity challenges from the perspective of emergence. J Comput Res Dev. 2020;57(4):803–23. doi:10.7544/issn1000-1239.2020.20190379. [Google Scholar] [CrossRef]
21. Wang G, Lu S, Hu X, Ma R. Virus propagation model and stability under the hybrid mechanism of ‘two-go and one-live’. J Elect Informat Technol. 2019;41(3):709–16. doi:10.11999/JEIT180381. [Google Scholar] [CrossRef]
22. Liu G, Chen J, Liang Z, Peng Z, Li J. Dynamical analysis and optimal control for a SEIR model based on virus mutation in WSNs. Mathematics. 2021 Apr;9(9):929. doi:10.3390/math9090929. [Google Scholar] [CrossRef]
23. Tang W, Yang H, Pi J. Dynamics and control strategies for SLBRS model of computer viruses based on complex networks. Int J Intell Syst. 2024 May;2024(5):1–16. doi:10.1155/2024/3943882. [Google Scholar] [CrossRef]
24. Liu F, Gao H, Wei Z. Research on the game of network security attack-defense confrontation through the optimal defense strategy. Secur Priv. 2021 Jan;4(1):e136. doi:10.1002/spy2.136. [Google Scholar] [CrossRef]
Cite This Article
 Copyright © 2025 The Author(s). Published by Tech Science Press.
This work is licensed under a Creative Commons Attribution 4.0 International License , which permits unrestricted use, distribution, and reproduction in any medium, provided the original work is properly cited.
 Downloads
 Citation Tools