
 Submit a Paper
 Propose a Special lssue
 Open Access
ARTICLE

Enhanced Detection of APT Vector Lateral Movement in Organizational Networks Using Lightweight Machine Learning
1 Research and Innovation Center, Rabdan Academy, Abudhabi, P.O. Box 114646, United Arab Emirates
2 UQ Cyber Research Centre, The University of Queensland, Brisbane, QLD 4027, Australia
3 Department of Computer Science, Bingham University, Abuja, 961105, Nigeria
4 School of Computing, Robert Gordon University, Aberdeen, AB10 7QB, UK
5 College of Technological Innovation, Zayed University, Dubai, P.O. Box 144534, United Arab Emirates
* Corresponding Author: Mathew Nicho. Email:
Computers, Materials & Continua 2025, 83(1), 281-308. https://doi.org/10.32604/cmc.2025.059597
Received 12 October 2024; Accepted 28 November 2024; Issue published 26 March 2025
 View Full Text
 Download PDF
Abstract
The successful penetration of government, corporate, and organizational IT systems by state and non-state actors deploying APT vectors continues at an alarming pace. Advanced Persistent Threat (APT) attacks continue to pose significant challenges for organizations despite technological advancements in artificial intelligence (AI)-based defense mechanisms. While AI has enhanced organizational capabilities for deterrence, detection, and mitigation of APTs, the global escalation in reported incidents, particularly those successfully penetrating critical government infrastructure has heightened concerns among information technology (IT) security administrators and decision-makers. Literature review has identified the stealthy lateral movement (LM) of malware within the initially infected local area network (LAN) as a significant concern. However, current literature has yet to propose a viable approach for resource-efficient, real-time detection of APT malware lateral movement within the initially compromised LAN following perimeter breach. Researchers have suggested the nature of the dataset, optimal feature selection, and the choice of machine learning (ML) techniques as critical factors for detection. Hence, the objective of the research described here was to successfully demonstrate a simplified lightweight ML method for detecting the LM of APT vectors. While the nearest detection rate achieved in the LM domain within LAN was 99.89%, as reported in relevant studies, our approach surpassed it, with a detection rate of 99.95% for the modified random forest (RF) classifier for dataset 1. Additionally, our approach achieved a perfect 100% detection rate for the decision tree (DT) and RF classifiers with dataset 2, a milestone not previously reached in studies within this domain involving two distinct datasets. Using the ML life cycle methodology, we deployed K-nearest neighbor (KNN), support vector machine (SVM), DT, and RF on three relevant datasets to detect the LM of APTs at the affected LAN prior to data exfiltration/destruction. Feature engineering presented four critical APT LM intrusion detection (ID) indicators (features) across the three datasets, namely, the source port number, the destination port number, the packets, and the bytes. This study demonstrates the effectiveness of lightweight ML classifiers in detecting APT lateral movement after network perimeter breach. It contributes to the field by proposing a non-intrusive network detection method capable of identifying APT malware before data exfiltration, thus providing an additional layer of organizational defense.Keywords
Abbreviations and Definitions
| AI | Artificial intelligence |
| APT | Advanced persistent threat |
| BN | Bayesian network |
| DT | Decision tree |
| Hacker | Unauthorized user of a system with malicious intent |
| ICU | An internetworked computer user, that is, an unsuspecting computer user at the organizational network perimeter interacting with the organizational intranet and extranet and the Internet |
| ID | Intrusion detection |
| IDS | Intrusion detection system |
| HMM | Hidden Markov model |
| IoT | Internet of Things |
| KNN | K-nearest neighbor |
| LAN | Local area network |
| LM | Lateral movement, specifically, of data packets generated by the malware within affected computers and the local segmented network |
| LP | Lateral plane, that is, the local networked resources available through an ICU’s computer |
| ML | Machine learning |
| NoIE | Network of initial entry, specifically, of the malware into organizational systems through social engineering methods prior to an attack |
| RDP | Remote desk protocol |
| RF | Random forest |
| SMB | Server message block |
| SVM | Support vector machine |
Cyber-attacks on governments, critical infrastructure, and corporations have increased significantly over the past two decades [1–3] despite technological advances in intrusion detection systems (IDS). Given that the primary objective of most advanced persistent threat (APT) attacks is to establish and sustain continuous access to the targeted network rather than a quick intrusion and exit [2], early detection at the initially affected local area network (LAN) is crucial for effectively mitigating the attack. The advanced existing preventive measures have often proved ineffective in preventing attacks on compromised entities, but the detection of lateral movement (LM) within the affected LAN is a promising approach for identifying APT malware and adding an additional layer of defense to enhance defense in depth.
Adversarial machine learning (ML) techniques has significantly contributed to strengthening defenses against an adversarial opponent [4]. ML classifiers, including deep neural networks, have demonstrated remarkable performance across various domains such as cybersecurity. In this regard, research has shown that these classifiers can be easily deceived by carefully designed adversarial input perturbations, leading to incorrect predictions [5]. In this respect, IDSs act as a critical layer of defense in a secured network environment, though they are highly vulnerable to security threats [6]. This vulnerability is especially problematic in the case of APT vectors that deploy stealth, subversion, and deception when moving within a network to evade traditional cyber defenses. However, well-aligned ML techniques within the realm of AI can be effectively deployed to address network intrusions [7].
Lateral movement is the most prominent security threat in the network, as most APT vectors move laterally to reach high-value targets [8], yet ML-based techniques have not been successful in identifying all types of intrusions [9]. Hence, cyberattacks that utilize innovative and existing APT vectors (i.e., sophisticated malware that exploits users’ vulnerabilities for unauthorized entry into computer systems and networks) carried out by malicious individuals and/or nation-state actors can inflict disastrous damage to organizations and nations. Furthermore, human error (user vulnerabilities), which accounts for 95% of all data breaches [10–13], is challenging to control with traditional detection systems [14]. In this respect, lateral movement detection has emerged as an effective line of defense against data exfiltration [15]. Therefore, the use of anomaly ensemble ML methods to detect the lateral movement of APT vectors described here represents a promising and viable approach in the realm of adversarial ML techniques.
In an LM context of APT, the malware moves laterally across networks to reach higher value targets [16]. The stealth of APT vectors and the slow pace at which they typically move through a network make them challenging to detect [17,18]. During an APT attack, the unintentional or intentional and malicious acts of internetworked computer users (ICUs) pave the way for the initial entry. Therefore, the next feasible line of defense prior to a data exfiltration/ransomware attack is the effective and efficient detection of APT vectors at the network of initial entry (NoIE). However, the effectiveness and efficiency of detection depends on the optimal selection of the ensemble ML classifiers to detect the massive number of anomalous events generated by an APT attack that is characterized by multiple LMs within an infected network. Thus, the key to the successful analysis of APT vectors featuring LM is a robust event-logging system for all of the systems participating in a network [19] that can support an ensemble ML application. In this respect, automation using ML is expected to have the greatest influence on the transformation of cybersecurity over the next two years [20].
Despite advances in the software used to detect vulnerabilities, APT actors have consistently demonstrated the ability to compromise systems through the use of advanced tools, custom malware, and “zero day” exploits [21]. APT is a threat because of its selective and sophisticated nature in targeting unsuspecting victims [22–26]. In this regard, information security experts worldwide have identified APT vectors as a significant threat because of their capacity to deploy multiple attacks and target specific organizations and nation-states [14]. While the prevention of APT attacks has been the main goal of anti-malware initiatives, approaches focusing on the mitigation of the threat at the NoIE (i.e., the minimally invasive stage) supplement and reinforce layered cyber security defenses by reducing the attack surface. The World Economic Forum recently drew attention to the fact that organizations have reached the point at which “cyber resilience” has become the defining mandate of the era [20].
The application of ensemble ML learning models is a potential solution for network security and anomaly detection [15]. These ML techniques “construct a set of classifiers and then classify new data points by taking a (weighted) vote of their predictions” [27]. In an ensemble-based ML method, multiple classifiers are evaluated to identify the optimal predictive model [18]. Hence, anomaly-based IDS have emerged as a potential method for defending against malicious activities [28].
This research is founded on five key premises. First, APTs specifically target organizations, government institutions, and commercial enterprises through social engineering techniques [29,30], aligning with our model’s focus on detecting advanced APT vectors rather than broad-spectrum cyberthreats. Second, our emphasis lies on APT vector detection post-perimeter breach, underscoring our contribution to strengthening internal network defenses in compromised environments. Third, this research aims to minimize APT impact through early detection before data exfiltration, ensuring compliance with national and international regulatory standards. Fourth, the study seeks to enhance organizational cyber resilience, enabling targeted entities to withstand and recover before experiencing critical data breaches, legal consequences, and compliance violations. Finally, following World Economic Forum recommendations, the automation of ML processes can facilitate lightweight APT mitigation, supporting our objective of developing a scalable and resource-efficient detection model.
The methods that we employ offer a solution that depends entirely on packet headers and is implemented using ML algorithms. Packet header datasets are often considered lightweight in the context of ML because they typically contain only the essential information from network packets. This approach is considered lightweight in terms of data size, a factor that also affects processing speed and computing resources [31,32]. We also take into account privacy concerns since the contents of the packets are not affected. Our results show that, even with the reduced size, utilization of resources, and increased processing speed, the packet header still holds key valuable data for information security monitoring. The research highlights the following main points:
• The research proposes a non-intrusive network detection framework capable of identifying APT malware prior to data exfiltration, thus enhancing organizational defense capabilities.
• We demonstrate the effective detection of LMs by APT vectors despite their stealthy, subversive, and deceptive behavior using ensemble anomaly detection techniques that perform well in many applications, especially IDSs.
• Our detection method overcomes both unintentional errors and malicious intentional acts by ICUs.
• The target is, therefore, the lateral phase of the network, which is the location of most of the malicious application programming interface (API) calls, prior to the attackers’ implementation of stealth techniques.
• The lightweight mechanism for the detection of APT vectors that we propose is based on the use of the metadata from the generated log packets.
• Since most of the studies do not use LM datasets [16], we used three LM based datasets for data triangulation to validate our results.
After identifying the ease with which an APT actor can bypass users at the immediate LAN network through a socially engineered attack vector, the viable option available for network security managers is the detection of the malware during LM. The relevant literature has identified the nature of the dataset, feature selection, and ML techniques as critical factors for the effective detection of APT vectors. To this effect, ensemble ML techniques, specifically K-nearest neighbor (KNN), support vector machine (SVM), decision tree (DT), and random forest (RF), can be applied to detect the LM of APTs within an affected LAN before data exfiltration or destruction. This application is crucial because, as Mandiant [23] reports, the median dwell time of APT malware within an organizational network was 21 days in 2021, a finding that highlights the urgent need for immediate attention since such malware can quickly inflict extensive and critical damage if not detected and quarantined promptly. Since processing speed is a primary concern in detection, the research demonstrates the application of lightweight ML techniques to detect APT malware using multiple datasets, thereby encompassing existing APT malware traffic during the LM (the reconnaissance and footprinting phases) at NoIE, well before data exfiltration occurs.
The main research contribution is the introduction of an innovative IDS designed to identify and mitigate APT attacks within the minimally invasive network, specifically the ICU LAN domain. First, we have identified four lightweight critical indicators (features) for APT LM detection, namely, bytes, packets, destination port number, and source port number sourced from three datasets. Second, we observed improvement in the LM detection rate from the 99.89% reported in previous studies at the LAN to 99.95% using our modified RF algorithm, representing a 0.6% enhancement for the first dataset. Furthermore, our study achieved a perfect 100% detection rate for the DT and RF classifiers with dataset 2. Third, our research focused on strengthening the network’s lateral domain, traditionally regarded as a vulnerability, by enhancing detection efficiency through reduced processing power demands resulting from its lightweight design, all while bolstering detection accuracy through the identification of the most suitable algorithm to apply. Thus, our research takes into account all of the factors that are crucial for successful intrusion detection, including the affected location, speed, cost-effectiveness, and accuracy, in selecting the appropriate ML algorithms.
The remainder of the paper is structured as follows. In Section 2, we present a survey of the extant literature on the use of ML in the detection of cyber threat vectors in general and APT vectors in particular from the perspectives of both theory and practice. In Section 3, we describe and justify the research process from a methodological perspective. In Section 4, we described the implementation and evaluation process. In Section 5, we provide the summary of the results. In Section 6, we offer our conclusions and suggestions for future research.
2.1 Application of ML to Detection of LM in APT Attacks
APT vectors are by nature elusive but are not exclusive in terms of generating cues for detection. They can bypass conventional antivirus and anti-malware security systems that depend on signatures and static analysis without being identified [33,34]. Hence, a comprehensive understanding of the behavior of APT malware in the IS network stages as it progresses through reconnaissance, establishing a foothold, LM, exfiltration, and cover-up [29] can offer critical information on the nature of API calls. The post-infective LM of malware includes exploring the network to find the target, gaining access, traversing multiple systems and accounts, and installing remote access tools using legitimate credentials and the tools provided by the native network and operating systems [35]. LM-based attacks have come to represent a potential risk to enterprise security affecting critical infrastructure and national security especially [36,37]. It is difficult both to detect LM and to defend against it owing to its stealth in pursuing its predetermined objectives and the nature of the vulnerabilities that are typically exploited [38].
Processing based anomaly IDS use ML techniques namely as neural networks, Bayesian networks, Markov models, genetic algorithms, clustering outlier detection, and fuzzy logic [39]. Among the widely used ML techniques of reinforcement learning, semi-supervised, unsupervised, and supervised, our focus is on supervised learning since it involves classified (labeled) data [40]. Moreover, unsupervised ML techniques for IDS are prone to high false-alarm rates [41]. Supervised learning consists of regression, including KNN and DT, and classification, including SVM, Bayesian network (BN), KNN, and hidden Markov model (HMM) [42]. The ensemble method reduces their classification errors, enhances the accuracy of weak classifiers [43], and improves the generalizability of the results [44]. Hence, we narrowed down the ML algorithms used for this study to four, namely, SVM, KNN, DT, and RF. Conventional ML classifiers use fewer computational resources while deep learning algorithms require extensive computational resources [45].
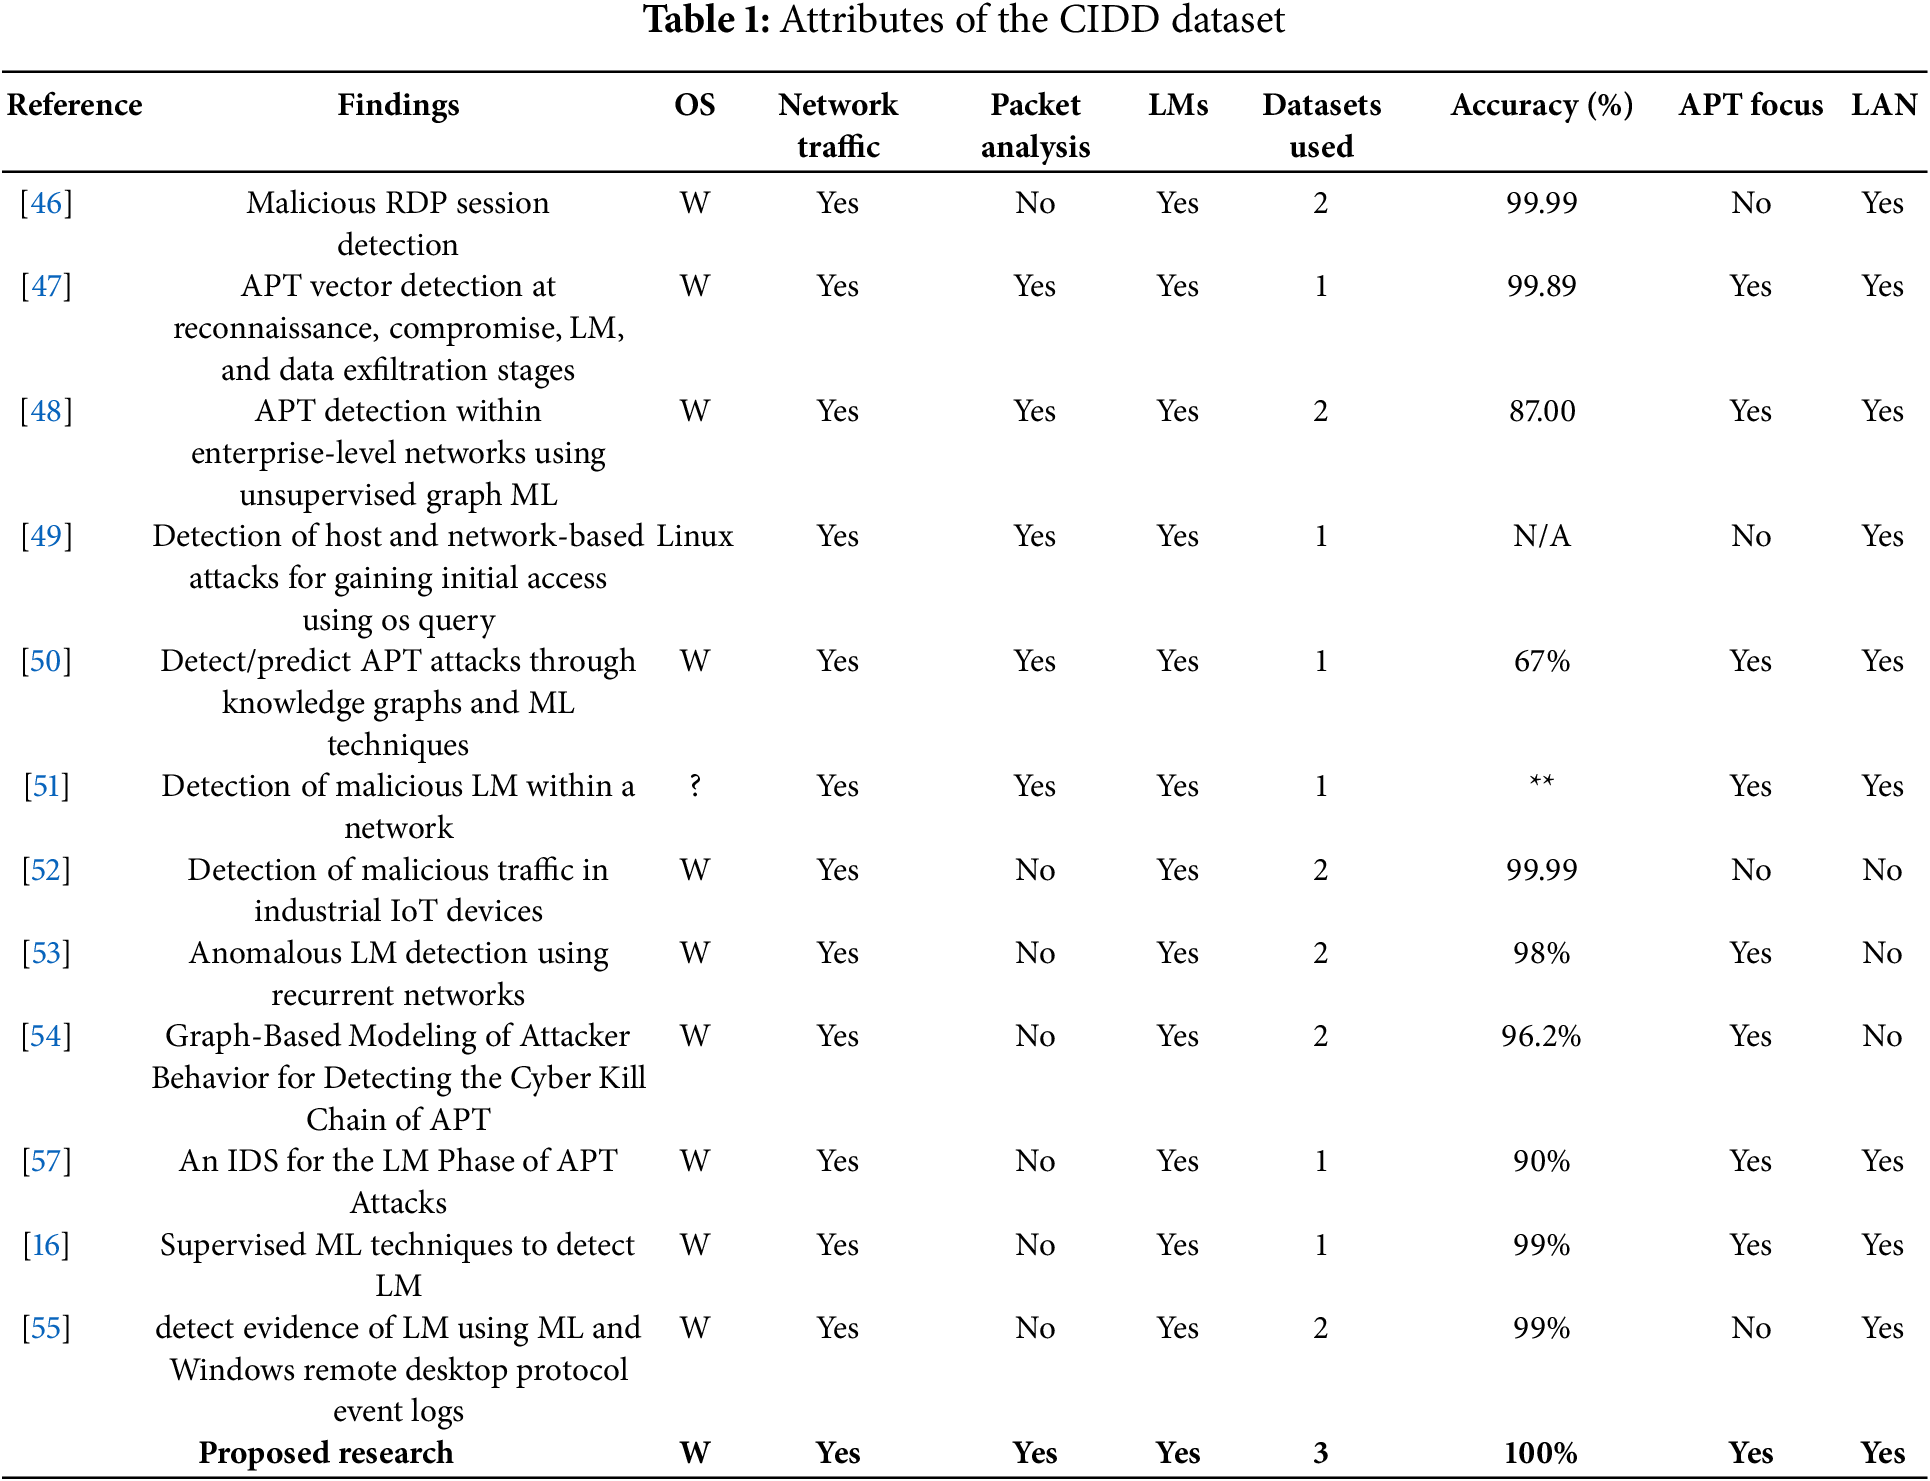
A search for relevant publications in the Google Scholar, IEEE, ACM, Elsevier, and Web of Science databases using the terms “machine learning” and “lateral movement” identified eight studies. However, six of these studies focused on the detection of malware in the LAN of computer systems, and one focused on IoT devices (Table 1). In [46], the authors leveraged Windows event logs for intrusion detection using supervised and unsupervised ML techniques and achieved accuracies of 99.99% using LogicBoost Classifier on remote desktop protocol (RDP) sessions in terms of executing remote operations. However, though this approach is highly accurate, the focus on RDP sessions that allow users to execute remote operations on other computers does not include LMs prior to RDP and alternate traffic, thus leaving the remaining malicious LMs undetected. In [47], the authors built a new dataset with network traffic covering the complete lifecycle of APT attacks, including normal mode, reconnaissance, initial compromise, LM, and data exfiltration activities, and achieved a detection accuracy rate of 99.89%. While this experiment provides strong evidence of the efficacy of the application of ML to the detection of APT vectors, the focus on the entire APT lifecycle rather than the lateral phase prior to privilege escalation and data exfiltration may render the prevention redundant and delay mitigation when the detection occurs at the data-exfiltration phase. However, such research provides strong support for our approach. In [48], the authors proposed a technique for detecting the LM of APTs within enterprise LANs using a combination of unsupervised graph learning and standard logging practices prevalent in the industry. However, the method provided only true positive and false positive rates of 87% and 0.9%, respectively, which is inadequate for detecting APTs considering the sensitive nature of enterprise networks and the stealthy approaches that they use. In [49], the authors developed a real-time, heuristic-based detection script for Linux that records each log from the OS query and correlates it against multiple conditions to detect malicious initial connections, LM, and escalation of privileges in Unix-based OSs at both the network and host levels. However, the reliance on a single dataset makes this approach difficult to generalize because of the variable nature of APT vectors. Furthermore, only a limited number of early executable programs invoking system calls were analyzed for intrusion detection in their research. Thirdly, their research focused on Linux, which is not the standard operating system used by the ICU.
In [50], the authors proposed a novel approach to detect and predict APT vectors at the LM phase by combining knowledge graphs built using cyber threat intelligence with ML techniques for IDS and prediction. However, the prediction rates of 67% for identified attacks with a probability of 0.96 and, 23% for the identified attacks with a probability of 0.6 generated excessive false alerts. Furthermore, the authors stated that the lack of accuracy in their experimentation was due to reliance on a single dataset containing an insufficient number APT attack scenarios. In [51], the authors used a bipartite graph method to assign the malicious and benign network traffic using a single dataset to two disjoint sets of vertices (users and computers) with two classifiers (SVM and RF) and proposed experiments with a variety of classifiers to determine whether other approaches are better suited to problem domains. However, they used only a single dataset for lateral movement detection and only the first five fields and employed only RF as the detection model. Since this approach relies solely on one dataset without employing an ensemble approach, it may not yield optimal detection results for APT logs generated during the LM phase. In [52], the authors successfully reduced redundant links and blocked malicious traffic in a smart home IoT network using the RF algorithm and two datasets. However, their focus was not on APT but exclusively on IoT devices, thus limiting the generalizability of their research to non-IoT environments. In [53], the authors proposed the Euler framework which provides a formalized method for identifying lateral movement in system compromise by combining state-of-the-art performance in anomaly-based intrusion detection with layers of sequence encoding and contemporary deep graph learning algorithms. The ability of attackers to imitate authentic user behavior or take use of authentic credentials, however, presents a difficulty and makes it challenging to differentiate malicious activities from regular operations. In [54], the authors developed an APT analysis system, CAPTAIN, that is rooted in the community, minimizes the need for specialized knowledge, integrates security and non-security sensors and offers visual representations of attack vectors to solve the shortcomings of current approaches. It does, however, need careful calibration for certain network environments and, like many detection systems, may have trouble addressing complicated, real-time attacks. In [55], the authors addressed the increasing problem of malware, particularly on Windows-based systems, by presenting a Convolutional Neural Network (CNN) model for malware detection on portable executables. The model’s application in real-time detection systems may be limited by its reliance on complex feature engineering and the requirement for large-scale learning, which could present problems with scalability and processing resources.
2.3 Feature Selection in Datasets
Numerous researchers have suggested employing network traffic data for ID in the domain of APTs [56–60] especially when large volumes of data are involved [61]. While ML algorithms based on behavioral knowledge of the traffic have been used extensively for threat detection, this approach has not reduced the incidence of false negatives and false positives simultaneously [62]. Ensemble models and appropriate feature selection, however, can increase the accuracy and reduce the false alarm rate [63,64]. Moreover, appropriate feature selection removes superfluous and redundant features from a dataset, thereby improving the predictive performance of the ML classifier [65]. Feature selection uses variable ranking techniques as the main standard for variable selection through ordering [66]. Hence, these techniques suit the goals of this research. While feature selection (an important aspect of conventional ML) influences the performance of learning algorithms [64] data triangulation using three datasets validates the results since the success of intrusion detection and prevention methods that use AI depends largely on the quality of the datasets [47].
Training ML models for APT detection using diverse datasets enhances performance and robustness by exposing the models to varied network configurations, attack patterns, and feature representations [55,56]. The proposed model, leveraging three distinct datasets, demonstrates enhanced capability in detecting diverse APT characteristics across multiple network protocols, traffic patterns, and behaviors. Furthermore, this multi-dataset approach enables targeted feature selection, prioritizing prototypical malicious behavior indicators (e.g., protocol-level activity) over environment-specific features such as IP addresses, which often limit model generalizability [65,67]. This methodology enhances detection efficiency and reduces false positives in real-world implementations.
2.4 Perspectives of the Proposed Approach
A review of the literature has identified critical vulnerability points, including the ease with which APT malware can infiltrate an internal LAN through ICU computers using social engineering and the stealthy nature of APT malware, which remains undetected for an average of 21 days.
However, though these vulnerabilities are critical, only few studies [16,46,47] has examined the computer systems immediately affected (NoIE), investigating reconnaissance and footprinting methods using ML techniques, with a detection rate of 99.89%. Given the use of a single custom-built dataset, the generalizability of these results remains uncertain. No prior effort has efficiently or comprehensively achieved APT malware traffic detection rates ranging from 99.81% to 100% across multiple datasets within the affected system. Having discussed the ML approaches for APT vector detection, we now proceed with a description of the implementation of our methodology based on the ML lifecycle.
The proposed implementation follows the experimental research process based on the four phase ML lifecycle in Fig. 1 [68]. The first phase involves data acquisition, cleaning, and sampling to reduce the dataset to a size that retains sufficient information for effectively training the ML classifier to achieve the research objectives.
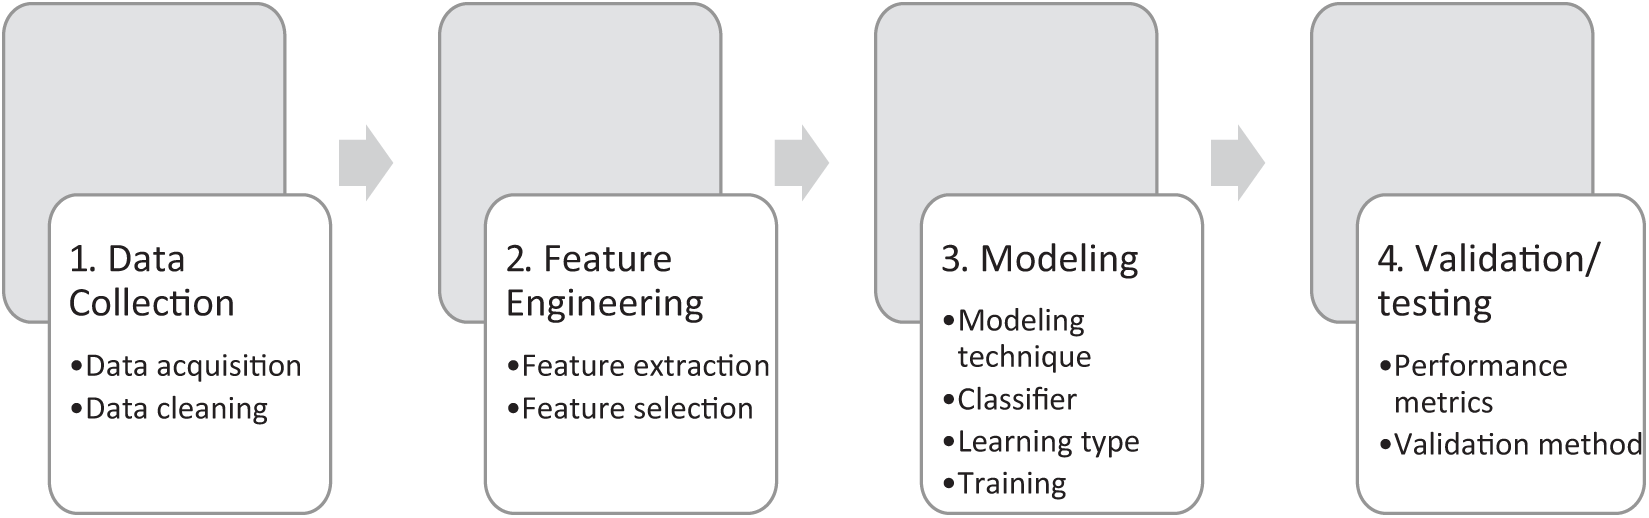
Figure 1: The experimental research process based on the ML lifecycle (Reprinted with permission from [56]. Copyright 2021, ACM)
Since most publicly available datasets can be successfully leveraged for ML simulation [46], the use and triangulation of three datasets ensures the validity and generalizability of the findings of the proposed research. Furthermore, the efficiency of an ML based IDS depends on the two main criteria namely the data and ML classifier used to train the model [67].
The identification of the noise inherent in the data is necessary to avoid misleading the model and to achieve high accuracy. The method involves selecting a subset of features present in the three datasets based on the following criteria:
• the method for selecting the features,
• the importance of the features, and
• the correlation matrix
The success of an ML model depends on the dataset, which consists of multiple features and attributes. The feature selection approach proposed in this study utilizes three methods to select the best features since dropping features that have negative effects naturally improves the effectiveness of an ML solution. The chi-square test is used for non-negative features, extra tree classifier and feature correlation for feature selection.
The fact that the source and destination IP addresses are unique to the network environment limits the effectiveness of the solution to the specific environment where the dataset was sourced. This limitation arises because the ISP and the organizational IT department determine the range of IP addresses allocated within the organizational network. Additionally, the column “attack type” provides more information about the target column (label), but its inclusion in the dataset may introduce bias. While we can convert the fields/columns into a different format (i.e., string to numerical), doing so could restrict the classifier’s performance or effectiveness.
The steps in this phase are selecting and applying a modeling technique, choosing an algorithm, setting, and adjusting the hyper parameters, developing an ensemble model, and training and optimizing the model. The training involves splitting the dataset into 80% for training and 20% for testing using the train_test_split function of the Scikit-learn (sklearn, an open-source data analysis library). Based on the literature review, SVM, KNN, RF, and DT appear to be optimal for the research. Of the four algorithms, we modify and improve the existing RF algorithm to create RF1 only for dataset 1 [69]. The modified algorithm is presented in Algorithm 1.
The algorithms used are the same for the three datasets, which include SVM, KNN, DT, and RF. The parameter settings were uniform among the three datasets. The key parameters used were as follows:
• for KNN: number of neighbors (K) = 5 (5 points per group of neighbors).
• for DT: criterion = entropy (formula used for branching the tree).
• for SVM: kernel = linear (using a linear approach to generate the hyperplane).
• For RF: number of estimators = 10 (number of decision trees in the forest used in majority voting for the final outcome).
After preparing and cleaning the dataset and selecting the relevant features, the next phase involves data classification and testing for both accuracy and speed (performance metrics). The results obtained through the use of the four ML classifiers are presented in the final phase to demonstrate their accuracy in correctly classifying instances.
4 Implementation and Evaluation
4.1 Dataset Acquisition and Cleaning
The first dataset, CIDDS-001, consisting of network packet metadata collected using the OpenStack service, includes 1,047,908 instances of data [69]. Misleading and inconsistent data constitute 0.06% of the whole and, to avoid reducing the effectiveness of the ML algorithm and introducing bias into the ML classifier, were removed using WEKA 3.8.3. Cleaning the data in this way can improve the results when a dataset has impurities. Since the Bytes column in the dataset contained unexpected values, which constituted 0.06% of the total dataset, we deleted this column rather than replacing the values so as to avoid introducing bias into the prediction model.
The second dataset, tagged dataset_minimal, was obtained from FigShare [70] and includes 13,017 instances of data. The features consist of source and destination IP addresses and ports, packets, octets, duration, TCP flags, and protocols. The ‘Type’ field, which signifies the type of traffic, is assigned values of 0 (benign) and 1 (malicious) and is labeled for detection. Our examination of the dataset for noise, unwanted data, missing nota-number (NaN) values, datatypes, uniformity, and consistency showed it to be clean.
The third dataset, SCVIC-APT-2021, consists of 315,607 rows and was initially composed of 84 features. It is regarded as a standard for ML-based APT detection in network traffic [71]. This dataset, which comes from the University of Ottawa’s Smart Connected Vehicles Innovation Centre (SCVIC), provides an accurate depiction of modern network architecture and APT features. The six class labels, which are generated from an international knowledge base of adversary tactics, describe common attack strategies such data exfiltration, pivoting, lateral movement, initial compromise, normal traffic, and reconnaissance. The dataset had 77 features after a number of columns, including identity, ports, and protocols, were removed during data preprocessing since they were considered redundant for the classification problem. The dataset underwent cleaning procedures to handle infinity values, null values, and NaN values. Imputation was performed by assigning 0 to remove unwanted values, followed by the treatment of duplicate entries. Another challenge in data preprocessing involved handling categorical data, which was addressed using label encoding techniques.
Extensive data preprocessing and validation procedures were implemented to address potential dataset anomalies, particularly within CIDDS-001. Initial analysis using WEKA 3.8.3 identified and removed 0.06% of data instances (from a total of 1,047,908 network packet metadata instances) classified as erroneous or inconsistent. Data preprocessing included removing the Bytes column and rectifying data type inconsistencies to enhance model accuracy. Cross-validation was applied using grouped and regrouped subsets of training and testing data to evaluate the impact of preprocessing on model robustness, ensuring exposure to diverse data samples across iterations. This methodology mitigates potential bias from persistent data anomalies in CIDDS-001 while enhancing model generalization capabilities across varied data distributions.
Having cleaned the datasets and narrowed the features, we proceeded to model the data for the classification.
The dataset features for the three datasets are packet header details. However, they vary with respect to the number of features.
This dataset initially consisted of 12 fields, including “Flow,” but we reduced it to 11 fields, because “Flow” has very low “feature” and does not add value to the feature selection. The classifier is based on the class column, which contains the distinct values of normal, victim, and attacker allocated based on the direction of the traffic in a given instance. The attributes of the dataset 1 are duration of traffic flow, transport protocol used, source IP address, destination port and IP address, number of bytes and packets transmitted, types of services, attack vector used and unique identification for each attack vector type. We do not provide similar lists for the other two datasets because of the large number of fields involved.
a) Method for selecting univariate features.
This approach utilizes statistical methods to identify non-negative features. Based on the results of the chi-squared test scores (Fig. 2), the “Bytes” field was identified as the most relevant and the “Flows” field the least relevant.
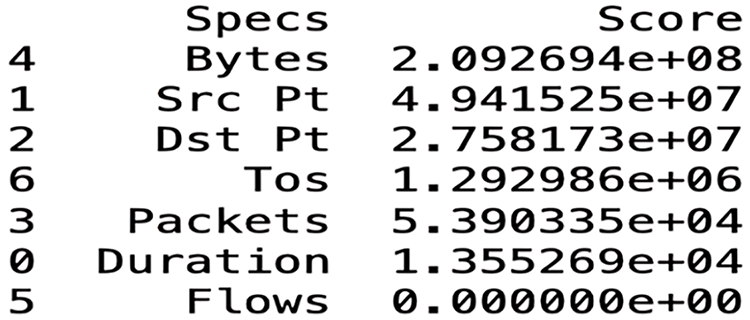
Figure 2: The seven features selected based on the chi-squared test
Other in-between values are the source port number (Src Pt), destination port number (Dst Pt), type of service (ToS), packets, and duration. Among the eleven features, we performed a statistical analysis on seven, being unable to do so on the remaining four (i.e., Src IP, Dst IP, Duration, and Attack type) because the expected data are in numeric format, whereas these four features are presented as strings that cannot be statistically analyzed. Indeed, most algorithms operate on numerical data and are unable to handle categorical or string variables directly.
b) Feature importance.
We used extra tree classifier on the dataset to produce the feature importance results presented in Fig. 3. The graph results differ slightly from the chi-squared test results because packets are ranked higher than bytes but are similar in terms of identifying the flows as the least important feature of the dataset. Between the packets and flows are the other features, with bytes being the maximum, followed by the source port. In the figure, the y-axis represents the features, while the x-axis represents the importance scores based on the additional three classifiers.
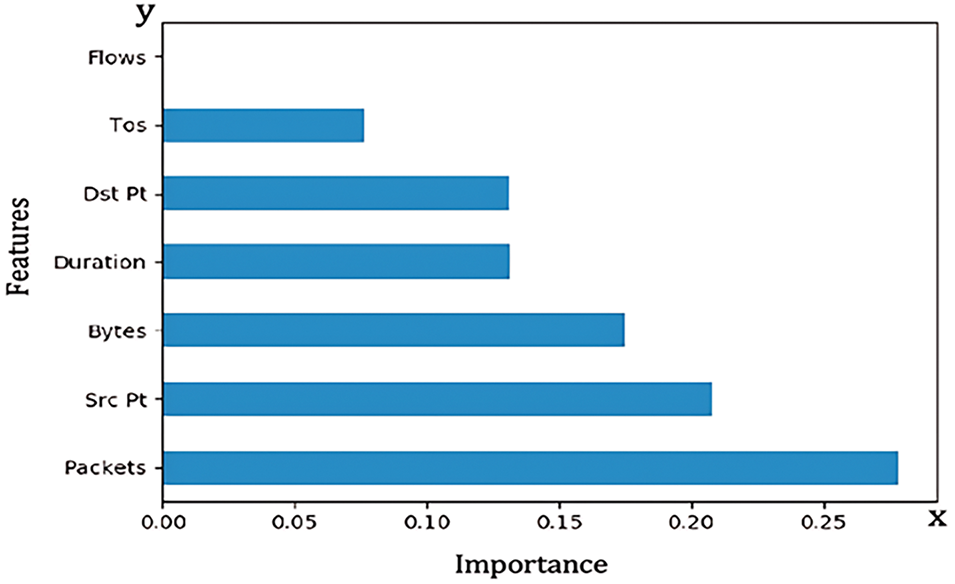
Figure 3: Importance of the features of dataset 1
c) Correlation matrix.
The analysis employs an x-by-x correlation matrix, where x denotes the feature count. Fig. 4 presents the coefficient correlation matrix illustrating relationships between key features through matched cells. All features except ‘flows’ demonstrate high self-correlation, with bytes, packets, and duration exhibiting significant correlation values. The destination port number and type of service show the strongest correlation (coefficient = 0.5), suggesting consistent application-specific port targeting—a valuable indicator for network traffic analysis. Conversely, destination and source ports display the weakest correlation (coefficient = 0.92), indicating possible self-generation through randomized or dynamic port allocation. Additional positive correlations exist between bytes-duration, packets-duration, and bytes-packets pairs, suggesting that increased data transfers correspond to higher temporal and volume metrics—characteristics useful for distinguishing legitimate from malicious traffic. The ‘flows’ feature exhibits no correlation patterns, including self-correlation, warranting its exclusion from the classification process.
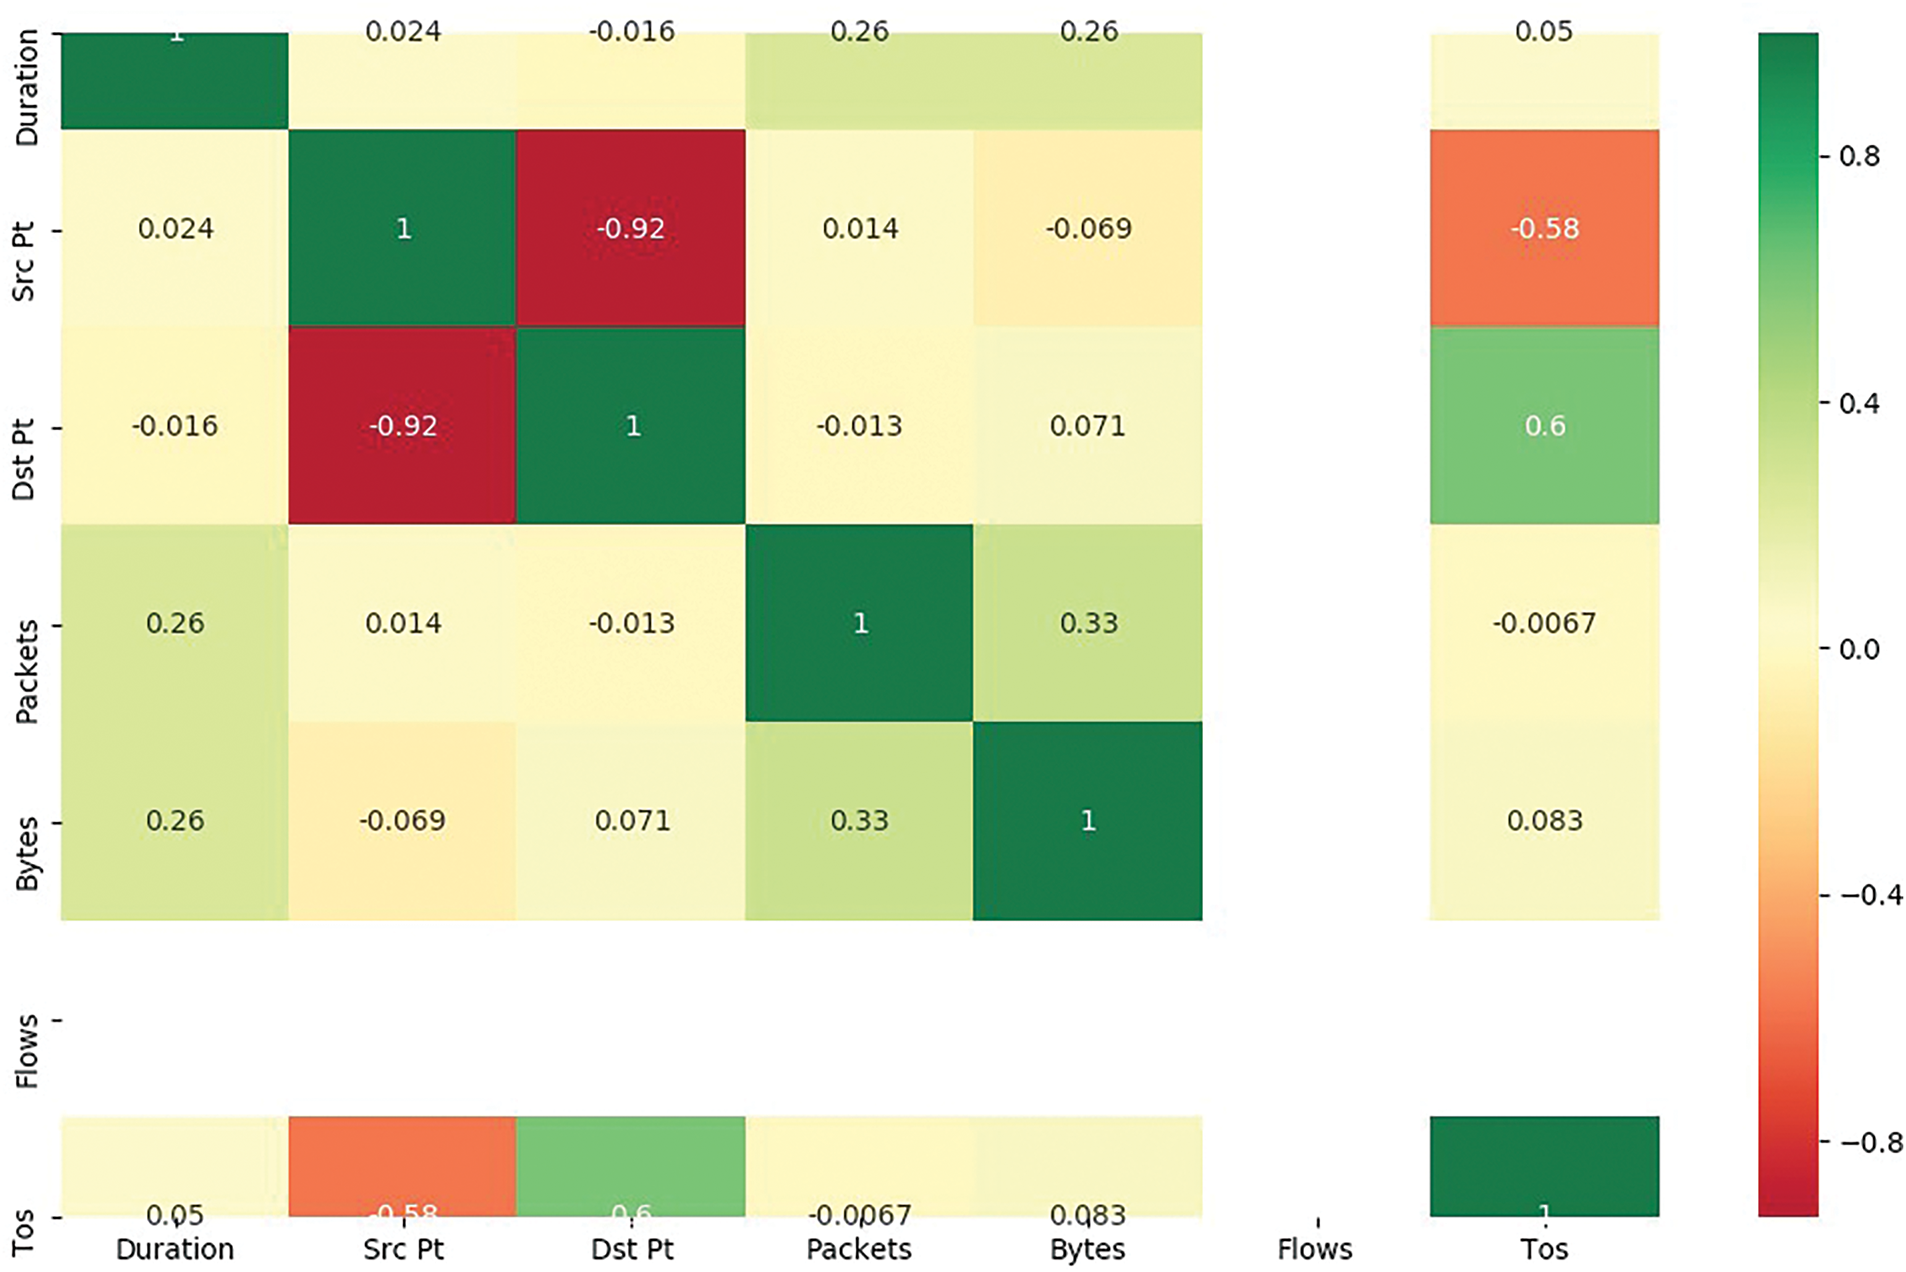
Figure 4: Correlation matrix for dataset 1
a) Method for selecting univariate features.
Using the same approach as dataset 1, the simulation employed statistical methods to identify non-negative features. The chi-squared test (Fig. 5), identified the most relevant feature identified was ‘octets,’ and ‘dst_port’ as the least relevant among the top seven features. The fact that the score for the lowest is non-zero indicates that all seven features are relevant to and important for the construction of an effective model.
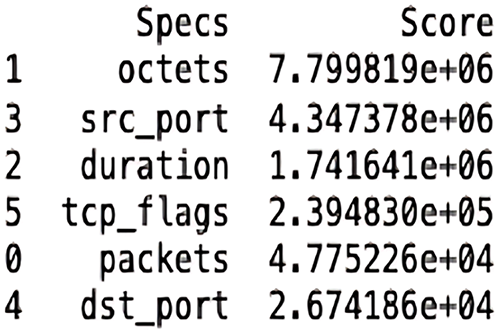
Figure 5: Feature selection of dataset 2 using the chi-squared test
b) Feature importance.
Through the use of the extra tree classifier, Fig. 6 presents the relevance of the features in the dataset, with the y-axis representing the features and the x-axis displaying the scores based on the additional three classifiers. It is observed that the results differ from those of the chi-squared test, placing tcp_flags higher than the destination IP. The other features were between packets and duration, with destination IP ranking second highest.
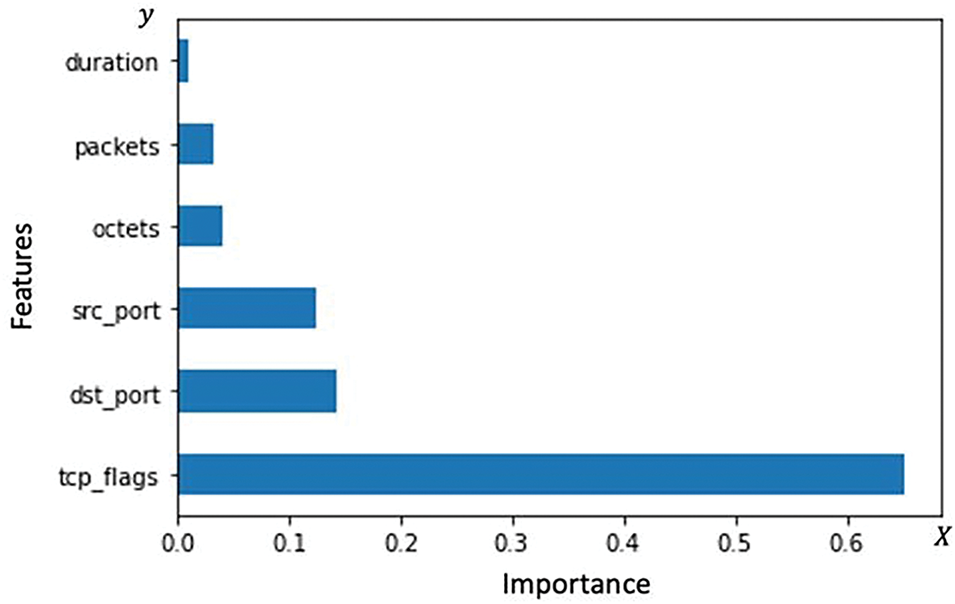
Figure 6: Importance of the features of dataset 2
c) Correlatoin matrix.
The analysis implements an x-by-x correlation matrix (where x denotes total feature count) to evaluate feature relationships. Fig. 7 presents these relationships through corresponding matrix cells, where octets, packets, TCP flags, and protocol demonstrate strong self-correlation values. The matrix reveals the highest correlation between packets and octets (coefficient = 0.97), indicating proportional relationship between packet count and octet volume. Conversely, destination port and IP exhibit the lowest correlation (coefficient = −0.28), suggesting service diversification across distinct IPs. Negative correlations emerge between source port-source IP pairs, while other features maintain positive correlations. The negative source port-source IP correlation indicates multiple port usage per source IP, potentially attributable to port randomization or load balancing mechanisms. The strong correlation between TCP flags and protocol suggests protocol-specific flag patterns, potentially enhancing classification accuracy through protocol-characteristic traffic identification. All features demonstrated statistical significance, warranting their retention in the classification model.
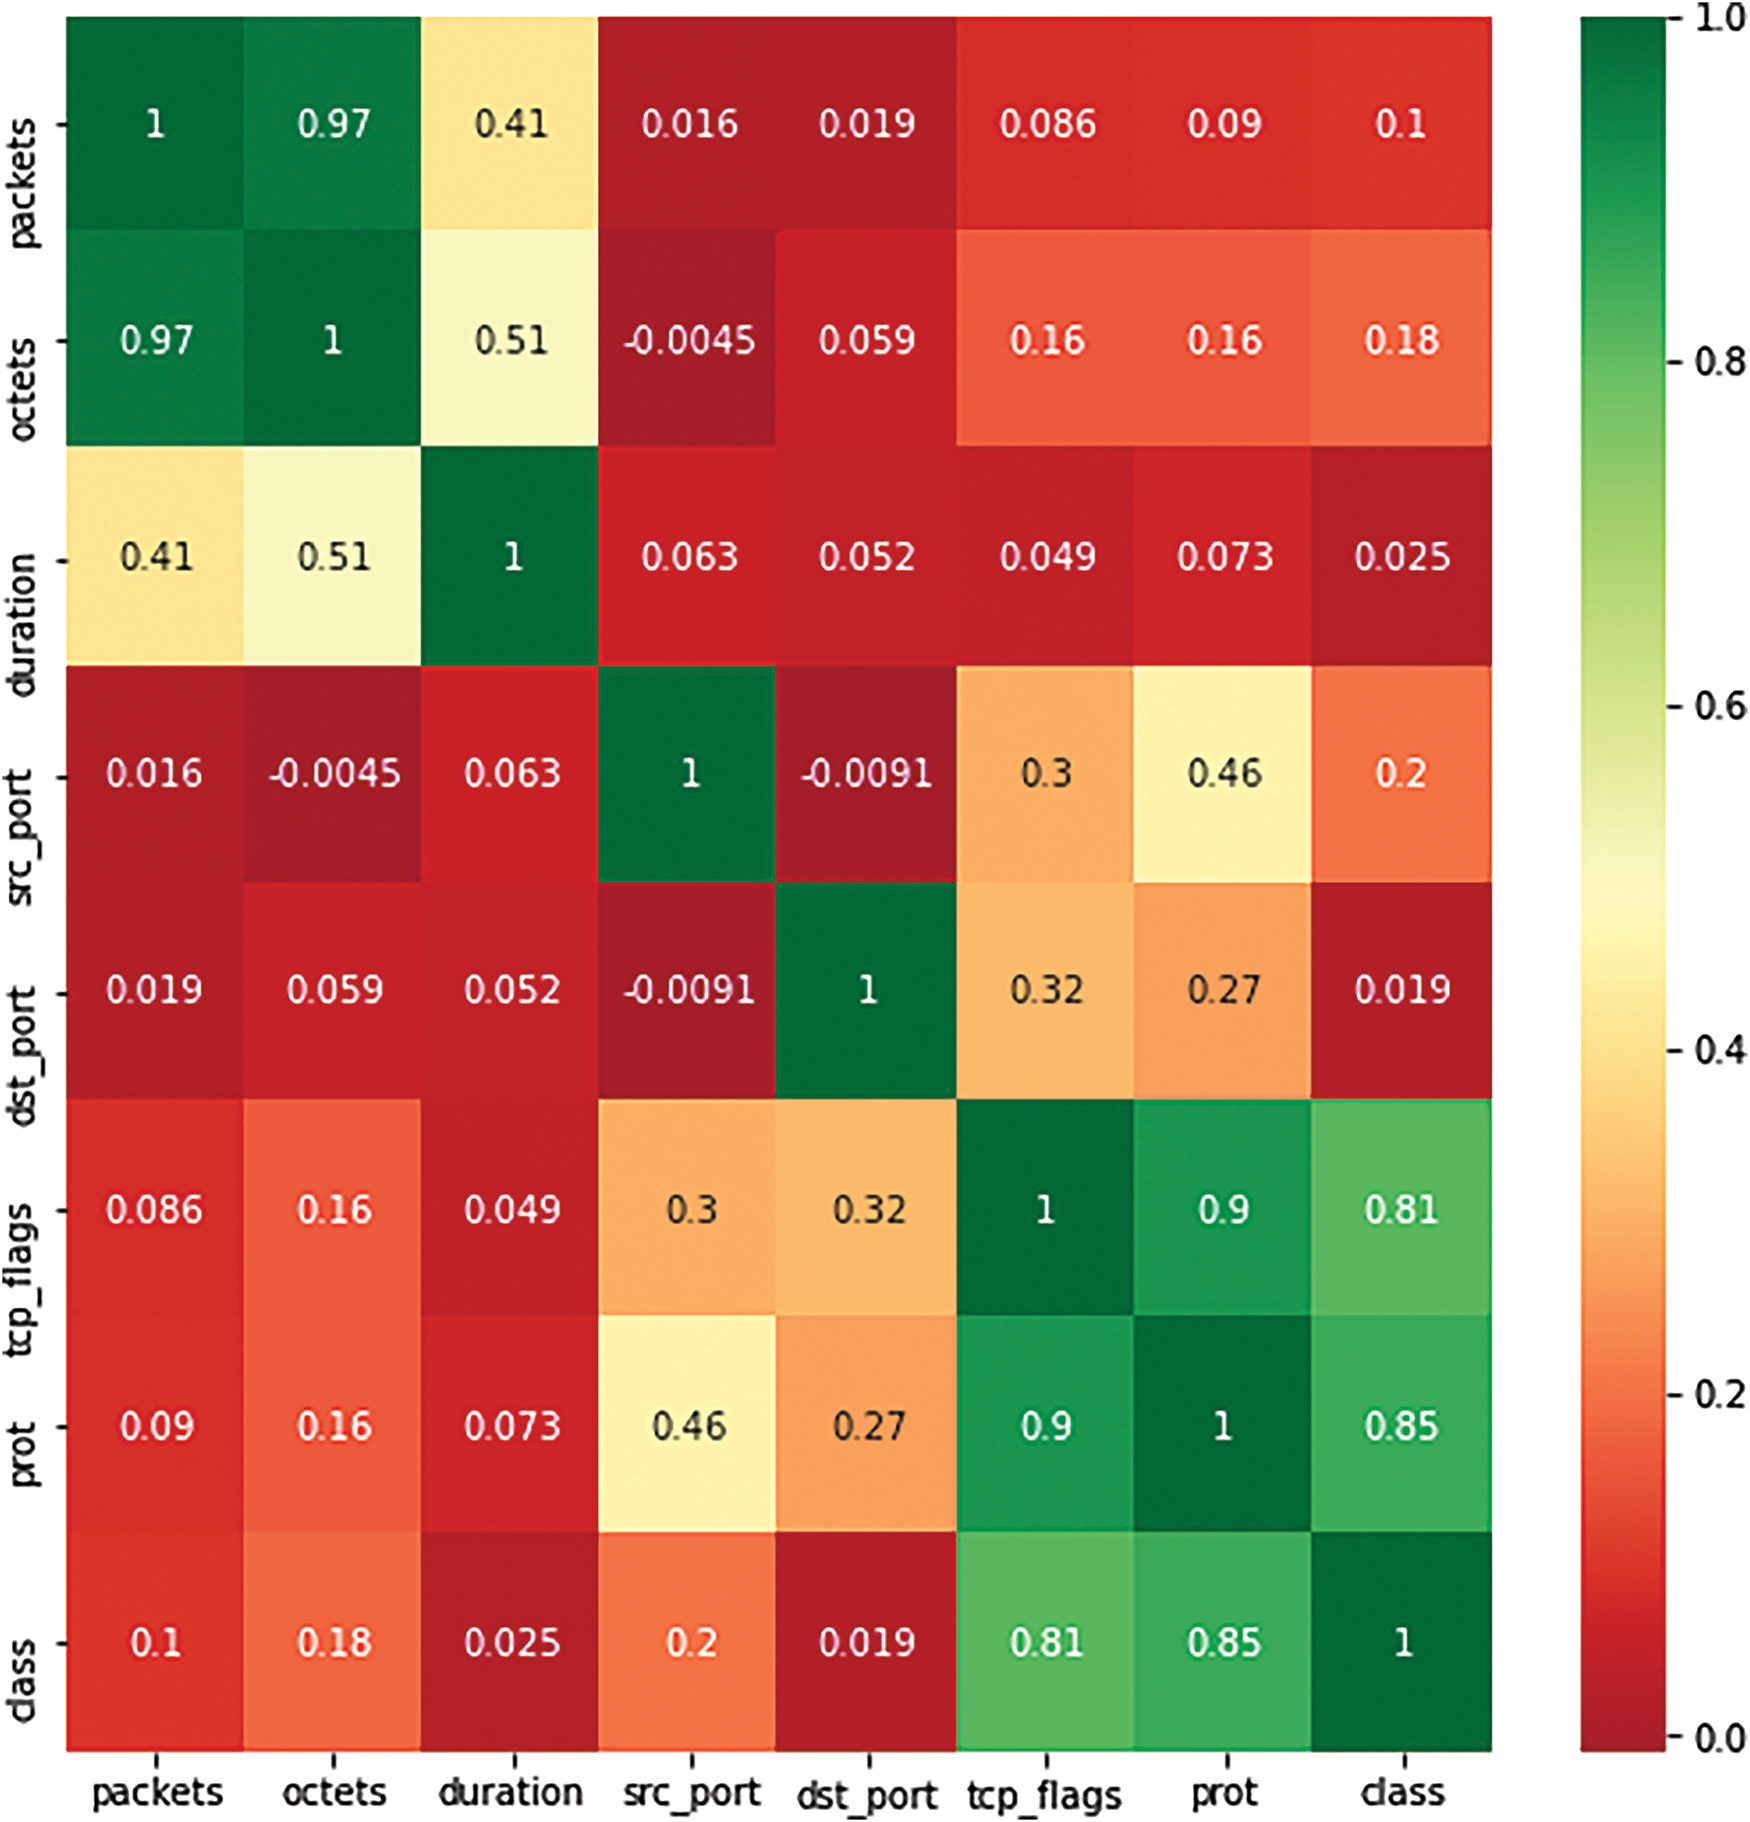
Figure 7: Correlation matrix for dataset 2
a) Method for selecting univariate features.
The chi-squared test (Fig. 8), used for ranking the identified features, shows cwr_flag_count as the best feature and packet_length_max as the least among the 75 features of the SCVIC-APT-2021, as evident from the chi-squared scores of 9.67564201e + 02 and 1.00873378e + 07, respectively.
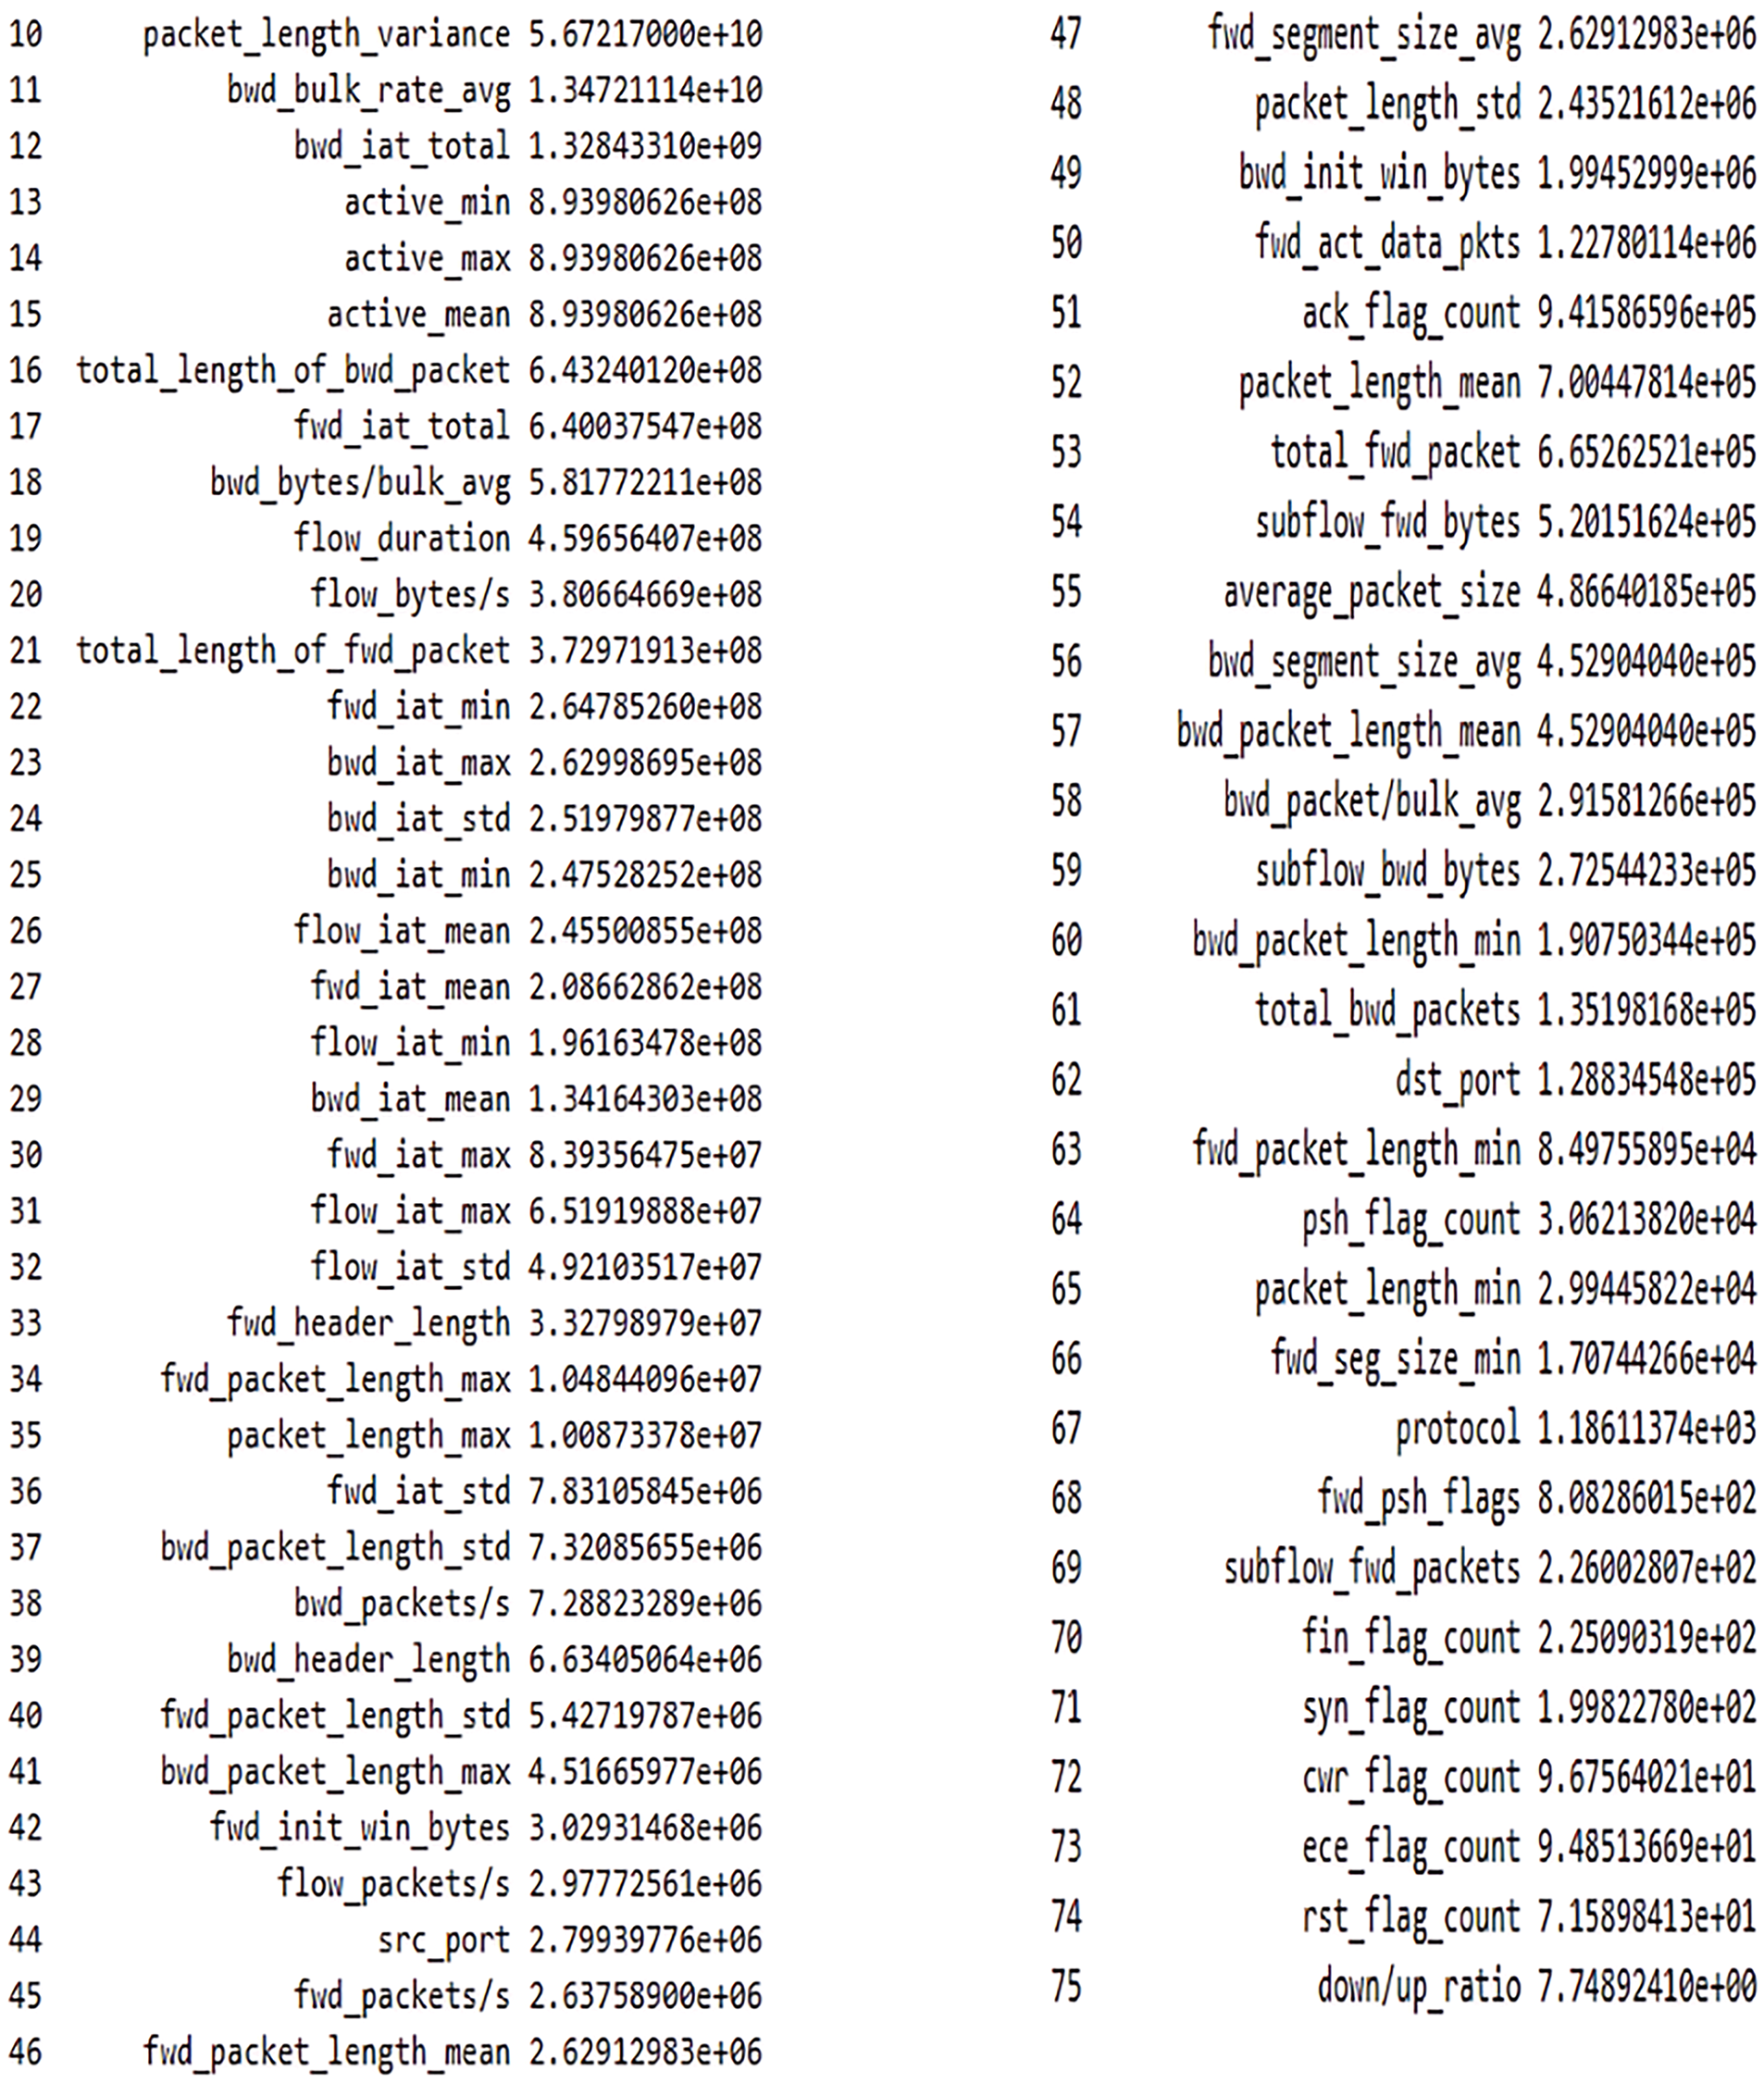
Figure 8: Feature selection of dataset 3 using the chi-squared test
b) Importance of the features.
Fig. 9 illustrates the results on feature importance based on the extra tree classifier applied to the dataset. The graph results differ from the chi squared test results in ranking the fwd_seg_size_min higher than cwr_flag_count when considering the 20 most important features. The fwd_seg_size_min and fwd_init_win_bytes are the most and second-most important features, respectively, with far higher scores than the other features. As with datasets 1, 2 and 3, the y-axis and the x-axis in Fig. 9 represents the features and the importance scores based on the additional three classifiers. The feature importance score is derived from an extra tree classifier (also known as an extremely randomized tree classifier). This ranking is established through the computation of the Gini index, which yields an information gain score for each feature. Consequently, this approach reveals the impact of each feature on the output. This information gain is calculated using bits as the units (Figs. 3 and 6).
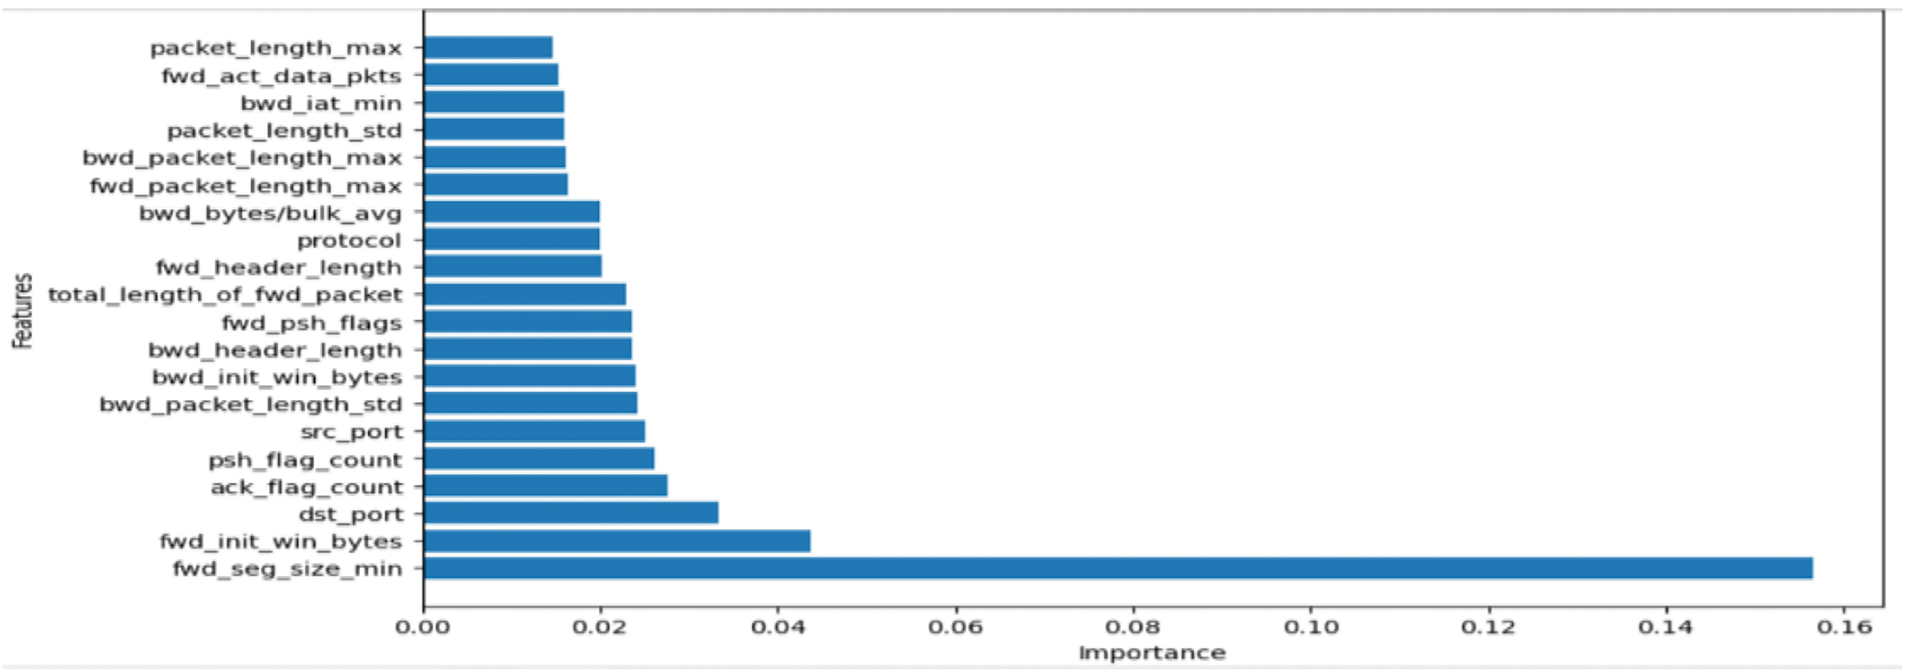
Figure 9: Importance of the features of dataset 3
c) Correlation matrix.
The correlation matrix in Fig. 10 illustrates relationships among 20 key features, with each feature demonstrating strong self-correlation. The highest correlation exists between fwd_packet_length_std and fwd_packet_length_max (coefficient = 0.94), indicating that flows with significant packet length variation typically include maximum-length packets—suggesting variability in packet size (M) representation. Conversely, protocol and bwd_packet_length_std exhibit minimal correlation (coefficient = −0.01), indicating protocol selection’s independence from backward packet size variability. Source port-source IP pairs demonstrate negative correlations, potentially attributable to dynamic port assignment or load balancing mechanisms, indicating asymmetric traffic flow distribution across ports. While some features (e.g., fwd_packet_length_std and fwd_packet_length_max) show high correlations, their retention is crucial as each feature contributes unique insights to network flow characteristics. The correlation analysis supports retaining all features, as each provides distinct, complementary perspectives for classification modeling.
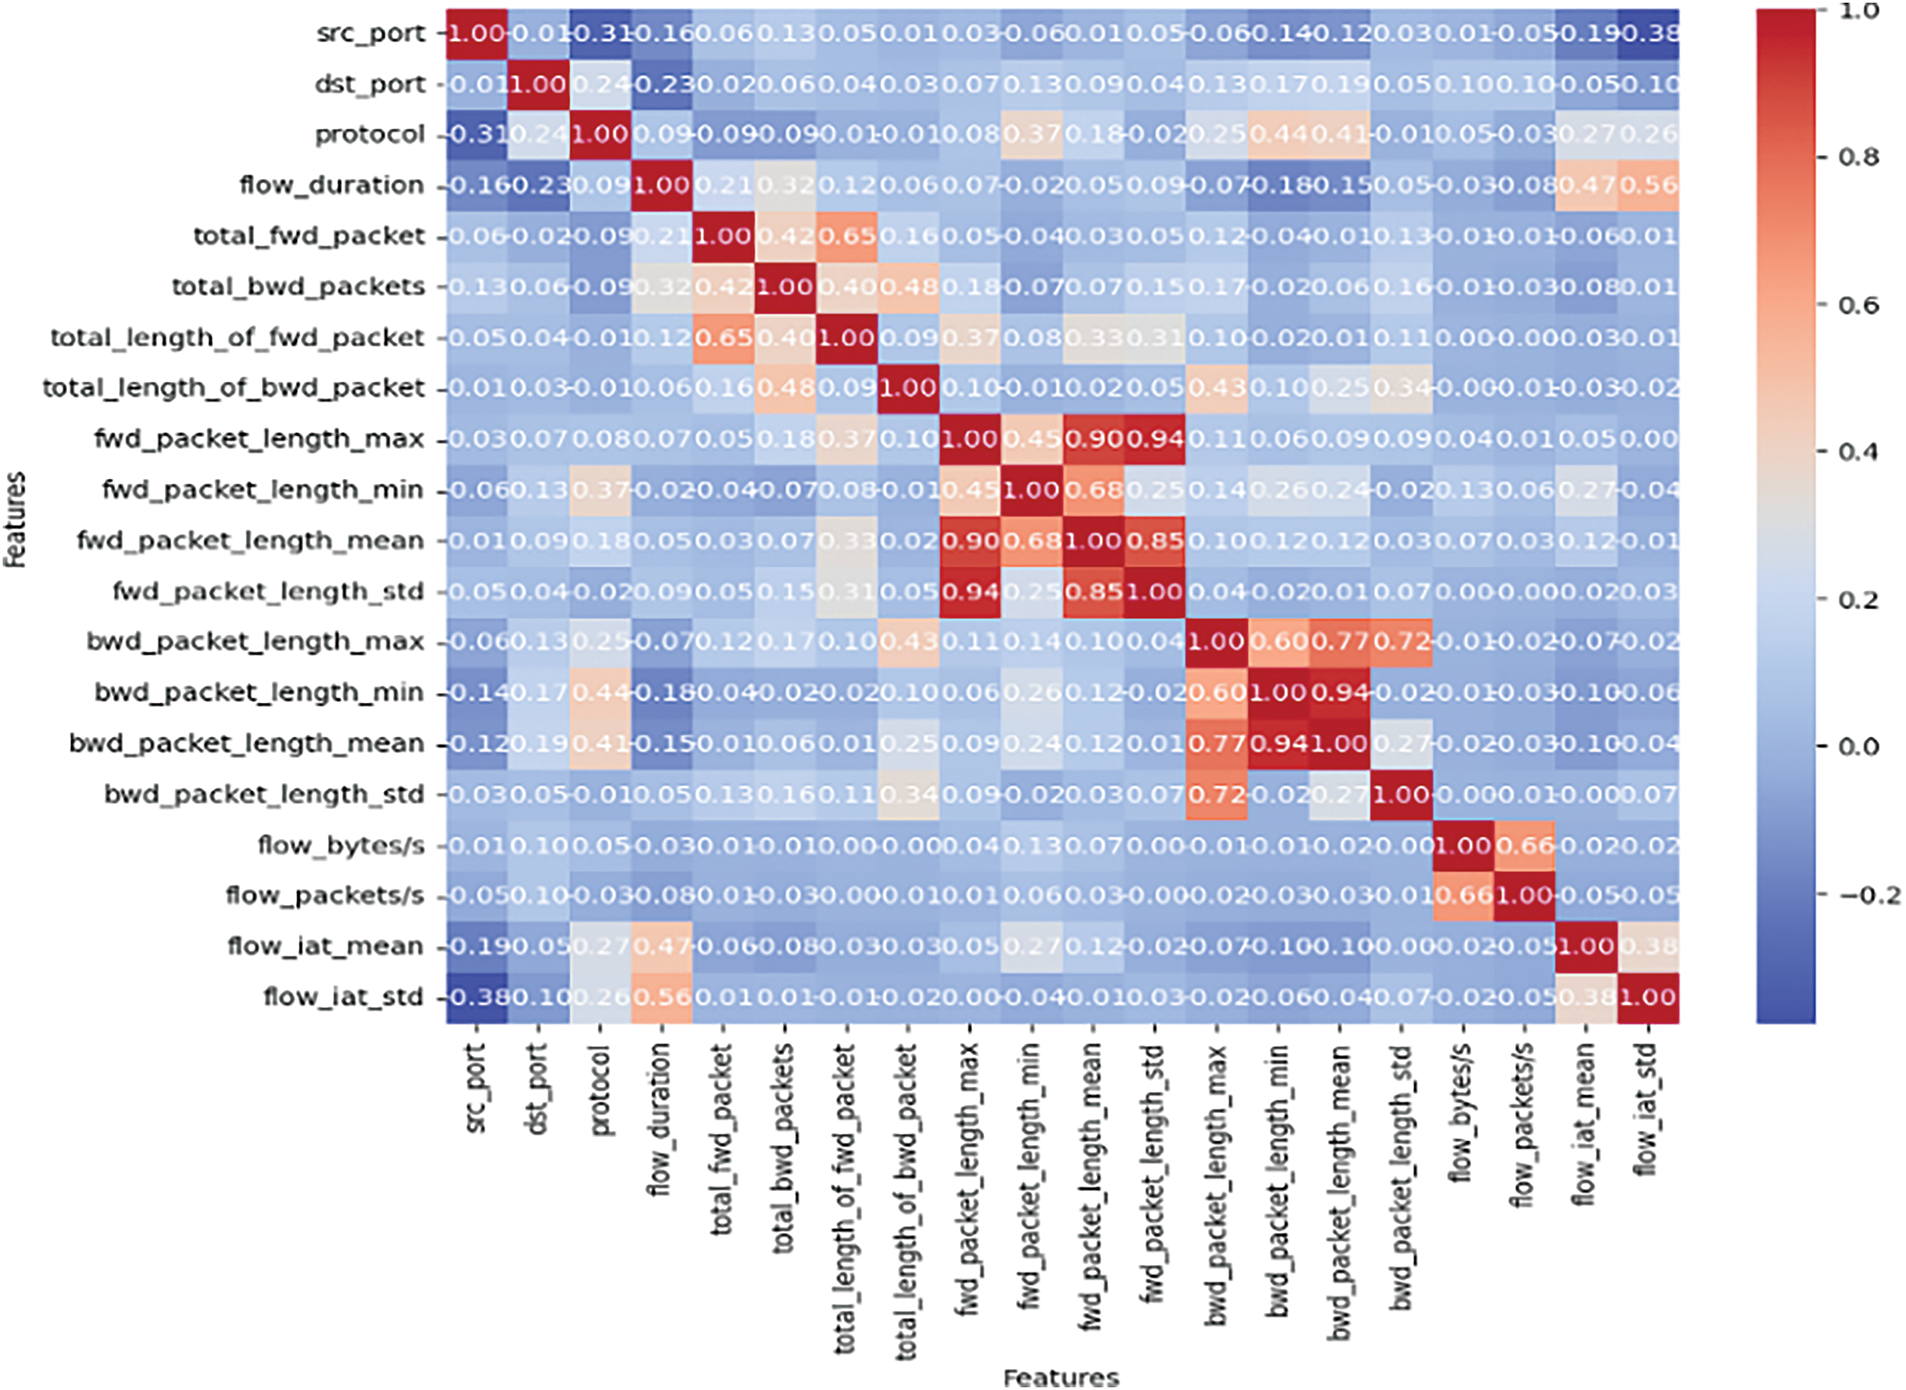
Figure 10: Correlation matrix for dataset 3
The approach used in this study utilizes three methods for selecting the best features because, as noted, dropping the features that have negative effects naturally improves the effectiveness of an ML solution. The features in the three datasets consist of packet header details, with each dataset differing in the number of features. The seven basic features, similar in all three datasets, are IP addresses, source and destination port, protocol, bytes, packets, and duration. The four critical APT LM ID indicators (features) from the three datasets that are significant are (1) the source port number, (2) the destination port number, (3) packets, and (4) bytes. We dropped features that showed no importance or negative importance.
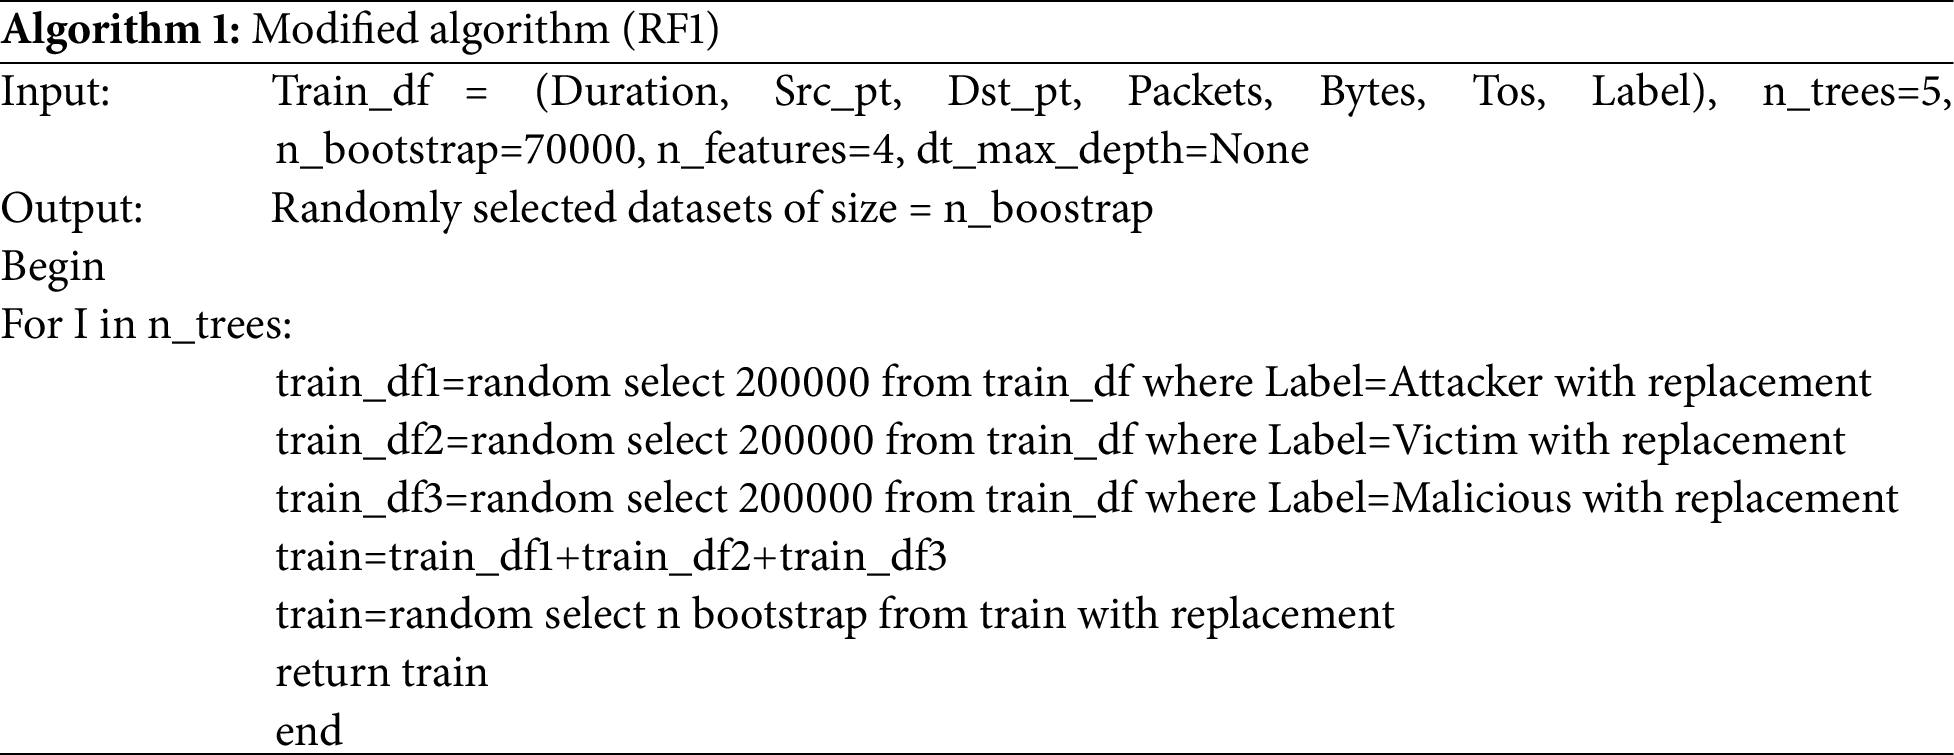
Using the RF1 algorithm, the CIDD dataset, which contained a total of 1,048,575 instances, was partitioned into 200,000 instance subsets per label. This resulted in three evenly balanced labels, each with 200,000 instances representing attacker traffic, victim traffic, and normal traffic, respectively. This 600,000-instance dataset was then further reduced to a bootstrap size of 70,000 instances per tree by random selection to build a single tree in the forest. The label-based random selection of data ensured load balancing of the dataset for each tree, thereby enhancing the distribution of the learning data. The subsequent alteration of the RF1 algorithm focused on optimizing the formula used for splitting the decision tree nodes based on finding the best split condition.
Eq. (1) serves to calculate entropy,
and Eq. (2) is the optimized formula that introduces a constant, 10, as computed in the equation
Dataset 1 was broken down for load-balancing (which was not necessary for datasets 2 and 3). This approach was designed to mimic the initial learning process inherent in human behavior, allowing the model to respond to events as they occur. The four selected classifier algorithms was also tested and evaluated to ensure that the results of the classification of the data and events would be as accurate as possible.
Based on relevant research demonstrating enhanced accuracy and consistency in reducing false positives for Intrusion Detection Systems (IDS) against Advanced Persistent Threats (APT), the two methods were combined. A split ratio of 80:20 for training and testing datasets was used across the four classifiers to evaluate their classification accuracy
The three datasets were split using an 80:20 ratio for training and testing, utilizing the train_test_split function from scikit-learn. This function also separates the features from the class in collaboration with pandas. The models were trained using sklearn and implemented using the “fit” command as shown in the code snippet for SVM, KNN, DT, and RF [72]. For all the three datasets, we used the same training process to obtain the most accurate algorithm. However, the application of the modified RF algorithm to dataset 1 showed room for improvement [73].
This phase involved data classification and testing for both accuracy and speed. Tables 2–5 present the results of the optimized ensemble classification algorithm using the four supervised machine learning algorithms, demonstrating their classification accuracy and computational time requirements. We evaluated these results using the F1 measure (an ML evaluation metric of a model’s accuracy that ranges from 0 to 1) based on the predicted classes and executed the training and testing of the dataset using sklearn. For dataset 1, Random Forest was modified to RF1 to reduce the training dataset size to 70,000 instances for enhanced accuracy. For datasets 2 and 3, the standard Random Forest algorithm was sufficient.
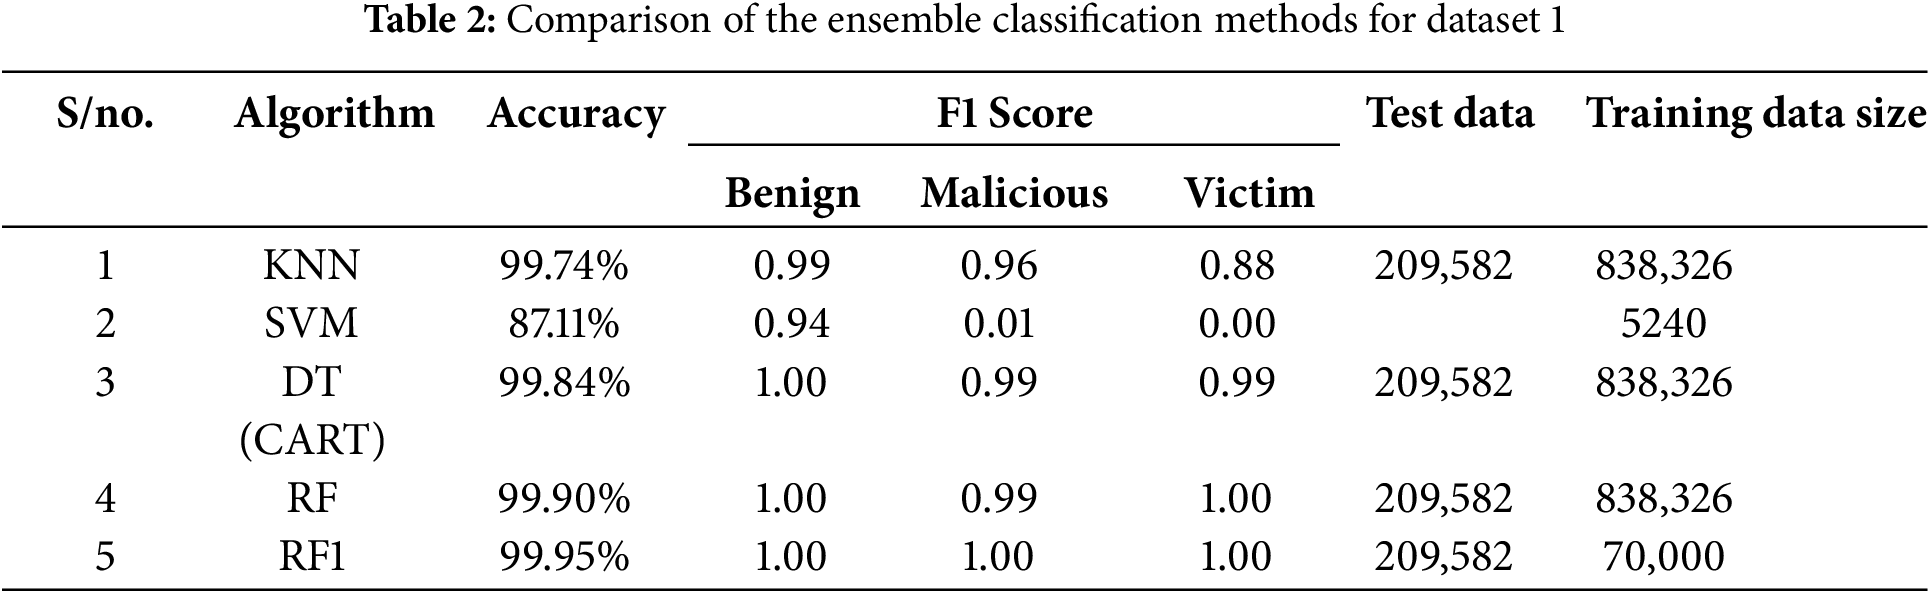

a) Dataset 1
The key findings (Table 2) of the dataset consisting of three traffic types, namely, benign, malicious, and victim, are as follows:
• KNN: The results show 99.74% accuracy (209,037 of 209,582 instances correctly classified).
• SVM: While the performance was reliable with small datasets, it was initially unsuccessful in the classification task with the full dataset. After reducing the dataset to 5240 instances (0.5% of the original 1,048,575 instances) using random sampling, SVM achieved an accuracy rate of 87.11%. This sampling approach helped mitigate potential bias concerns.
• DT: This achieved an accuracy rate of 99.84% (209,246 instances of 209,582 correctly classified).
• RF and RF1: RF achieved 99.90% accuracy, while its modified version (RF1) performed even better with 99.95% accuracy. Reducing the test data from 838,326 to 70,000 instances achieved better load balancing, while the modified entropy formula improved alignment with the upgraded RF1 algorithm, resulting in enhanced performance. The method of combining load balancing with entropy modification was adopted to address the uneven distribution of the dataset and to improve the existing results, as entropy provides optimal conditions for tree-splitting. Algorithm RF1 shows the load-balancing technique used (see the RF1 algorithm).
b) Dataset 2
The results indicated that dataset 2 outperformed dataset 1. Table 3 presents the key findings, which are as follows:
• KNN: KNN outperformed SVM, with accuracies of 99.7% and 98.46%, respectively.
• SVM: This ML classifier achieved an accuracy of 98.46% (with F1 Scores of 0.99 for normal traffic and 0.92 for malicious traffic). We reduced the dataset used to train the SVM classifier by 50% to avoid performance issues since this algorithm does not function well with large datasets.
• DT and RF: With accuracies of 100%, both outperformed SVM and KNN. Furthermore, DT, RF, and KNN had perfect F1 Scores for both malicious and normal traffic.
The DT model achieved perfect accuracy and F1 Score on the dataset containing 10,413 samples. However, perfect results may indicate overfitting or overtraining. To address this concern, we reevaluated the model using cross-validation with K = 5, which involves evaluating the model with five different sets of randomly grouped test and training data. The results showed an average accuracy of 99.999% across the individual scores of 100%, 99.98%, 100%, 100%, and 99.92%. Similar to the DT, the RF model also achieved perfect accuracy and F1 Score on the dataset. RF, on the other hand, is an ensemble technique that uses randomization for both features and data instances and combines several decision trees. This randomization makes it robust and less susceptible to overfitting. During the evaluation of the dataset, it became evident that certain features had the highest information gain scores. This observation was particularly prominent across the majority of features, with a significant finding that the ‘tcp_flags’ feature exhibited a substantial score exceeding 0.6. Notably, this criterion aligns with the parameter used for splitting in both the DT and RF models, underscoring the crucial role of ‘tcp_flags’ as a major indicator for detecting malicious traffic.
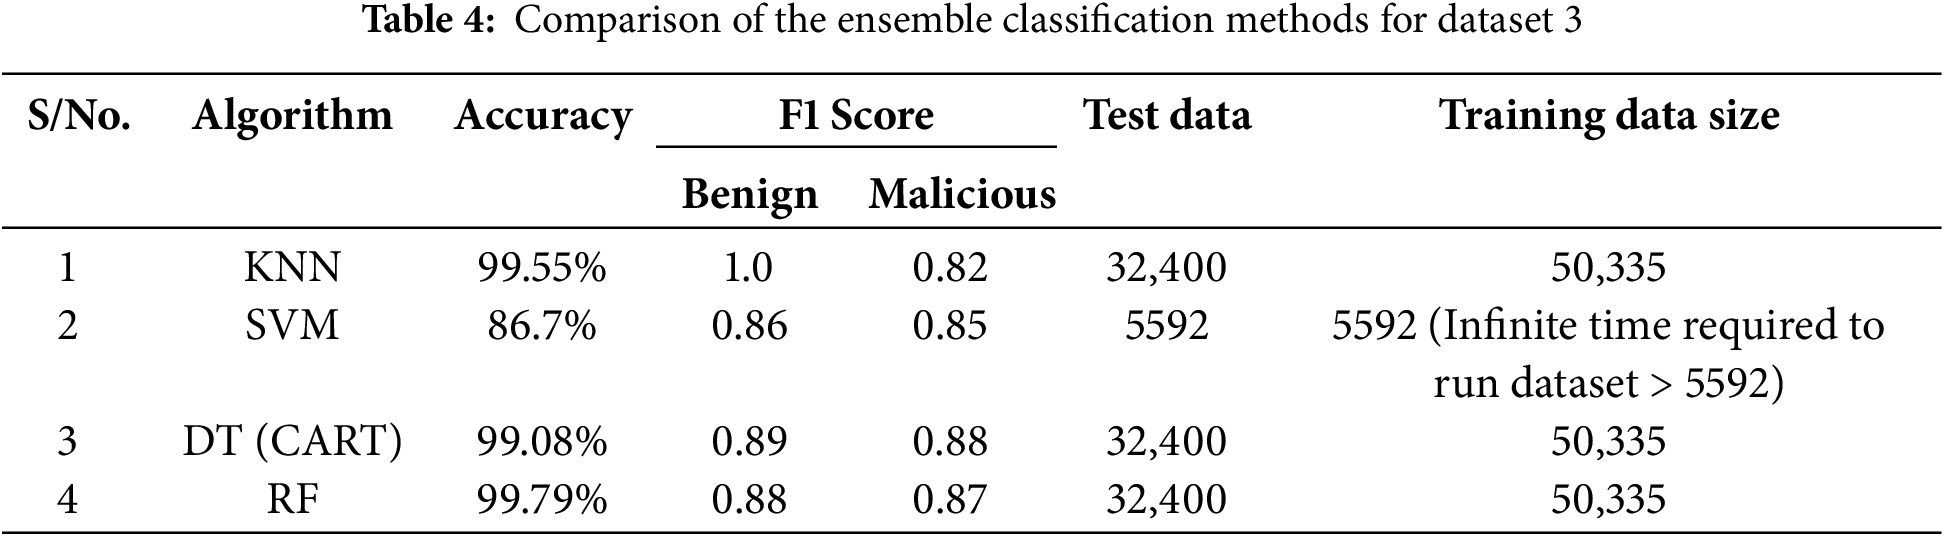
c) Dataset 3
Table 4 presents the key findings using the third dataset.
• RF and KNN: Both classifiers achieved the highest accuracy of 99.79% and 99.55%, respectively, demonstrating their strong ability in correctly classifying network data into benign and malicious categories. Furthermore, KNN obtains a perfect F1 Score of 1.0 for benign traffic, demonstrating its remarkable capacity to accurately identify benign samples, while RF achieve only 0.88.
• SVM: SVM had the lowest accuracy at 86.7%, with an F1 Score of 0.86 for benign traffic and 0.85 for malicious (LM) traffic. The SVM model, however, uses only 20% of the dataset for training because of its aforementioned inability to handle large datasets. Additionally, the number of features used affects the training of the SVM model.
• DT: With an impressive accuracy of 99.08% and F1 Scores of 0.89 for benign traffic and 0.88 for malicious traffic, DT demonstrates robust performance in accurately classifying network traffic.
These results show that the dataset assisted the models in detecting the benign traffic more than in detecting the malicious traffic, with three of the four algorithms having accuracy over 99%. The scores for the malicious traffic were lower for this dataset.
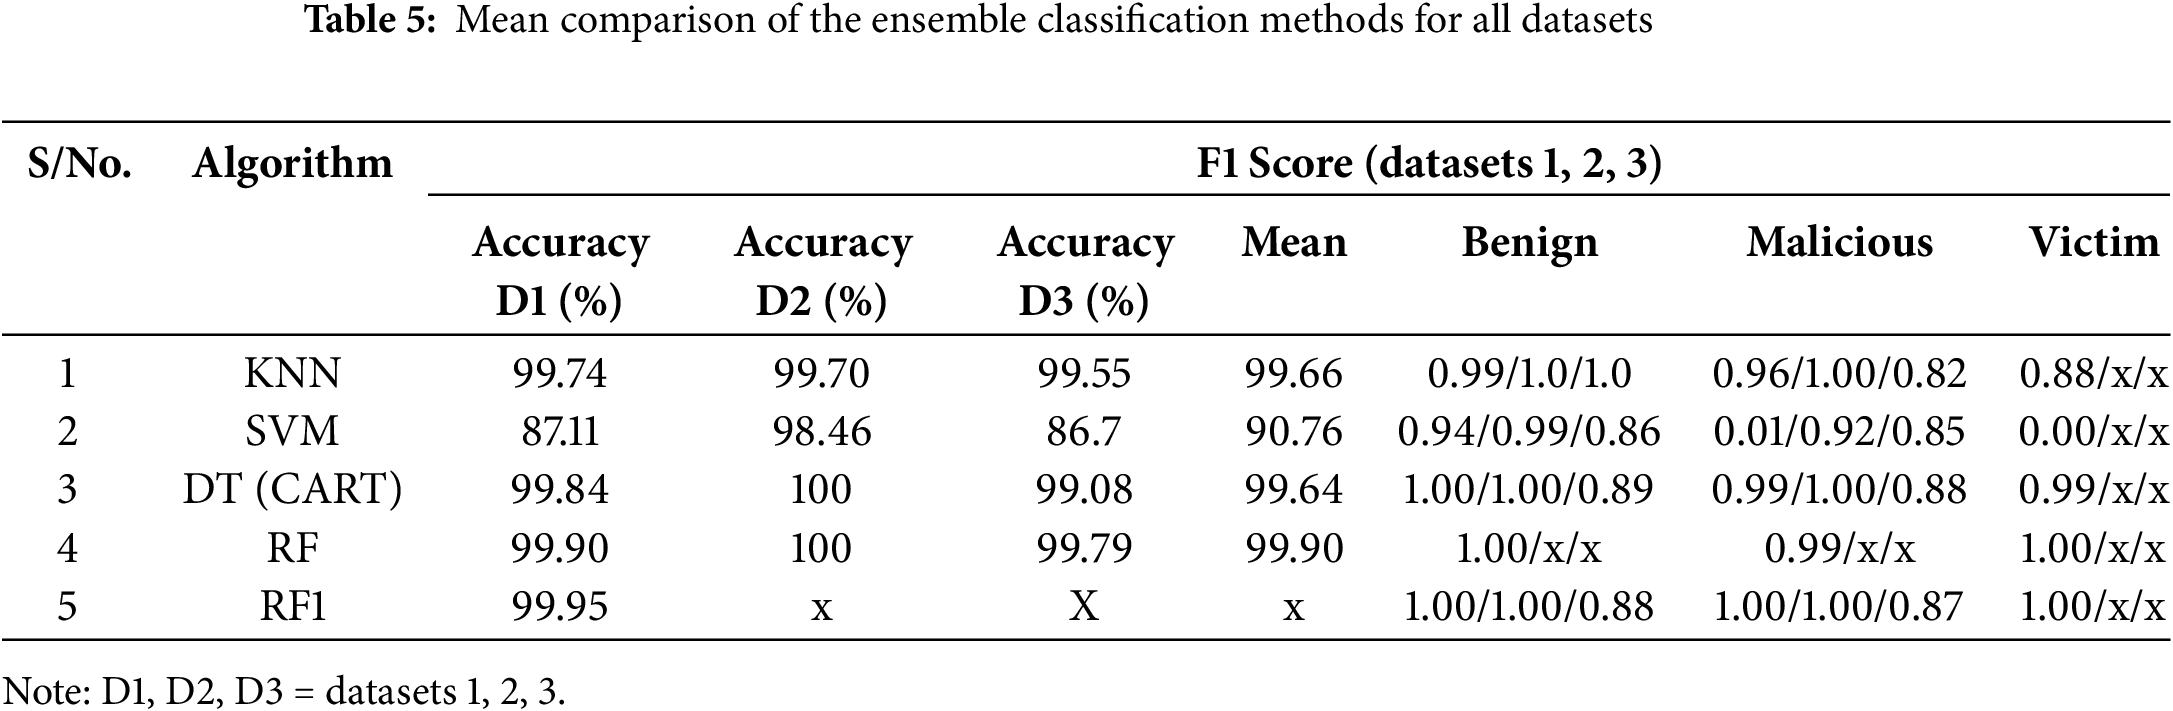
The results indicate that SVM performed poorly, likely due to its inability to handle large amounts of data effectively, which led to the use of a smaller dataset. Data imbalance, the situation in which one class has more instances than the other, poses a challenge for SVM. On the other hand, KNN can handle imbalanced datasets well since it relies on local information and does not assume any underlying data distribution and, thus, can be robust in situations in which the minority class is of interest, or the misclassification of the minority class is more critical. However, SVM may struggle with imbalanced datasets because its performance can be biased towards the majority class, as was the case in dataset 3 in this study. DT and RF are also able to adapt to imbalanced data by adjusting the threshold at each node in the tree, and they can handle irrelevant features through the calculation of the “information gain” used to branch the tree. Table 5 gives the mean comparison of the ensemble classification methods for all datasets.
No prior research in the field of IDSs has focused on a lightweight method to detect APT lateral movement (APT LM) on the Windows OS at the NoIE by analyzing comprehensive APT network traffic packets with multiple datasets using ML. The research described here achieved detection rates ranging from 99.81% to 100%. In a domain in which even a 0.001% increase in the detection rate can significantly impact organizational IS defenses, this achievement has great significance. Related studies focusing on the LM of APT at the LAN have reported accuracies of 99.89% [47], 99.8% [74], 98.67% [75], 98% [76], 85% [48], and 67% [50]. However, this research focused on the critical LM phases of APT attacks (identified in Section 2.1) at the NoIE. The main results are as follows:
The modified RF algorithm (RF1) achieved a score of 99.95% with dataset 1, surpassing the highest score in a similar domain in the previous research by 0.6%.
• The classifiers DT and RF achieved a perfect score of 100% detection using dataset 2.
• RF provided the highest mean detection rate, 99.90%, with a perfect F1 Score of 1.00 for benign traffic and a mean F1 Score of 0.9, showing it to have been the most effective of the four classifiers in the ensemble method.
• For KNN, the detection was consistent, with the mean of 99.66% demonstrating the algorithm’s effectiveness in detecting APT vectors. The relatively high mean F1 Scores of 1.00 for benign and 0.96 for malicious logs also validated the results.
• DT, with a mean detection rate of 99.64%, was an effective classifier for APT detection, with a perfect 1.0 F1 Score for benign traffic and a mean F1 Score of 0.97 for malicious traffic.
• While the SVM classifier had a score of 98.46% for dataset 2, this score was overshadowed by the weak score of 87.11% for dataset 1; 86.7% of dataset 3 and the relatively low F1 Score for the malicious logs. Nevertheless, a mean score of 90.76% is considered moderate.
While the three datasets provided the common features of the APT LMs, among the four classifiers, RF was the most effective in the ensemble method, achieving a mean detection rate of 99.90%. The next most effective was KNN with 99.66%, DT with 99.64%, and SVM with 90.76%. However, the highlight of this study is the achievement of a perfect 100% detection rate with both DT and RF for database 2, a result that no comparable research has achieved before. One significant contribution of this study is the successful demonstration of the machine learning method in detecting APTs within users’ networks immediately after the first line of defense (the end user) has been compromised. Furthermore, the triangulation of the three datasets highlighted a common set of critical features that can be attributed to APT LM (source and destination port numbers, bytes, and packets), thereby providing information of value to practitioners. Also notable is the fact that the proposed detection occurs during the “minimally invasive” lateral phase in this domain, prior to exfiltration, making it effective for addressing both inadvertent and malicious insider threats.
While ML approaches using supervised learning have been proven effective and efficient in ID, a few challenges remain. First, APTs employ zero-day malware with innovative methods to infiltrate, scan, and exploit networked systems. Therefore, obtaining a comprehensive dataset encompassing the entire range of malicious events in a LAN environment may be unfeasible, reducing the possibility of achieving 100% detection in a comprehensive scenario. Second, accurate datasets are crucial for developing effective solutions, as biased datasets can introduce inaccuracies in malicious activity detection, stemming from the quality of historical data [77–80]. To partially mitigate this concern, this project utilized three datasets from various sources to minimize the influence of bias on the proposed solution. Third, a significant challenge relates to the performance of machine learning classifiers during both training and their operational efficiency in real-world deployment scenarios [79,80]. To enhance the robustness and generalizability of the model, cross-validation can be achieved through multiple iterations of training and testing using diverse data compositions. Hence, we conducted grouping and re-grouping of the training and testing data to introduce distinct data sets for each iteration. Fourth, the choice of features in the ML classifiers significantly affects the effectiveness of ID, determining whether the solution performs exceptionally or proves ineffective [77]. To address this concern, this research employs three distinct methods (testing for non-negative features, assessing feature importance, and evaluating feature correlation) to select the most relevant features for detecting malicious activities. Fifth, acquiring clean datasets for training and testing can prove challenging due to the potential for misrepresentation stemming from missing, incomplete, inconsistent, or outlier data.
Several critical challenges affect ML-based APT detection systems’ deployment in operational environments. Primary concerns include scalability limitations due to complex feature engineering and extensive data collection requirements, which impact real-time detection capabilities [49,79]. Additionally, model performance translation across diverse environments presents challenges, as training-testing misalignment affects operational robustness [55,80]. Dataset imbalance, characterized by rare malicious activities, can introduce bias toward benign behavior detection, resulting in elevated false-negative rates for APT attacks [42,64].
To address these limitations, this research implements multiple mitigation strategies. Dataset imbalance is managed through class-specific sampling techniques, including undersampling dominant classes and oversampling minority classes. Scalability is enhanced through dimensionality reduction and feature selection methods (non-negative feature testing, feature importance, and correlation analysis), optimizing computational efficiency by focusing on critical malicious behavior indicators. Model robustness and generalizability are strengthened through iterative cross-validation using diverse data compositions and dynamic data grouping strategies.
6 Conclusions and Recommendations for Future Work
The research presented here evaluated a unique method for intrusion detection focusing on the less-explored APT LM vectors in the immediate LAN environment in the Windows OS. This approach employs an ensemble machine learning (ML) technique with the KNN, SVM, DT, and RF algorithms and three relevant datasets. Among the four classifier algorithms, RF yielded the highest mean detection rate, 99.90%, showing it to have been the most effective classifier in the ensemble method, followed by KNN (99.66%), DT (99.64%), and SVM (90.76%). The modified RF (RF1) with dataset 1 also performed well, achieving a mean score of 99.95%. Furthermore, the perfect 100% detection rate using DR and RF for database 2 is a unique achievement in this domain. The research demonstrates the enhanced accuracy of supervised ML techniques, such as KNN, SVM, DT, and RF, in detecting APTs within lateral networks well before data exfiltration, based on the performance evaluation of these classifiers across three relevant datasets. This suggest that ML can be deployed as a reliable technique for detecting APTs in complex networks in which traditional security measures may be insufficient. When applied, these ML classifiers have demonstrated their ability to identify and mitigate APT malware vectors before they cause damage to networks.
The highlights of the study include:
• a realistic focus on the LM of APT vectors in scenarios in which multiple malicious events occur before data exfiltration/destruction,
• an incremental accuracy improvement of 0.06%, achieving 99.95% compared with 99.89% in a previous study,
• perfect detection accuracy (100%) during the LM phase on dataset 2,
• a realistic technique for detecting and mitigating or eliminating vectors despite unintentional actions by insider threats,
• an additional layer of defense in depth for detecting intrusions/insider threats when traditional security measures fail,
• a demonstrated method with low false positives, and
• a powerful tool for detecting APTs in complex networks where traditional security measures may be insufficient.
Our study has limitations that, at the same time, represent avenues for further research in this domain. First, the datasets that we used may not be fully representative of all possible APT scenarios since other variables could affect the accuracy of our models. A categorized dataset representing a comprehensive taxonomy of APTs could address this issue. Second, we used three generic APT datasets that may not fully represent current ransomware and pseudo-ransomware attacks using zero-day and near zero-day malware, so replicating the method with targeted labeled data could overcome this weakness. Third, we assumed that the LM of APT vectors occurs during two phases of the APT attack process, the establishment of a foothold and LM (Fig. 1). To overcome this limitation, it is necessary to identify and differentiate all of the APT events that occur between these phases through appropriate labeling and replication of the experiment. Fourth, since LM by APTs can occur up to the final stage of data encryption and/or exfiltration, replicating the research across all phases of the APT process could provide greater clarity and more detection opportunities should the APT avoid detection in each preceding phase.
Acknowledgement: The authors gratefully acknowledge the insightful reviews and constructive comments provided by the reviewers of the CMC.
Funding Statement: We thank Rabdan Academy for funding the research presented in the paper.
Author Contributions: The authors confirm contributions to the paper as follows: Mathew Nicho: Study conception and design, literature review, methodology, analysis and interpretation of results and review. Oluwasegun Adelaiye: Data collection, analysis and interpretation of results. Christopher D. McDermott: Interpretation of results and review. Shini Girija: Analysis and interpretation of results and review. All authors reviewed the results and approved the final version of the manuscript.
Availability of Data and Materials: The data that support the findings of this study are available from the corresponding author, upon reasonable request.
Ethics Approval: Not applicable.
Conflicts of Interest: The authors declare no conflicts of interest to report regarding the present study.
References
1. Ahmed Y, Asyhari AT, Arafatur Rahman M. A cyber kill chain approach for detecting advanced persistent threats. Comput Mater Contin. 2021;67(2):2497–513. doi:10.32604/cmc.2021.014223; [Google Scholar] [CrossRef]
2. Lehto M. APT cyber-attack modelling: building a general model. 17th Int Conf Cyber Warfare Secur. 2022;17(1):121–9. doi:10.34190/iccws.17.1.36. [Google Scholar] [CrossRef]
3. Burita L, Le DT. Cyber security and APT groups. In: 2021 Communication and Information Technologies (KIT); 2021 Oct 13–15; Vysoke Tatry, Slovakia: IEEE; 2021. p. 1–7. doi:10.1109/kit52904.2021.9583744. [Google Scholar] [CrossRef]
4. Muthunambu NK, Prabakaran S, Kavin BP, Siruvangur KS, Chinnadurai K, Ali J. A novel eccentric intrusion detection model based on recurrent neural networks with leveraging LSTM. Comput Mater Contin. 2024;78(3):3089–127. doi:10.32604/cmc.2023.043172; [Google Scholar] [CrossRef]
5. Biggio B, Roli F. Wild patterns: ten years after the rise of adversarial machine learning. Pattern Recognit. 2018;84(3):317–31. doi:10.1016/j.patcog.2018.07.023; [Google Scholar] [CrossRef]
6. Dickson A, Thomas C. Improved PSO for optimizing the performance of intrusion detection systems. J Intell Fuzzy Syst. 2020;38(5):6537–47. doi:10.3233/JIFS-179734; [Google Scholar] [CrossRef]
7. Sarker IH. CyberLearning: effectiveness analysis of machine learning security modeling to detect cyber-anomalies and multi-attacks. Internet Things. 2021;14(5):100393. doi:10.1016/j.iot.2021.100393. [Google Scholar] [CrossRef]
8. Krishnapriya S, Singh S. A comprehensive survey on advanced persistent threat (APT) detection techniques. Comput Mater Contin. 2024;80(2):2675–719. doi:10.32604/cmc.2024.052447; [Google Scholar] [CrossRef]
9. Mishra P, Varadharajan V, Tupakula U, Pilli ES. A detailed investigation and analysis of using machine learning techniques for intrusion detection. IEEE Commun Surv Tutor. 2019;21(1):686–728. doi:10.1109/COMST.2018.2847722. [Google Scholar] [CrossRef]
10. Kim SJ, Lee SW. Social engineering based security requirements elicitation model for advanced persistent threats. In: Requirements engineering for internet of things. Singapore: Springer Singapore; 2018. p. 29–40. doi:10.1007/978-981-10-7796-8_3. [Google Scholar] [CrossRef]
11. Nicho M, McDermott CD. Dimensions of ‘socio’ vulnerabilities of advanced persistent threats. In: 2019 International Conference on Software, Telecommunications and Computer Networks (SoftCOM); 2019 Sep 19–21; Split, Croatia: IEEE; 2019. p. 1–5. [Google Scholar]
12. Mohamed N, Alam E, Stubbs GL. Multi-layer protection approach MLPA for the detection of advanced persistent threat. J Positive School Psychology. 2022;6(5):4496–518. [Google Scholar]
13. Nobles C. Botching human factors in cybersecurity in business organizations. HOLISTICA. 2018;9(3):71–88. doi:10.2478/hjbpa-2018-0024. [Google Scholar] [CrossRef]
14. Martín Liras LF, de Soto AR, Prada MA. Feature analysis for data-driven APT-related malware discrimination. Comput Secur. 2021;104(1):102202. doi:10.1016/j.cose.2021.102202. [Google Scholar] [CrossRef]
15. Vanerio J, Casas P. Ensemble-learning approaches for network security and anomaly detection. In: Proceedings of the Workshop on Big Data Analytics and Machine Learning for Data Communication Networks; 2017; Los Angeles, CA, USA: ACM. p. 1–6. doi:10.1145/3098593.3098594; [Google Scholar] [CrossRef]
16. Smiliotopoulos C, Kambourakis G, Kolias C. Detecting lateral movement: a systematic survey. Heliyon. 2024;10(4):e26317. doi:10.1016/j.heliyon.2024.e26317. [Google Scholar] [PubMed] [CrossRef]
17. Longo MSJ, Vossoughi I, Gomez S, Heineman G, Staheli D. Detecting lateral movement [master’s thesis]. Worcester, MA, USA: Worcester Polytechnic Institute. 2017. [Google Scholar]
18. Xia X, Zhang W, Jiang J. Ensemble methods for anomaly detection based on system log. In: 2019 IEEE 24th Pacific Rim International Symposium on Dependable Computing (PRDC); 2019 Dec 1–3; Kyoto, Japan: IEEE; 2019. p. 93–931. doi:10.1109/prdc47002.2019.00034. [Google Scholar] [CrossRef]
19. Kellenberger L, Claudio M. Readiness for tailored attacks and lateral movement detection [Ph.D. dissertation]. Rapperswil, Switzerland: HSR Hochschule für Technik Rapperswil; 2019. [Google Scholar]
20. World Economic Forum. The global risks report 2022 [Internet]. 2022 [cited 2024 Nov 27]. Available from: https://www.wef.ch/risks22. [Google Scholar]
21. Yadav S. Social automation and APT attributions in national cybersecurity. J Cyber Secur Technol. 2024;8(4):286–311. doi:10.1080/23742917.2023.2300494; [Google Scholar] [CrossRef]
22. Smiliotopoulos C, Kambourakis G, Barbatsalou K. On the detection of lateral movement through supervised machine learning and an open-source tool to create turnkey datasets from Sysmon logs. Int J Inf Secur. 2023;22(6):1893–919. doi:10.1007/s10207-023-00725-8; [Google Scholar] [CrossRef]
23. Mandiant. M-Trends 2022: mandiant special report [Internet]. 2022 [cited 2024 Nov 27]. Available from: https://www.mandiant.com/m-trends. [Google Scholar]
24. Sibi Chakkaravarthy S, Sangeetha D, Vaidehi V. A survey on malware analysis and mitigation techniques. Comput Sci Rev. 2019;32(3):1–23. doi:10.1016/j.cosrev.2019.01.002. [Google Scholar] [CrossRef]
25. Mitre. Lateral movement [Internet]. 2019 [cited 2024 Nov 27]. Available from: https://www.attack.mitre.org/tactics/TA0008. [Google Scholar]
26. Tatam M, Shanmugam B, Azam S, Kannoorpatti K. A review of threat modelling approaches for APT-style attacks. Heliyon. 2021;7(1):e05969. doi:10.1016/j.heliyon.2021.e05969;. [Google Scholar] [PubMed] [CrossRef]
27. Han X, Pasquier T, Bates A, Mickens J, Seltzer M. UNICORN: runtime provenance-based detector for advanced persistent threats. arXiv:2001.01525. 2020. [Google Scholar]
28. Katurde AD, Musale J, Lohar A, Kolapkar SV, Shinde BB, Shinde KB, et al. SecureSense: AI/ML based anomaly detection tool. In: 2024 International Conference on Intelligent Systems for Cybersecurity (ISCS); 2024 May 3–4; Gurugram, India: IEEE; 2024. p. 1–6. doi:10.1109/ISCS61804.2024.10581060. [Google Scholar] [CrossRef]
29. Alshamrani A, Myneni S, Chowdhary A, Huang D. A survey on advanced persistent threats: techniques, solutions, challenges, and research opportunities. IEEE Commun Surv Tutor. 2019;21(2):1851–77. doi:10.1109/COMST.2019.2891891. [Google Scholar] [CrossRef]
30. Wang Z, Sun L, Zhu H. Defining social engineering in cybersecurity. IEEE Access. 2020;8:85094–115. doi:10.1109/ACCESS.2020.2992807. [Google Scholar] [CrossRef]
31. He M, Huang Y, Wang X, Wei P, Wang X. A lightweight and efficient IoT intrusion detection method based on feature grouping. IEEE Internet Things J. 2024;11(2):2935–49. doi:10.1109/JIOT.2023.3294259. [Google Scholar] [CrossRef]
32. Pacheco F, Exposito E, Gineste M, Baudoin C, Aguilar J. Towards the deployment of machine learning solutions in network traffic classification: a systematic survey. IEEE Commun Surv Tutor. 2019;21(2):1988–2014. doi:10.1109/COMST.2018.2883147. [Google Scholar] [CrossRef]
33. Sharma A, Gupta BB, Singh AK, Saraswat VK. Orchestration of APT malware evasive manoeuvers employed for eluding anti-virus and sandbox defense. Comput Secur. 2022;115(6):102627. doi:10.1016/j.cose.2022.102627. [Google Scholar] [CrossRef]
34. Stojanović B, Hofer-Schmitz K, Kleb U. APT datasets and attack modeling for automated detection methods: a review. Comput Secur. 2020;92(2):101734. doi:10.1016/j.cose.2020.101734; [Google Scholar] [CrossRef]
35. Zimba A, Chen H, Wang Z, Chishimba M. Modeling and detection of the multi-stages of Advanced Persistent Threats attacks based on semi-supervised learning and complex networks characteristics. Future Gener Comput Syst. 2020;106(9):501–17. doi:10.1016/j.future.2020.01.032; [Google Scholar] [CrossRef]
36. Pin-Yu Chen, Choudhury S, Rodriguez L, Hero AO, Ray I. Toward cyber-resiliency metrics for action recommendations against lateral movement attacks. In: Industrial control systems security and resiliency. Cham, Switzerland: Springer.; 2019. p. 71–92. [Google Scholar]
37. Shi Y, Chang X, Rodríguez RJ, Zhang Z, Trivedi KS. Quantitative security analysis of a dynamic network system under lateral movement-based attacks. Reliab Eng Syst Saf. 2019;183(1):213–25. doi:10.1016/j.ress.2018.11.022. [Google Scholar] [CrossRef]
38. Purvine E, Johnson JR, Lo C. A graph-based impact metric for mitigating lateral movement cyber attacks. In: Proceedings of the 2016 ACM Workshop on Automated Decision Making for Active Cyber Defense; 2016; Vienna, Austria: ACM. p. 45–52. doi:10.1145/2994475.2994476. [Google Scholar] [CrossRef]
39. Ali WA, Manasa KN, Aljunid M, Bendechache M, Sandhya P. Review of current machine learning approaches for anomaly detection in network traffic. J Telecommun Digit Econ. 2020;8(4):64–95. doi:10.18080/jtde.v8n4.307; [Google Scholar] [CrossRef]
40. Shyam R, Singh R. A taxonomy of machine learning techniques. J Adv Robot. 2021;8(3):18–25; [Google Scholar]
41. Lanvin M, Gimenez PF, Han Y, Majorczyk F, Mé L, Totel É. Detecting APT through graph anomaly detection. In: RESSI 2022-Rendez-Vous de la Recherche et de l’Enseignement de la Sécurité des Systèmes d’Information. France: Chambon-sur-Lac; 2022. p. 1–3. [Google Scholar]
42. Quintero-Bonilla S, Martín del Rey A. A new proposal on the advanced persistent threat: a survey. Appl Sci. 2020;10(11):3874. doi:10.3390/app10113874. [Google Scholar] [CrossRef]
43. Ganaie MA, Hu M, Malik AK, Tanveer M, Suganthan PN. Ensemble deep learning: a review. Eng Appl Artif Intell. 2022;115:105151. doi:10.1016/j.engappai.2022.105151; [Google Scholar] [CrossRef]
44. Ishaya AO, Aminat A, Hashim B, Adekunle AA. Improved detection of advanced persistent threats using an anomaly detection ensemble approach. Adv Sci Technol Eng Syst J. 2021;6(2):295–302. doi:10.25046/aj060234. [Google Scholar] [CrossRef]
45. Ahmad Z, Shahid Khan A, Wai Shiang C, Abdullah J, Ahmad F. Network intrusion detection system: a systematic study of machine learning and deep learning approaches. Trans Emerging Tel Tech. 2021;32(1):e4150. doi:10.1002/ett.4150; [Google Scholar] [CrossRef]
46. Bai T, Bian H, Abou Daya A, Salahuddin MA, Limam N, Boutaba R. A machine learning approach for RDP-based lateral movement detection. In: 2019 IEEE 44th Conference on Local Computer Networks (LCN); 2019 Oct 14–17; Osnabrueck, Germany: IEEE; 2019. p. 242–5. doi:10.1109/lcn44214.2019.8990853; [Google Scholar] [CrossRef]
47. Al-Saraireh J, Masarweh A. A novel approach for detecting advanced persistent threats. Egypt Inform J. 2022;23(4):45–55. doi:10.1016/j.eij.2022.06.005. [Google Scholar] [CrossRef]
48. Bowman B, Laprade C, Ji Y, Huang HH. Detecting lateral movement in enterprise computer networks with unsupervised graph AI. In: 23rd International Symposium on Research in Attacks, Intrusions and Defenses (RAID 2020); 2020; San Sebastian, Spain:Springer. p. 257–68. [Google Scholar]
49. Ahamed S, Lakshmanan R. Real-time heuristic-based detection of attacks performed on a linux machine using osquery. SN Comput Sci. 2022;3(5):405. doi:10.1007/s42979-022-01288-6. [Google Scholar] [CrossRef]
50. Kriaa S, Chaabane Y. SecKG: leveraging attack detection and prediction using knowledge graphs. In: 12th International Conference on Information and Communication Systems (ICICS); 2021 May 24–26; Valencia, Spain: IEEE; 2021. p. 112–9. doi:10.1109/icics52457.2021.9464587; [Google Scholar] [CrossRef]
51. Goodman E, Ingram J, Martin S, Grunwald D. Using bipartite anomaly features for cyber security applications. In: 2015 IEEE 14th International Conference on Machine Learning and Applications (ICMLA); 2015 Dec 9–11; Miami, FL, USA: IEEE; 2015. p. 301–6. doi:10.1109/ICMLA.2015.69. [Google Scholar] [CrossRef]
52. Arifeen M, Petrovski A, Petrovski S. Automated microsegmentation for lateral movement prevention in industrial Internet of Things (IIoT). In: 2021 14th International Conference on Security of Information and Networks (SIN); 2021 Dec 15–17; Edinburgh, UK: IEEE; 2021. p. 1–6. doi:10.1109/SIN54109.2021.9699232; [Google Scholar] [CrossRef]
53. King IJ, Huang HH. Euler: detecting network lateral movement via scalable temporal link prediction. ACM Trans Priv Secur. 2023;26(3):1–36. doi:10.1145/3588771. [Google Scholar] [CrossRef]
54. Ramaki AA, Ghaemi-Bafghi A, Rasoolzadegan A. CAPTAIN: community-based advanced persistent threat analysis in IT networks. Int J Crit Infrastruct Prot. 2023;42(1):100620. doi:10.1016/j.ijcip.2023.100620; [Google Scholar] [CrossRef]
55. Chaganti R, Ravi V, Pham TD. A multi-view feature fusion approach for effective malware classification using Deep Learning. J Inf Secur Appl. 2023;72(21):103402. doi:10.1016/j.jisa.2022.103402; [Google Scholar] [CrossRef]
56. He D, Gu H, Zhu S, Chan S, Guizani M. A comprehensive detection method for the lateral movement stage of APT attacks. IEEE Internet Things J. 2024;11(5):8440–7. doi:10.1109/JIOT.2023.3322412. [Google Scholar] [CrossRef]
57. Binde B, McRee R, O’Connor TJ. Assessing outbound traffic to uncover advanced persistent threat (white paper). SANS Technology Institute; 2011. doi:10.13140/RG.2.2.16401.07520. [Google Scholar] [CrossRef]
58. Han W, Xue J, Wang Y, Zhang F, Gao X. APTMalInsight: identify and cognize APT malware based on system call information and ontology knowledge framework. Inf Sci. 2021;546(3):633–64. doi:10.1016/j.ins.2020.08.095; [Google Scholar] [CrossRef]
59. Moon D, Im H, Lee J, Park J. MLDS: multi-layer defense system for preventing advanced persistent threats. Symmetry. 2014;6(4):997–1010. doi:10.3390/sym6040997; [Google Scholar] [CrossRef]
60. Su Y, Li M, Tang C, Shen R. A framework of APT detection based on dynamic analysis. In: Proceedings of the 2015 4th National Conference on Electrical, Electronics and Computer Engineering; 2015 Dec 12–13; Xi’an, China: Atlantis Press; 2016. p. 1047–53. doi:10.2991/nceece-15.2016.187. [Google Scholar] [CrossRef]
61. Marchetti M, Pierazzi F, Colajanni M, Guido A. Analysis of high volumes of network traffic for Advanced Persistent Threat detection. Comput Netw. 2016;109(4):127–41. doi:10.1016/j.comnet.2016.05.018. [Google Scholar] [CrossRef]
62. Siddiqui S, Khan MS, Ferens K, Kinsner W. Detecting advanced persistent threats using fractal dimension based machine learning classification. In: Proceedings of the 2016 ACM on International Workshop on Security and Privacy Analytics; 2016; New Orleans, LA, USA: ACM. p. 64–9. doi:10.1145/2875475.2875484; [Google Scholar] [CrossRef]
63. Om H, Kundu A. A hybrid system for reducing the false alarm rate of anomaly intrusion detection system. In: 2012 1st International Conference on Recent Advances in Information Technology (RAIT); 2012 Mar 15–17; Dhanbad, India: IEEE; 2012. p. 131–6. doi:10.1109/RAIT.2012.6194493. [Google Scholar] [CrossRef]
64. Pham NT, Foo E, Suriadi S, Jeffrey H, Lahza HFM. Improving performance of intrusion detection system using ensemble methods and feature selection. In: Proceedings of the Australasian Computer Science Week Multiconference; 2018; Brisband, QLD, Australia: ACM. p. 1–6. doi:10.1145/3167918.3167951; [Google Scholar] [CrossRef]
65. Ullah I, Mahmoud QH. A filter-based feature selection model for anomaly-based intrusion detection systems. In: 2017 IEEE International Conference on Big Data (Big Data); 2017 Dec 11–14; Boston, MA, USA: IEEE; 2017. p. 2151–9. doi:10.1109/BigData.2017.8258163; [Google Scholar] [CrossRef]
66. Chandrashekar G, Sahin F. A survey on feature selection methods. Comput Electr Eng. 2014;40(1):16–28. doi:10.1016/j.compeleceng.2013.11.024; [Google Scholar] [CrossRef]
67. Dwibedi S, Pujari M, Sun W. A comparative study on contemporary intrusion detection datasets for machine learning research. In: 2020 IEEE International Conference on Intelligence and Security Informatics (ISI); 2020 Nov 9–10; Arlington, VA, USA: IEEE; 2020. p. 1–6. doi:10.1109/isi49825.2020.9280519; [Google Scholar] [CrossRef]
68. Sabir B, Ullah F, Ali Babar M, Gaire R. Machine learning for detecting data exfiltration. ACM Comput Surv. 2022;54(3):1–47. doi:10.1145/3442181; [Google Scholar] [CrossRef]
69. Ring M, Wunderlich S, Grüdl D, Landes D, Hotho A. Flow-based benchmark data sets for intrusion detection. In: Proceedings of the 16th European Conference on Cyber Warfare and Security (ECCWS 2017); 2017; Dublin, Ireland: Academic Conferences and Publishing International (ACPI). [Google Scholar]
70. Umer MF. dataset_minimal (Dataset) [Internet]. 2018 [cited 2024 Nov 27]. Available from: https://figshare.com/articles/dataset/dataset_minimal_zip/5756520/1. [Google Scholar]
71. Liu J, Shen Y, Simsek M, Kantarci B, Mouftah HT, Bagheri M, et al. A new realistic benchmark for advanced persistent threats in network traffic. IEEE Netw Lett. 2022;4(3):162–6. doi:10.1109/LNET.2022.3185553; [Google Scholar] [CrossRef]
72. Wang A. Splitting data into the train/validation/test dataset. [cited 2024 Nov 27]. Available from: https://github.com/anthony-wang/BestPractices/blob/master/notebooks/2-data_splitting.ipynb. [Google Scholar]
73. Hrishipoola. KNN, decision tree, SVM, and logistic regression classifiers to predict loan status. [cited 2024 Nov 27]. Available from: https://gist.github.com/hrishipoola/323d0459d9faeb466496d4e5ffbfb516. [Google Scholar]
74. Chandran S, Hrudya P, Poornachandran P. An efficient classification model for detecting advanced persistent threat. In: 2015 International Conference on Advances in Computing, Communications and Informatics (ICACCI); 2015 Aug 10–13; Kochi, India: IEEE; 2015. p. 2001–9. doi:10.1109/ICACCI.2015.7275911. [Google Scholar] [CrossRef]
75. Schindler T. Anomaly detection in log data using graph databases and machine learning to defend advanced persistent threats. arXiv:1802.00259. 2018. [Google Scholar]
76. Uppströmer V, Råberg H. Detecting lateral movement in microsoft active directory log files: a supervised machine learning approach [master’s thesis]. Karlskrona, Sweden: Faculty of Computing, Blekinge Institute of Technology; 2019. [Google Scholar]
77. Sultana N, Chilamkurti N, Peng W, Alhadad R. Survey on SDN based network intrusion detection system using machine learning approaches. Peer Peer Netw Appl. 2019;12(2):493–501. doi:10.1007/s12083-017-0630-0; [Google Scholar] [CrossRef]
78. Lopez-Martin M, Carro B, Sanchez-Esguevillas A. Application of deep reinforcement learning to intrusion detection for supervised problems. Expert Syst Appl. 2020;141(6):112963. doi:10.1016/j.eswa.2019.112963. [Google Scholar] [CrossRef]
79. Ahmad R, Wazirali R, Abu-Ain T. Machine learning for wireless sensor networks security: an overview of challenges and issues. Sensors. 2022;22(13):4730. doi:10.3390/s22134730;. [Google Scholar] [PubMed] [CrossRef]
80. Liu H, Lang B. Machine learning and deep learning methods for intrusion detection systems: a survey. Appl Sci. 2019;9(20):4396. doi:10.3390/app9204396. [Google Scholar] [CrossRef]
Cite This Article
 Copyright © 2025 The Author(s). Published by Tech Science Press.
This work is licensed under a Creative Commons Attribution 4.0 International License , which permits unrestricted use, distribution, and reproduction in any medium, provided the original work is properly cited.
 Downloads
 Citation Tools