
 Submit a Paper
 Propose a Special lssue
 Open Access
ARTICLE

xCViT: Improved Vision Transformer Network with Fusion of CNN and Xception for Skin Disease Recognition with Explainable AI
1 Department of Electrical Engineering, Wah Engineering College, University of Wah, Wah Cantt, 47040, Pakistan
2 Department of Computer Science, HITEC University, Taxila, 47080, Pakistan
3 Department of Applied Informatics, Vytautas Magnus University, Kaunas, 44309, Lithuania
* Corresponding Author: Robertas Damaševičius. Email:
Computers, Materials & Continua 2025, 83(1), 1367-1398. https://doi.org/10.32604/cmc.2025.059301
Received 03 October 2024; Accepted 19 February 2025; Issue published 26 March 2025
 View Full Text
 Download PDF
Abstract
Skin cancer is the most prevalent cancer globally, primarily due to extensive exposure to Ultraviolet (UV) radiation. Early identification of skin cancer enhances the likelihood of effective treatment, as delays may lead to severe tumor advancement. This study proposes a novel hybrid deep learning strategy to address the complex issue of skin cancer diagnosis, with an architecture that integrates a Vision Transformer, a bespoke convolutional neural network (CNN), and an Xception module. They were evaluated using two benchmark datasets, HAM10000 and Skin Cancer ISIC. On the HAM10000, the model achieves a precision of 95.46%, an accuracy of 96.74%, a recall of 96.27%, specificity of 96.00% and an F1-Score of 95.86%. It obtains an accuracy of 93.19%, a precision of 93.25%, a recall of 92.80%, a specificity of 92.89% and an F1-Score of 93.19% on the Skin Cancer ISIC dataset. The findings demonstrate that the model that was proposed is robust and trustworthy when it comes to the classification of skin lesions. In addition, the utilization of Explainable AI techniques, such as Grad-CAM visualizations, assists in highlighting the most significant lesion areas that have an impact on the decisions that are made by the model.Keywords
Millions of cases of skin cancer are diagnosed worldwide each year, making it one of the most common types of cancer [1]. The World Health Organization (WHO) estimates that over seven million instances of non-melanoma skin cancer are diagnosed worldwide each year [2]. The development of abnormal cells in the epidermis, the skin’s outermost layer, because of DNA damage leading to mutations, is known as skin cancer. These skin lesions could be benign or malignant. Early detection is key to effective treatment of skin cancer, especially before it spreads to other parts of the skin or enters the deeper layers of the skin.
Automated skin cancer classification is useful for determining the stage and kind of cancer. Both benign lesions like ageing spots and moles can be mistakenly detected by manual detection, as well of malignant stage. Deep learning has provided a wide role in detecting skin cancer accurately and efficiently. For example, Alabduljabbar et al. [3] and Gomathi et al. [4] proposed a CNN based technique over the MNIST HAM10000 dataset, which showed better accuracy and satisfied quality metrics. More algorithms with greater accuracy and reduced time complexity have been made possible by advances in deep learning. Optimized transfer learning-based models were developed by Vidhyalakshmi et al. [5] to improve skin cancer detection and diagnosis. Still, greater validation accuracy is still needed because there aren’t as many images as possible to train an effective model for skin cancer recognition. To get around this limitation, data augmentation is used, and a bigger dataset is needed to build an efficient model.
The identification of skin cancer at an early stage by automated and intelligent detection can be critical to long-term aims in skin cancer research. Our technique aims to close significant gaps in the thorough analysis of skin cancer and its symptoms, which helps in the detection of skin cancer in its various phases as follows:
• Developing a deep learning model that can reliably and early diagnose skin cancer, extract relevant biomarkers from dermatological images, and analyse those images with accuracy and efficiency.
• Using deep learning methods, including ensemble models or anomaly detection algorithms, to lower the number of false positives and false negatives in the diagnosis of skin cancer.
• Aiming to get higher validation accuracy to improve classification quality.
Our objective is to identify skin lesions that are either benign or malignant with the highest degree of precision while simultaneously providing information that is both informative and insightful. To accomplish these goals, we propose an xCViT methodology that combines newly designed architecture of CNN and Vision Transformers (ViTs) with the Xception architecture. We enhance the efficiency of local feature extraction by making modifications to convolutional neural networks (CNNs). Vision transformers (ViTs) are used to capture long-term dependencies and global context. The integration of these elements enhances the efficiency of the model and its ability to recognize complicated structures by combining the strengths of both CNNs and Vision Transformers (ViTs) while avoiding their individual limitations.
To address these challenges this study introduces a novel xCViT methodology, which merges the advantages of CNNs and Vision Transformers (ViTs) with an Xception architecture, addressing the deficiencies in automated skin cancer detection, thereby improving classification accuracy and diagnostic robustness.
The primary objectives are: (1) to enhance validation accuracy and classification quality, (2) to establish a dependable and efficient model for the early detection of skin cancer, and (3) to reduce false positives and false negatives through the utilization of ensemble methods and anomaly detection algorithms. The suggested method’s novelty lies in the rapid integration of local feature extraction via CNNs and global contextual comprehension using ViTs, effectively tackling intricate issues in picture identification. The model’s intricate procedures offer excellent potential for research and clinical applications, guaranteeing enhanced diagnostic insights and improved patient results.
Skin cancer classification is a complicated field for which various kinds of deep learning algorithms have been found beneficial. These techniques are summarized below.
Kavitha et al. [6] applied preprocessing methods to remove noise from the data, followed by the use of R-CNN algorithms, which achieved an accuracy of 84.32%. They used three deep learning models—ResNet152 (v2), ConvNeXtBase, and ViT Base. Islam et al. [7] proposed a fusion model referred to as the “teacher model.” Their study included six stages of preprocessing, and data augmentation on the HAM10000 dataset, and achieved an accuracy of 98.75% and showcased its small size, which could facilitate real-life applications. Abdullah et al. [8] developed a model for identifying all skin lesions using the HAM10000 dataset. Their sequential CNN outperformed other deep learning approaches, including pretrained CNN, VGG19, ResNet50, InceptionV3, ViT over RGB, and Entropy-NDOELM. Their model achieved a maximum accuracy of 96.25%, representing the best results. Nasir et al. [9] proposed a novel Convolutional Spiking Attention Module (CSAM), integrated into deep neural architectures to enhance critical features and suppress noise-inducing elements. CSAMs were embedded within the Spiking Attention Block (SAB), and its performance was evaluated using InceptionResNetV2, DenseNet201, and Xception architectures for skin lesion classification, both with and without SAB integration. The SAB-based models outperformed state-of-the-art methods on the HAM10000 dataset, with cross-dataset validation conducted on the ISIC-2019 dataset. Monica et al. [10] employed a deep learning-based fusion methodology using ISIC and HAM10000 datasets. They removed noise using normalization and preprocessing techniques. Mask-RCNN, using pre-trained models ResNeXt101, Xception, and InceptionV3, was applied, and extracted features were passed into a modified GRU model. This methodology achieved accuracy rates of 99.95% on the ISIC dataset, and 99.98% on the HAM10000 dataset. Agrawal et al. [11] proposed a lightweight deep CNN model called CACBL-Net, which incorporated a Channel Attention and Adaptive Class Balance Focal Loss function. This model effectively handled data imbalance and provided portability due to its lightweight architecture. It was tested on the HAM10000, PAD-UFES-20, and MED-NODE datasets, achieving sensitivities of 90.0%, 91.88%, and 91.31%, respectively. The lightweight nature of the model allowed prediction times of 0.006, 0.010, and 0.011 s, highlighting its real-time efficiency. Claret et al. [12] proposed an approach to detect skin cancer using discrete wavelet transformation (DWT). This method extracted features from various skin lesion images in the HAM10000 dataset and processed them using an ANN and multi-layer perceptron resulting in sensitivity of 94% and specificity of 91%. Shehzad et al. [13] introduced an ensemble technique using EfficientNetV2S and Swim Transformer models. They applied preprocessing and normalization to remove darker image regions, enhancing accuracy. Modifying the fifth block of EfficientNetV2S and incorporating Swim Transformer led to significant accuracy of 99.10%. Hussain et al. [14] addressed multiclass skin lesion classification with a model called SkinNet-INIO. This system used fusion-assisted deep neural networks and an improved nature-inspired optimization algorithm. Preprocessing methods included dark channel haze and top-bottom filtering. The approach also incorporated genetic algorithms for hyperparameter selection and anti-lion optimization for feature selection. Tested on the ISIC2018 and ISIC2019 datasets, it achieved accuracy rates of 96.1% and 99.9%, respectively, demonstrating the benefits of combining deep learning with optimization techniques. Maqsood et al. [15] focused on skin lesion localization and classification. Their system used contrast enhancement preprocessing and a custom 26-layer convolutional neural network (CNN) for lesion segmentation. They also explored the fusion of deep feature vectors extracted from pre-trained CNN models. The system achieved accuracy rates of 98.57% on HAM10000 and 98.62% on ISIC2018, outperforming previous methodologies. Maqsood et al. [16] extended this research to monkeypox classification, introducing the MOX-NET framework, which used pre-trained deep learning models and a convolutional sparse image decomposition fusion strategy. Tested on the MSLID dataset, it achieved an accuracy of 98.64%, highlighting its effectiveness in diagnosing infectious diseases like monkeypox. Nawaz et al. [17] proposed an improved DenseNet77-based UNET model for melanoma segmentation. They addressed the challenges of segmentation caused by shape and color variations and light conditions by incorporating DenseNet77 into the UNET encoder unit. Testing on the ISIC-2017 and ISIC-2018 datasets resulted in segmentation accuracies of 99.21% and 99.51%, respectively. Nivedha et al. [18] introduced a diagnostic system for melanoma using the African Gorilla Troops Optimizer (AGTO) algorithm. They employed Faster R-CNN to identify features for classification and achieved an accuracy of 98.55% on the ISIC-2020 dataset, outperforming state-of-the-art models. Ren et al. [19] focused on monkeypox detection using twelve pre-trained deep learning models, including VGG16, ResNet152, and DenseNet201. DenseNet201 achieved the best classification results, with an accuracy of 98.89% for binary classification and 100% for four-class classification. This study demonstrated the adaptability of deep learning models in addressing various skin-related diseases, even with limited training data. These studies collectively underscore the importance of deep learning and AI in the medical field, especially for the detection, segmentation, and classification of skin lesions. By employing various neural network architectures, feature fusion methods, and optimization algorithms, these approaches have made significant strides toward enhancing diagnostic accuracy, improving healthcare outcomes, and supporting medical professionals in early and effective disease management.
Fig. 1 provides a graphical summary of the literature review, including preprocessing methods, model architecture, datasets, and performance metrics. Additional analysis has to be done to develop a model that can more accurately identify all kinds of skin cancer than the methods used today. While classifying skin cancer cases into binary classes, some researchers were unable to manage multiclass classification with better results. The earlier techniques suggested for multiclass skin cancer diagnosis likewise failed to achieve higher accuracy. Classifying skin cancer automatically from dermoscopy images is difficult because of great visual similarity between classes and intraclass variance, and due to existence of both internal and external abnormalities and the difference between the affected and normal skin.
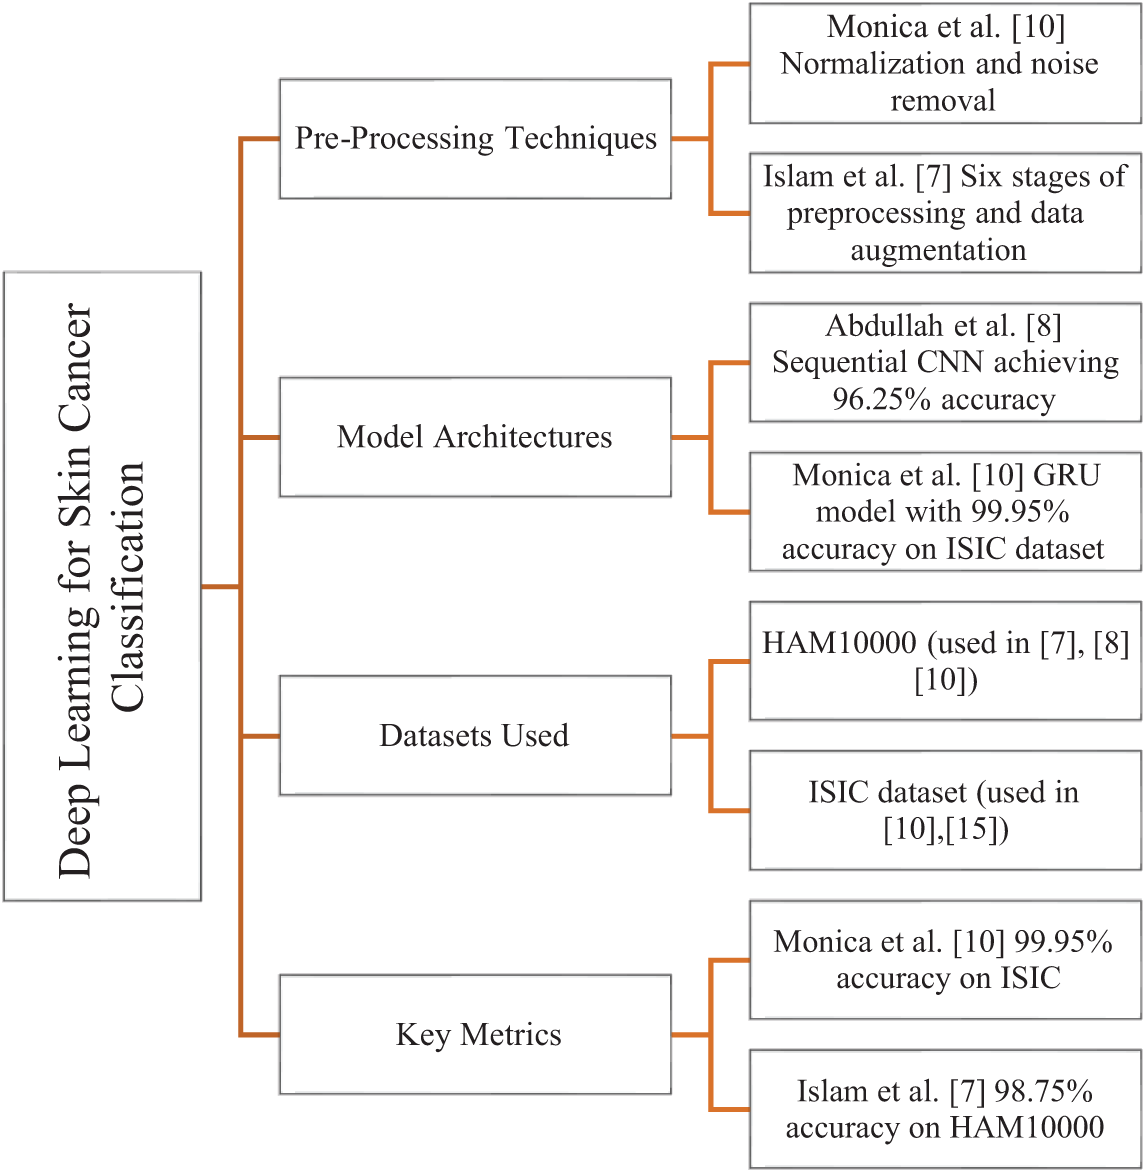
Figure 1: Graphical representation of the literature review summarizing preprocessing methods, model architectures, datasets used, and key performance metrics with corresponding references [7,8,10,15]
This section describes the proposed fusion-based technique, named xCViT, for classifying and localizing the skin lesions using images. The proposed xCViT architecture for classifying skin lesions is shown in Fig. 2. This fused model is trained on enhanced images and fused with the customized CNN, ViT, and pre-trained model using a depth concatenation layer. The hyperparameters of the proposed fused architecture have been initialized using the Bayesian Optimization technique instead of random initialization. Trained model features are passed to the SoftMax classifier for classification purposes.
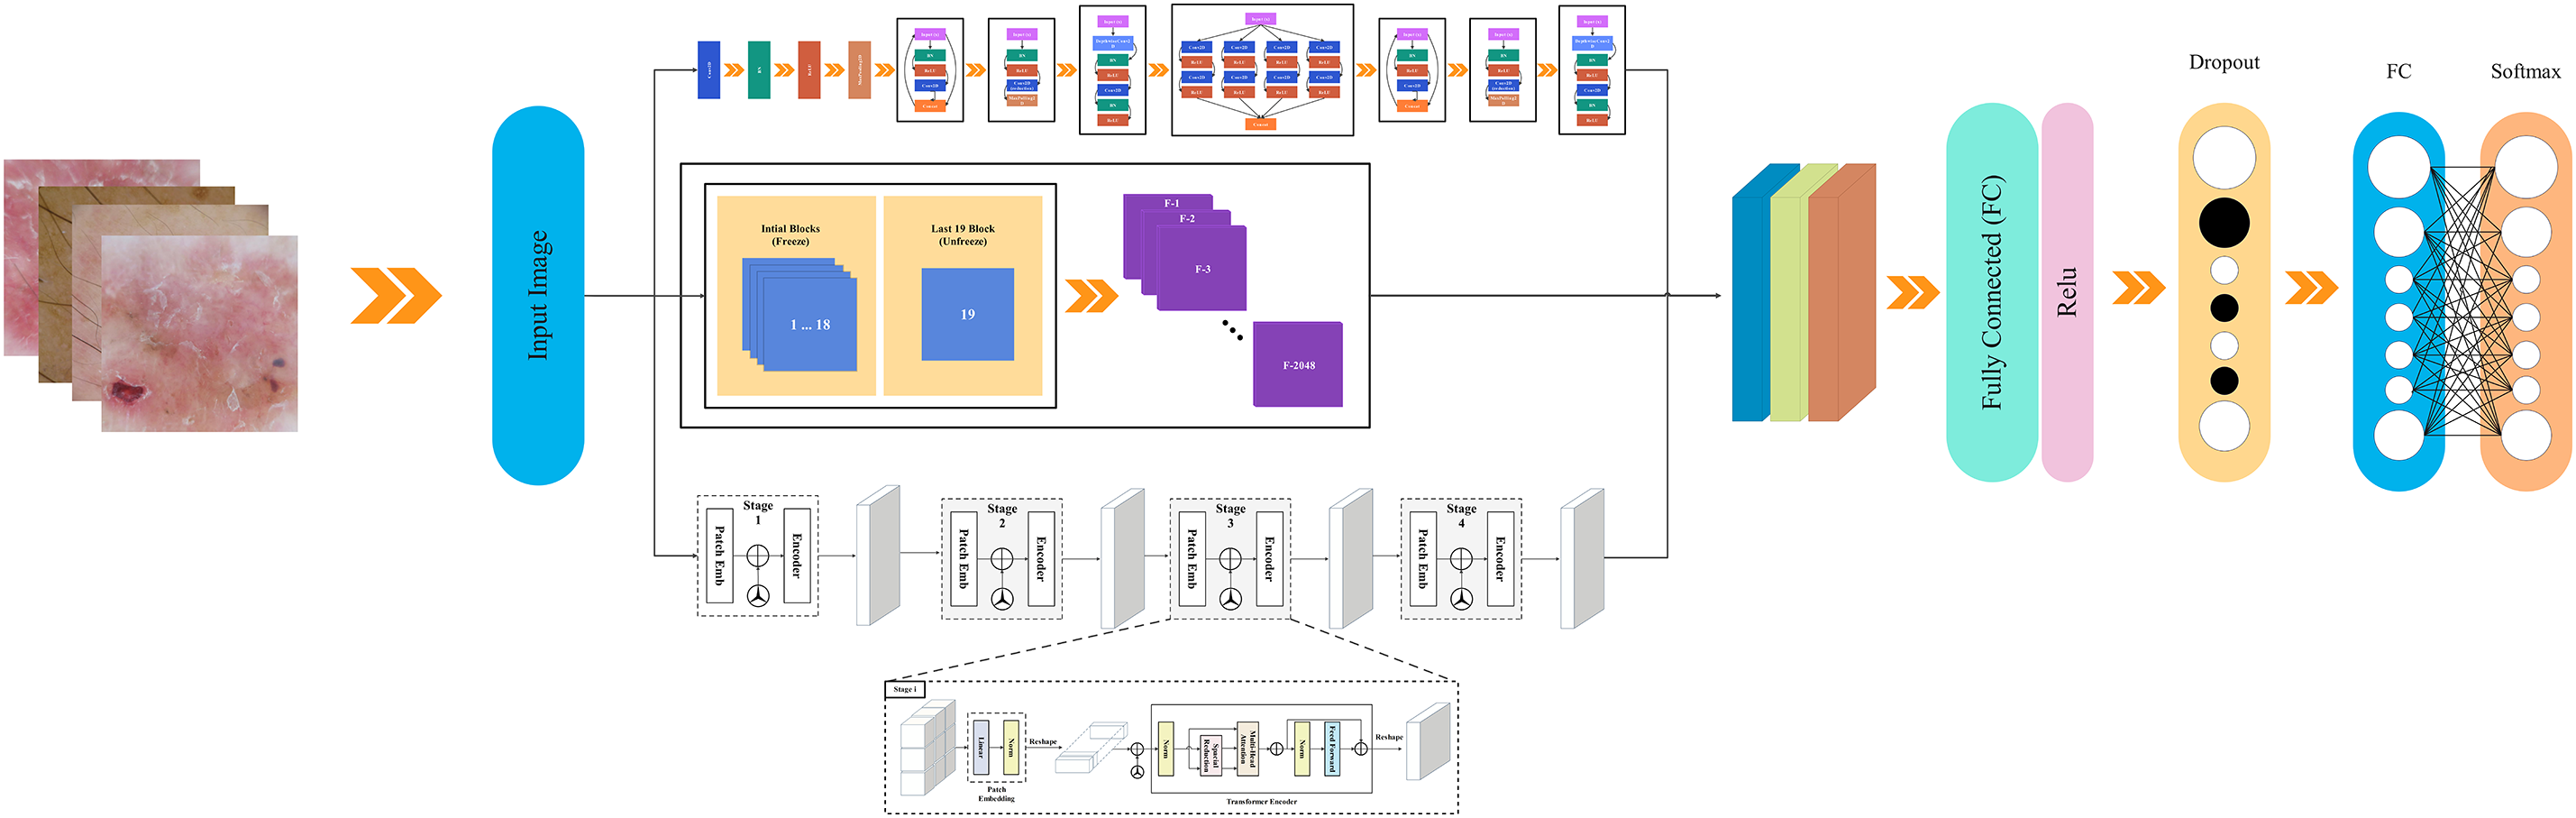
Figure 2: xCViT architecture
This study contributes to the advancement of accessible and scalable autonomous diagnostics through a hybrid approach utilizing CNN, ViT, and Xception architectures. Using Explainable AI (xAI) techniques, with Grad-CAM, would enhance model transparency and interpretability, hence fostering greater trust and aiding doctors in improved decision-making. An interpretable approach named Grad-CAM has been used for the explainability of the proposed architecture. A detailed description of each step is discussed below.
The “Human Against Machine with 10,000 training images,” or HAM10000 dataset, is a compilation of dermoscopy images used for training neural networks in the automated detection of pigmented skin lesions. This dataset has ten thousand visualizations from diverse populations preserved in multiple modalities. This encompasses a broad spectrum of skin malignancies, including basal cell carcinoma (bcc), actinic keratosis (akiec), melanoma (mel), melanocytic nevi (nv), benign keratosis (bkl), dermatofibroma (df), and vascular lesions (vasc), as depicted in Fig. 3.
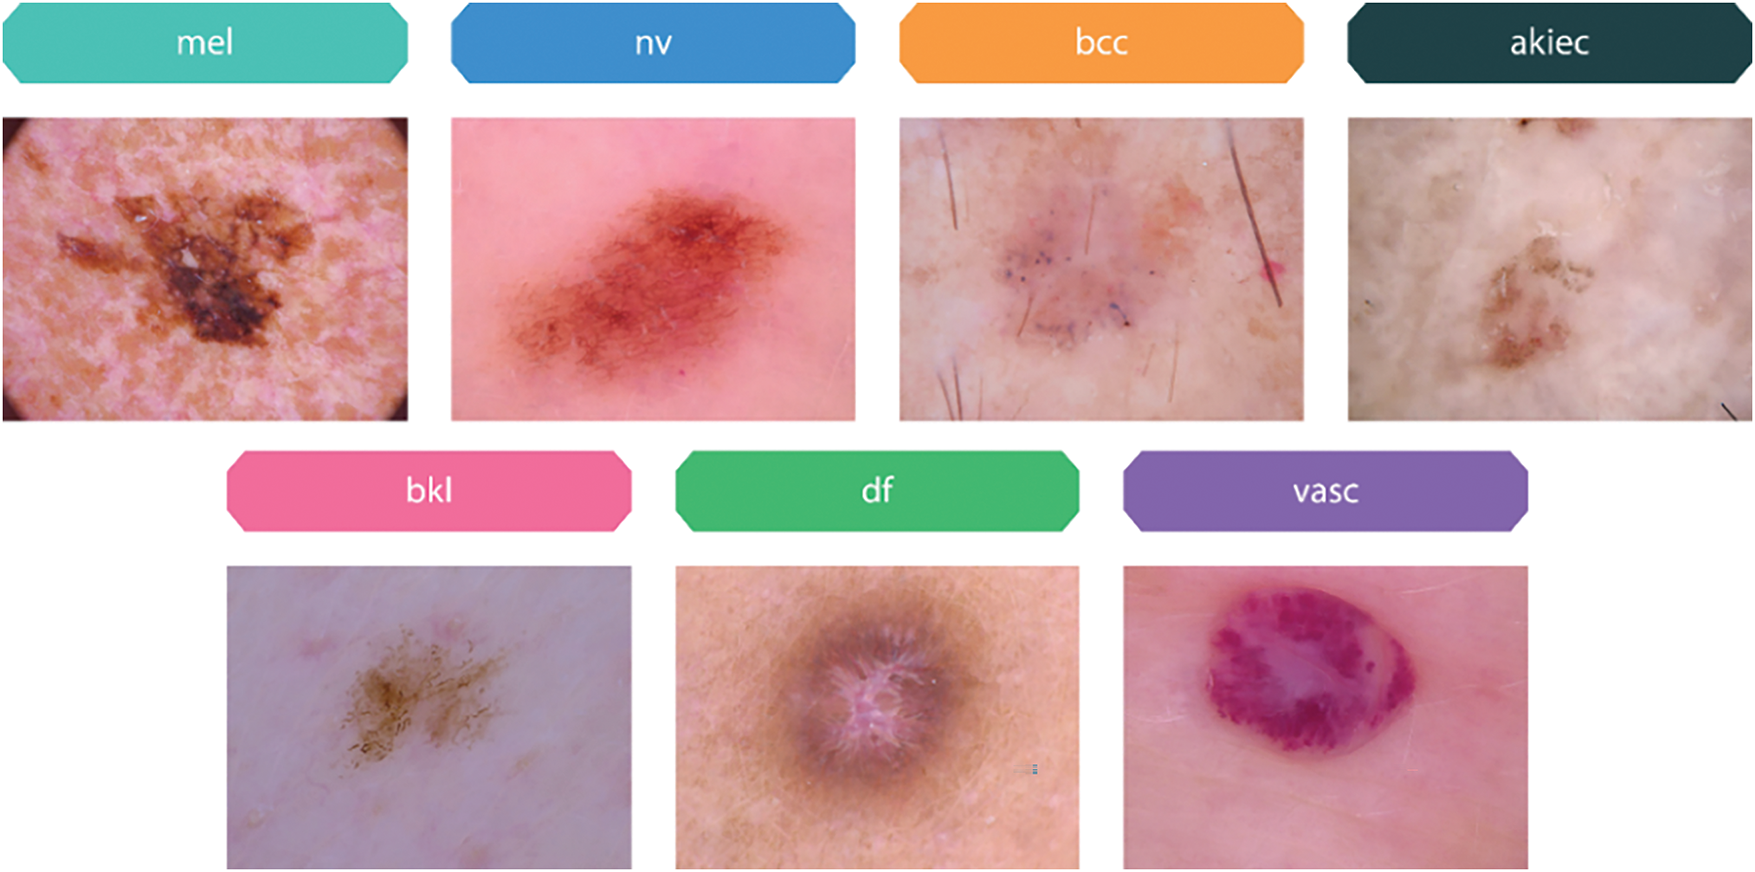
Figure 3: Sample images of pigmented skin lesions from the HAM10000 dataset
Most of the images in the HAM10000 dataset have excellent resolution, measuring 600 × 450 pixels and in JPEG format. With respect to storage and processing requirements, this quality and format guarantee that the images have sufficient detail for efficient analysis and model training. We have divided this dataset into three major partitions which are train, test and valid with ratios of 70, 20, and 10, respectively.
This study also uses a dataset including 2357 images of cancerous and non-cancerous skin conditions obtained from The International Skin Imaging Collaboration (ISIC)1 project (Skin Cancer ISIC dataset). The images are categorized based on ISIC criteria in terms of illness distribution, but with a higher representation of melanomas and nevi compared to other disorders. The datasets include of many skin disorders, including actinic keratosis (akiec), basal cell carcinoma (bcc), melanoma (mel), nevus (nv), dermatofibroma (df), pigmented benign keratosis (bkl), seborrheic keratosis (sk), squamous cell carcinoma (scc), and vascular lesions (vasc) as samples shown in Fig. 4.
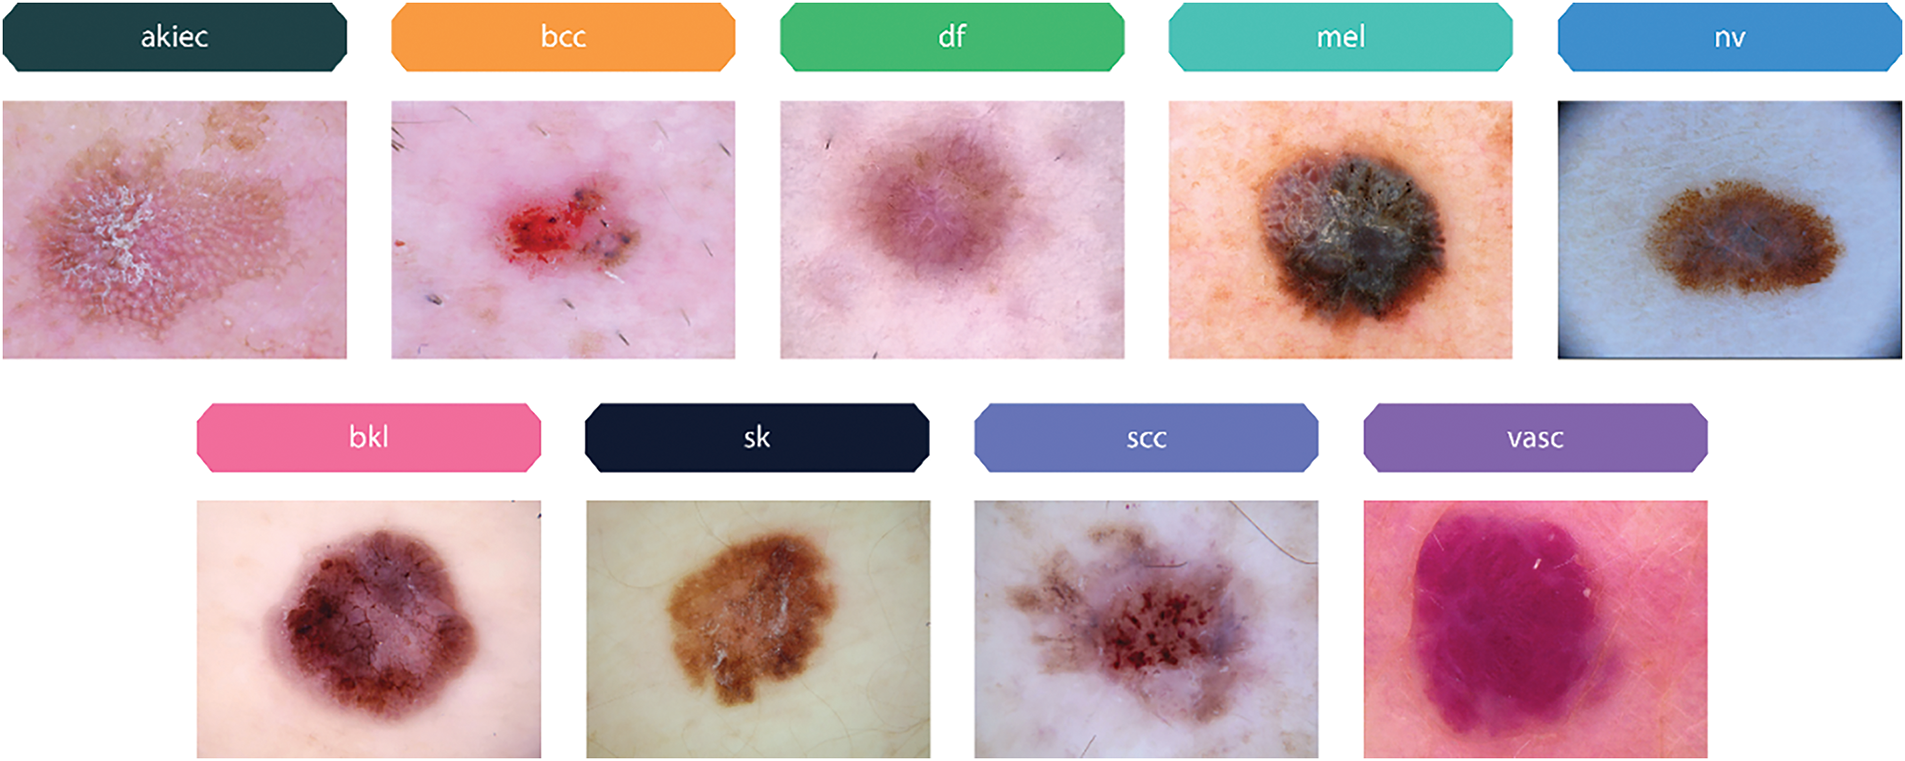
Figure 4: Sample images of pigmented skin lesions from the Skin Cancer ISIC dataset
During the learning and optimization stages, data augmentation is used to improve diversity and reduce overfitting by modifying the images. Initially, we have reduced the 450 × 600 pixels images to 299 × 299 pixels. Since the distribution of images is not uniform among categories, data balancing is employed to equalize the number of images in each category before the training phase as illustrated in Fig. 5.
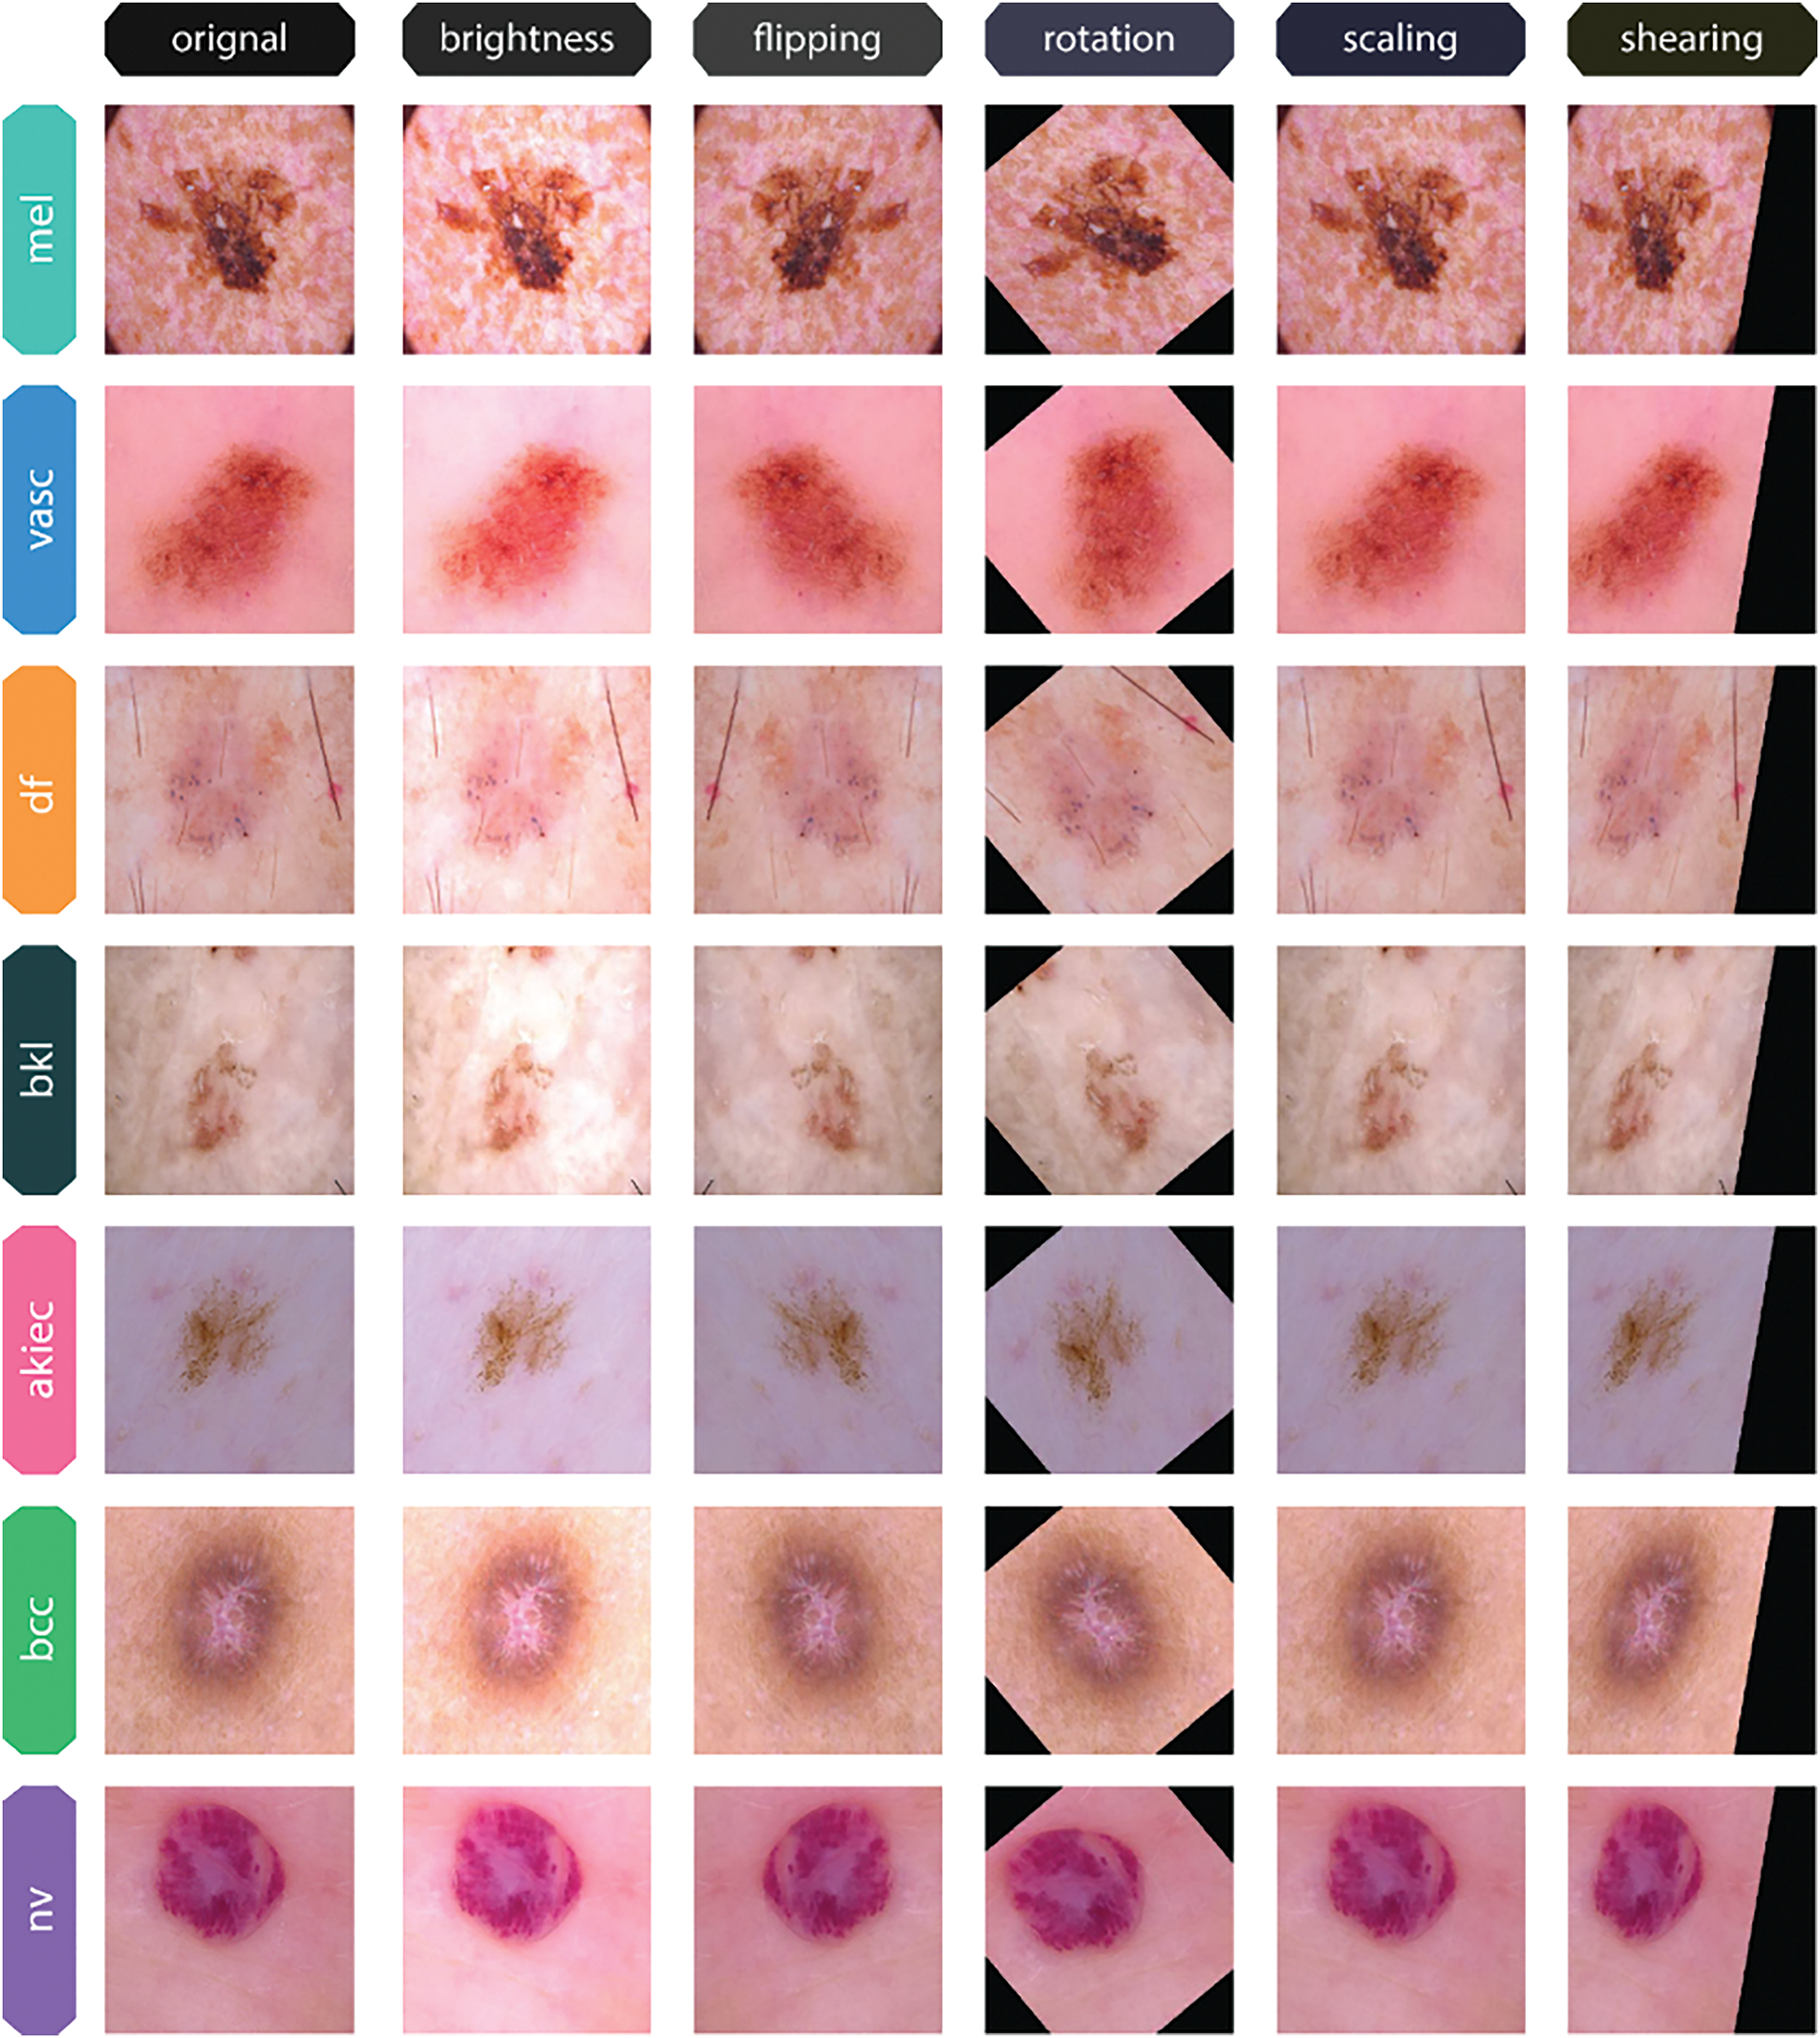
Figure 5: Original images and their augmented variants from the HAM10000 dataset
Table 1 shows the total amount of data points for each class after going through data preprocessing steps on HAM10000 dataset.
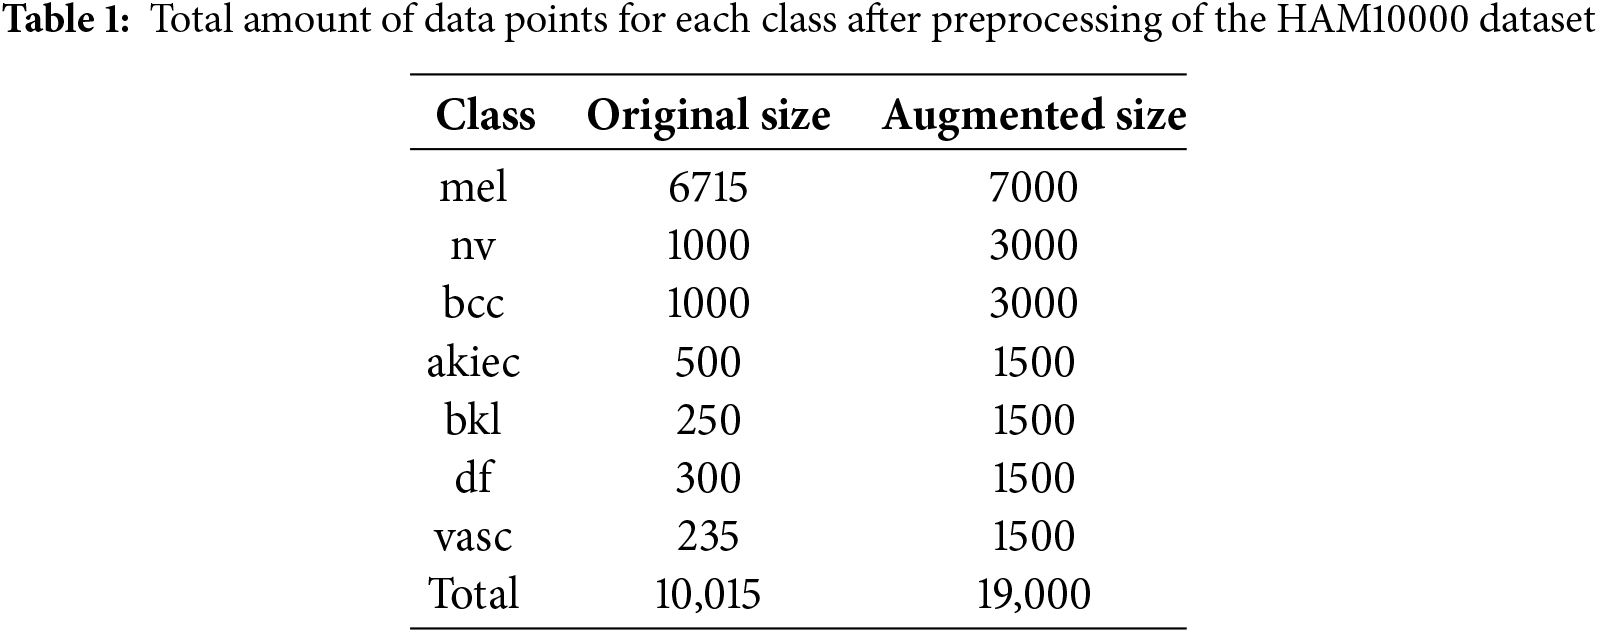
Table 2 illustrates the allocation of images among categories of skin lesions after image preprocessing on Skin Cancer ISIC dataset. The original dimensions of the images were 640 × 450 pixels. Prior to the model training, all images were resized to a dimension of 299 × 299 pixels to facilitate their integration into the neural network structures. The training data set, however, consisted of a two-phase distribution of images that were unevenly distributed across different classes. This led to potential bias during the model training process. To prevent this scenario, other perspectives (descriptive augmentations) were incorporated, including rotation, scaling, shearing, flipping, and adjusting brightness, among others as shown in Fig. 6. Consequently, the class balancing strategies facilitated the generation of new images in the image dataset that belong to the same class as the original images. As a result, the number of images increased to a range between 2357 and 3889. The dataset was enhanced with diversity and balance, so mitigating the risk of overfitting and improving the model’s performance on unknown data.
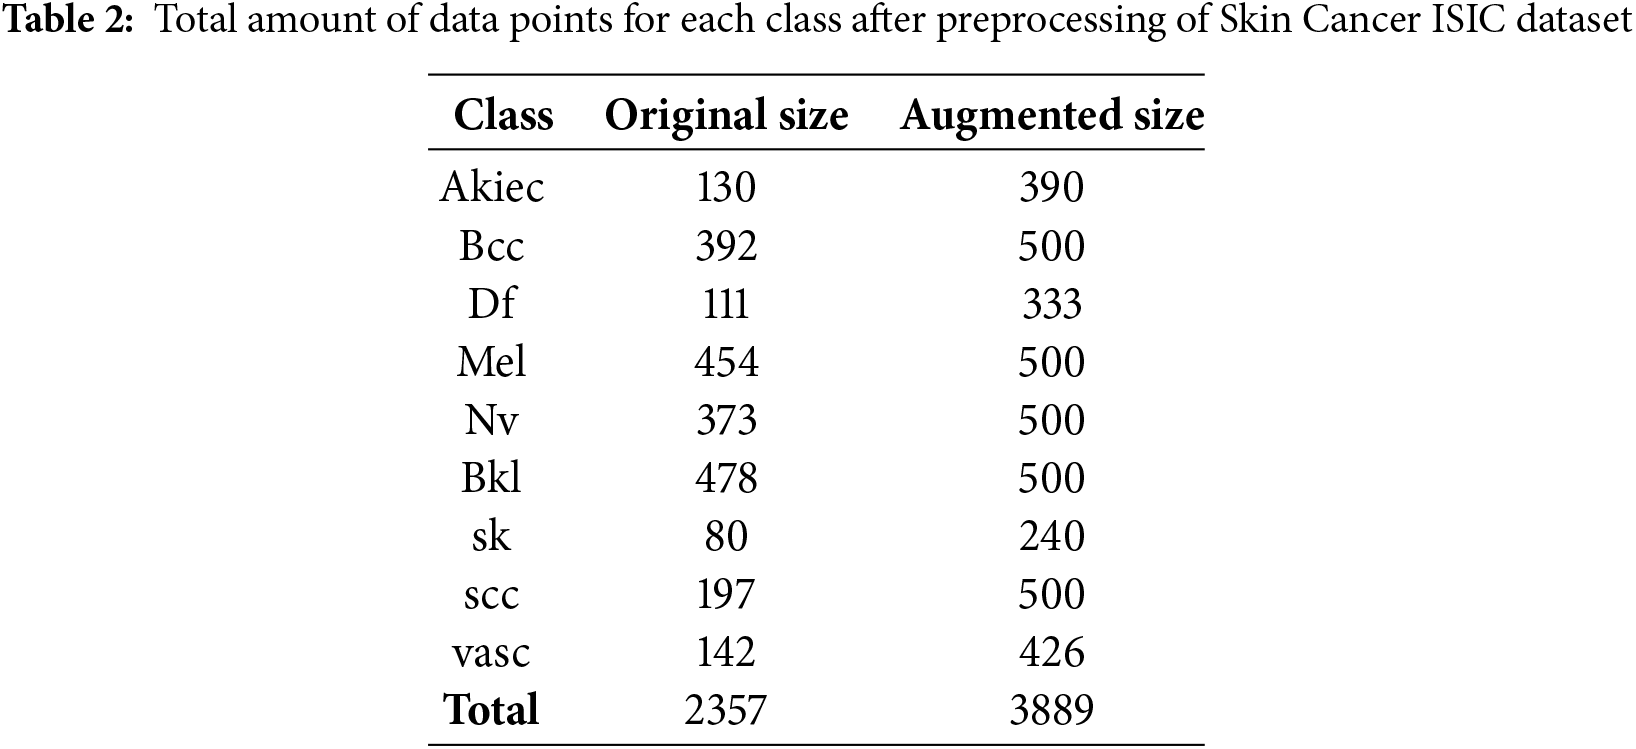
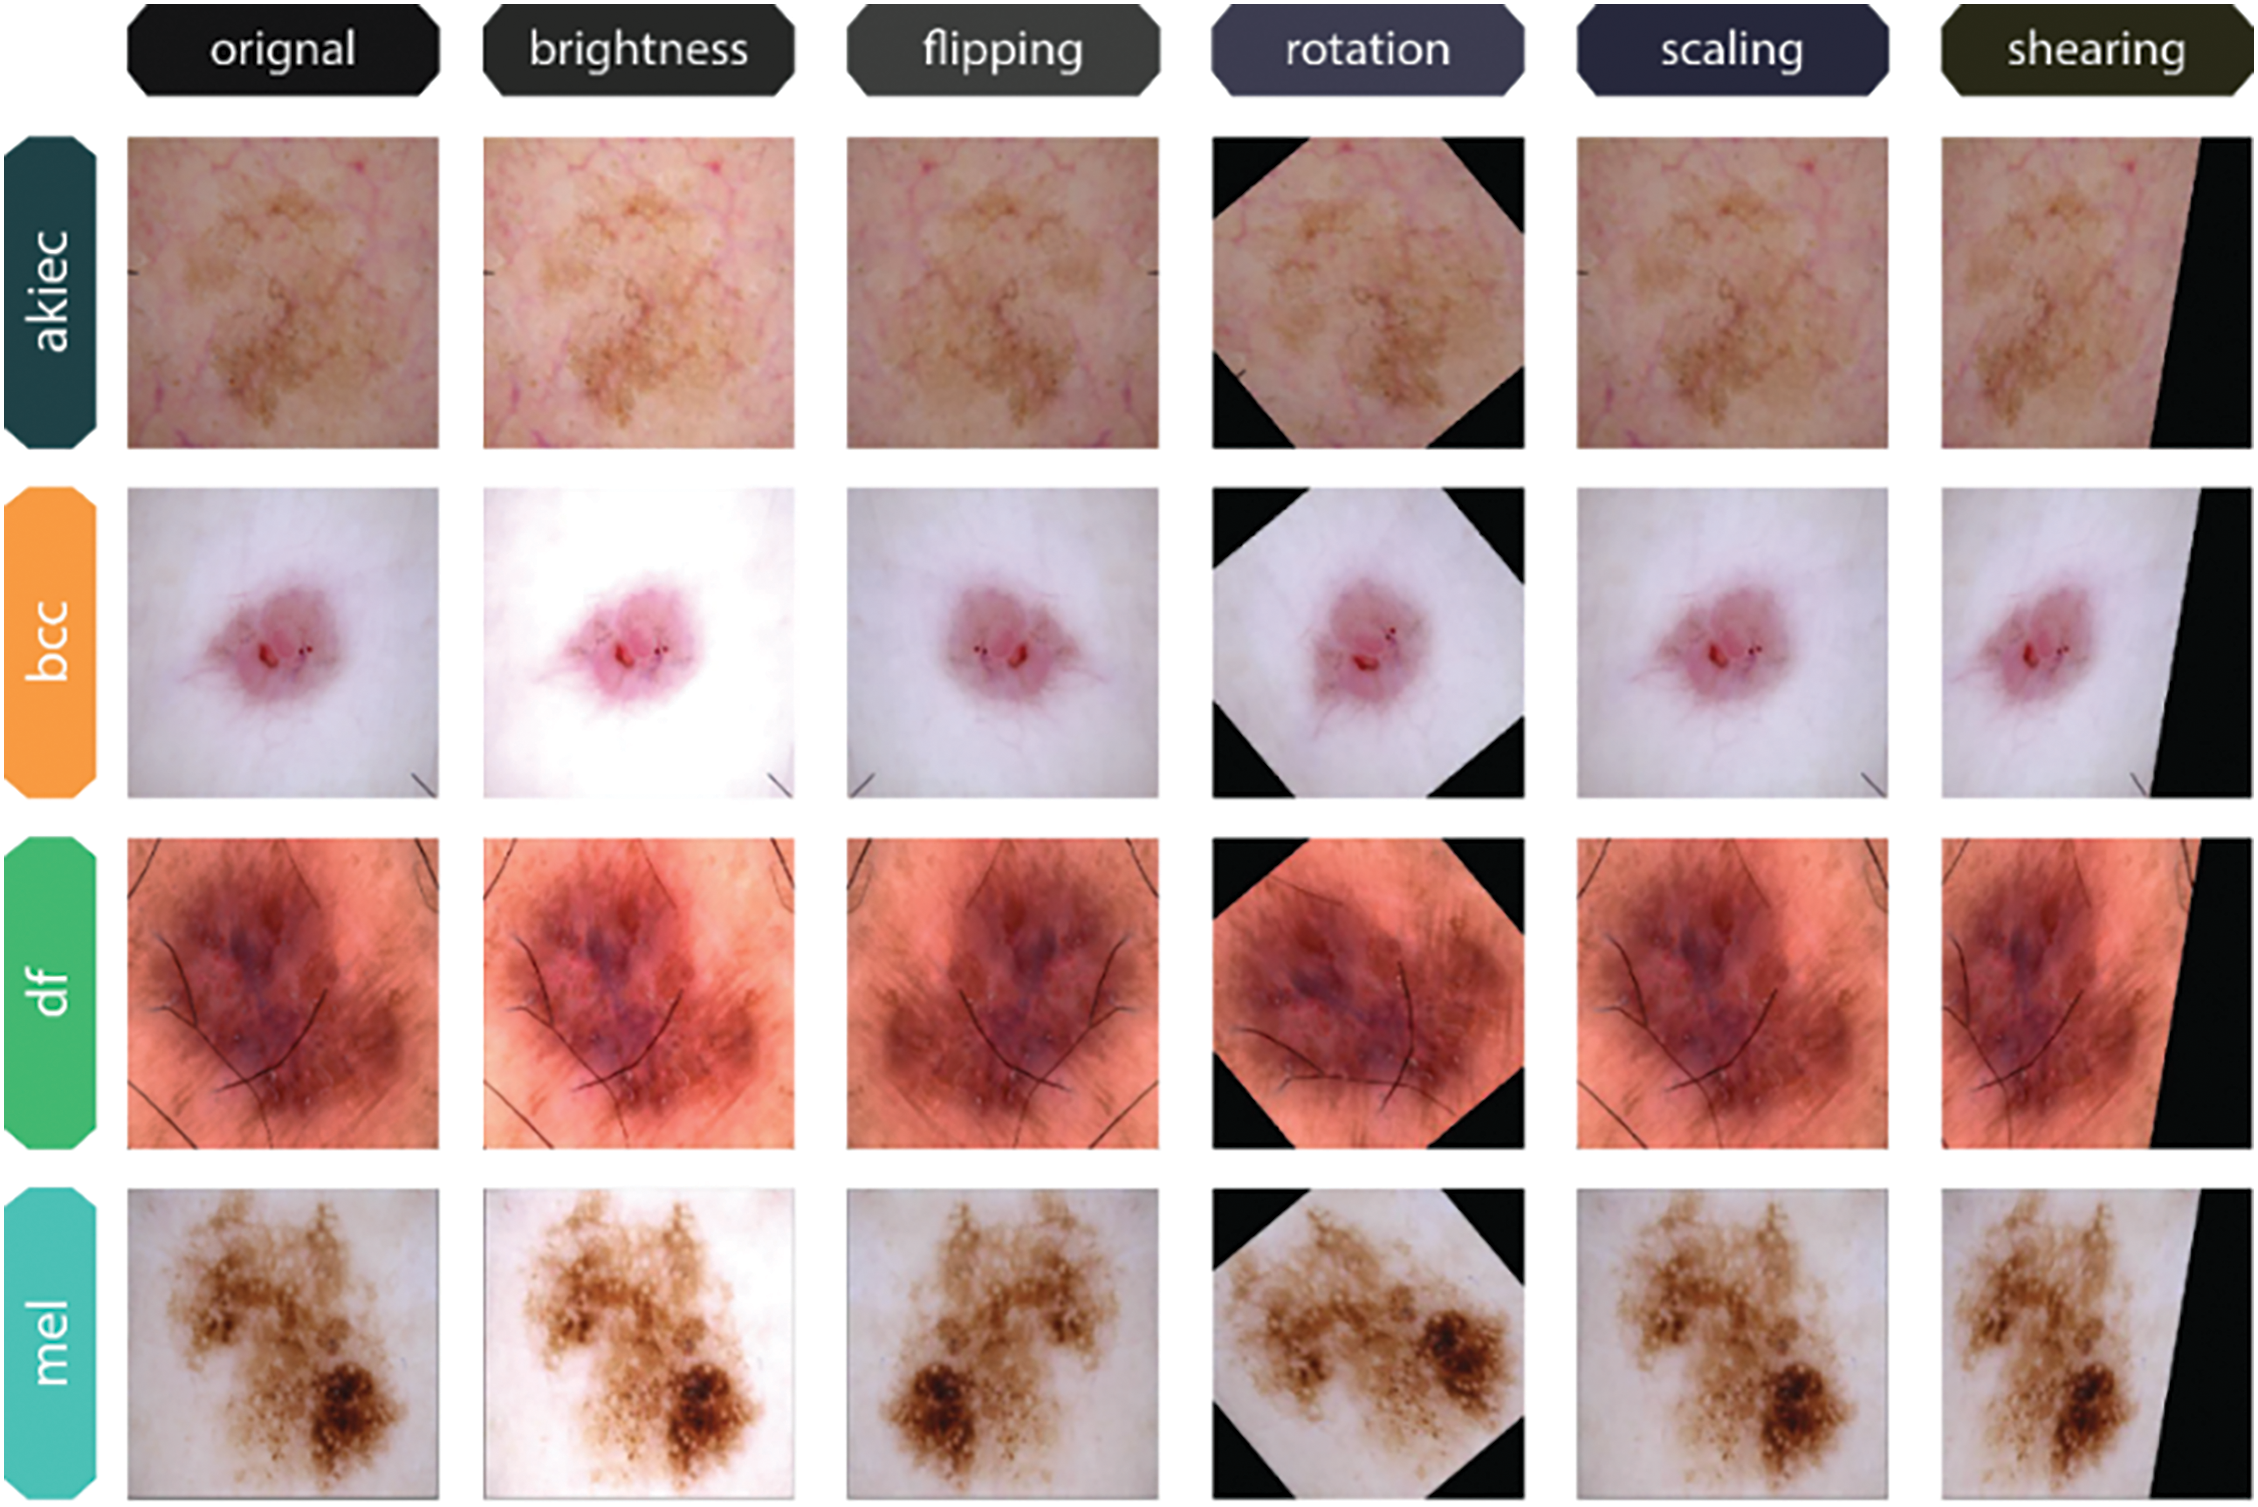

Figure 6: Original and Augmented Image Variants of each class from the Skin Cancer ISIC dataset
To increase the diversity and robustness of the training data, image augmentation is used during the preparation of this dataset images. One way to address orientation and positioning differences in images is to rotate them by 30 degrees and adjust their width and height by 20%. To further replicate perspective distortions, a 20% shearing effect is added. To enhance the quantity of distinct samples, the images undergo a vertical and horizontal flip. Reliability in a range of illumination levels is guaranteed by brightness adjustments between 0.7 and 2.5. By simulating real-world variability, these augmentations together enhance the model’s generalization.
3.3 Vision Transformer Architecture
Originally, the transformers’ attention mechanisms have played a major role in natural language understanding challenges. Expanding on this idea, the Vision Transformer (ViT) [20] has become an effective visual classification architecture. The architecture of ViT is illustrated in Fig. 7.
Figure 7: ViT architecture
In order to create a sequential representation of flattened 2D patches, patch localization on the skin dermoscopy images
An embedding matrix
The
A fully connected feed-forward multi-layer perceptron (MLP) layer and a multi-head self-attention (MSA) layer comprise each of the
where layer normalization is indicated by
The MSA comprises a linear layer, a self-attention layer, a concatenation layer, and a concluding linear layer. The quantity of heads k dictates the amount of concurrent self-attention operations performed in the MSA. To derive the query (
After projecting the resultant matrices,
where
Since each head of the
The encoder’s last layer identifies the initial token in the sequence, denoted as
The CNN Xception is an enhanced version of the traditional Inception model. The model comprises 36 convolutional layers and serves as the foundation for the feature extraction block. The convolutional layers are interconnected by a residual network that facilitates their linkage [21]. The Xception network has demonstrated superior performance relative to the CNN variation, while concurrently utilizing less parameters [22]. The spatial division of each channel in the model architecture occurs subsequent to the initial convolutional block through the use of a 1
The convolutional network employs depthwise separable convolution and channel separation by a 1
This research involves the use of transfer learning and fine-tuning techniques. The difference lies in the input shape, which is defined as a dimension of 299
Figure 8: Xception architecture
The proposed CNN architecture is a combination of convolutional blocks, depthwise separable convolutional blocks and module inspired by inception architecture. These modules are used to create a robust deep CNN architecture for image classification. This model is designed to capture the complex features from images through different convolutional strategies. The aim of this architecture is to balance the efficiency and high accuracy of model as illustrated in Fig. 9.

Figure 9: Customized CNN architecture
3.5.1 Initial Convolution and Pooling
The architecture starts with an initial convolutional layer with a 7
A max pooling layer with 3
The Block 1 structure is derived from the DenseNet design and incorporates a dense block. This block consists of three layers: a 3
This process repeats for a specified number of layers, enhancing the feature maps’ representational capacity by progressively integrating new features with the existing ones as shown in Fig. 10.
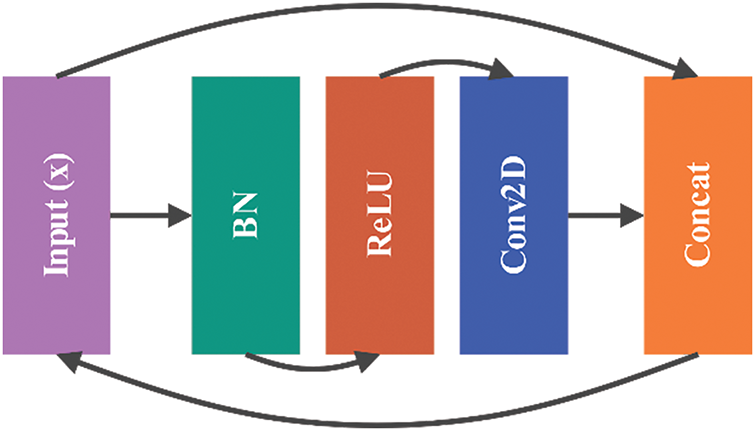
Figure 10: Architecture of Block 1: Dense Block
3.5.3 Block 2: Depthwise Separable Convolution
The Block 2 function employs depthwise separable convolutions, a technique that decomposes a standard convolution into a depthwise convolution followed by a pointwise convolution as illustrated in Fig. 11. This approach reduces the number of parameters and computational cost while maintaining the ability to capture spatial patterns.
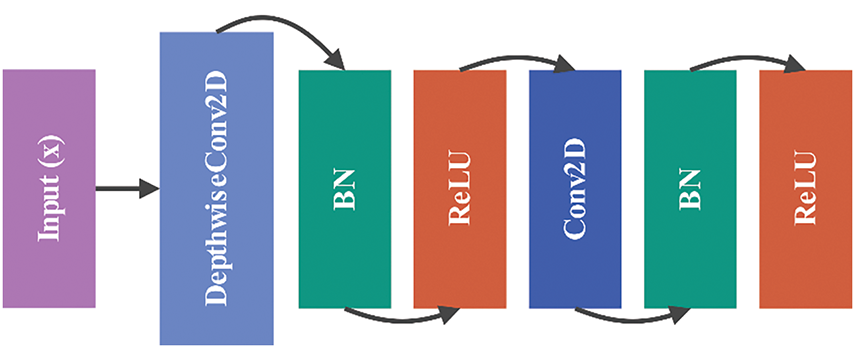
Figure 11: Architecture of Block 2: depthwise separable convolution
The operations in Block 2 can be expressed as
3.5.4 Block 3: Inception-Like Module
The Block 3 function is inspired by the Inception architecture, combining multiple convolutional filters of different sizes. This block processes the input through parallel convolutions with 1 × 1, 3 × 3, and 5 × 5 kernels, along with a 3 × 3 convolution followed by a 1 × 1 convolution as shown in Fig. 12. The outputs are concatenated to create a rich feature representation:
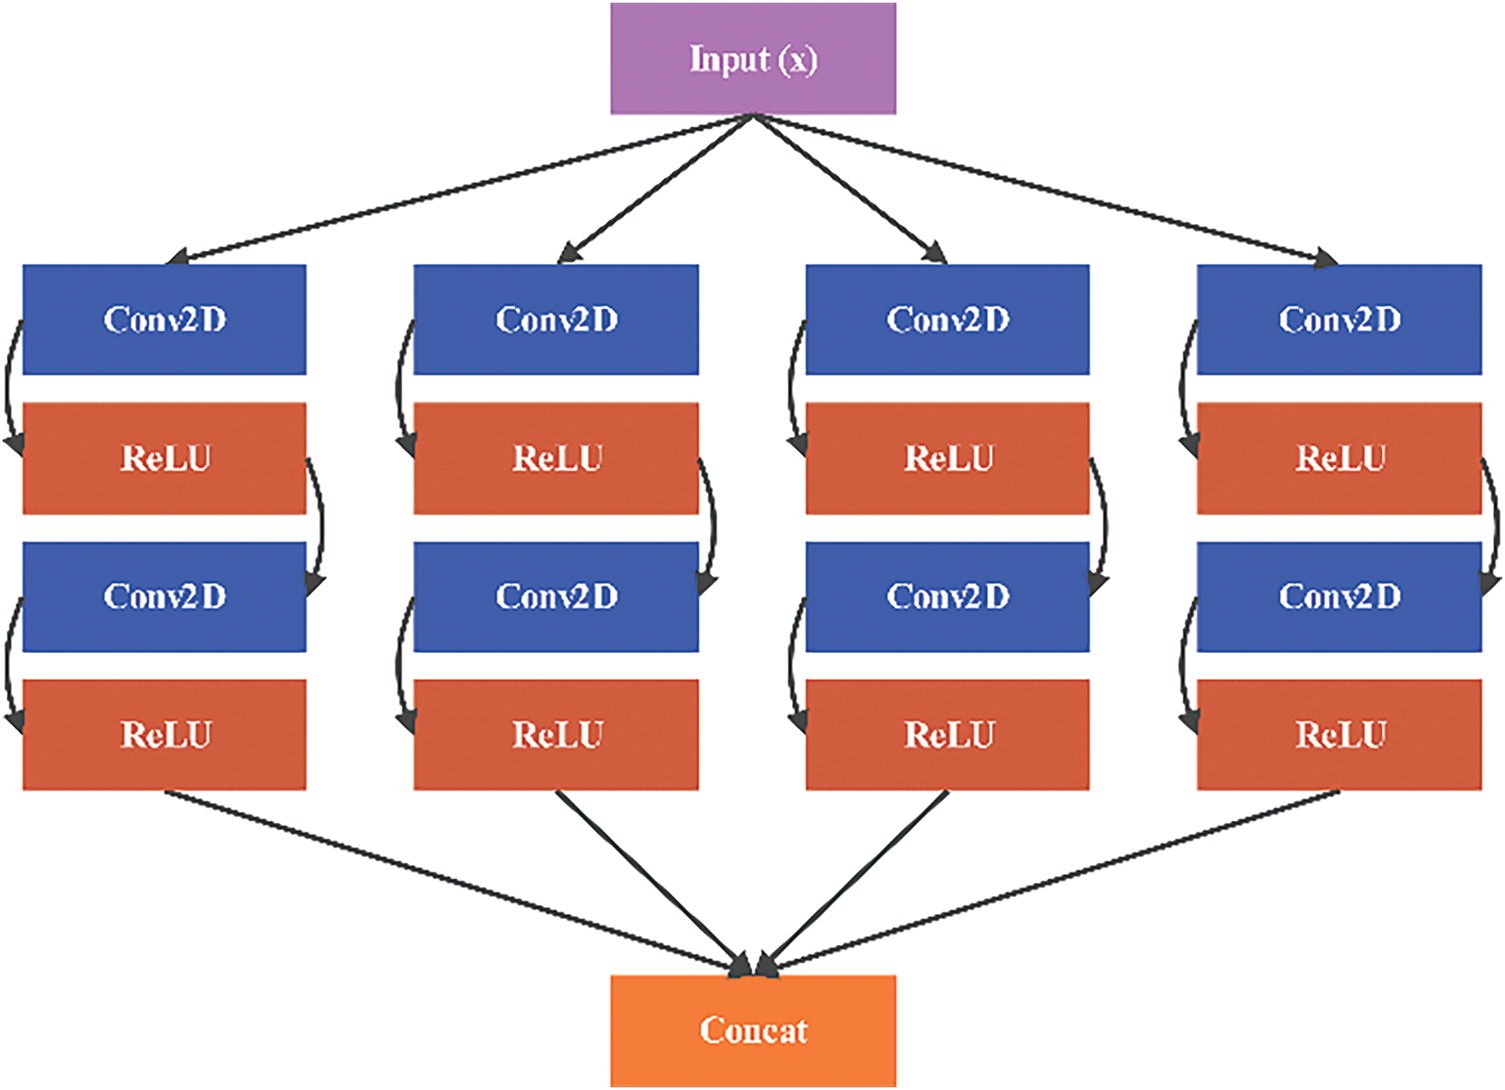
Figure 12: Architecture of Block 3: inception-like module
3.5.5 Setting Block: Transition Layer
To control the model’s complexity and reduce spatial dimensions, the Setting Block applies a 1 × 1 convolution followed by max pooling. This layer serves as a transition between dense blocks and other components, compressing the feature maps without losing important information:
This architecture efficiently combines different convolutional strategies to enhance feature extraction and achieve high performance on image classification tasks as represented in Fig. 13.
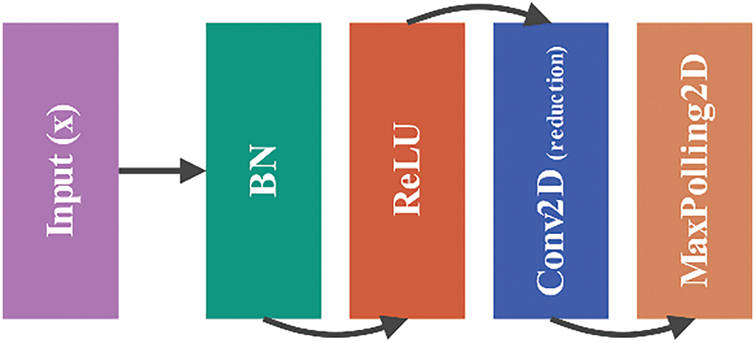
Figure 13: Architecture of setting block: transition layer
After getting the standard and high-level features, we come up with two different ways to combine them. One approach is to establish a constant ratio
where
To address these issues, we provide an alternative method that can automatically adapt the balance between high-level characteristics and conventional features, thereby eliminating the tedious and time-consuming task of determining the parameter λ. The approach involves training a multilayer perceptron neural network capable of integrating information into a nonlinear feature space. The fusion feature (
where
Grad-CAM
Deriving the Grad-CAM [23] for 1D CNNs is done in a manner similar to that of 2D CNNs, with the exception that there is one less dimension. The model does a forward pass, which involves processing the input data through the layers of the network until an output, represented as y, is obtained. The model also generates a series of feature maps Ak throughout this process. The variable K stands for the sum of all the chosen hyperparameters that control the number of filters or kernels in the CNN. CNN captures and represents different learning patterns from the input data; the output is the feature maps. With Grad-CAM, we just consider the feature maps produced by the model’s latest, most output-proximal CNN layer.
Currently, our approach deviates from the techniques used in classification-based models, where gradients are calculated for a certain class, or in other words, a single output. Our goal is to understand the impact of each characteristic on several future time points, rather than just one specific time point, as predicted by our forecast model. Therefore, we calculate the gradient of all the outputs in relation to each feature map. The feature attributions
where each feature map’s weights
Considering just positive gradients provides better resolution and highlight the most important input components to the prediction. Since CNNs employ padding, the size of feature map Ak a and b-th input series xb are same. These gradients may be easily computed using deep learning frameworks like TensorFlow and PyTorch, which come with built-in functions for automated differentiation. The study’s stated computational gains can only be achieved if the feature maps of both heads are acquired simultaneously during the model’s forward pass. Eqs. (18) and (19) are calculated repeatedly to provide attribution scores for each feature. Feature attributions of individual forecasts are combined to get global feature attributions, sometimes called average feature significance. This process is repeated for all 365 non-overlapping samples in the test set.
The proposed xCViT was built using PyTorch 2.3.1 and other toolkits. We used an Intel® Core™ i7-10870H Processor with 64 GB RAM and NVIDIA RTX 3080 Ti GPU for all training and testing experiments. The model was trained end-to-end using the Charbonnier Loss [24] and the AdamW [25] optimizer. The learning rate was set to
4.2 Results using Different CNN Combination
Table 3 presents a comparison of the performance of various deep learning architectures, including the Custom CNN + ViT and combinations of DenseNet201, ResNet50, EfficientNetB2, MobileNetV2, and Xception models. The models are evaluated using two well-known datasets for skin cancer—HAM10000 and Skin Cancer ISIC. To determine all potential conclusions about the models, four key assessment measures are used: Accuracy (Acc), Precision (Pre), Recall (Re), and F1-Score (F1). Each of these measurements and means provides valuable insights into different aspects of model performance.
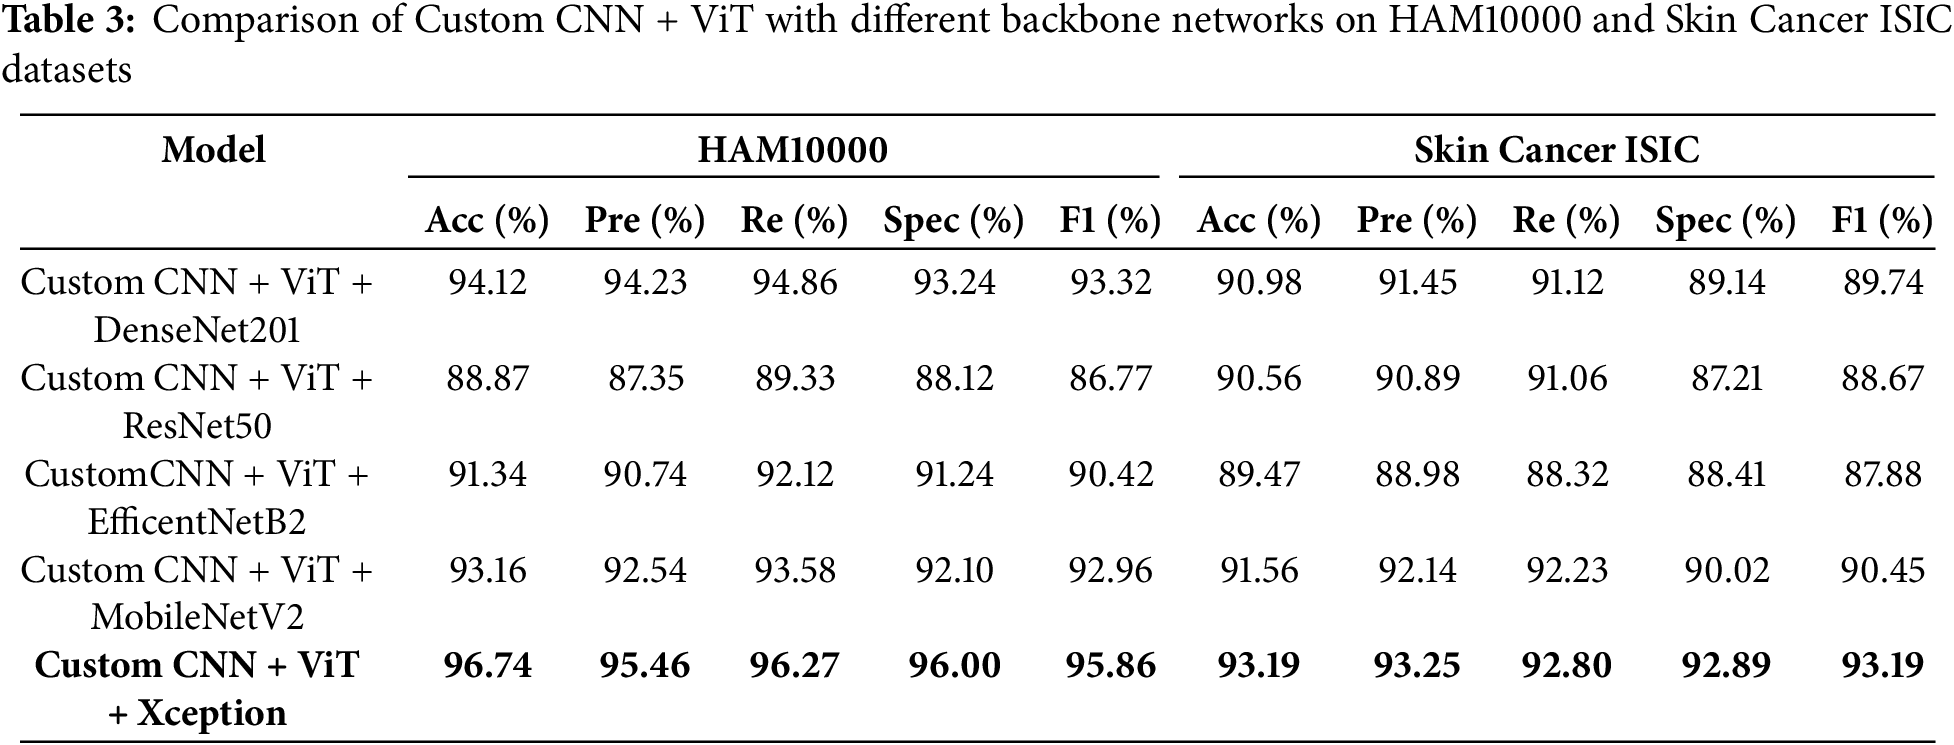
The results in Table 3 indicate that the Custom CNN + ViT + Xception combination achieved the highest performance in both databases, with an accuracy of 96.74%, specificity of 96.00% and an F1-Score of 95.86% on the HAM10000 database, and an accuracy of 93.19% and specificity of 92.89% on the Skin Cancer ISIC database. The combination of Xception on ViT and Custom CNN demonstrates excellent performance on both datasets, making it a highly effective architecture for skin lesion classification. In addition, the results obtained using the Custom CNN + ViT + DenseNet201 and Custom CNN + ViT + MobileNetV2 models also demonstrate a high performance, especially for the HAM10000 dataset. The accuracy reached is 94.12% for the first combination and 93.16% for the second combination. However, the Xception combo outperforms them in in terms of recall and F1-Score.
The combination of Custom CNN, ViT, and ResNet50 produces the lowest validation accuracy on HAM10000, which is approximately 88.87%. Consequently, this combination is deemed less successful for solving this problem. Table 3 demonstrates that implementing the Xception model enhances the ViT and custom CNN methods, resulting in the most comprehensive coverage of both metrics across the two datasets in comparison. These results demonstrate that neglecting architectural factors might have a negative impact on the classification of medical images, especially for more complicated tasks.
4.3 Proposed xCViT Model Results from the HAM 10000 Dataset
Experimental analysis was conducted using HAM10000 dataset while keeping different learning rates and highlighting major performance metrics. Table 4 illustrates the importance of selecting learning rates in terms of affecting its performance. Experiments were conducted over various learning rates ranging from 10−2 to 10−6. Out of these learning rate 10−5 showed best performance while achieving accuracy 96.74%, precision 95.46%, recall 96.27, F1-Score 95.86% and AUC 97.86%. Fig. 14a shows the graphs of training and validation accuracy while Fig. 14b shows the graphs of training and validation loss.
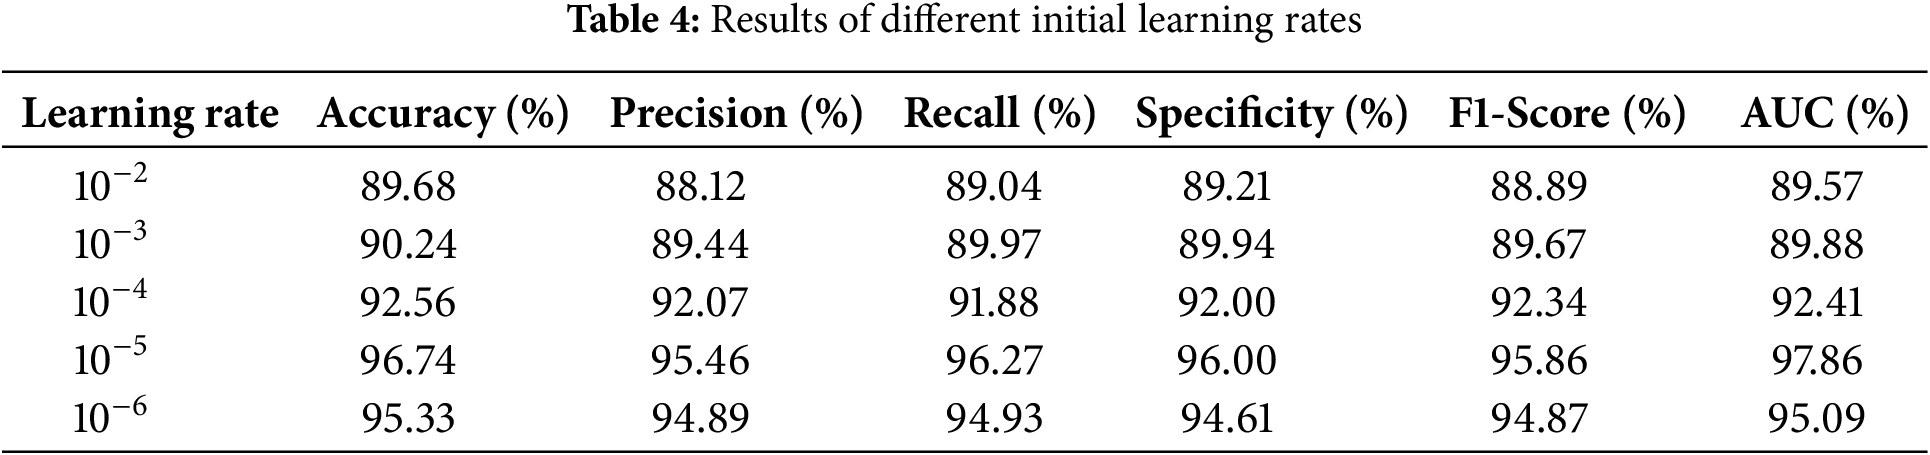
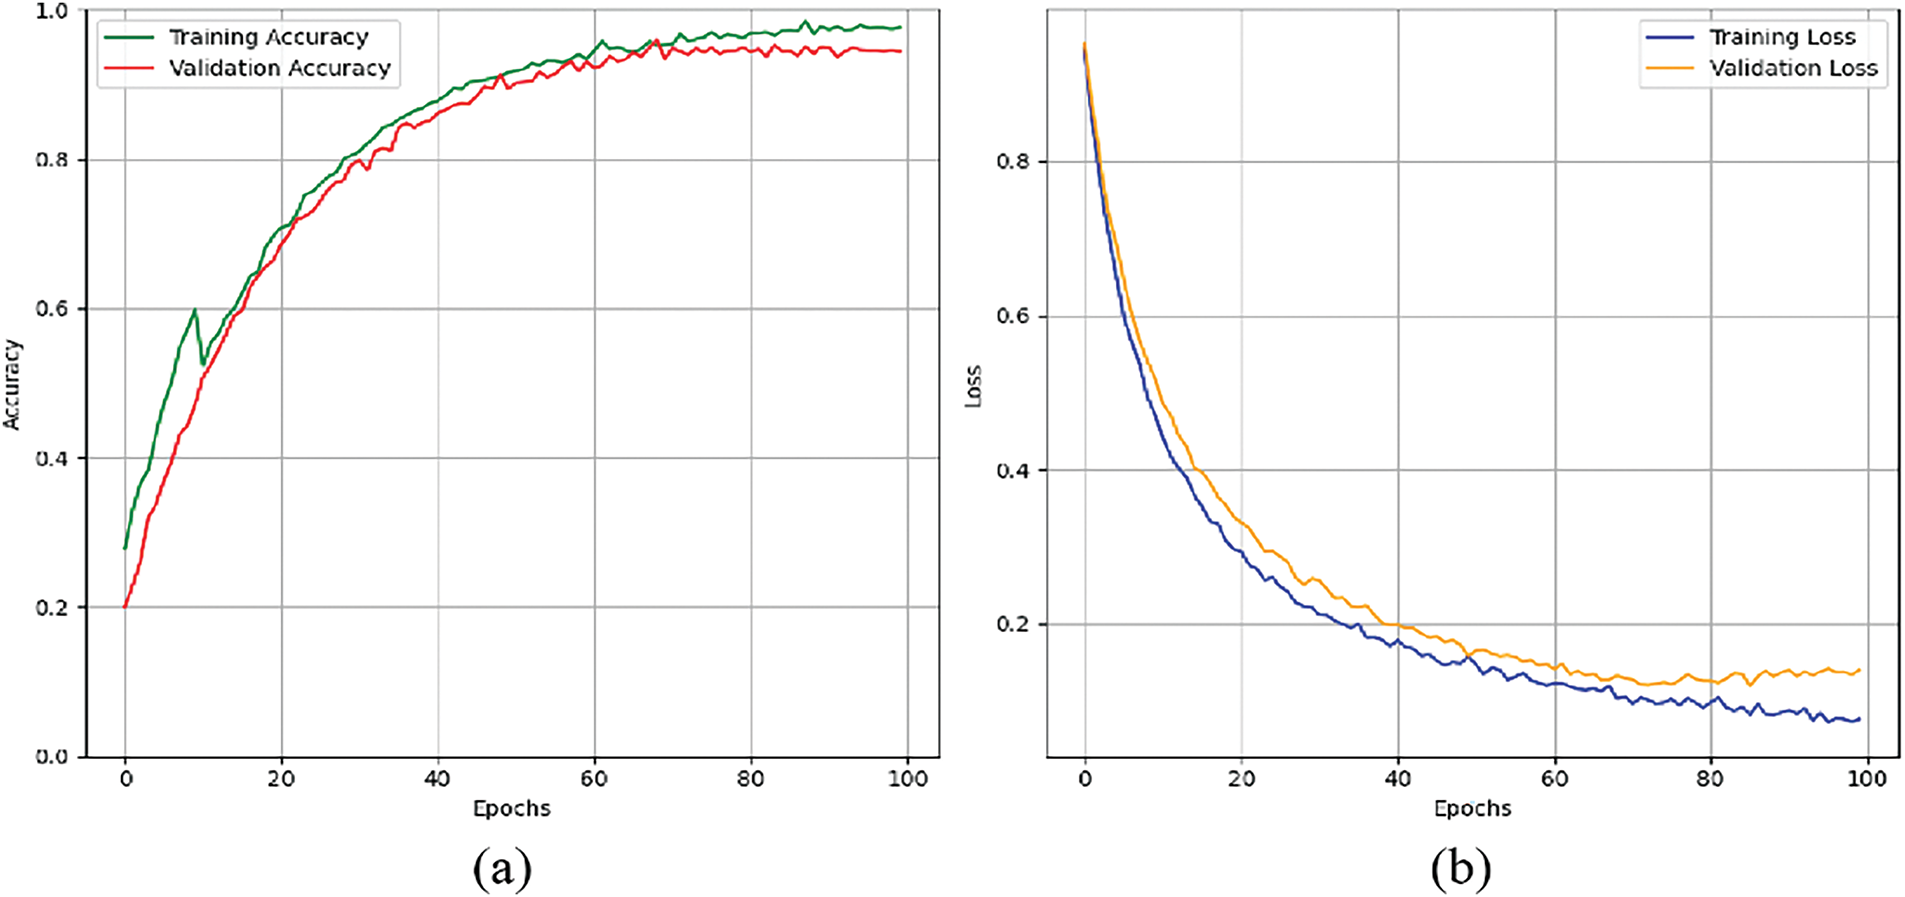
Figure 14: Graphs for training phases: (a) training and validation accuracy. (b) training and validation loss
Keeping the learning rate 10−5, Table 5 and Fig. 15 summarize the classification performance for skin lesion classes. This model has high accuracy in detecting mel by achieving precision of 98.84% and F1-Score of 98.28%. This shows that model has low rate of false positives and false negatives in detection of mel case. For the bcc class, the model achieved precision of 97.81% and AUC of 98.21% showing strong ability to distinguish between true and false positives. Other performances include nv with precision of 97.31% and akiec with recall of 96.00% showing the model ability to detect skin lesion types accurately.
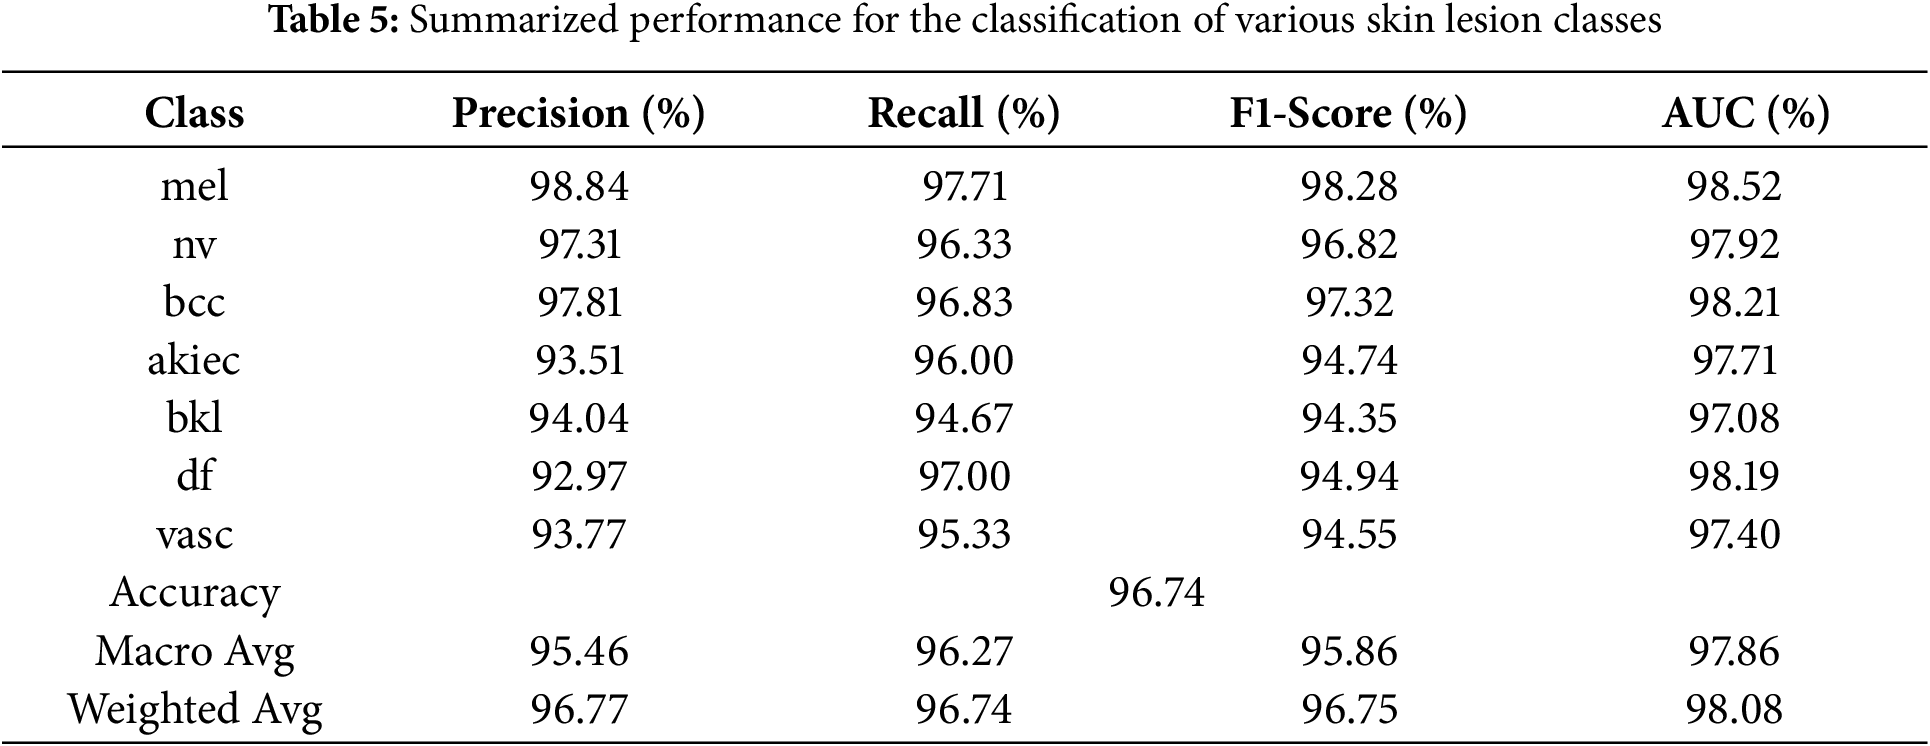
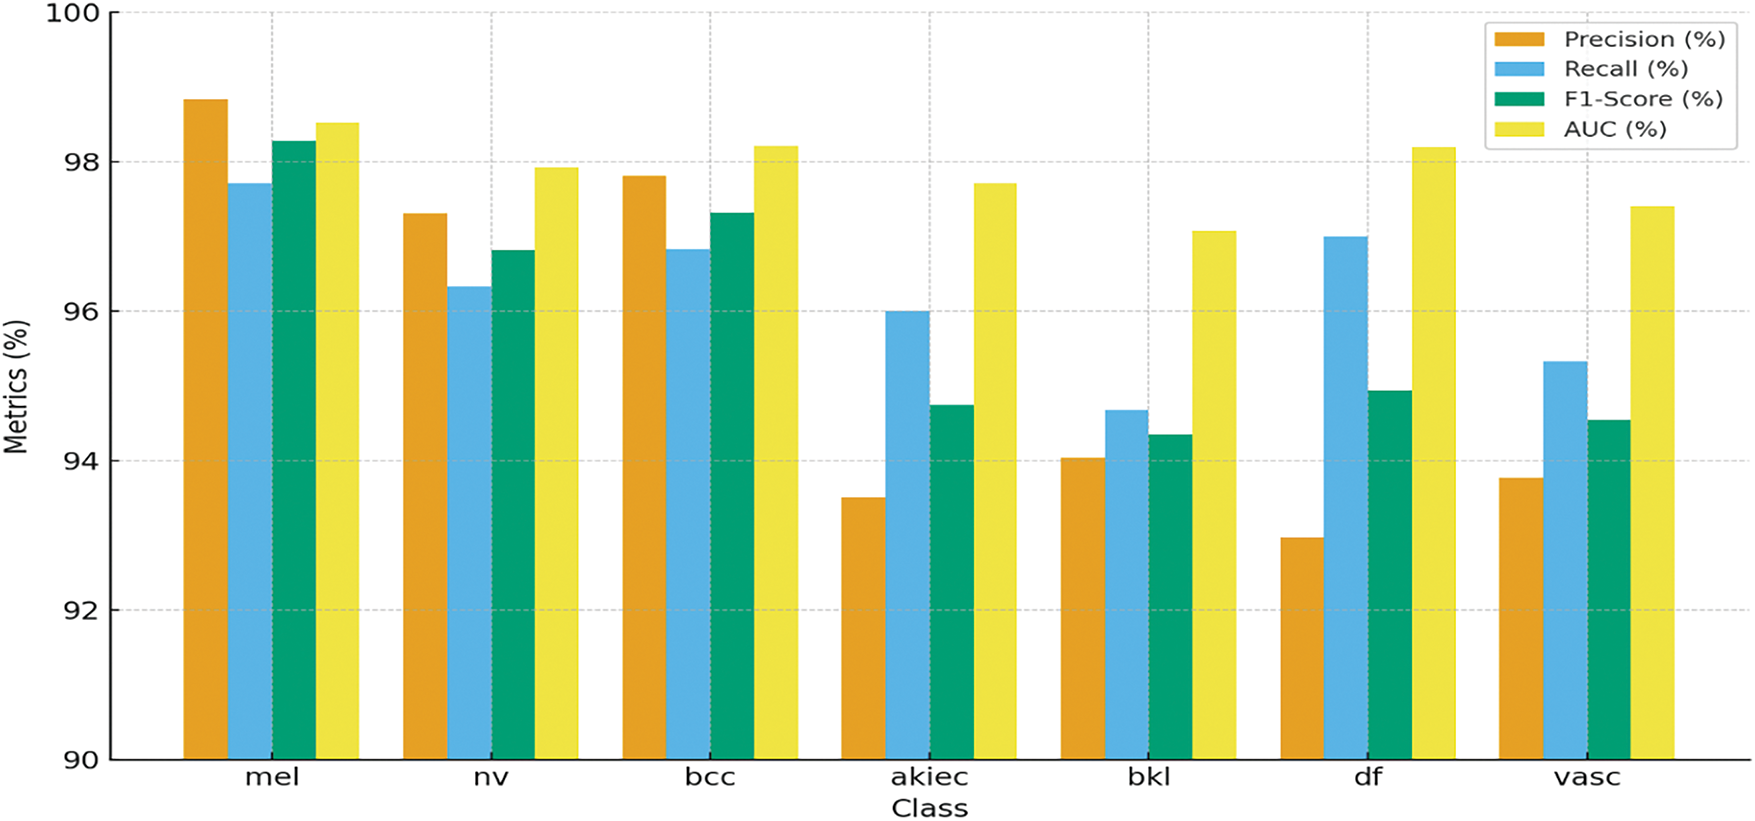
Figure 15: Graphical representation of the summarized performance for the classification of various skin lesion classes of HAM10000 dataset, showcasing accuracy, precision, recall, and F1-Score for each class
The model demonstrates the strong capacity across all evaluated metrics and achieving overall accuracy of 96.74%. The macro average precision and recall shows the balanced performance across all classes 95.46% and 96.27%, respectively. The weighted average AUC of 98.08% indicates that the model has good discriminative power. These findings highlight the overall model is effective for detecting different skin lesions. Fig. 16 shows the confusion matrix, where the mel class has the highest accuracy of 97.71%, where 1368 images out of 1400 are classified correctly. Lowest accuracy is achieved for bkl class, which classified 284 out of 300 images correctly with an accuracy of 94.67%.
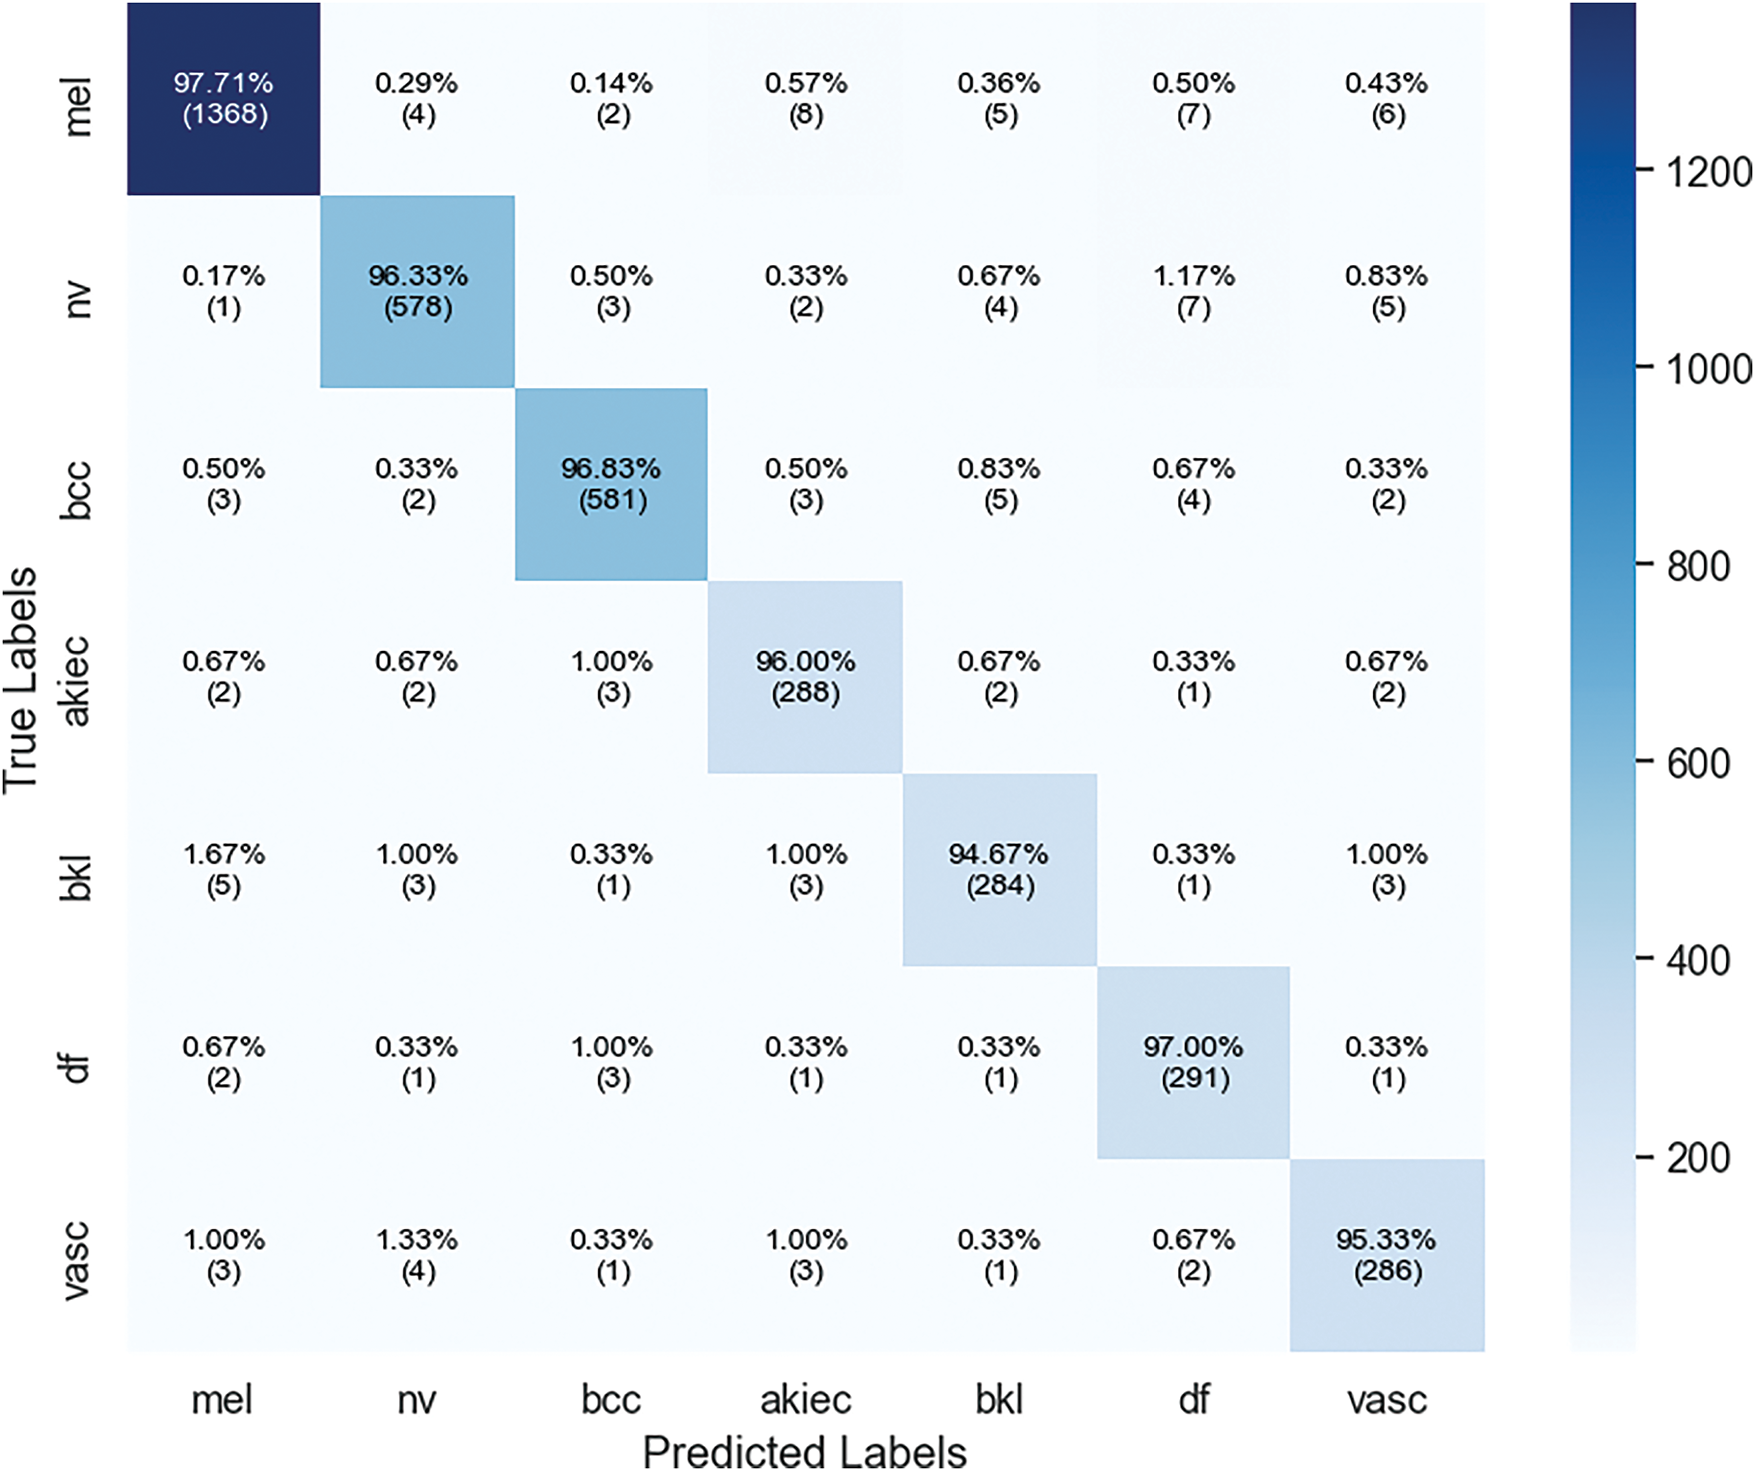
Figure 16: Confusion matrix of xCViT (Proposed Model) on HAM10000
4.4 Proposed xCViT Model Results on Skin Cancer ISIC Dataset
The provided results evaluate the efficacy of the proposed xCViT model on the Skin Cancer ISIC dataset. The tables and the confusion matrix specifically analyze the model’s behavior in relation to the classification accuracy of different kinds of skin lesions at various learning rates. Table 6 displays the impact of varying learning rates on the performance of the xCViT model.
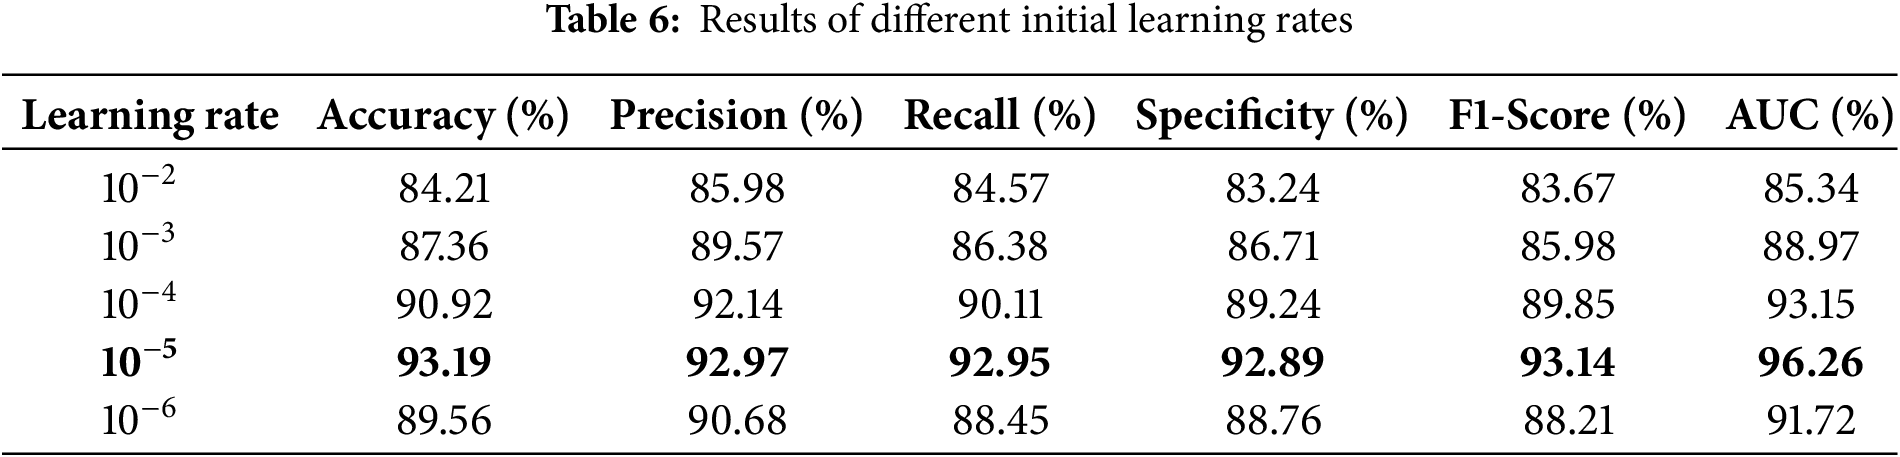
The model achieves its highest level of performance when the learning rate is set to
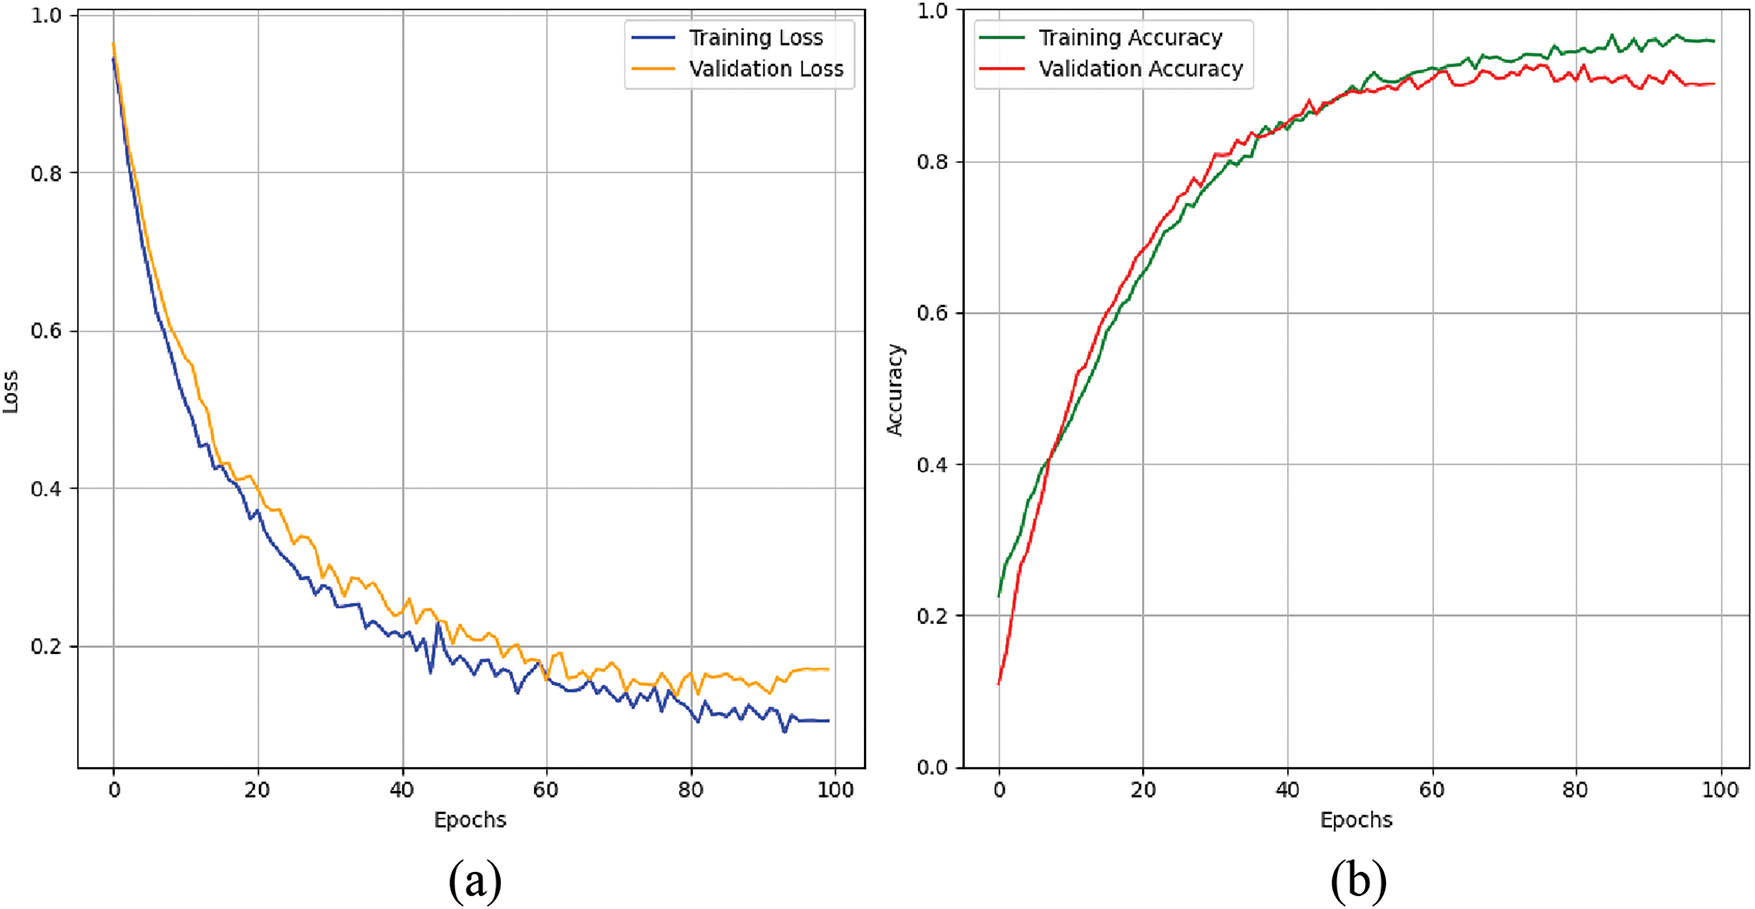
Figure 17: Graphs for training phases: (a) training and validation accuracy. (b) training and validation loss
Table 7 and Fig. 18 show the results of the model’s accuracy breakdown regarding various skin lesion kinds. Although recall decreased to 90.00%, resulting in an F1-Score of 93.26%, the class of nv had the best precision at 96.77%. Regarding bkl and sk classes, among other types of lesions, the recall %ages are nearly identical at 95.00% and 95.83%, respectively, leading to high F1 ratings. The model also performed well on class classification tasks, as evidenced by thigh AUC values across all classes (97.57% for sk), confirming the stability and reliability of this model.
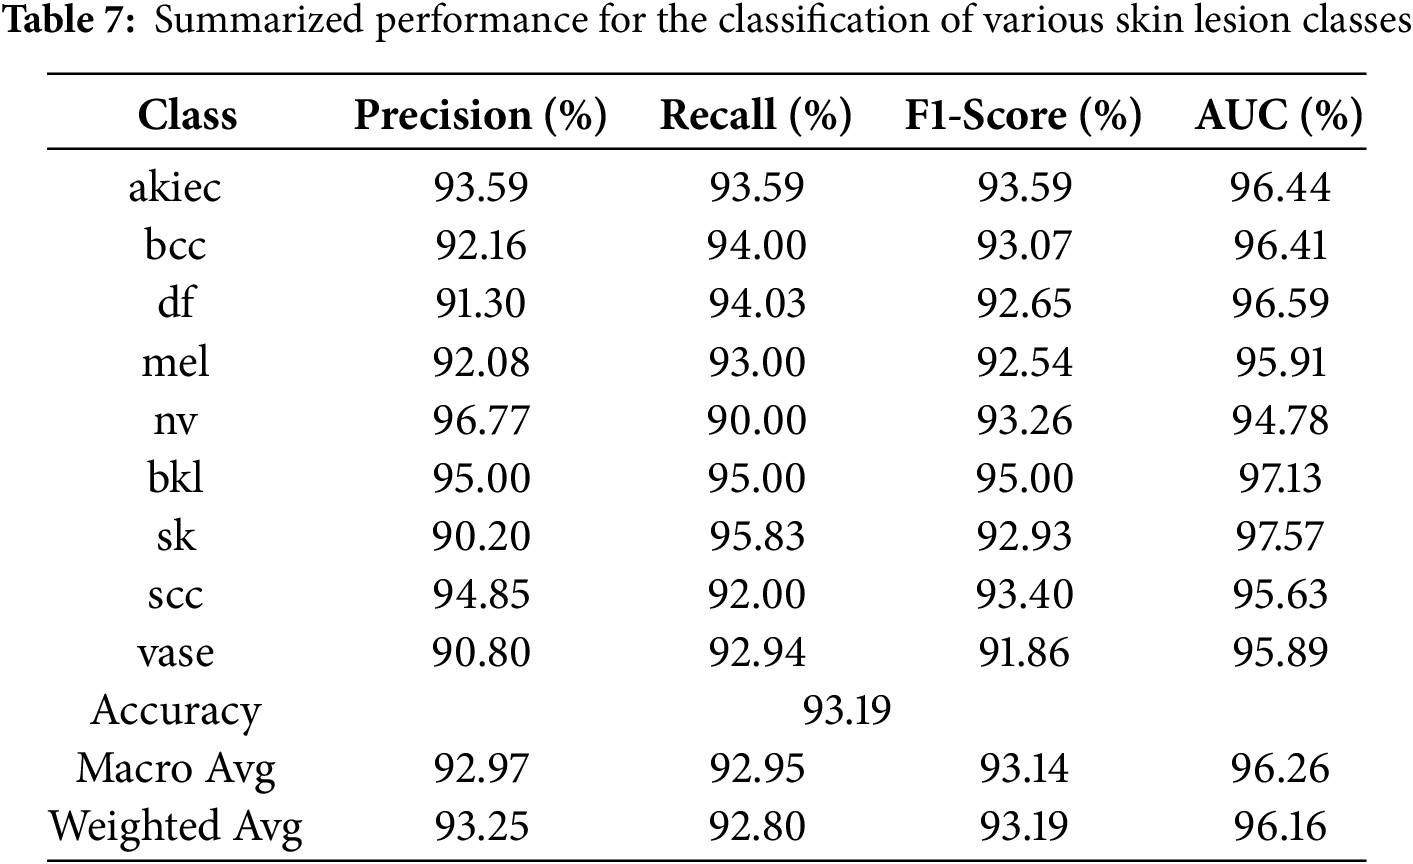
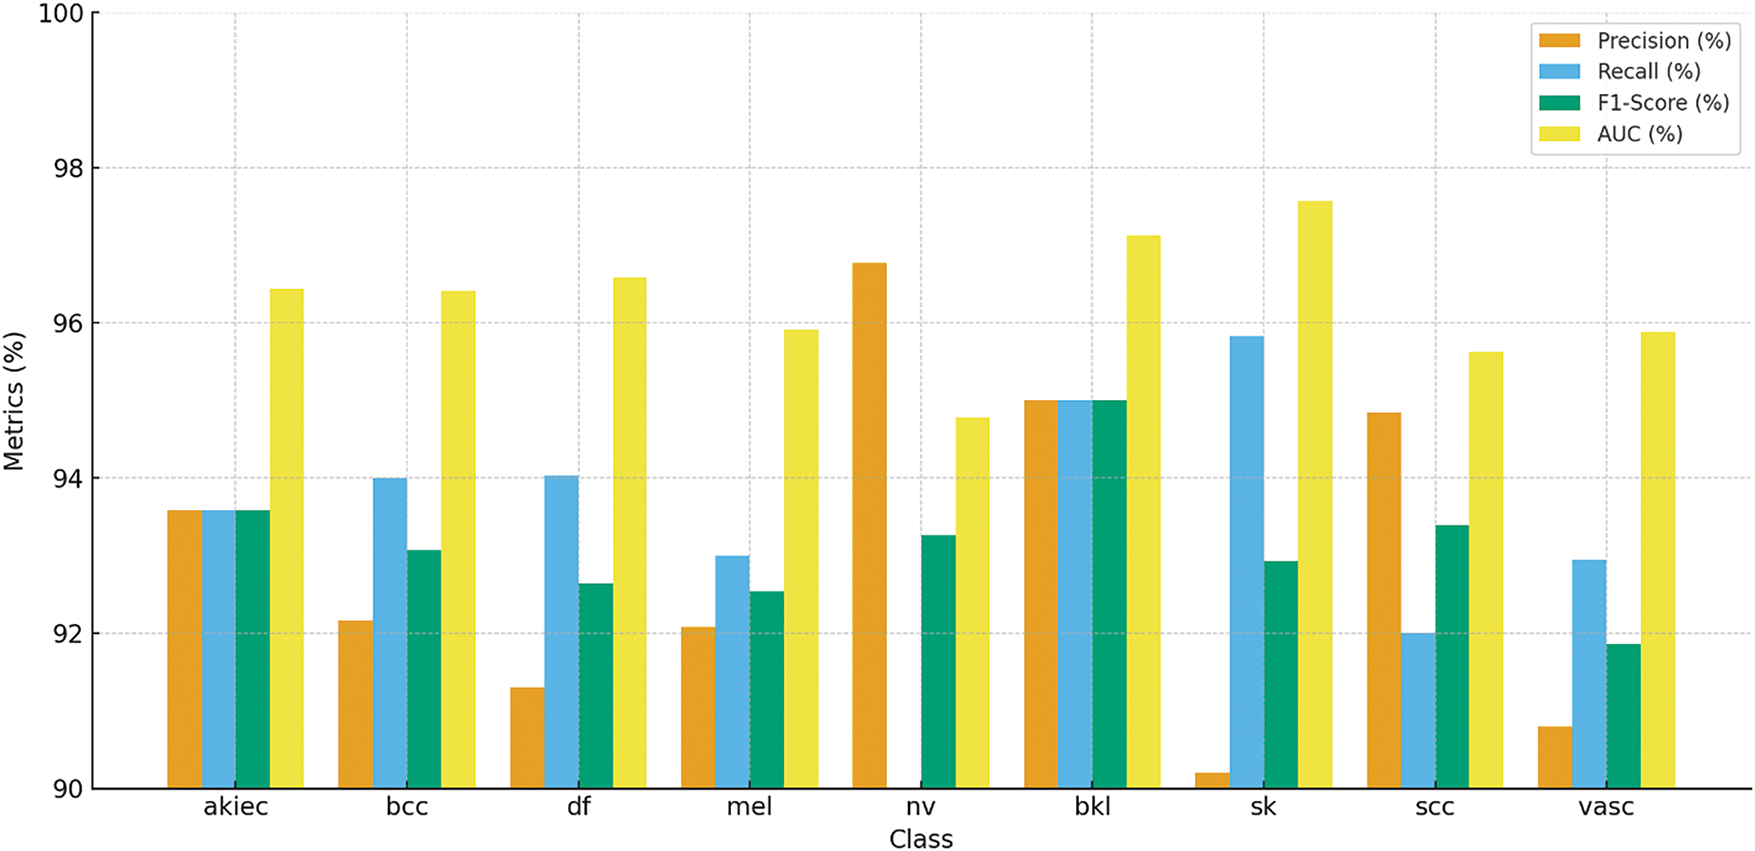
Figure 18: Classification performance of various skin lesion classes for Skin Cancer ISIC dataset, showcasing accuracy, precision, recall, and F1-Score for each class
In Fig. 19, confusion matrix enables us to determine the accuracy of the model’s predictions for each skin lesion, categorizing them as either correct or erroneous. The akiec class achieves an accuracy level of 93.59 %, with minimal errors that mostly occur when distinguishing between extremely similar classes. The classifications of bcc and df classes have both demonstrated excellent performance, each achieving an accuracy rate of above 94%. The model demonstrates a low level of overlap between these classes and the other lesion classes, highlighting its ability to effectively handle the inclusion of more diverse and visually similar lesion classes while maintaining a satisfactory level of accuracy. This matrix highlights the limited progress gained in terms of misclassifying lesions, indicating that these significant errors can be readily remedied in future versions of the model. The confusion matrix provides a graphical depiction of the model’s ability to predict outcomes by displaying accurate and inaccurate classifications for all types of skin lesions. The akiec class obtains an accuracy of 93.59%, with only a few incorrect classifications, mainly into closely related categories. The bcc and df classes exhibit robust performance, with each obtaining an accuracy rate of 94%. There is very little confusion between these and other types of lesions, which emphasizes the importance.
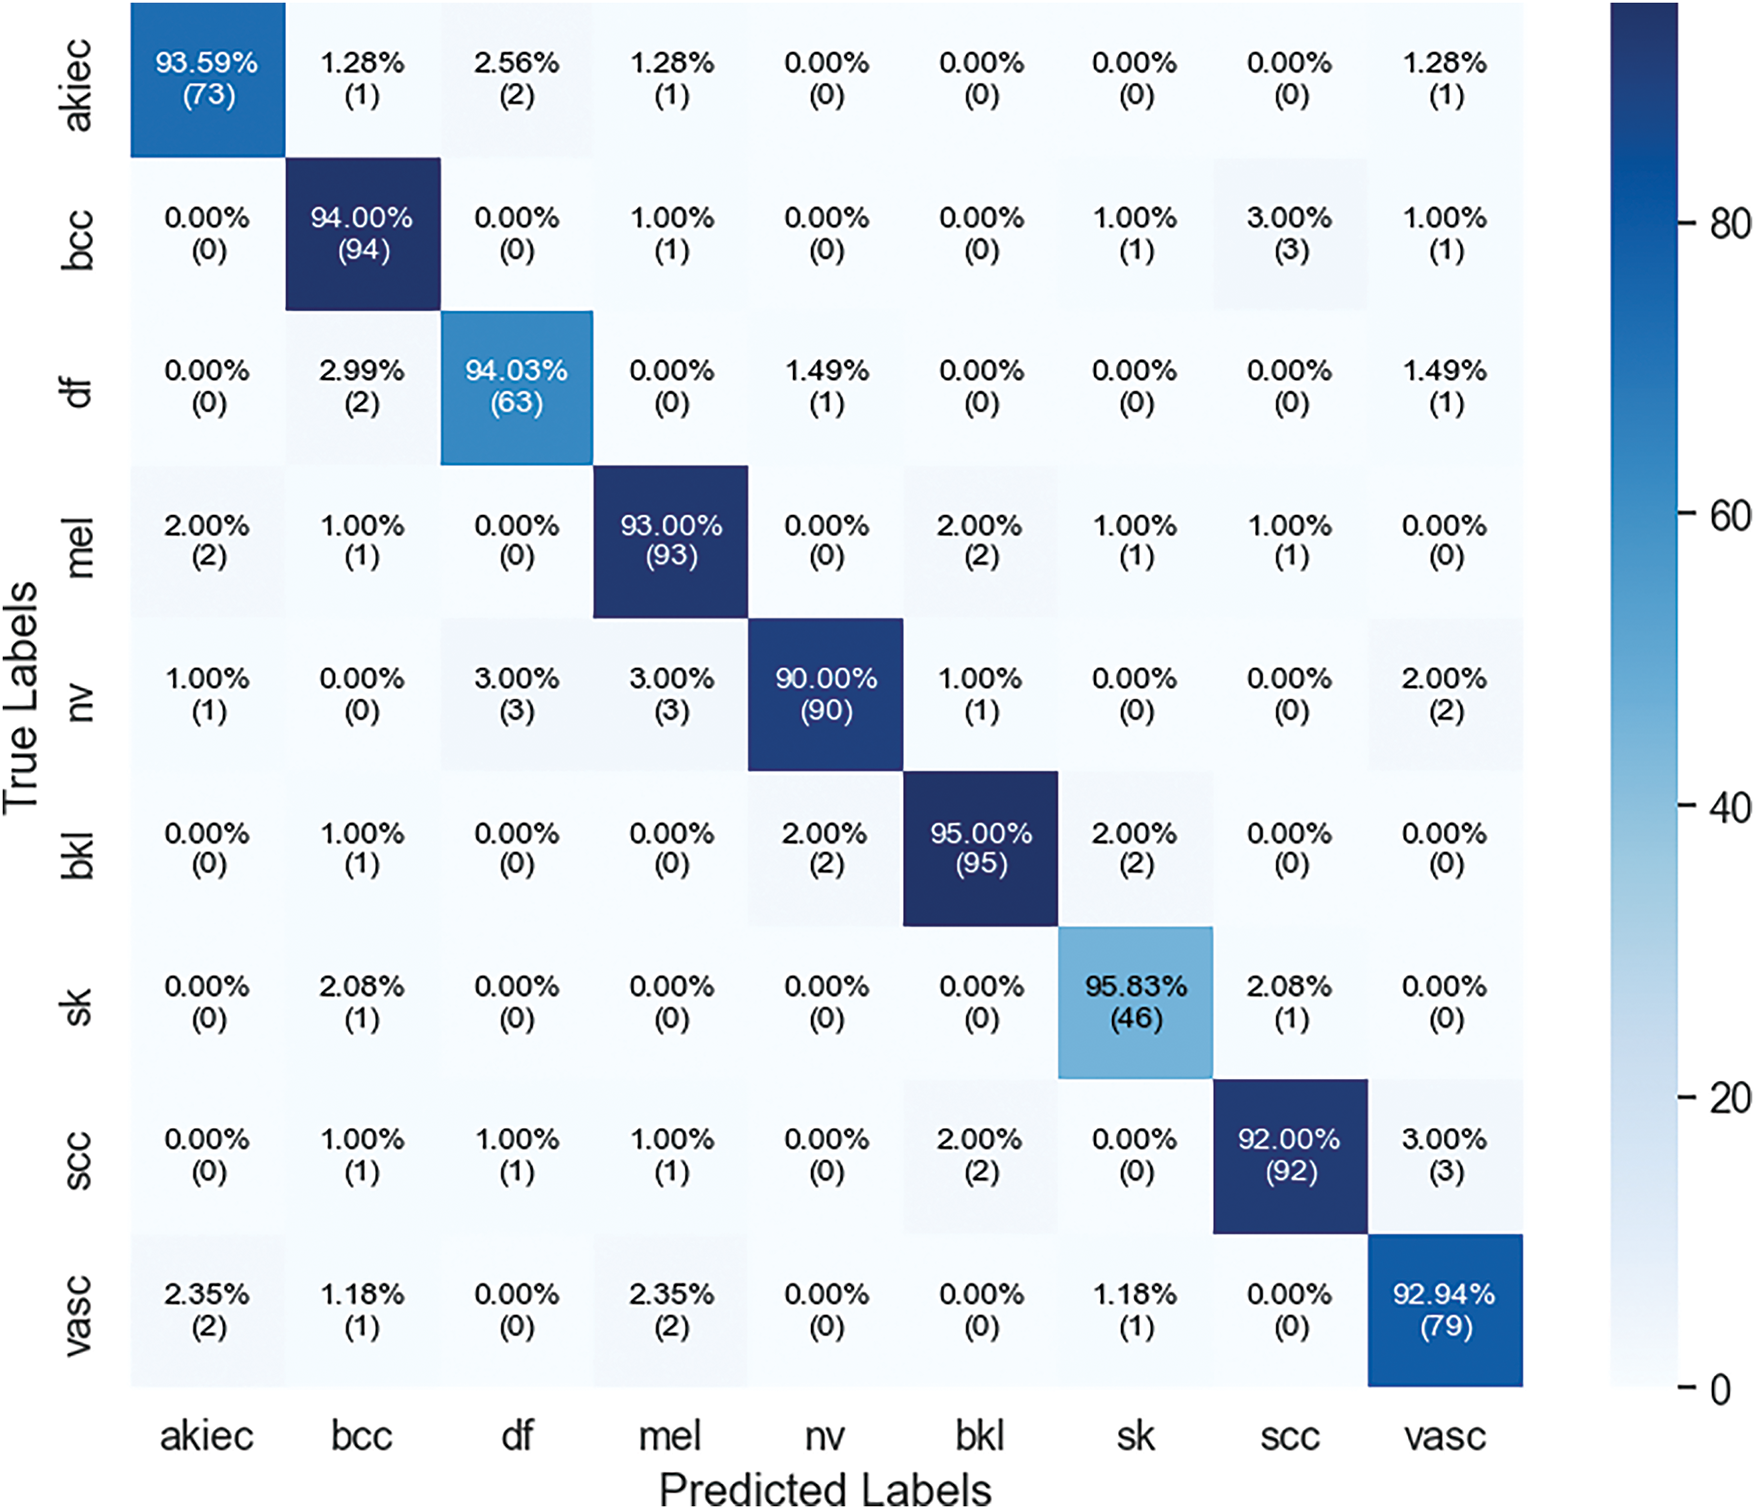
Figure 19: Confusion matrix of xCViT (Proposed Model) on skin cancer ISIC dataset
4.5 Comparison of Proposed Method with Other Pre-Trained Networks
Table 8 compares the performance of several pre-trained models, highlighting their effectiveness across key evaluation metrics. The proposed xCViT model outperforms all others, achieving the highest accuracy of 96.74%, along with Precision (95.46%), Recall (96.27%), Specificity (96.00%), F1-Score (95.86%), and AUC (97.86%). Among the competing models, Xception follows with an accuracy of 93.28%, demonstrating strong performance with a specificity of 92.14% and an AUC of 92.94%. DenseNet201 also shows competitive results with 92.47% accuracy and a specificity of 91.42%. EfficientNetB2 and ResNet50 exhibit moderate performance, achieving 88.90% and 89.34% accuracy, respectively. Lastly, VGG19 reports the lowest accuracy of 85.34%, with a specificity of 83.26%. These results are graphically represented in Fig. 20, providing a comparative visualization of model performance across all key metrics.
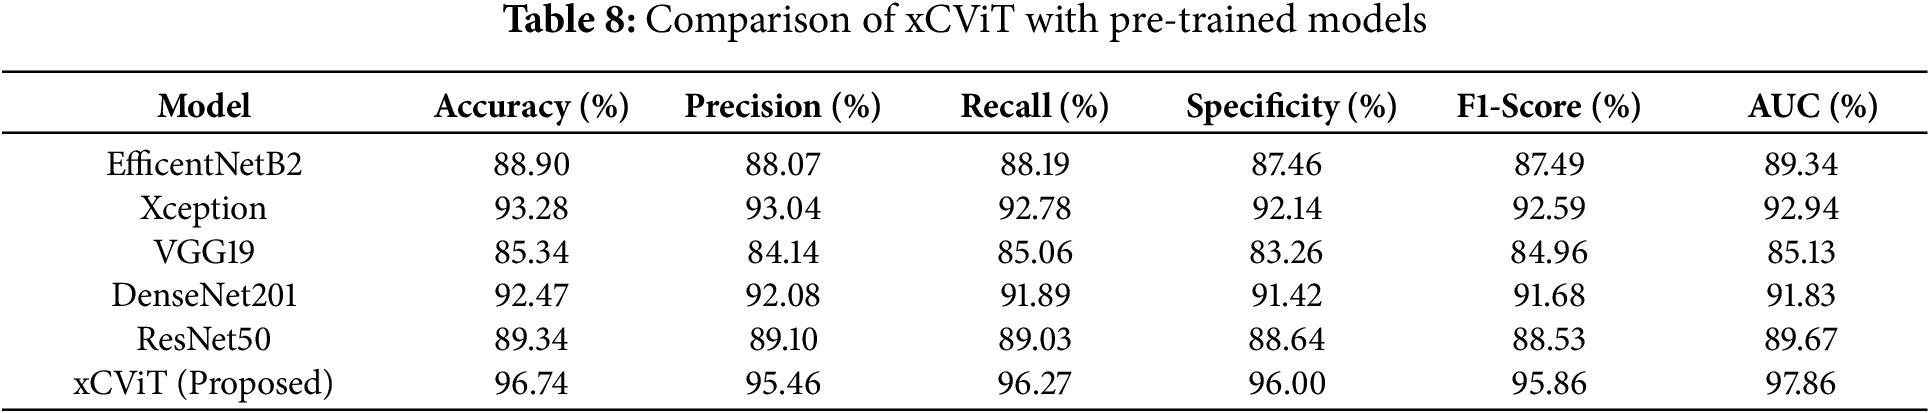
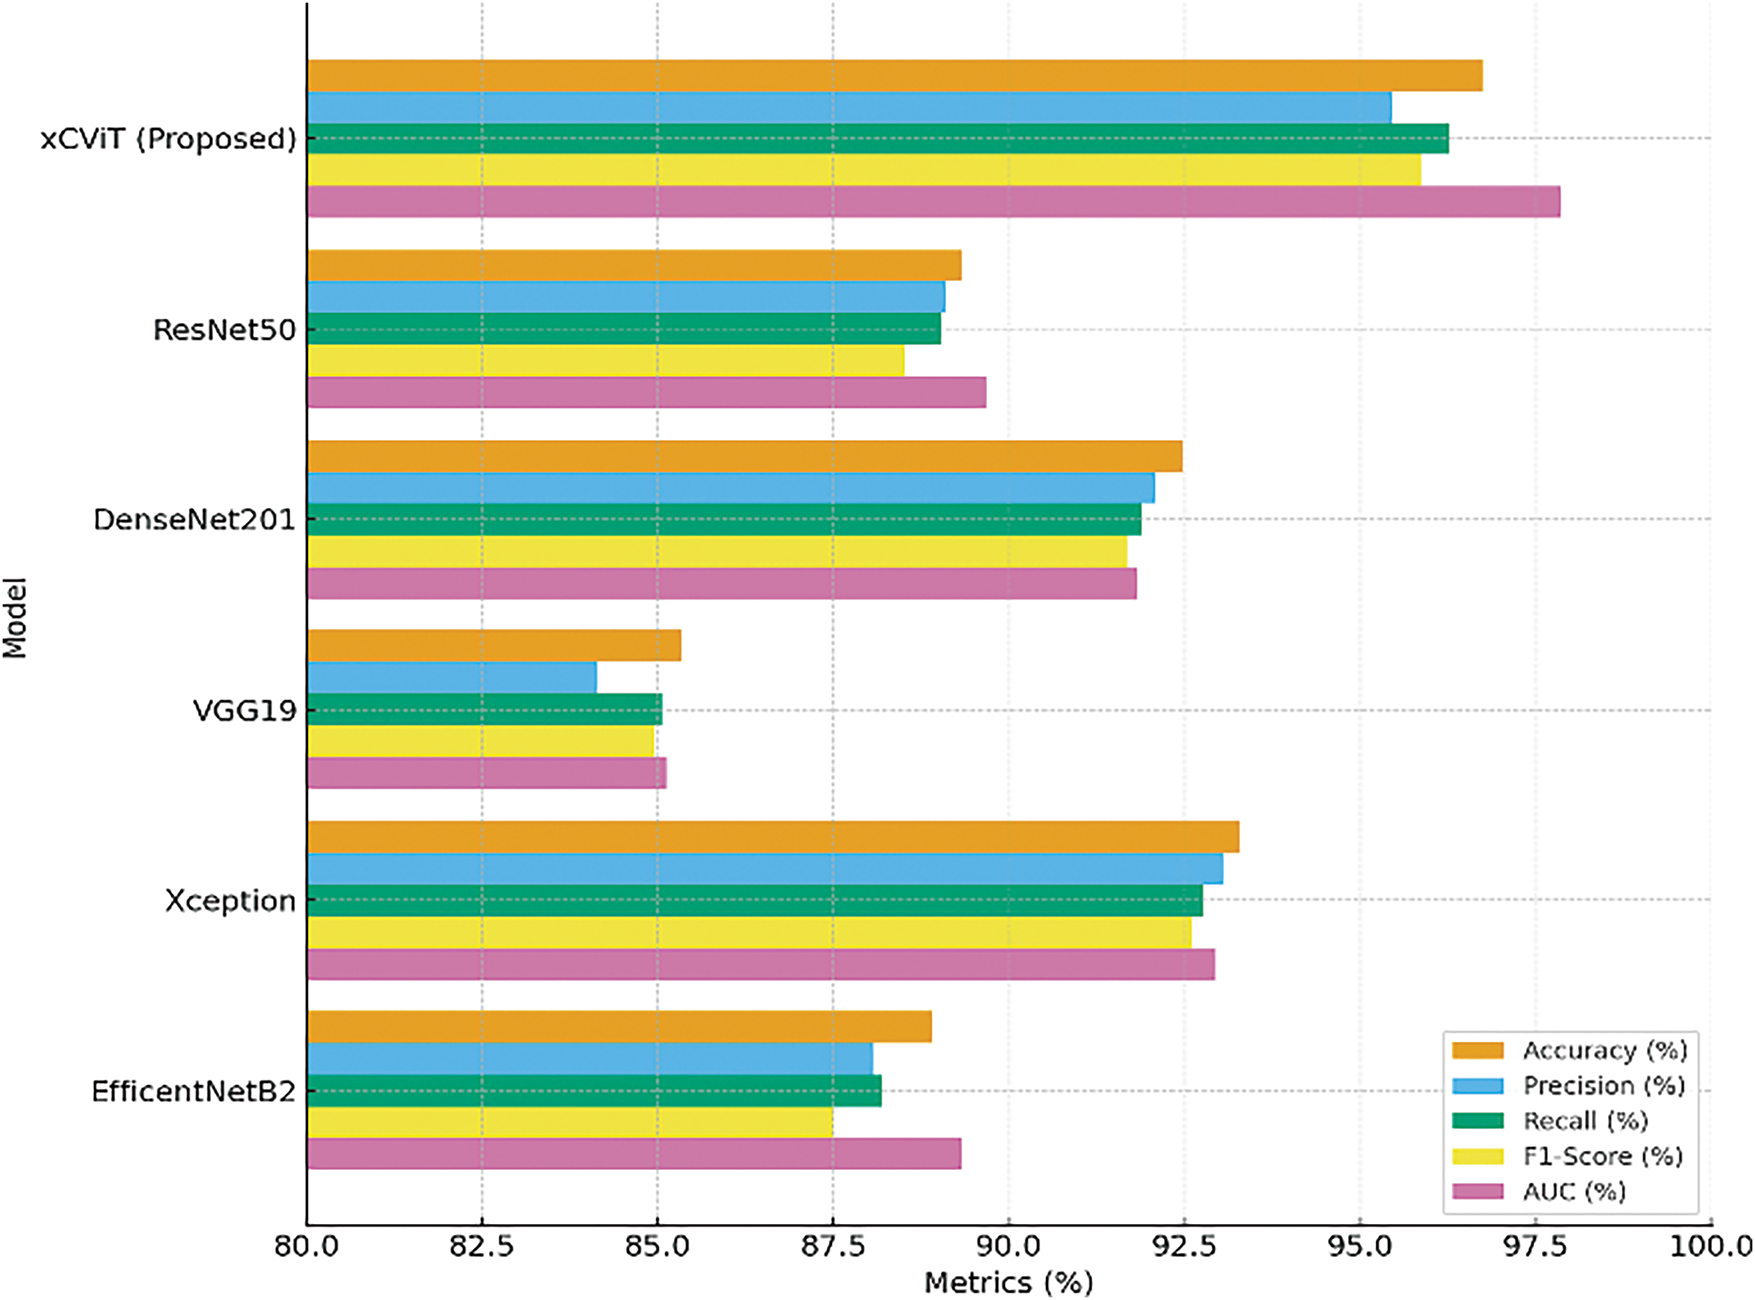
Figure 20: Comparison of evaluation metrices on different pre-trained models
4.6 Explainability of Proposed xCViT
The results derived by GradCam on both the HAM10000 and Skin Cancer ISIC datasets include visuals depicting the model’s decisions. Fig. 21 illustrates the Grad-CAM visualizations for various skin lesion classes from the HAM10000 dataset, namely melanoma (mel), melanocytic nevus (nv), basal cell carcinoma (bcc), actinic keratosis (akiec), benign keratosis (bkl), dermatofibroma (df), and vascular lesions (vasc). The visualizations highlight the regions of the input images that the xCViT model focused on to make its predictions. In Melanoma (mel) class, the model predominantly focuses on irregular and asymmetrical dark regions, which are critical features for melanoma diagnosis. These regions align with the clinical observations used by dermatologists to differentiate melanoma from benign lesions. In Melanocytic nevus (nv) class, the heatmaps highlight evenly pigmented and smooth areas, which correspond to the clinical characteristics of benign moles. In Basal cell carcinoma (bcc) class, the model emphasizes the central regions of the lesion, capturing the characteristic nodular patterns often seen in this type of skin cancer. In Actinic keratosis (akiec) class, Grad-CAM highlights the rough and scaly areas of the lesion, consistent with the precancerous nature of actinic keratosis. In Benign keratosis (bkl) class, the model focuses on the distinctive borders and textures, which help in distinguishing benign keratosis from malignant lesions. In Dermatofibroma (df) class, the heatmaps cover the central portion of the lesion, reflecting its well-defined and non-aggressive nature. In Vascular lesions (vasc) class, Grad-CAM highlights the vascular structures, including red or purplish areas, which are critical for identifying this class. The proposed model successfully identifies the essential visual characteristics that enable accurate classification. The highlighted areas for each class correlate to the clinical dermatoscopy characteristics that confirm the accuracy of the model’s information. These explainability visualizations demonstrate that the xCViT model is not only accurate in classifying skin lesions but also interpretable, as the highlighted areas correspond to clinically relevant features.
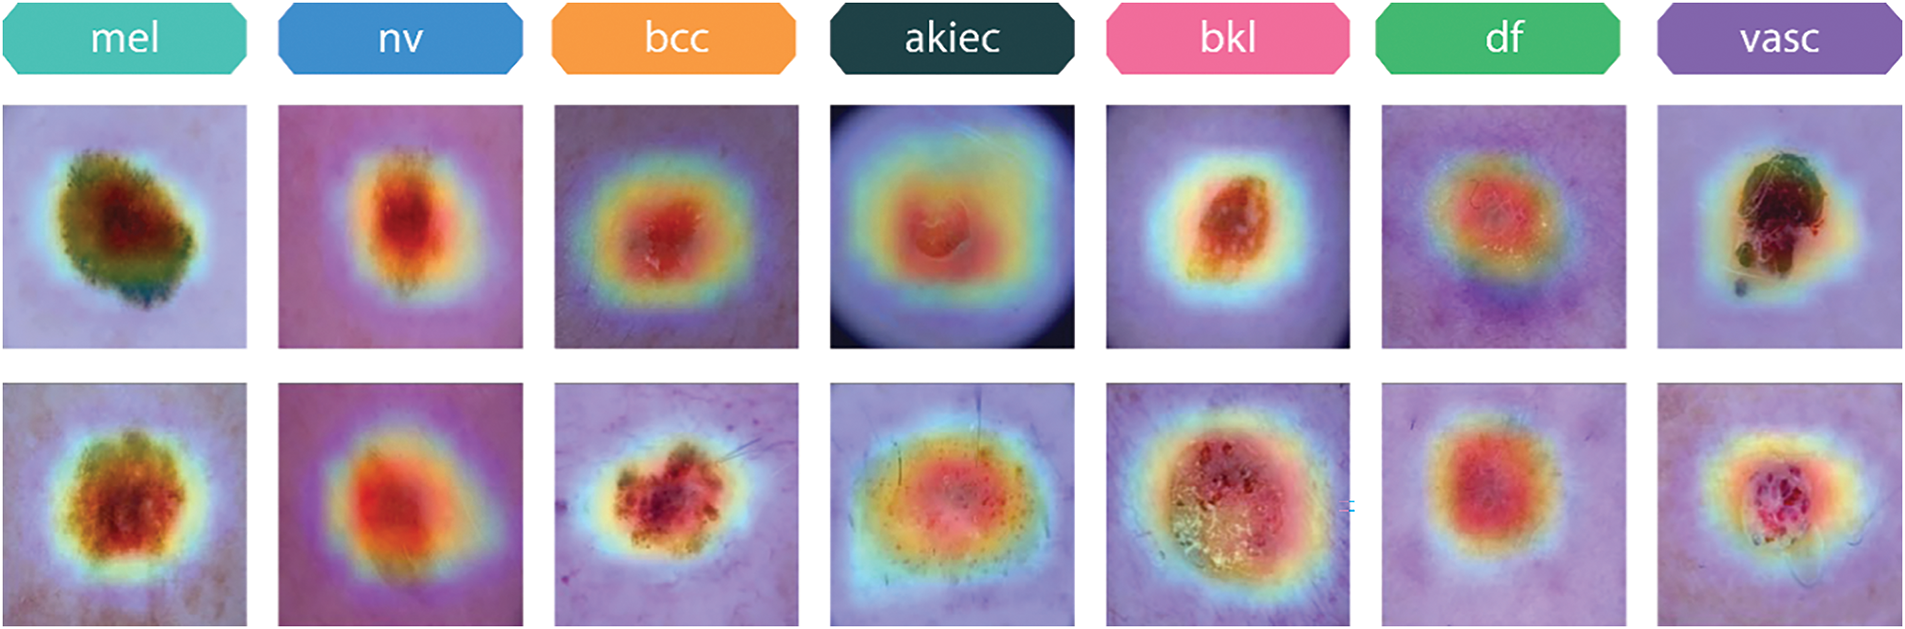
Figure 21: Grad-CAM visualizations of different skin lesion classes from the HAM10000 dataset
Fig. 22 showcases Grad-CAM visualizations for various skin lesion classes from the Skin Cancer ISIC dataset, including actinic keratosis (akiec), basal cell carcinoma (bcc), dermatofibroma (df), melanoma (mel), melanocytic nevus (nv), benign keratosis (bkl), seborrheic keratosis (sk), squamous cell carcinoma (scc), and vascular lesions (vasc). These visualizations highlight the specific regions in each image that the proposed xCViT model focuses on to make its predictions. The heatmaps illustrate the relative importance of different areas, with warmer colors (e.g., red, orange) indicating higher model attention. For Actinic keratosis (akiec) class, the model emphasizes rough, irregularly textured regions typical of this precancerous condition, reflecting its focus on clinically significant features. For Basal cell carcinoma (bcc) class, Grad-CAM highlights the central nodular area of the lesion, aligning with the known presentation of basal cell carcinoma as a raised and localized lesion. For Dermatofibroma (df) class, the heatmap focuses on the lesion’s central area, corresponding to the well-defined, firm nature of dermatofibromas. For Melanoma (mel) class, the highlighted regions emphasize irregular pigmentation and asymmetrical patterns, which are critical for diagnosing melanoma. For Melanocytic nevus (nv) class, the heatmap captures smooth and evenly pigmented areas, consistent with benign characteristics of melanocytic nevi. For Benign keratosis (bkl) class, Grad-CAM focuses on distinctive borders and textured regions, helping to distinguish benign keratosis from malignant counterparts. For Seborrheic keratosis (sk) class, the model captures areas of waxy, textured growths, indicative of this non-cancerous condition. For Squamous cell carcinoma (scc) class, the heatmap highlights irregular borders and rough textures, characteristics of this malignant lesion. For Vascular lesions (vasc) class, the model emphasizes vascular patterns, including red and purplish regions, crucial for identifying this class. These visualizations provide insights into the model’s decision-making process, demonstrating its ability to focus on clinically relevant features for each lesion type.
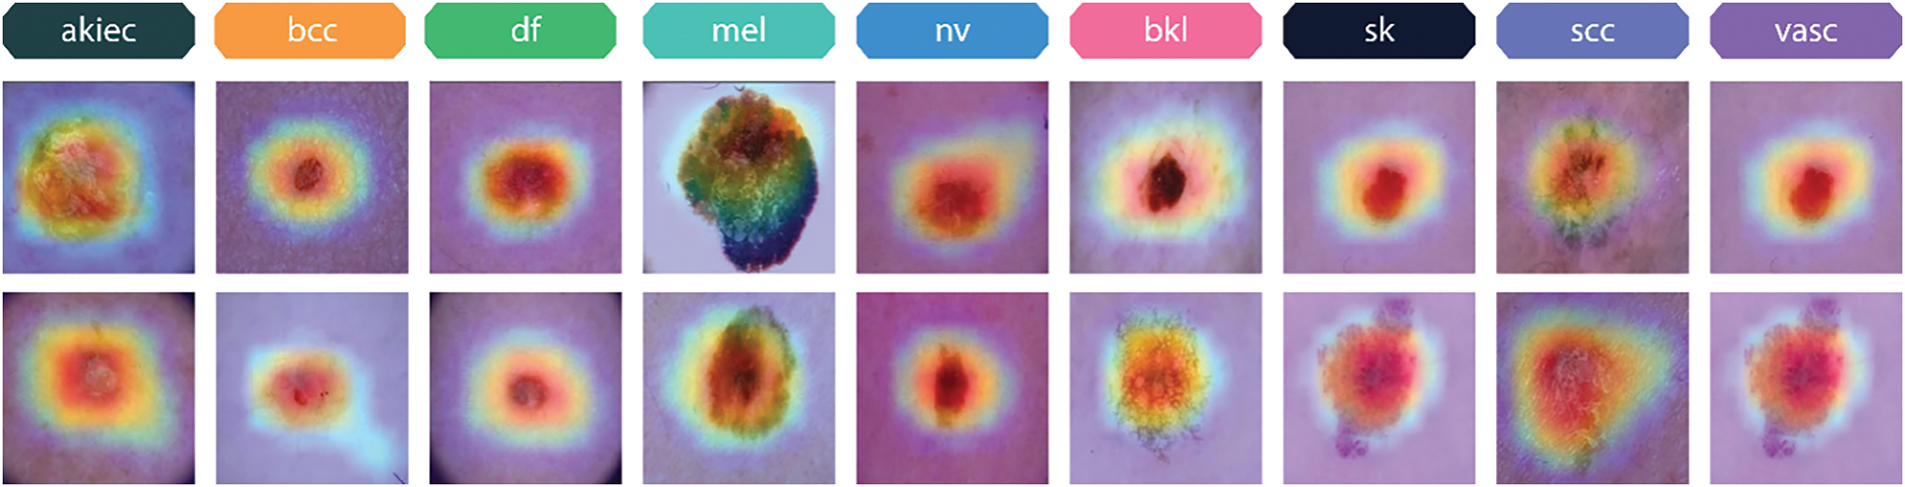
Figure 22: Grad-CAM visualizations of different skin lesion classes from the skin cancer ISIC dataset
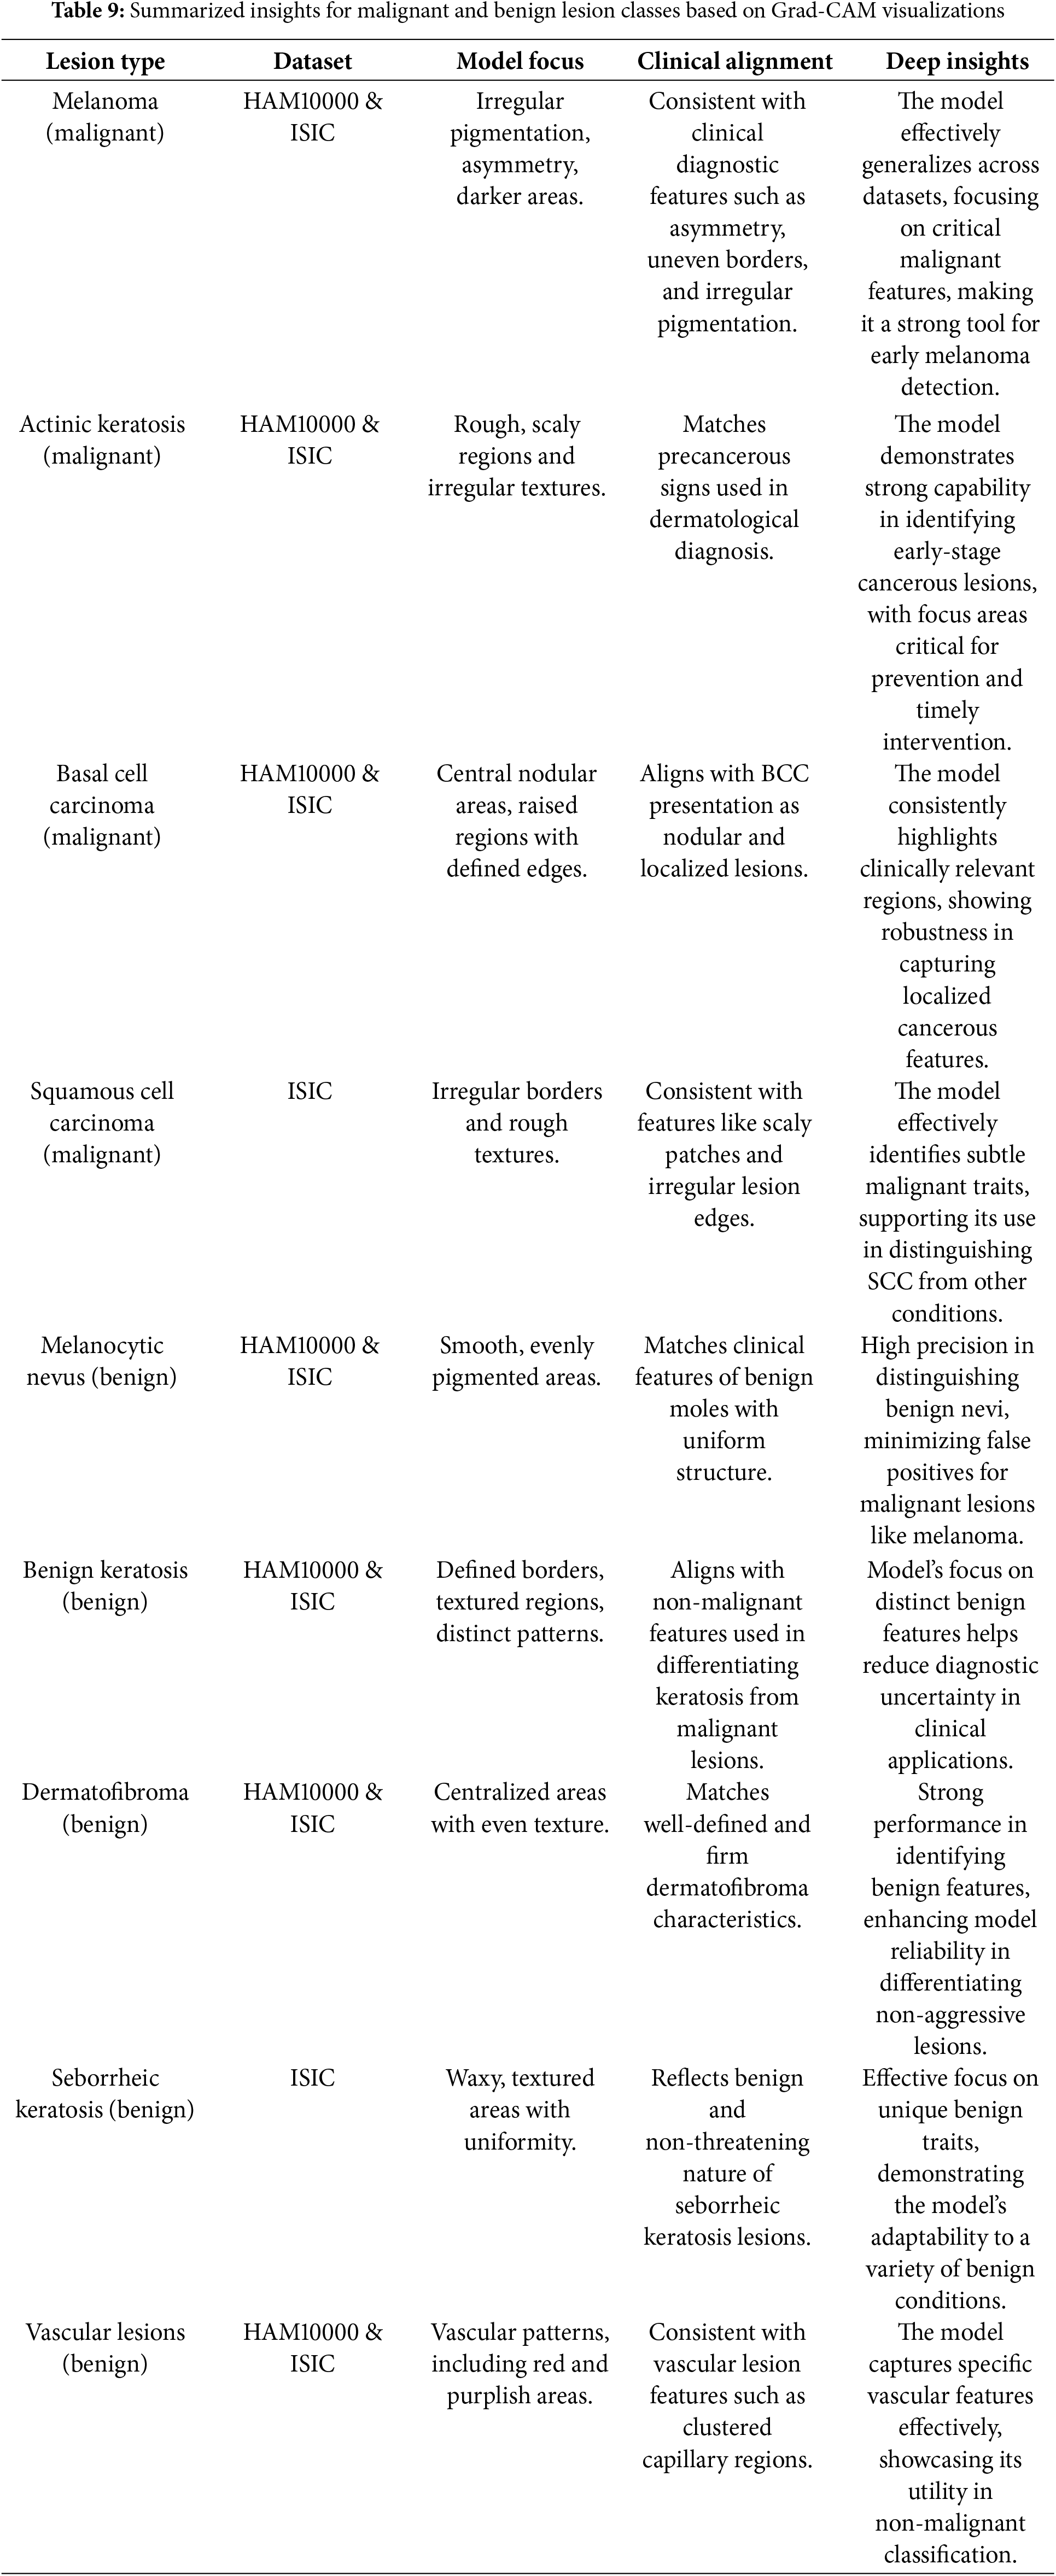
Table 9 summarizes the key insights for malignant and benign lesion classes, focusing on Grad-CAM results, clinical alignment, and the implications of the model’s explainability and performance.
4.7 Comparison with Other Studies
Table 10 shows that Maduranga et al. [27] achieved accuracy of 85.00% using MobileNet, while Thurnhofer-Hemsi et al. [28] reported accuracy of 83.20% with Shifted 2-Nets. Srinivasu et al. [29] combied MobileNetV2 with LSTM resulting accuracy of 86.33%. EW-FCM with Wide ShuffleNet was used by Hoang et al. [30] and obtained accuracy of 86.33%. Al-Masni et al. [31] achieved accuracy of 88.70% using FrCN with DenseNet201. Agyenta et al. [32] obtained accuracy of 86.91% by combining InceptionV3, ResNet50, and DenseNet201. The proposed xCViT model achieved an accuracy of 96.74% which surpasses all these techniques. Fig. 23 illustrates the comparison of xCViT with other techniques.
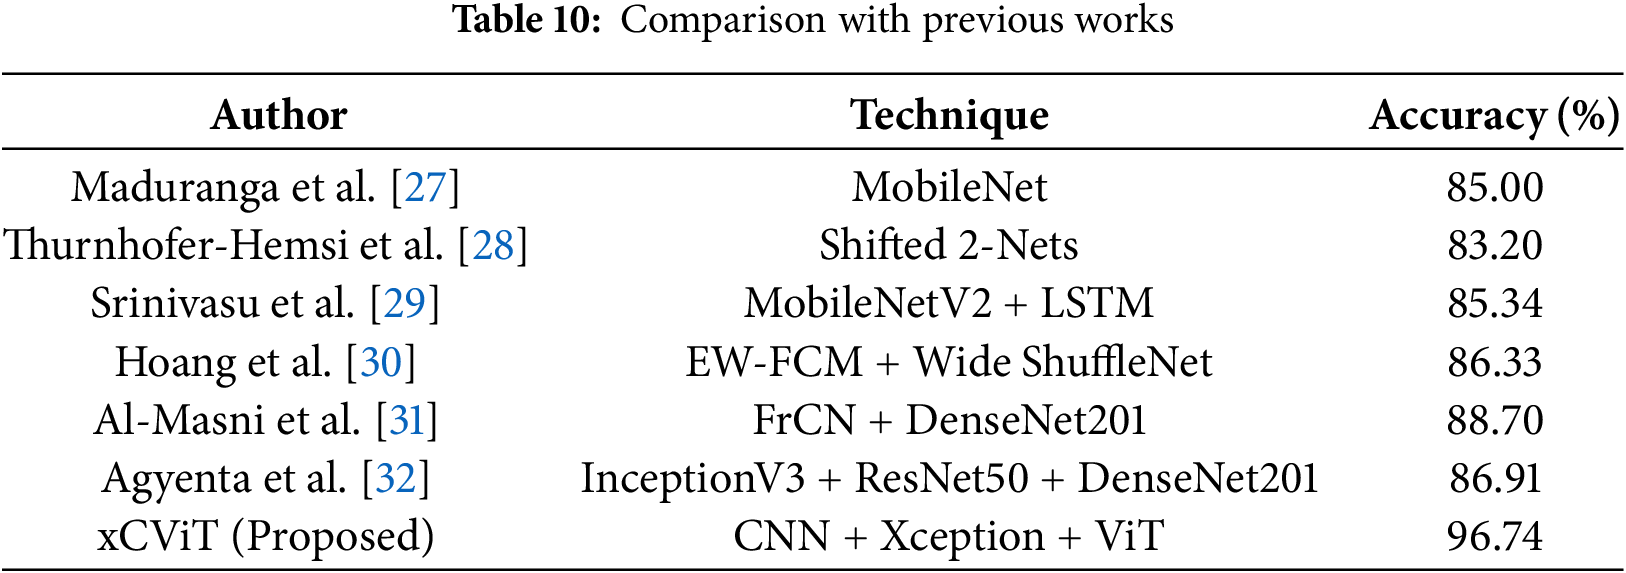
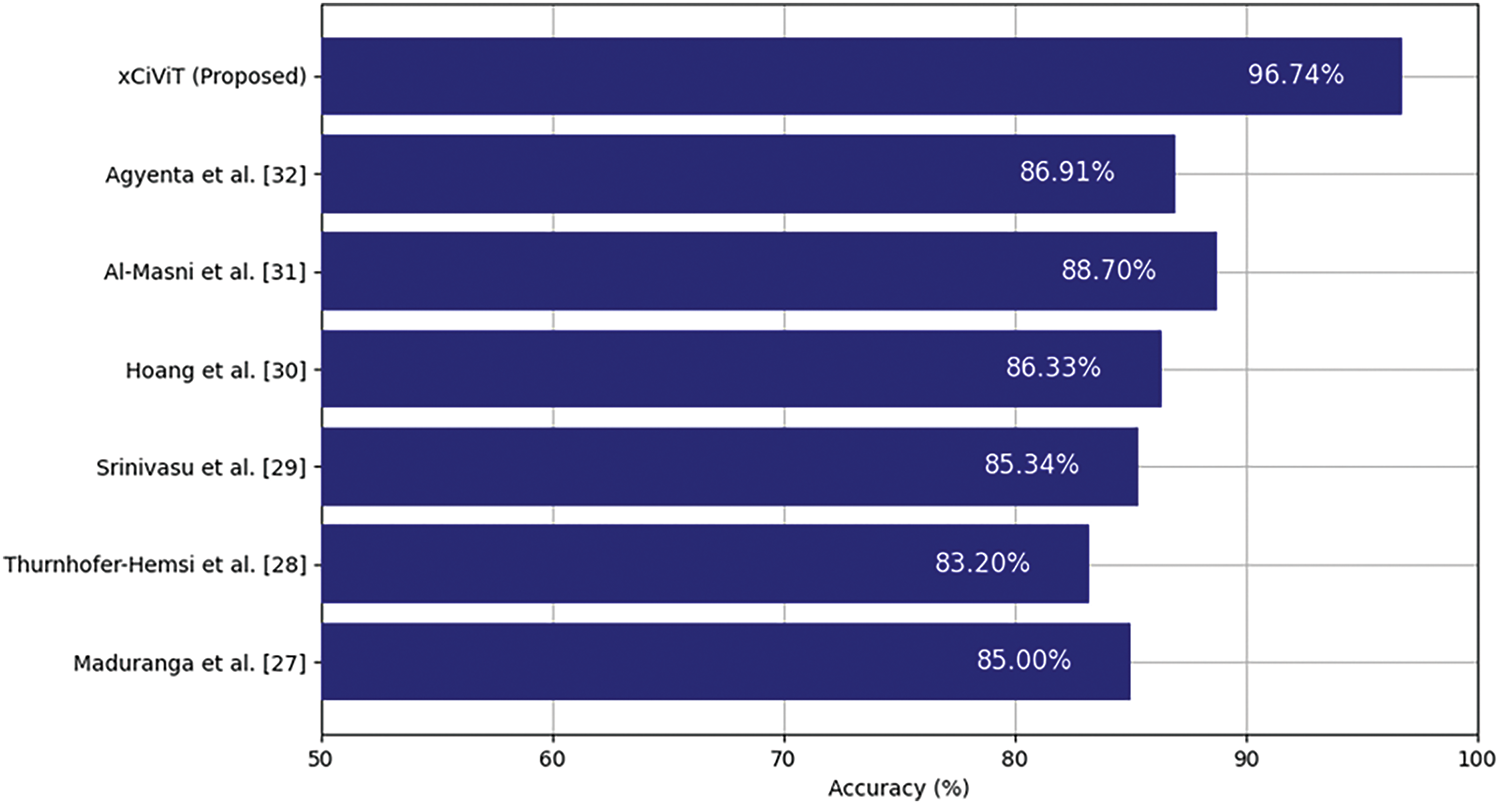
Figure 23: Performance comparison of xCViT (proposed) with previous works [27–32]
The main problem in automated skin cancer identification is the precise capture of both local features and global context in skin lesion images. Conventional models, mostly reliant on CNNs, excel in local feature extraction but frequently struggle to grasp the contextual relationships within the image. This constraint may result in misclassifications, especially in instances where nuanced differences between malignant and benign lesions are present. The incidence of false positives and false negatives continues to be a significant concern, leading to diagnostic inefficiencies and even treatment delays. This paper presents the xCViT technique, which combines CNNs, Vision Transformers (ViTs), and Xception architecture to tackle these difficulties. This hybrid methodology utilizes the advantages of CNNs for local feature extraction and ViTs for global context acquisition, markedly improving classification precision and diagnostic reliability. The integration of Xception architecture enhances the model’s efficiency, allowing it to process intricate skin lesion images while preserving scalability and performance.
The xCViT technique has enhanced performance relative to other leading methods. Table 9 shows that the xCViT model attains superior accuracy, precision, recall, and F1-Score on both the HAM10000 and Skin Cancer ISIC datasets. It surpasses models including Custom CNN + ViT + DenseNet201, Custom CNN + ViT + ResNet50, Custom CNN + ViT + EfficientNetB2, and Custom CNN + ViT + MobileNetV2. This underscores the efficacy of the hybrid architecture in gathering both detailed local features and extensive contextual information, essential for precise lesion classification. The amalgamation of ensemble methods with anomaly detection algorithms decreases the incidence of false positives and false negatives, hence enhancing the model’s reliability for clinical application. Table 3 presents a comparison of the xCViT approach against various backbone topologies. The xCViT model surpasses conventional CNN-based models and hybrid architectures that integrate CNNs with other vision transformers or deep learning frameworks such as ResNet50, DenseNet201, and EfficientNetB2. This illustrates the efficacy of the suggested method in processing complex skin lesion images and rendering dependable diagnostic conclusions. The capacity to extract local and global features, along with the application of sophisticated ensemble algorithms, enhances classification accuracy and diagnostic reliability, rendering the xCViT approach a viable solution for the early and precise identification of skin cancer.
The research findings can provide policy recommendations aimed at facilitating the integration of AI-driven technology into healthcare systems for early identification of skin cancer. Governments and healthcare organizations ought to promote the integration of sophisticated AI technologies, such as the suggested hybrid deep learning model, into clinical dermatology. Investment in artificial intelligence research and development is essential for policies, especially for skin cancer detection. The standardization of data gathering and model evaluation procedures could facilitate consistency and equity in AI applications, hence encouraging the utilization of diverse and impartial datasets, enhancing early diagnosis and hence reducing errors in the treatment of skin cancer patients.
This article proposes a novel deep learning fusion architecture xCViT that leverages ViT, Xception, and a proprietary CNN to address class imbalance and improve efficiency. The initial phase of our methodology involved class balance through data augmentation, followed by the integration of ViT, CNN, and Xception models. In light of the initial performance deficiencies, it was determined to implement a custom CNN comprising three application-oriented blocks: the Dense Block for enhanced transfer of perceptual features, the depth-wise separable convolution block to reduce computational complexity, and the Inception-Like Module for comprehensive feature extraction. The metrics of precision, accuracy, recall, specificity, F1-Score, and ROC-AUC are 96.74%, 95.46%, 96.27%, 96.00%, 95.86%, and 97.86% for the HAM10000 dataset, and 93.19%, 92.97%, 92.95%, 92.89% 93.14%, and 96.26% for the Skin Cancer ISIC dataset, all of which are exceeded. Grad-CAM representations validated the previous advantages of our methodology.
The primary problem is a limited number of datasets (only two) used, which may compromise the model’s generalizability. The HAM10000 and Skin Cancer ISIC datasets encompass a limited spectrum of potential skin diseases and conditions. Subsequent study may incorporate more datasets comprising a more varied array of samples from distinct people and places to assess its robustness and adaptability across different contexts. Although our proposed model attains accuracy, its computational complexity may pose a challenge for deployment in resource-constrained situations. As a specific focus for future research, optimizing for reduced resource use without compromising performance may be considered. A further problem is the class imbalance in the datasets. The imbalance may continue to adversely affect model performance in the underrepresented classes. This would include employing advanced approaches such as generative adversarial networks (GANs) for data augmentation or class-weighted loss functions to enhance performance across all categories of skin diseases. Although Grad-CAM visualizations offered valuable qualitative insights into the model’s decision-making, a more comprehensive method for real-time interpretability in clinical environments is still needed to foster trust and transparency in AI-driven systems for skin cancer detection.
5.2 Future Scope and Research Directions
The potential future uses of our proposed approach may be extended beyond skin cancer diagnosis. Our architecture can be modified for other medical imaging applications, including the detection of breast, lung, or brain cancer, or general pathology, where deep learning model’s capacity to identify complex features will be advantageous. The model can be further tailored from the presented design, so augmenting its capacity to generalize and excel on previously unseen data. Potential avenues of investigation include the application of sophisticated AI methodologies, like reinforcement learning for improved decision-making and federated learning to safeguard data privacy. The primary hurdles encountered throughout this research involved insufficient data diversity, class imbalance, and computational resource constraints. Future research efforts can surmount these restrictions by including additional datasets, employing transfer learning techniques to enhance accuracy, and refining the model for other applications. The integration of AI into conventional diagnostic instruments as a part of a hybrid system may enhance the reliability of diagnostic systems in healthcare applications.
Acknowledgement: Not available.
Funding Statement: The authors received no specific funding for this study.
Author Contributions: The authors confirm contribution to the paper as follows: study conception and design: Armughan Ali, Hooria Shahbaz, Robertas Damaševičius; data collection: Armughan Ali, Hooria Shahbaz, Robertas Damaševičius; analysis and interpretation of results: Armughan Ali, Hooria Shahbaz, Robertas Damaševičius; draft manuscript preparation: Armughan Ali, Hooria Shahbaz, Robertas Damaševičius. All authors reviewed the results and approved the final version of the manuscript.
Availability of Data and Materials: The HAM10000 dataset that supports the findings of this study are openly available in Harvard Dataverse at https://doi.org/10.7910/DVN/DBW86T (accessed on 18 February 2025). The Skin Cancer ISIC dataset that supports the findings of this study are openly available at https://www.kaggle.com/datasets/nodoubttome/skin-cancer9-classesisic/data (accessed on 18 February 2025).
Ethics Approval: Not applicable.
Conflicts of Interest: The authors declare no conflicts of interest to report regarding the present study.
1https://www.kaggle.com/datasets/nodoubttome/skin-cancer9-classesisic (accessed on 18 February 2025).
References
1. Gloster HMJr, Neal K. Skin cancer in skin of color. J Am Acad Dermatol. 2006;55(5):741–60. doi:10.1016/j.jaad.2005.08.063. [Google Scholar] [PubMed] [CrossRef]
2. Ciuciulete AR, Stepan AE, Andreiana BC, Simionescu CE. Non-melanoma skin cancer: statistical associations between clinical parameters. Curr Health Sci J. 2022;48(1):110–5. doi:10.12865/CHSJ.48.01.16. [Google Scholar] [PubMed] [CrossRef]
3. Alabduljabbar R, Alshamlan H. Intelligent multiclass skin cancer detection using convolution neural networks. Comput Mater Contin. 2021;69(1):831–47. doi:10.32604/cmc.2021.018402. [Google Scholar] [CrossRef]
4. Gomathi E, Jayasheela M, Thamarai M, Geetha M. Skin cancer detection using dual optimization based deep learning network. Biomed Signal Process Contr. 2023;84(1):104968. doi:10.1016/j.bspc.2023.104968. [Google Scholar] [CrossRef]
5. Vidhyalakshmi AM, Kanchana M. Skin cancer classification using improved transfer learning model-based random forest classifier and golden search optimization. Int J Imaging Syst Tech. 2024;34(1):e22971. doi:10.1002/ima.22971. [Google Scholar] [CrossRef]
6. Kavitha C, Priyanka S, Kumar MP, Kusuma V. Skin cancer detection and classification using deep learning techniques. Procedia Comput Sci. 2024;235(1):2793–802. doi:10.1016/j.procs.2024.04.264. [Google Scholar] [CrossRef]
7. Islam N, Hasib KM, Joti FA, Karim A, Azam S. Leveraging knowledge distillation for lightweight skin cancer classification: balancing accuracy and computational efficiency. arXiv:2406.17051. 2024. [Google Scholar]
8. Abdullah A, Siddique A, Shaukat K, Jan T. An intelligent mechanism to detect multi-factor skin cancer. Diagnostics. 2024;14(13):1359. doi:10.3390/diagnostics14131359. [Google Scholar] [PubMed] [CrossRef]
9. Nasir IM, Tehsin S, Damaševičius R, Maskeliūnas R. Integrating explanations into CNNs by adopting spiking attention block for skin cancer detection. Algorithms. 2024;17(12):557. doi:10.3390/a17120557. [Google Scholar] [CrossRef]
10. Monica KM, Shreeharsha J, Falkowski-Gilski P, Falkowska-Gilska B, Awasthy M, Phadke R. Melanoma skin cancer detection using mask-RCNN with modified GRU model. Front Physiol. 2024;14:1324042. doi:10.3389/fphys.2023.1324042. [Google Scholar] [PubMed] [CrossRef]
11. Agrawal R, Gupta N, Jalal AS. CACBL-Net: a lightweight skin cancer detection system for portable diagnostic devices using deep learning based channel attention and adaptive class balanced focal loss function. Multimed Tools Appl. 2024;35(Suppl 4):S39. doi:10.1007/s11042-024-19485-1. [Google Scholar] [CrossRef]
12. Angelin Claret SP, Dharmian JP, Manokar AM. Artificial intelligence-driven enhanced skin cancer diagnosis: leveraging convolutional neural networks with discrete wavelet transformation. Egypt J Med Hum Genet. 2024;25(1):50. doi:10.1186/s43042-024-00522-5. [Google Scholar] [CrossRef]
13. Shehzad K, Tan Z, Shoukat S, Saeed A, Ahmad I, Sarwar Bhatti S, et al. A deep-ensemble-learning-based approach for skin cancer diagnosis. Electronics. 2023;12(6):1342. doi:10.3390/electronics12061342. [Google Scholar] [CrossRef]
14. Hussain M, Khan MA, Damaševičius R, Alasiry A, Marzougui M, Alhaisoni M, et al. SkinNet-INIO: multiclass skin lesion localization and classification using fusion-assisted deep neural networks and improved nature-inspired optimization algorithm. Diagnostics. 2023;13(18):2869. doi:10.3390/diagnostics13182869. [Google Scholar] [PubMed] [CrossRef]
15. Maqsood S, Damaševičius R. Multiclass skin lesion localization and classification using deep learning based features fusi on and selection framework for smart healthcare. Neural Netw. 2023;160(4):238–58. doi:10.1016/j.neunet.2023.01.022. [Google Scholar] [PubMed] [CrossRef]
16. Maqsood S, Damaševičius R, Shahid S, Forkert ND. MOX-NET: multi-stage deep hybrid feature fusion and selection framework for monkeypox classification. Expert Syst Appl. 2024;255(8):124584. doi:10.1016/j.eswa.2024.124584. [Google Scholar] [CrossRef]
17. Nawaz M, Nazir T, Masood M, Ali F, Khan MA, Tariq U, et al. Melanoma segmentation: a framework of improved DenseNet77 and UNET convolutional neural network. Int J Imaging Syst Tech. 2022;32(6):2137–53. doi:10.1002/ima.22750. [Google Scholar] [CrossRef]
18. Nivedha S, Shankar S. Melanoma diagnosis using enhanced faster region convolutional neural networks optimized by artificial gorilla troops algorithm. Inf Technol Contr. 2023;52(4):819–32. doi:10.5755/j01.itc.52.4.33503. [Google Scholar] [CrossRef]
19. Ren G. Monkeypox disease detection with pretrained deep learning models. Inf Technol Contr. 2023;52(2):288–96. doi:10.5755/j01.itc.52.2.32803. [Google Scholar] [CrossRef]
20. Dosovitskiy A, Beyer L, Kolesnikov A, Weissenborn D, Zhai X, Unterthiner T, et al. An image is worth 16 × 16 words: transformers for image recognition at scale. arXiv:2010.11929. 2020. [Google Scholar]
21. Chollet F. Xception: deep learning with depthwise separable convolutions. In: 2017 IEEE Conference on Computer Vision and Pattern Recognition (CVPR); 2017 Jul 21–26; Honolulu, HI, USA: IEEE. p. 1800–7. doi:10.1109/CVPR.2017.195. [Google Scholar] [CrossRef]
22. Howard AG, Zhu M, Chen B, Kalenichenko D, Wang W, Weyand T, et al. MobileNets: efficient convolutional neural networks for mobile vision applications. arXiv:1704.04861. 2017. [Google Scholar]
23. Selvaraju RR, Cogswell M, Das A, Vedantam R, Parikh D, Batra D. Grad-CAM: visual explanations from deep networks via gradient-based localization. In: 2017 IEEE International Conference on Computer Vision (ICCV); 2017 Oct 22–29; Venice, Italy: IEEE. p. 618–26. doi:10.1109/ICCV.2017.74. [Google Scholar] [CrossRef]
24. Charbonnier P, Blanc-Feraud L, Aubert G, Barlaud M. Two deterministic half-quadratic regularization algorithms for computed imaging. In: Proceedings of 1st International Conference on Image Processing; 1994 Nov 13–16; Austin, TX, USA: IEEE. p. 168–72. doi:10.1109/ICIP.1994.413553. [Google Scholar] [CrossRef]
25. Loshchilov I, Hutter F. Decoupled weight decay regularization. arXiv:1711.05101. 2017. [Google Scholar]
26. Loshchilov I, Hutter F. SGDR: stochastic gradient descent with warm restarts. arXiv:1608.03983. 2016. [Google Scholar]
27. Maduranga M, Nandasena D. Mobile-based skin disease diagnosis system using convolutional neural networks (CNN). Int J Image Graph Signal Process. 2022;14(3):47–57. doi:10.5815/ijigsp.2022.03.05. [Google Scholar] [CrossRef]
28. Thurnhofer-Hemsi K, López-Rubio E, Domínguez E, Elizondo DA. Skin lesion classification by ensembles of deep convolutional networks and regularly spaced shifting. IEEE Access. 2021;9:112193–205. doi:10.1109/ACCESS.2021.3103410. [Google Scholar] [CrossRef]
29. Srinivasu PN, SivaSai JG, Ijaz MF, Bhoi AK, Kim W, Kang JJ. Classification of skin disease using deep learning neural networks with MobileNet V2 and LSTM. Sensors. 2021;21(8):2852. doi:10.3390/s21082852. [Google Scholar] [PubMed] [CrossRef]
30. Hoang L, Lee SH, Lee EJ, Kwon KR. Multiclass skin lesion classification using a novel lightweight deep learning framework for smart healthcare. Appl Sci. 2022;12(5):2677. doi:10.3390/app12052677. [Google Scholar] [CrossRef]
31. Al-Masni MA, Kim DH, Kim TS. Multiple skin lesions diagnostics via integrated deep convolutional networks for segmentation and classification. Comput Methods Programs Biomed. 2020;190(1):105351. doi:10.1016/j.cmpb.2020.105351. [Google Scholar] [PubMed] [CrossRef]
32. Agyenta C, Akanzawon M. Skin lesion classification based on convolutional neural network. J Appl Sci Technol Trends. 2022;3(1):21–6. doi:10.38094/jastt301121. [Google Scholar] [CrossRef]
Cite This Article
 Copyright © 2025 The Author(s). Published by Tech Science Press.
This work is licensed under a Creative Commons Attribution 4.0 International License , which permits unrestricted use, distribution, and reproduction in any medium, provided the original work is properly cited.
 Downloads
 Citation Tools