
 Submit a Paper
 Propose a Special lssue
 Open Access
ARTICLE
Digital Twin-Driven Modeling and Application of High-Temperature Biaxial Materials Testing Apparatus
School of Mechanical and Aerospace Engineering, Jilin University, Changchun, 130025, China
* Corresponding Author: Liming Zhou. Email:
Computers, Materials & Continua 2025, 82(3), 4137-4159. https://doi.org/10.32604/cmc.2025.060194
Received 26 October 2024; Accepted 10 January 2025; Issue published 06 March 2025
 View Full Text
 Download PDF
Abstract
The High-Temperature Biaxial Testing Apparatus (HTBTA) is a critical tool for studying the damage and failure mechanisms of heat-resistant composite materials under extreme conditions. However, existing methods for managing and monitoring such apparatus face challenges, including limited real-time modeling capabilities, inadequate integration of multi-source data, and inefficiencies in human-machine interaction. To address these gaps, this study proposes a novel digital twin-driven framework for HTBTA, encompassing the design, validation, operation, and maintenance phases. By integrating advanced modeling techniques, such as finite element analysis and Long Short-Term Memory (LSTM) networks, the digital twin enables high-fidelity simulation, real-time predictive modeling, and robust remote monitoring of HTBTA. The research contributes to bridging the knowledge gap in applying digital twin technology to high-temperature multi-axial testing systems. Unlike existing solutions, the proposed approach achieves <2% synchronization error, real-time monitoring with <100 ms delay, and predictive accuracy for temperature distributions under extreme conditions up to 2500°C. The findings highlight the effectiveness of the digital twin in improving system reliability, enhancing interaction efficiency, and reducing maintenance costs. This study not only advances the application of digital twin technology in high-temperature material testing but also establishes a foundation for broader adoption in aerospace, automotive, and other industrial sectors. Future research directions include exploring non-proportional loading scenarios, expanding multi-environment simulations, and integrating in-situ observation techniques.Keywords
Abbreviations
| HTBTA | High-Temperature Biaxial Testing Apparatus |
Currently, with the rapid development of testing technology, information technology, and decision-making theory, materials testing apparatus are increasingly incorporating multi-load and multi-physical field coupling [1–3]. These advancements aim to accurately simulate special environments, which brings test conditions closer to actual working conditions. These developments create more realistic conditions, benefiting both theoretical research and performance testing [4,5].
As the core apparatus for testing the mechanical properties of thermal protection composite materials under extreme conditions, the High-Temperature Biaxial Testing Apparatus (HTBTA) integrates two key functions: high-temperature environment loading and synchronous biaxial stretching. It performs biaxial tensile and compressive tests under coupled force and heat, identifying nonlinear damage defects in composite materials. The HTBTA plays a crucial role in studying the service behavior of thermal protection composite materials, ensuring their performance throughout their lifecycle [6].
The HTBTA can reach a loading temperature of 2500°C and a force of 80 KN during testing. Therefore, stringent performance standards are required during the design and verification process. During operation and maintenance, issues such as unclear observations, ambiguous mechanisms, and uncertain states may arise. Constraints related to time, space, and execution costs make it challenging for conventional management methods to accurately monitor the current status and precisely reproduce the testing process. Solely relying on physical methods makes it difficult to visually monitor the apparatus. It is urgent to explore the operating status and changes of various modules using advanced digital technology [7].
In recent years, as complex electromechanical apparatus has become increasingly digitalized, the concept of the digital twin has gained attention [8]. Driven by data and models, digital twins offer high fidelity and virtual-real integration, making them widely used in simulating mechanical apparatus [9,10]. Digital twin enables the mapping of physical apparatus operations in virtual space across multiple scales and physical quantities [11]. Digital twin-driven design and manufacturing of high-end apparatus with intelligent monitoring is gradually becoming the focus of researchers’ attention [12].
Digital twin is a simulation process that integrates multiple physical quantities, disciplines, scales, and probabilities. It leverages physical entities, sensor data, operational status, and other data to model the characteristics, behaviors, and performance of these entities, reflecting their full lifecycle [13,14]. Scholars around the world have proposed their own digital twin modeling theories. Tao et al. [15–17] proposed a five-dimensional model: ‘physical entity, virtual entity, service, twin data, and connection.’ They further decomposed the virtual entity into geometric, physical, behavioral, and rule models. It was applied to the implementation architecture of complex electromechanical apparatus, improving the accuracy and effectiveness of health management and fault prediction of complex electromechanical apparatus. Aheleroff et al. [18] developed a digital twin reference architecture that includes intelligent scheduled maintenance, real-time monitoring, remote control, and predictive capabilities. Wu et al. [19] proposed an MCD architecture for digital twin-based systems that includes three phases: conceptual design, detailed design, and virtual verification. Zhidchenko et al. [20] proposed a microservices-based architecture that connects digital twins to actual devices through a data model that supports the creation and maintenance of digital twins by different constituents. Schleich et al. [21] proposed a comprehensive reference model based on the concept of Skin Model Shapes, which can be used for the implementation of digital twins in the design and manufacturing of physical products. Wang et al. [22] proposed a dynamic evolution architecture for black box device digital twins and designed an incremental external attention time convolutional network IExATCN for 3D device pose estimation. These studies demonstrate the wide-ranging applications of digital twin in mechanical engineering, providing strong theoretical support for its implementation.
In the research of digital twin modeling method for single apparatus, Luo et al. [23] established a digital twin model for CNC machine tools, including a multi-domain unified modeling method, a mapping strategy between the physical space and the digital space, and constructed a multi-domain unified DT descriptive model using Modelica modeling language. Lai et al. [24] proposed an enabling technique for Shape.
Performance Integrated Digital Twin (SPI-DT) and analyzes the structural performance of complex heavy apparatus using a cantilever crane as an example. Stegmaier et al. [25] proposed a digital twin simulation model for pneumatic vacuum injectors, using the Matlab Simscape system simulation environment to implement a simplified model concept and validate it in experimental test setups and typical industrial applications. Venturini et al. [26] proposed a digital twinning method for automotive steel wheels based on the FE model to simulate the dynamic behavior of tires and rims by means of finite element analysis techniques. In addition, in terms of interactive applications after digital twin modeling, Zhu et al. [27] used the Unity3D platform to construct the digital twin of the robot, achieving synchronization and interaction between physical and virtual entities. Cichon et al. [28] proposed surveillance and control robotic systems through digital twins and applies them to scenarios such as remote disaster relief assistance. Fonseca et al. [29] used web technology to build a twin model of an equal-scaled ship and maps the data in real time.
The above literature provides the theoretical foundation and technical experience for applying digital twin technology to apparatus. However, current efforts primarily focus on geometric modeling combined with data acquisition for remote monitoring, and research on applying digital twin technology to materials testing apparatus remains limited. Thus, implementing digital twin modeling and remote monitoring for the entire lifecycle of HTBTA is an urgent challenge. To address these issues, this study proposes a digital twin architecture for HTBTA. It establishes a digital twin model for the design, validation, operation, and maintenance phases of the apparatus. This model fully transfers the physical apparatus into the digital world and enables the construction of a remote monitoring platform based on data acquisition and transmission technology. The main contributions of this paper as follows:
(1) The digital twin architecture for HTBTA is designed, comprising physical apparatus, digital apparatus, software services, twin data, and connectivity interactions.
(2) The digital twin for HTBTA is constructed, integrating spatial-temporal relationships, physical properties, behavioral logic, and implicit rules of the apparatus data model.
(3) The remote monitoring platform for HTBTA was developed and experimentally verified, demonstrating the effectiveness of this study.
The remainder of this paper is organized as follows. Section 2 describes the digital twin architecture for HTBTA. Section 3 describes the digital twin modeling process. Section 4 carries out the construction for the remote monitoring platform. Finally, Section 5 concludes the paper.
2 Digital Twin Architecture Design for HTBTA
2.1 Five-Dimensional Modeling Architecture for HTBTA
This study used the five dimensional modeling architecture of digital twins to construct HTBTA digital twins. The digital twin application is divided into five dimensions [16], including the physical entity of the test apparatus, the virtual entity built, the realized software services, the twin data, and the interactive connection, as shown in Fig. 1.
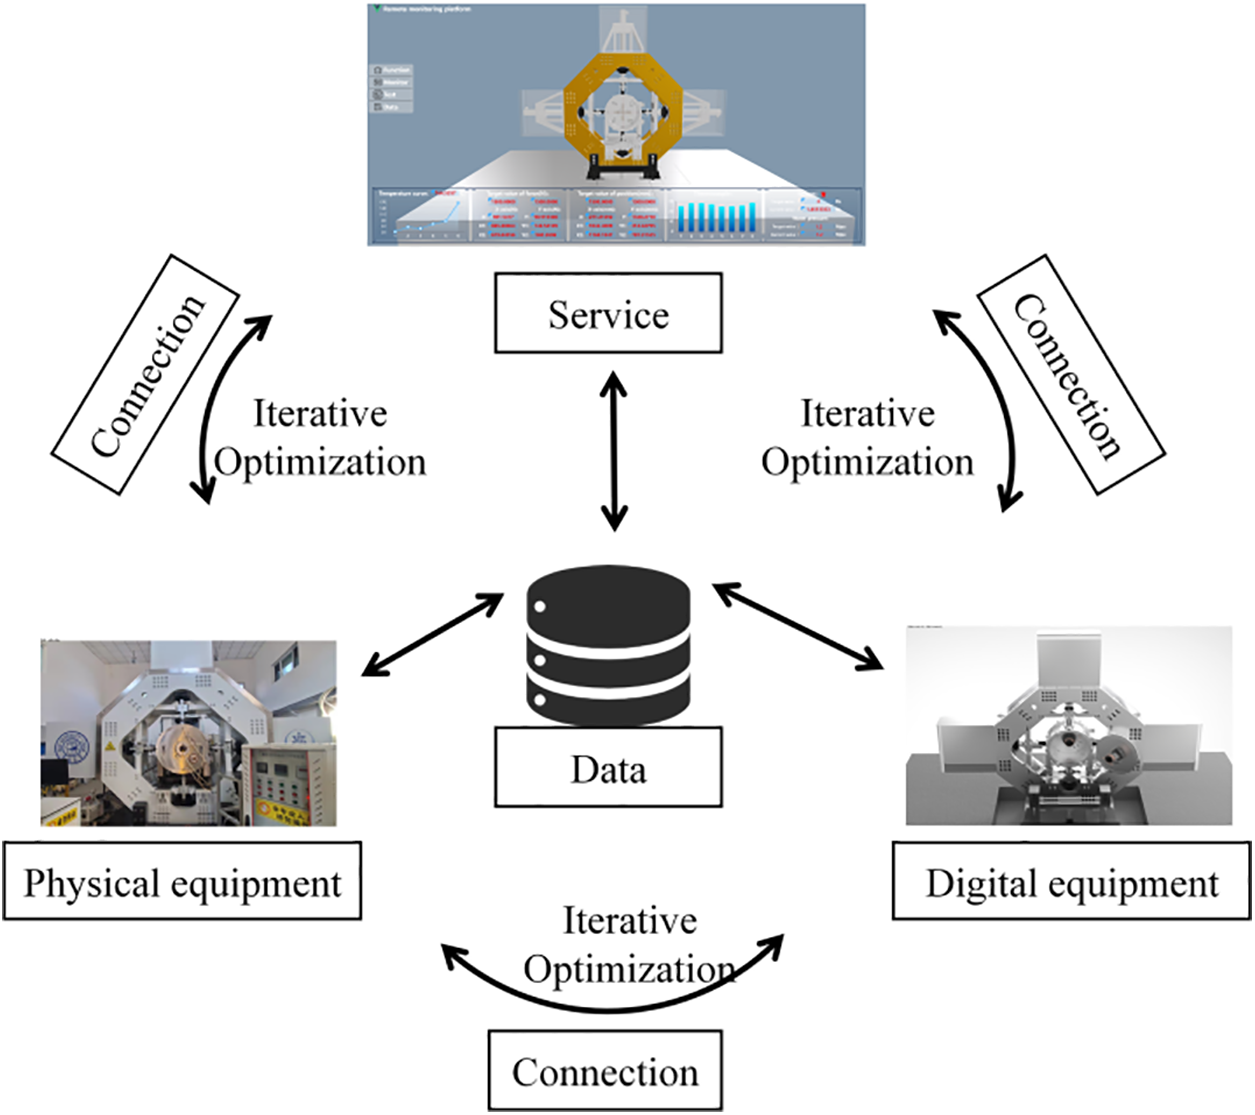
Figure 1: Five-dimensional modeling architecture of HTBTA
The physical apparatus, located in physical space, serves as the foundation for building a digital twin. The digital apparatus is the core of digital twin technology. It must fully replicate the physical apparatus’s working conditions, functions, and human interactions in digital space. Twin data drives the digital apparatus, with all behaviors relying on data to evolve. Software services act as the module for human-computer interaction and function realization, embodying the essence of digital twin technology. They integrate the four dimensions—physical apparatus, digital apparatus, twin data, and connection interaction—to meet the apparatus’s personalized functional requirements. Connection interaction acts as a communication bridge, transmitting twin data across dimensions. It encompasses protocols, interfaces, network environments, data acquisition tools, storage, and other transmission technologies.
2.2 Digital Twin Architecture Design for HTBTA
2.2.1 Physical Apparatus of HTBTA
The physical apparatus used in this study is the high-temperature biaxial test apparatus shown in Fig. 2. The design specifications require high-temperature loading in a vacuum state above 2500°C. It can support complex static and dynamic mechanical loading modes, including stretching–stretching, stretching–compression, and compression–compression. These loads operate at 0–10 Hz with a maximum force of 80 kN. The load synchronization error across multiple axes must be less than 2%, and all components must maintain structural safety and reliability.
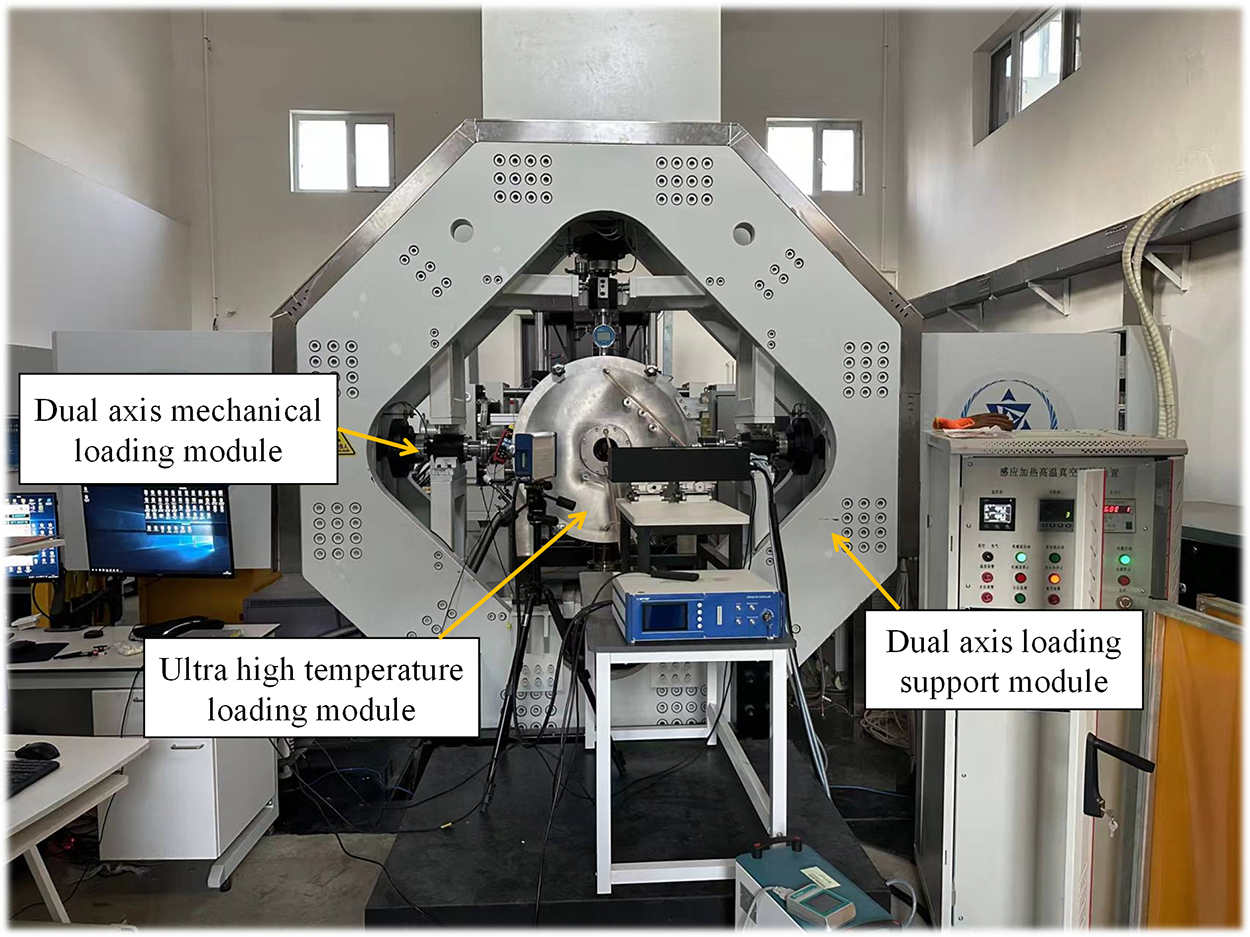
Figure 2: Overall view of HTBTA
2.2.2 Digital Apparatus of HTBTA
The digital apparatus of HTBTA comprises four types of models: geometric, physical, behavioral, and rule models. These high-fidelity, fully mapped digital representations correspond to the physical apparatus.
These four types of models are applied at different phases: design, validation, operation, and maintenance. Each model plays a specific role in enabling real-time linkage and dynamic evolution between the physical apparatus and its twin model, as shown in Fig. 3. The geometric model forms the basis of three-dimensional real-time monitoring of HTBTA and is primarily used in the design phase. It portrays the spatial and temporal geometric relationships of the physical apparatus. The fidelity and accuracy of the geometric model directly impact the immersion and precision of real-time monitoring, ensuring spatial and temporal consistency with the physical apparatus. The physical model accurately describes the physical properties of the apparatus and simulates corresponding physical effects. It is mainly used in the design and validation stages. This model is often expressed mathematically, such as stress distribution, electromagnetic field coupling strength, or temperature fields. These properties can be verified using finite element analysis. The behavioral model describes the apparatus’s behavioral logic and response mechanisms during operation, accounting for external disturbances and internal signal inputs. It ensures the functional operation of the apparatus and is mainly applied in the design and operation phases. The rule model is used in the operation and maintenance phases by mining data generated during operation to uncover implicit rules and patterns, which helps users better understand and monitor the apparatus’s behavior.
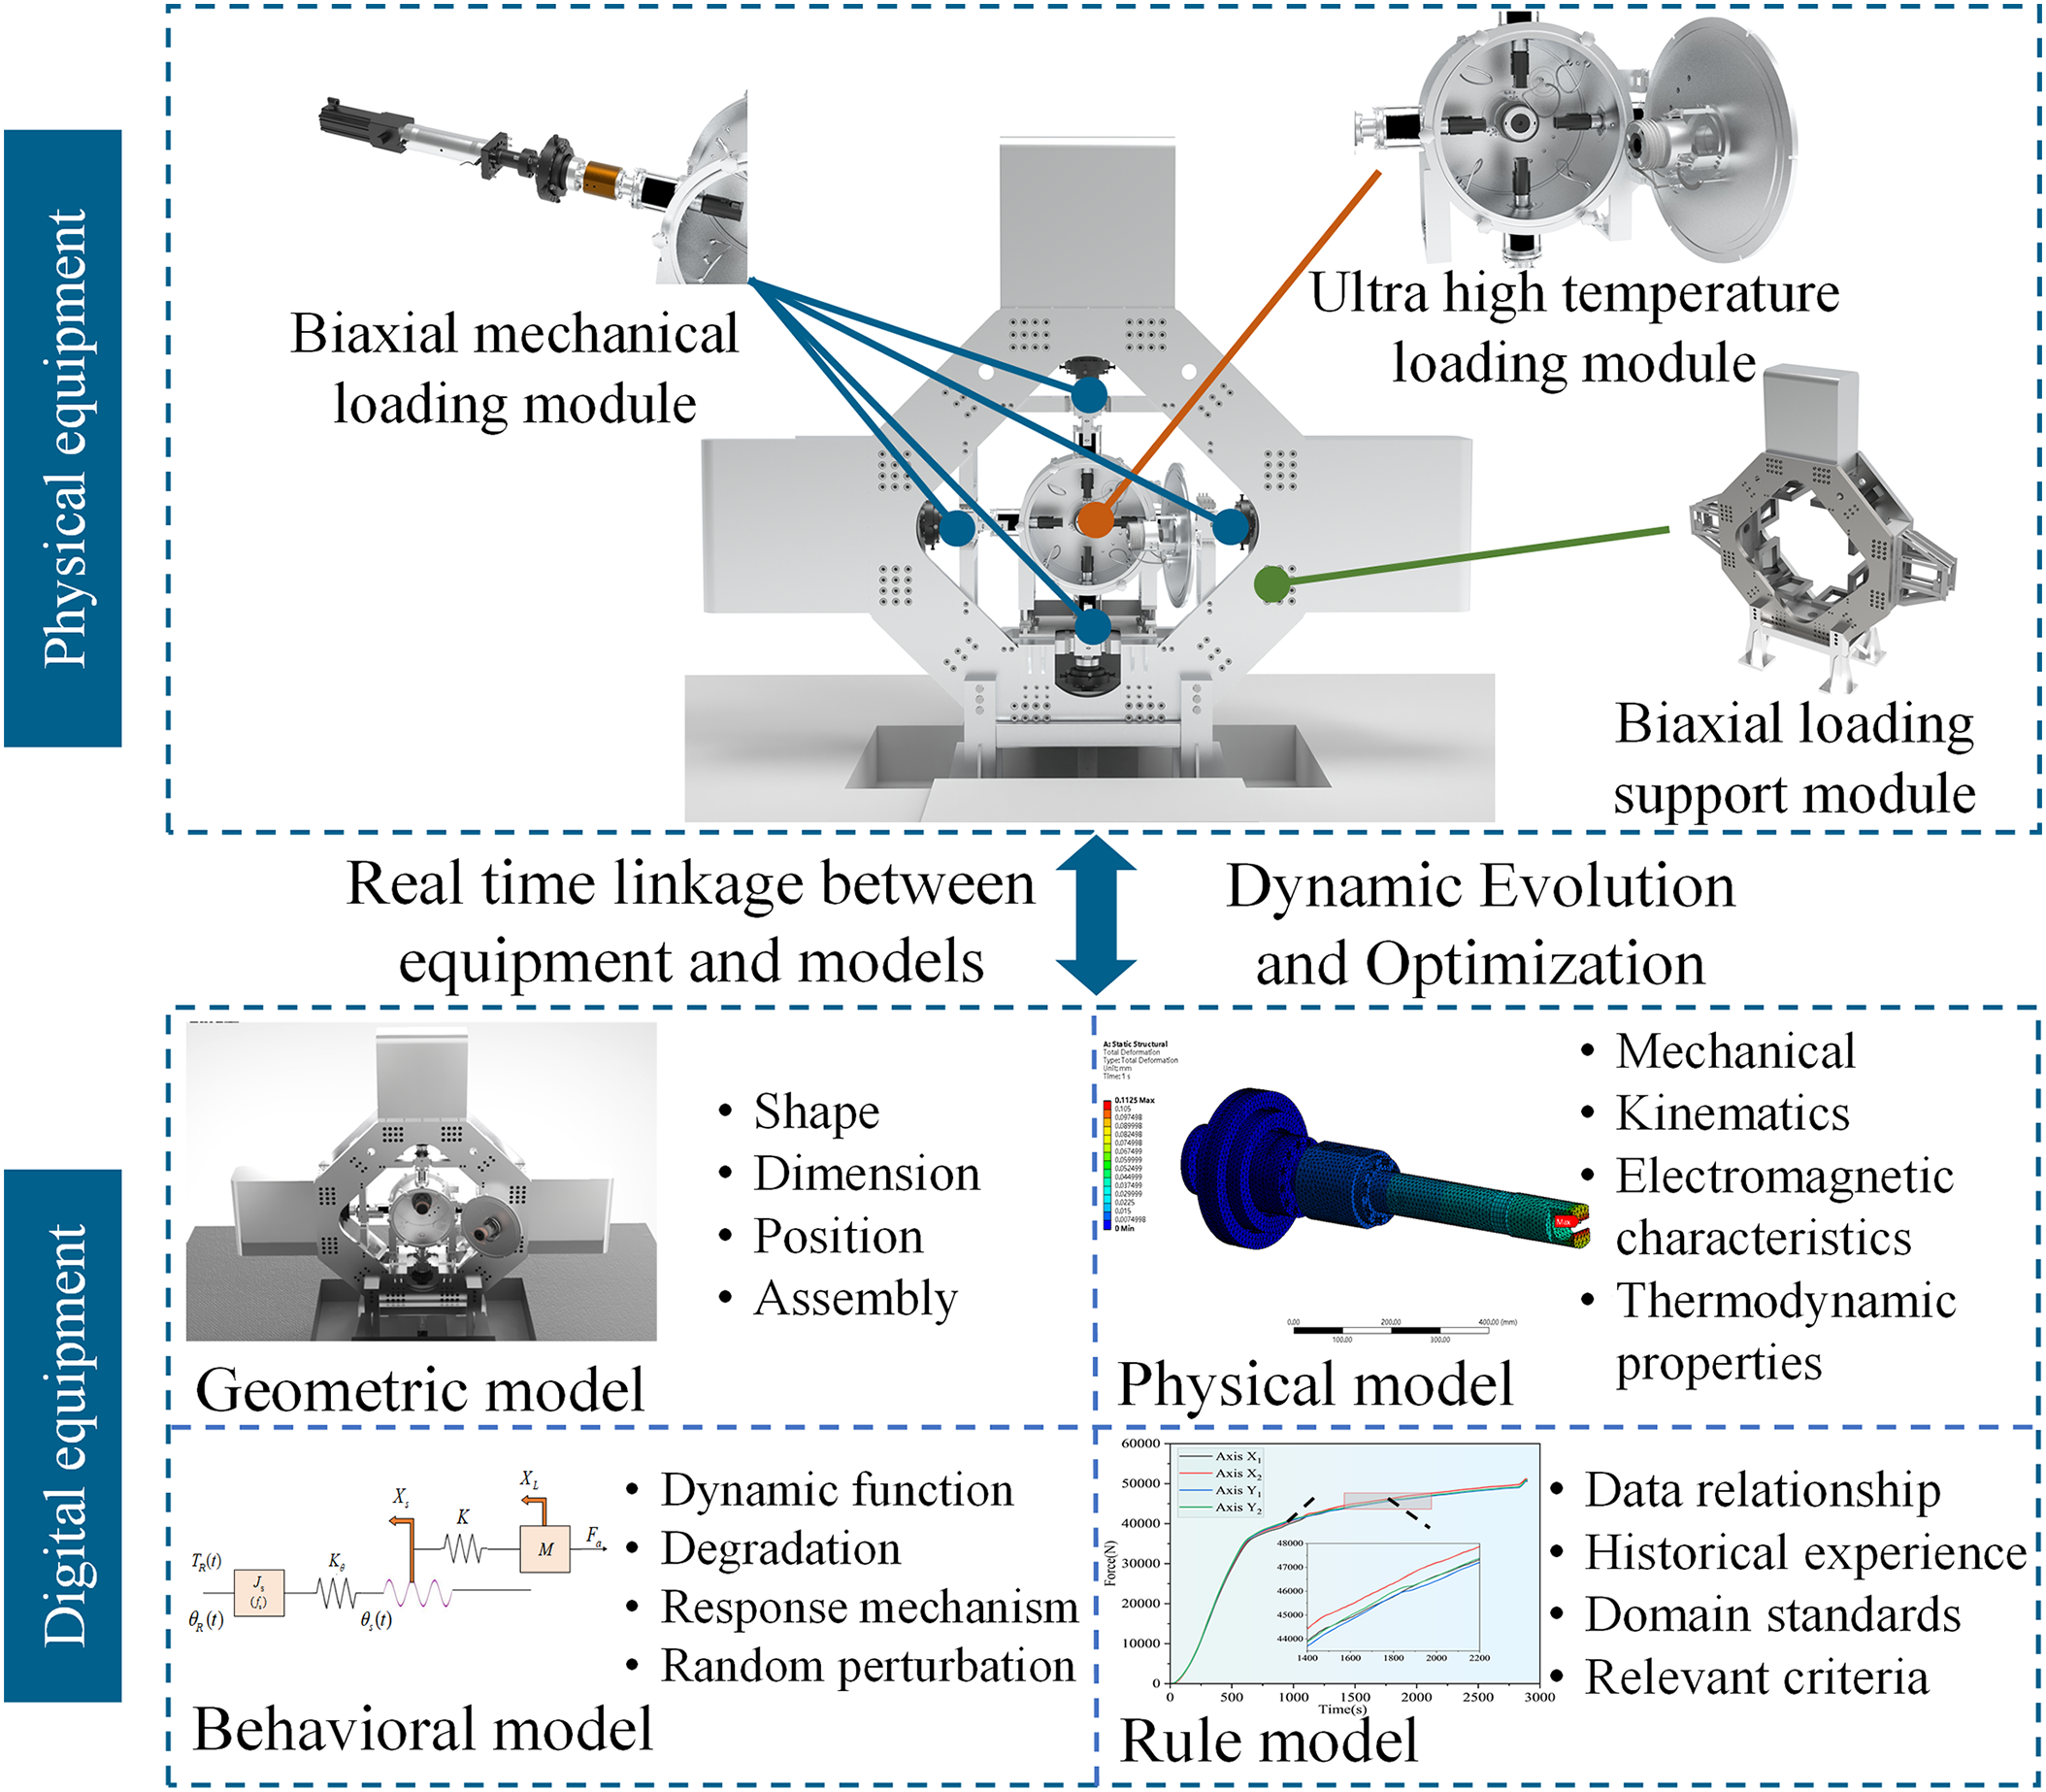
Figure 3: Digital apparatus four-dimensional model of HTBTA
HTBTA has two main sources of data: operational state data generated during testing and recorded material testing data. To support the evolution of the digital twin model, it is essential to fuse and utilize the heterogeneous data generated. This integration enables the digital twin apparatus to perform its service functions through various connection and interaction tools. The twin data of HTBTA as shown in Fig. 4.
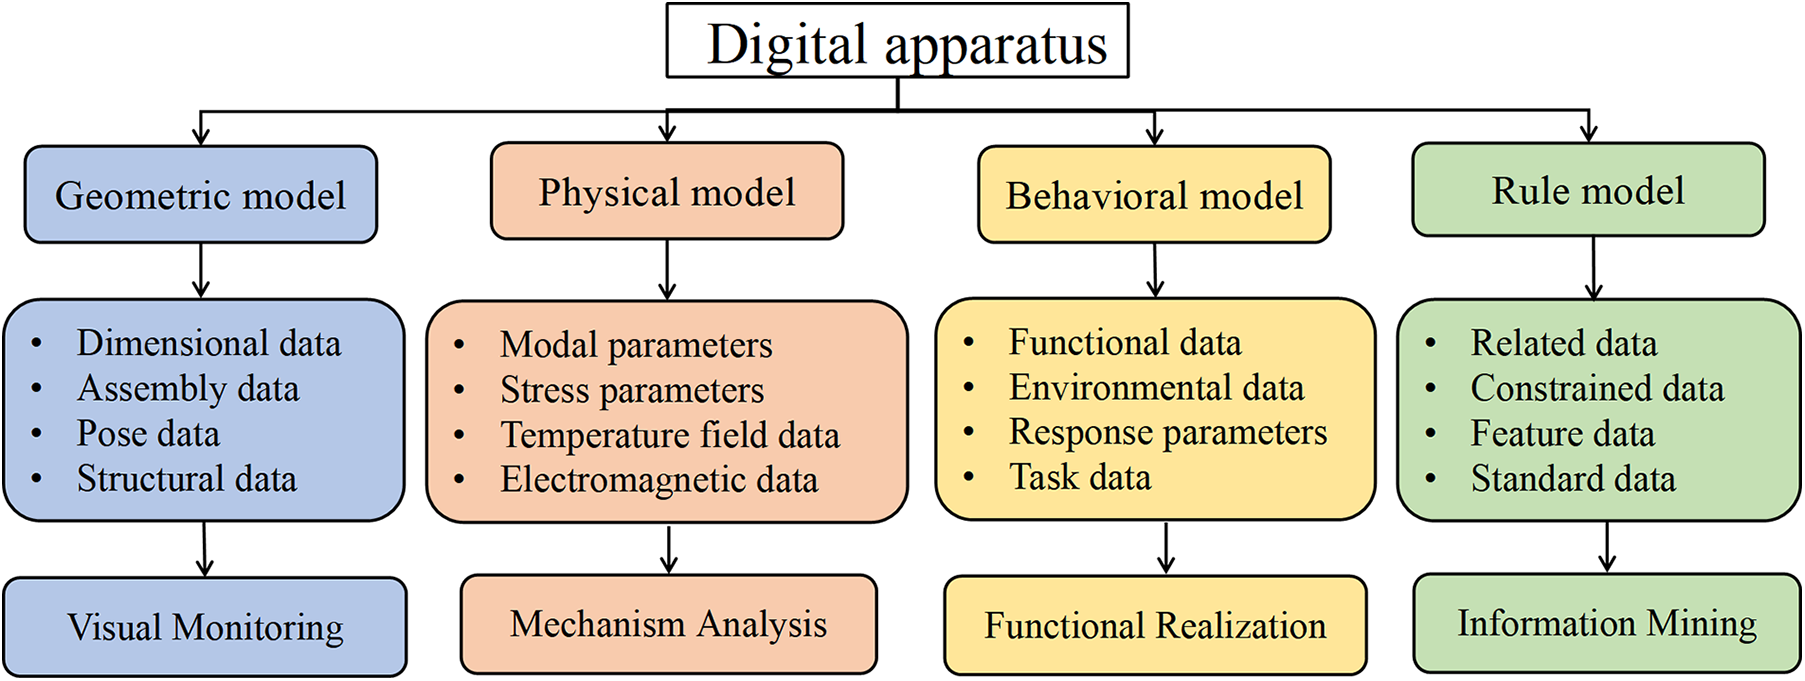
Figure 4: Twin data of HTBTA
This includes data collection and transmission apparatus, communication protocols, transmission interfaces, and the network environment, as shown in Fig. 5. Once HTBTA generates real-time data, it must be connected to the digital apparatus to provide real-time data support. This connection enhances the efficiency of the service layer, improves human-machine interaction capabilities, and elevates remote monitoring levels.
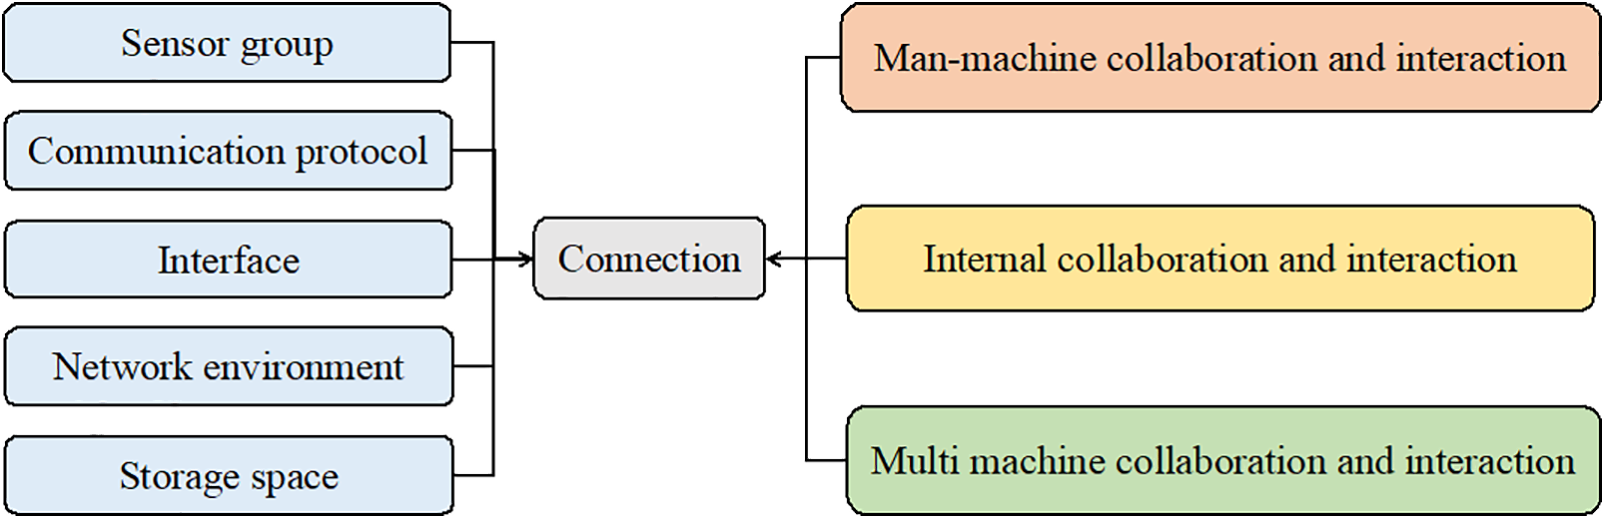
Figure 5: Connection of HTBTA
In response to the requirements of HTBTA, after constructing the digital twin model of the experimental apparatus, it is necessary to build a monitoring platform to remote monitor its operating status, create a three-dimensional visualization model, and achieve real-time mapping with the physical apparatus, so that the digital twin apparatus has a high real-time, high availability, and high interactivity service platform.
2.3 Design of Remote Monitoring Platform
The remote monitoring platform of HTBTA is designed with a three-layer architecture. The bottom-up sequence is as follows: the physical layer consists of various types of underlying data acquisition apparatus; the network layer, represented by the server, is responsible for data storage; and the application layer is the remote monitoring platform that provides functional displays, as shown in Fig. 6.
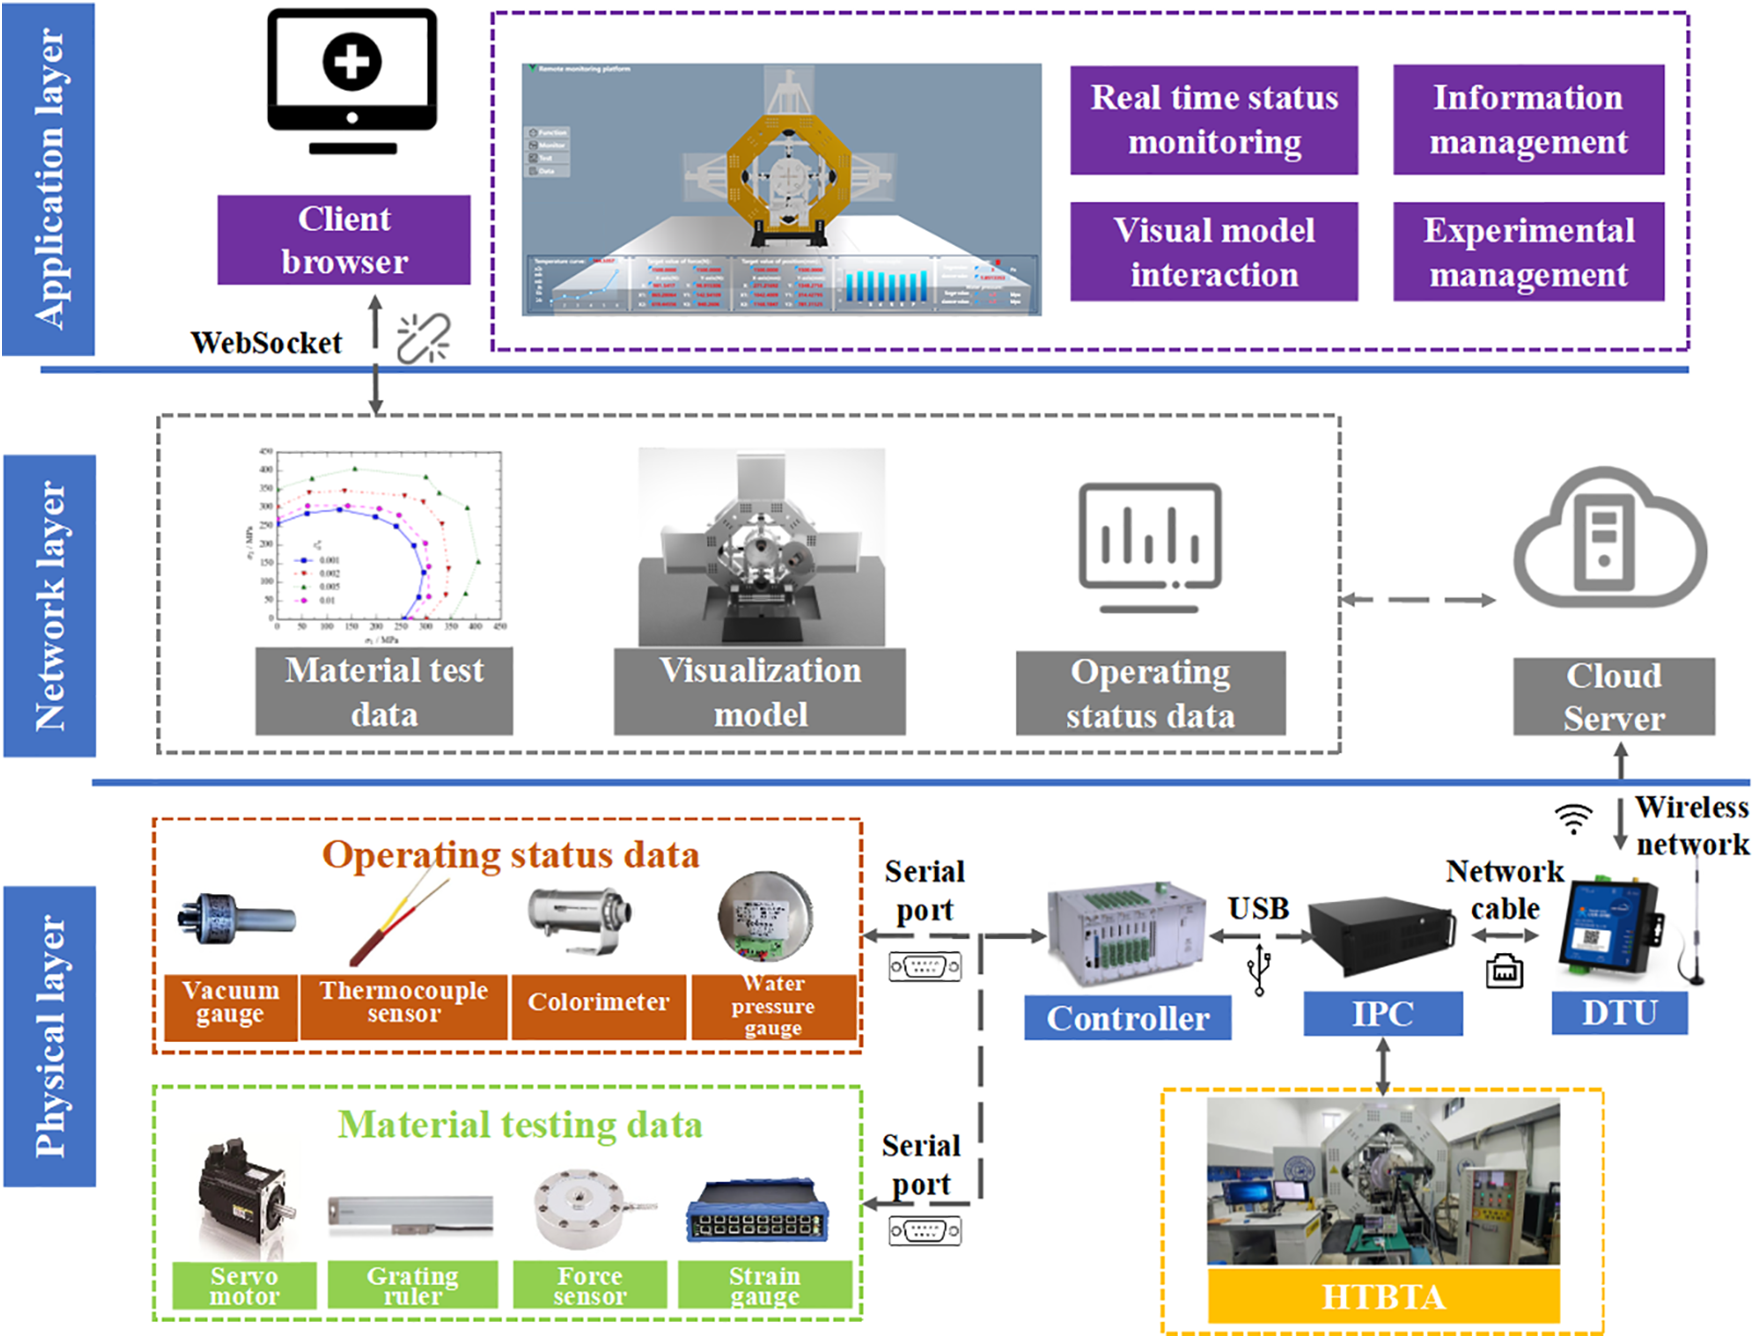
Figure 6: Remote monitoring platform of HTBTA
The physical layer serves as the foundational data provision layer, enabling interoperability and interconnection between the test apparatus and the intelligent monitoring platform. The physical layer includes several entities: the body of the test apparatus for real-time monitoring, various sensors, control devices, and data acquisition terminals. Through hardware connections and software debugging, these components extract and transmit necessary operational status data and material testing data. The collected data signals are compiled and converted into a unified format to facilitate storage and access in the next layer.
The network layer acts as an intermediary, connecting the physical layer below and the application layer above. It encompasses methods for data transmission and storage, and is also tailored to meet the actual needs for data analysis and processing. Data transmission is primarily conducted through a Data Transfer Unit (DTU) configured with the industrial control machine. This setup allows for remote uploading of data to the cloud, where it is stored on a cloud server. Subsequently, the browser connects to the server via WebSocket, enabling real-time access to data on the monitoring platform, thereby facilitating processing in the next layer.
The application layer directly interfaces with users, providing essential services. It is primarily responsible for the realization and interaction of platform functions, including the visualization of real-time monitoring status of test apparatus. This is achieved through the integration of various functional modules within the application layer, enhancing both informatization and visualization.
After optimizing the component selection and size of HTBTA during the design phase, the following modules were identified:
3.1.1 Biaxial Mechanical Loading Module
This module is responsible for applying tensile force and measuring the displacement of the tested specimen to calculate its mechanical performance parameters and failure information. It consists of two loading spindles positioned opposite each other in the transverse and longitudinal directions, arranged in a cross shape. The cross-shaped specimen is fixed at the center for testing.
3.1.2 High-Temperature Loading Module
This module applies high-temperature loading to the center of the tested part, simulating the operational environment of heat-resistant composites. The module comprises an induction heating coil, graphite heating element, thermostat, high-temperature colorimeter, thermocouple sensor, and temperature acquisition card, which facilitate temperature loading and control within the high-temperature furnace.
3.1.3 Biaxial Loading Support Module
This module provides support and stability for the entire test apparatus. It features support legs fixed to the ground, support blocks, and a spindle support frame to stabilize the biaxial loading module, preventing radial jitter during loading that could interfere with test results. The support plate, eight support frames, and four outer shells collectively ensure structural integrity and external protection for the biaxial loading module. The three modules of HTBTA were assembled and rendered to obtain the geometric models shown in Fig. 7.
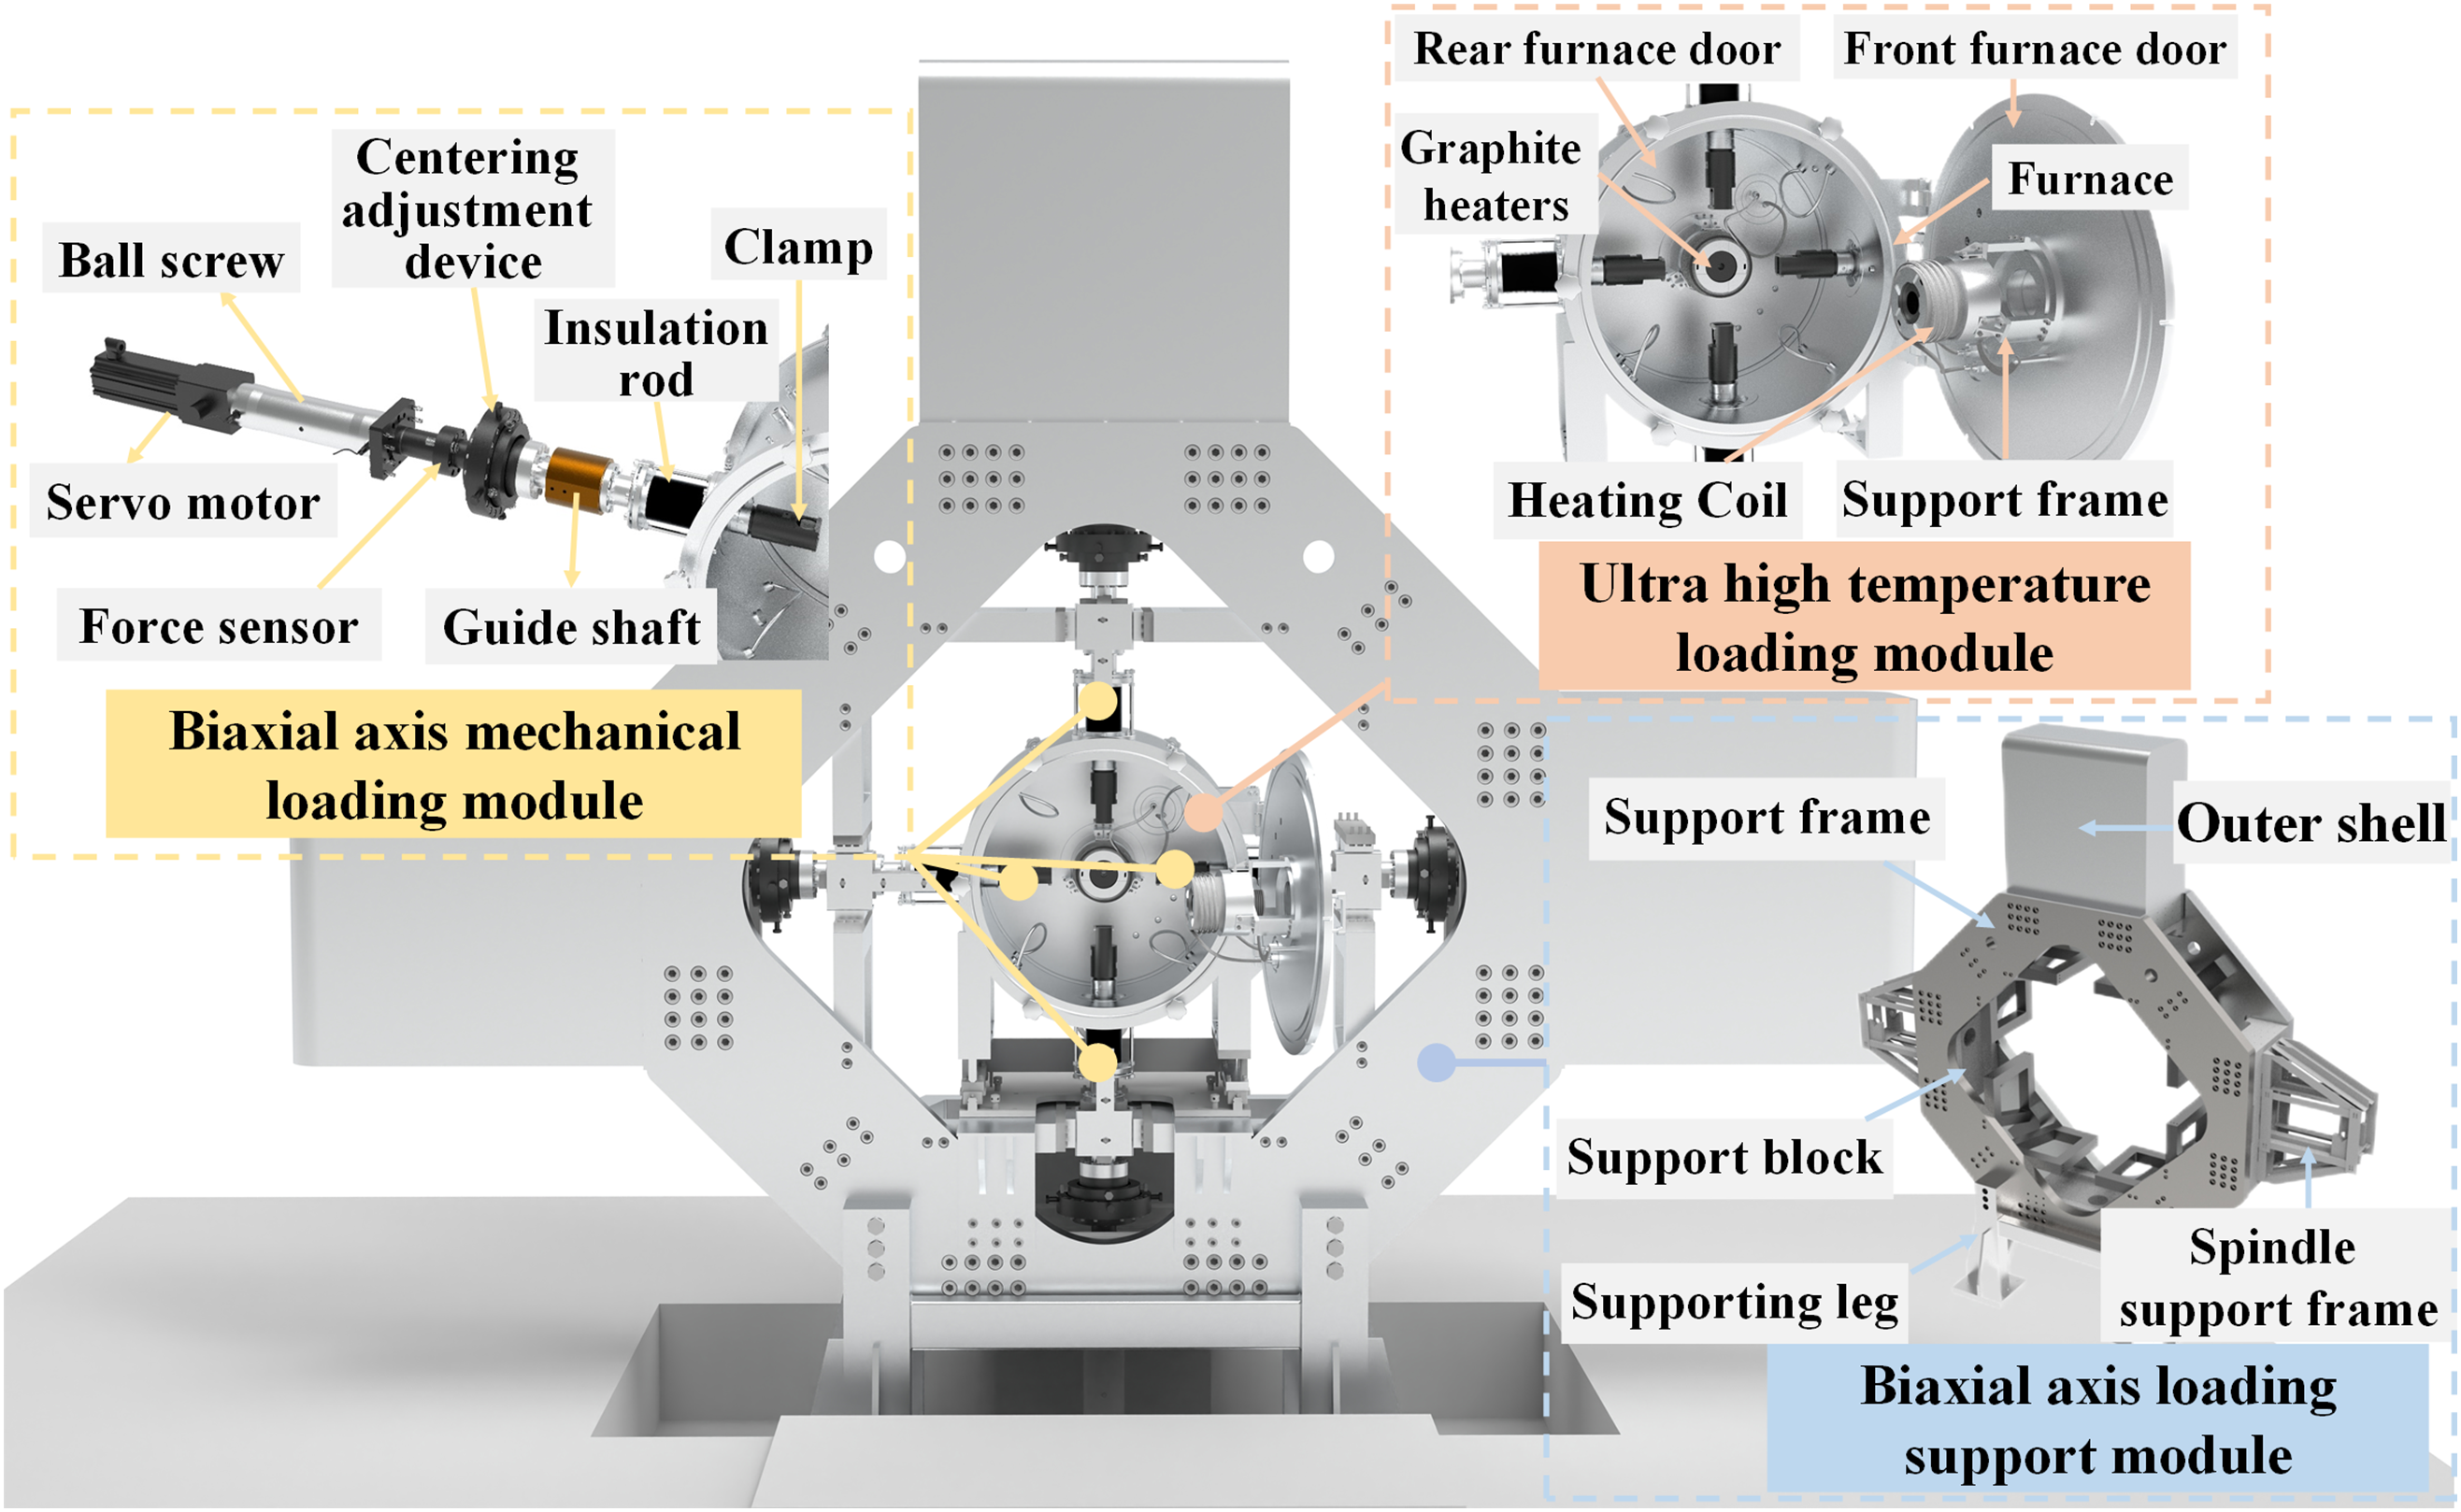
Figure 7: Geometric models of HTBTA
To ensure the reliability of the fixture, a static analysis of the mechanical loading spindle was conducted using ANSYS software.
The mechanical loading spindle is meshed with 40Cr structural steel, which has a tensile strength of 810 MPa, a yield strength of 785 MPa and an elongation of 9%. Based on the maximum force value of 80 kN under test conditions as the input, and using the servo motor and electric cylinder end as constraint boundaries for calculation, the stress and displacement cloud maps of the mechanical loading spindle are obtained as shown in Fig. 8. The stress distribution of the loading spindle is primarily concentrated at the fixture end, with a maximum stress of 100.79 MPa. This value is lower than both the tensile and yield strengths of the material. The maximum deformation measured is 0.11 mm, which exerts minimal influence on the testing process.
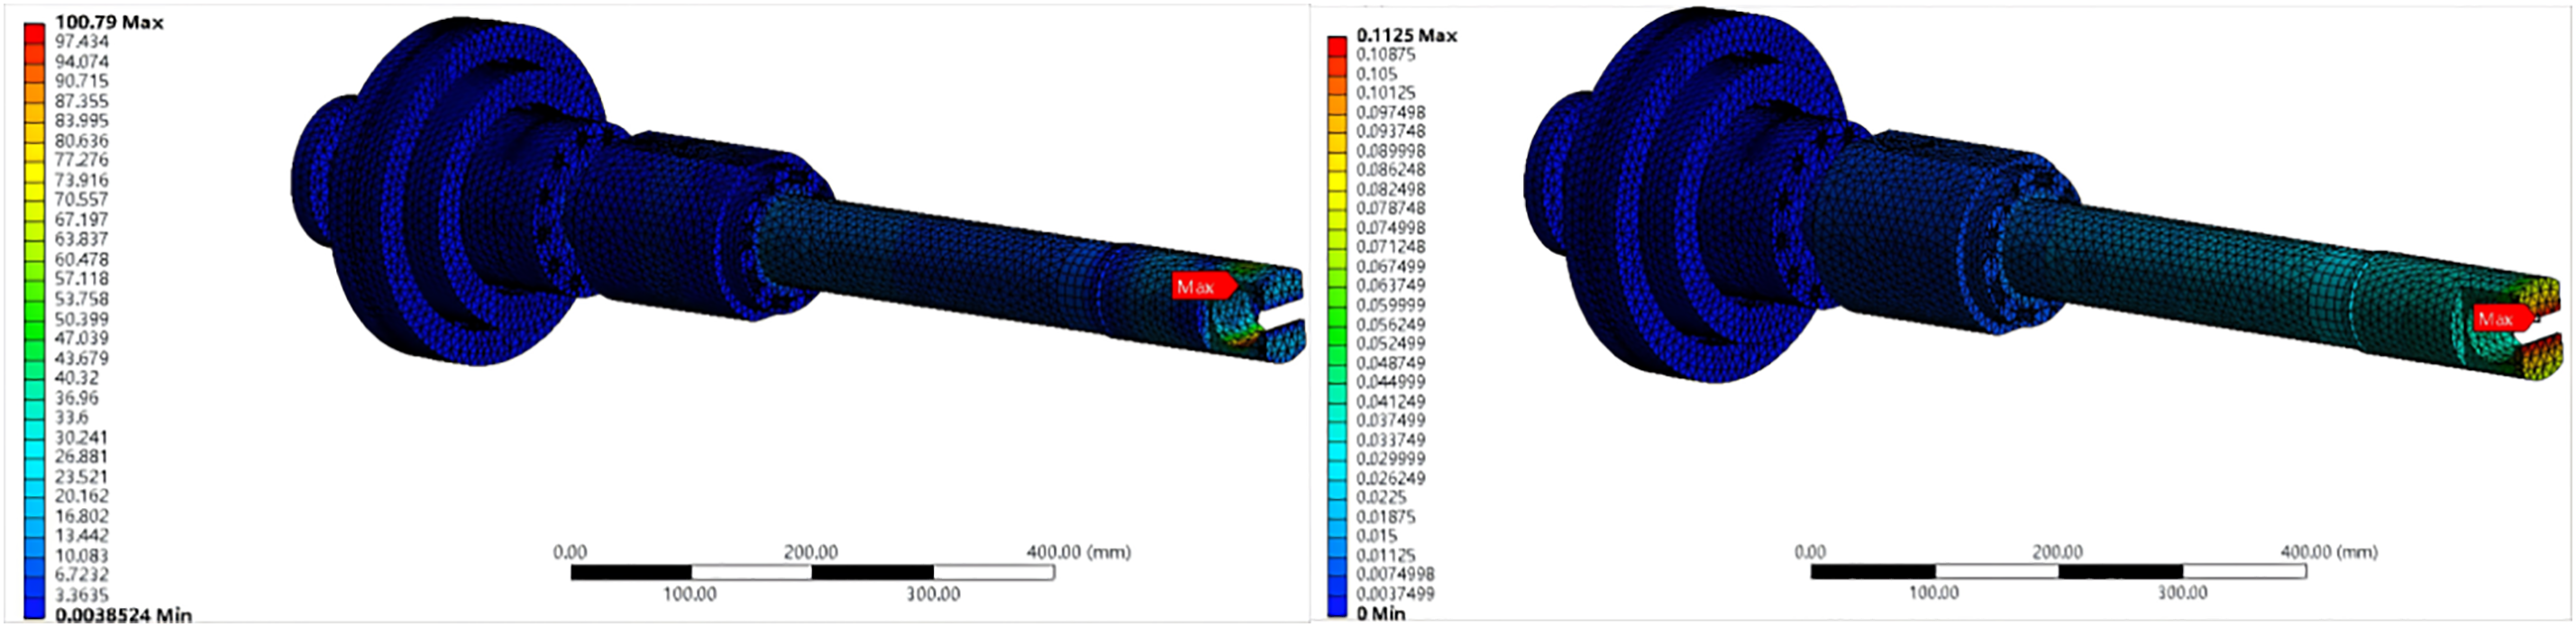
Figure 8: (a) Stress distribution cloud map (b) Displacement cloud map
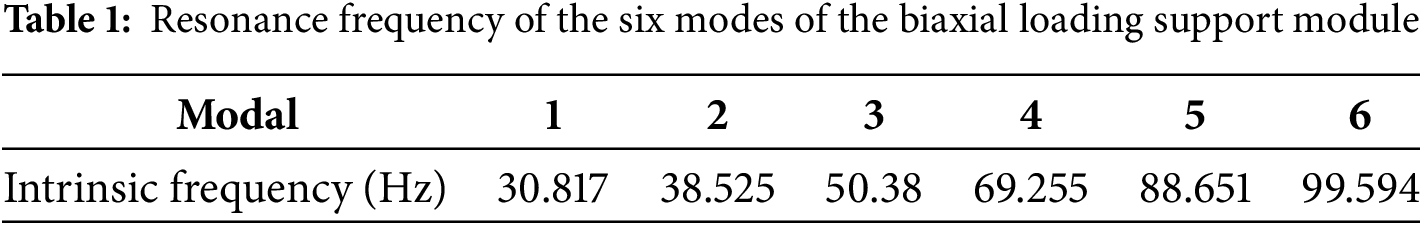
Modal analysis was conducted on the biaxial loading support module using ANSYS, with the corresponding vibration mode diagrams for the first six modes presented in Fig. 9. The natural frequencies for the first six modes during operation are summarized in Table 1. The resonance frequencies of the first six modes exceed the actual working frequency of 15 Hz, indicating that resonance will not occur and the test loading conditions are satisfied.
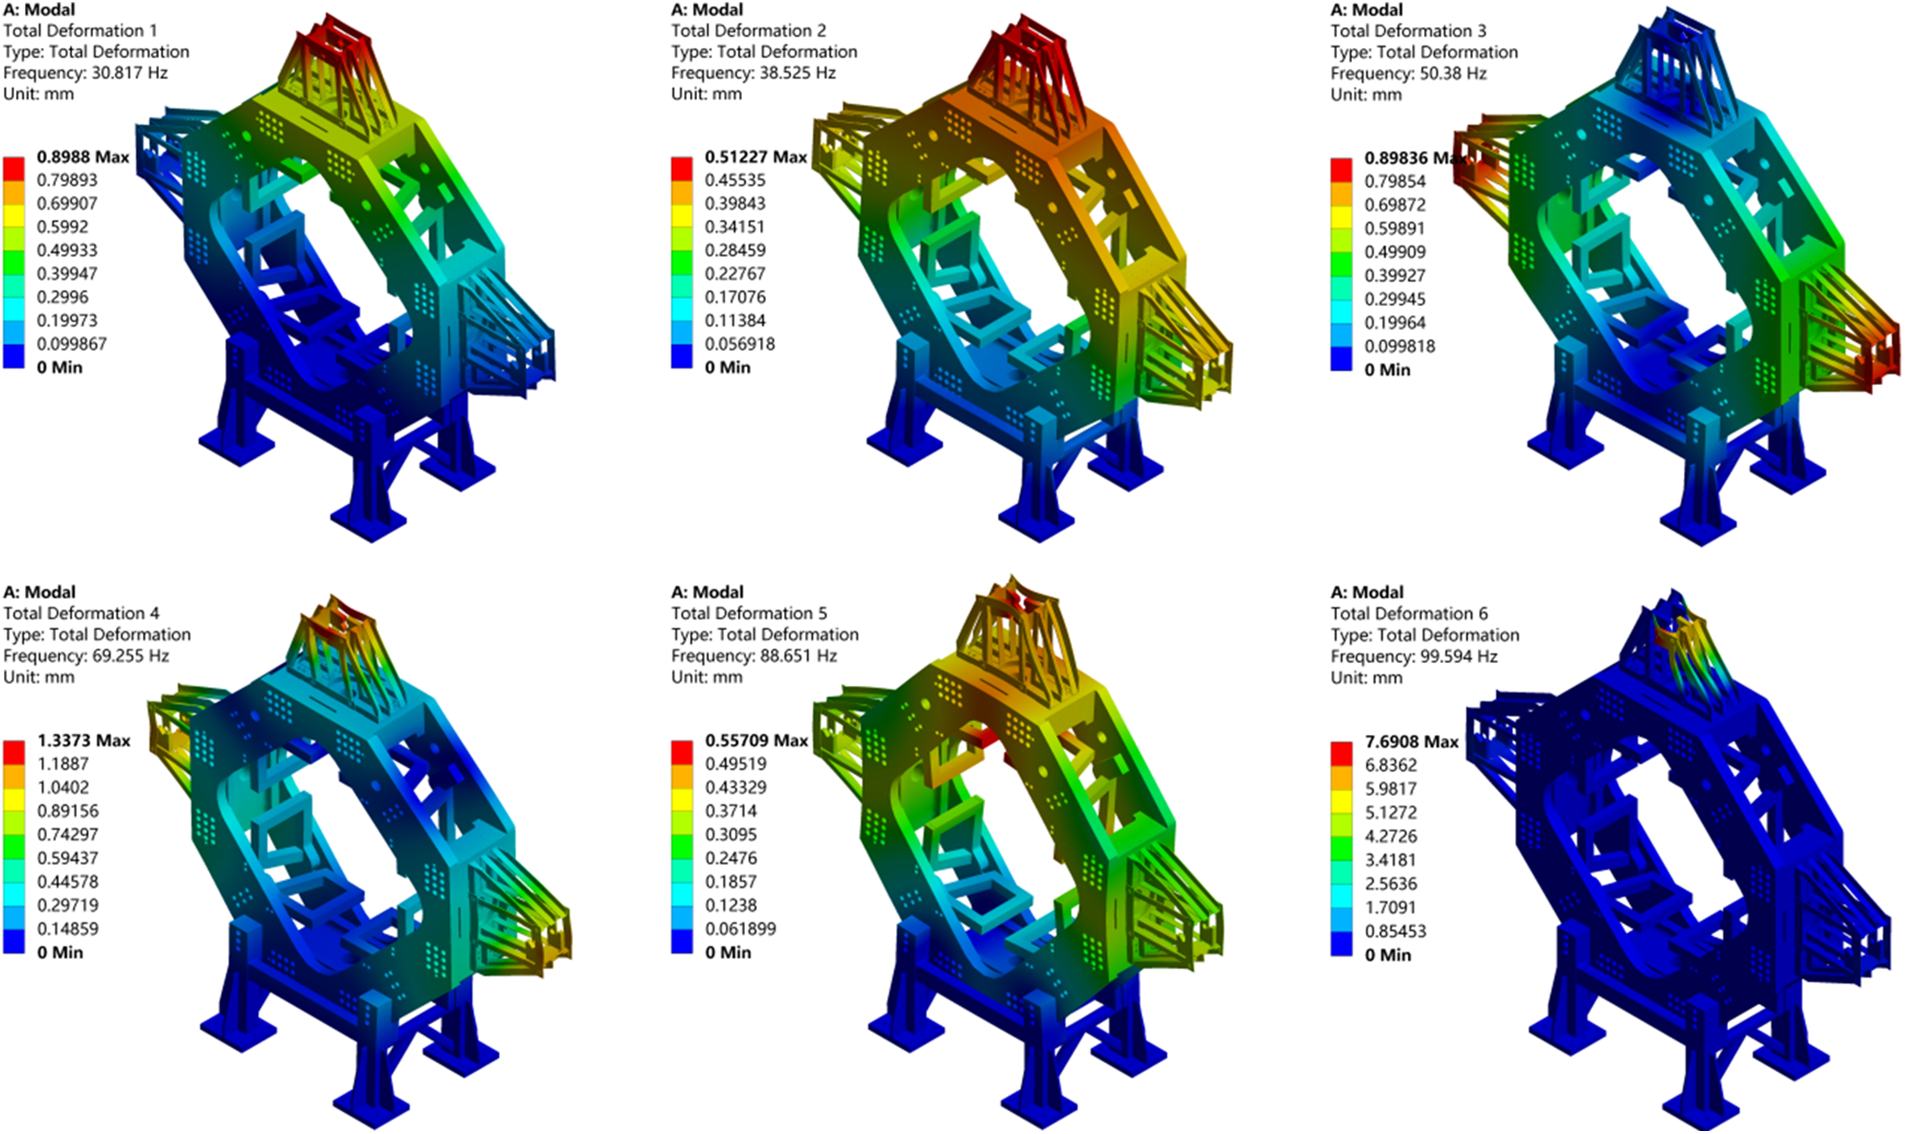
Figure 9: First six modal diagrams of the biaxial loading support module
3.2.3 Environmental Field Analysis
Fig. 10 shows the high-temperature loading module, which employs a medium-frequency induction heating power supply as its primary energy source. This power supply delivers alternating current of varying frequencies into the induction heating coil, generating an alternating magnetic field. Utilizing the principle of electromagnetic induction heating, this magnetic field produces induced eddy currents in the graphite heating body, enabling the induction heating.
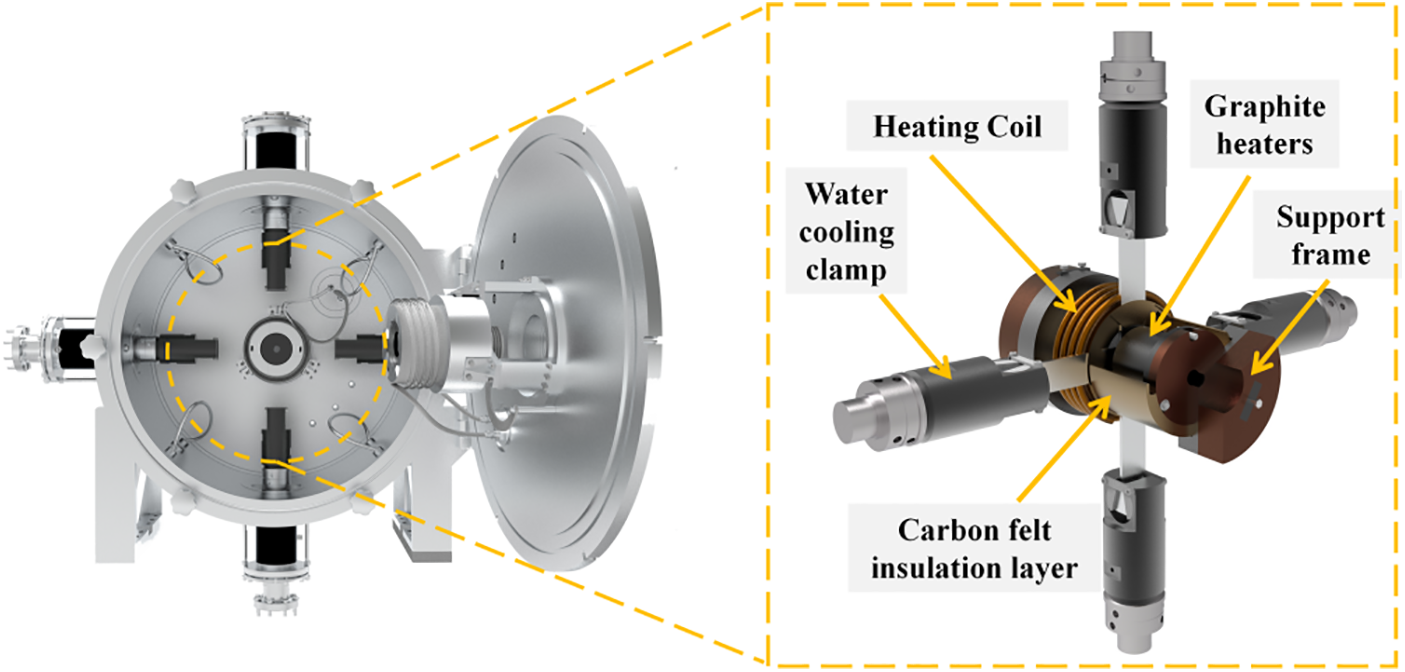
Figure 10: High temperature loading module
Heat transfer during the testing process comprises three main stages. First, the graphite heating body is inductively heated by medium-frequency induction heating coils positioned on both sides of the test specimen. The heat received by the graphite body is then uniformly transferred to its interior through solid heat conduction. Finally, the graphite heating body conducts thermal radiation heat transfer to the test specimen, ensuring that the central measurement area of the specimen reaches the required high temperature. The vacuum atmosphere minimizes the influence on temperature distribution and heat loss during the test.
To achieve accuracy and stability in loading temperature fields, numerical analysis and finite element simulation verification are required during the induction heating stage. The temperature distribution during the analysis will be evaluated, utilizing a four-turn induction coil for electromagnetic induction heating of the graphite heating element. A two-dimensional axisymmetric induction heating model will also be established for finite element research using COMSOL.
The high-temperature furnace has a diameter of 700 mm and a height of 800 mm. The heating elements on both sides of the specimen measure 80 mm in radius and 90 mm in height. The induced current is defined as 40 A, the initial temperature as 293 K, the frequency as 100 kHz, the temperature coefficient as 0.0039, the resistivity as 1.754, and the mass flow rate of cooling water as 0.0167. Assign corresponding materials to each component: the induction coil is set as a hollow copper tube with a diameter of 4 mm, the inner diameter of the tube is 2 mm and water is set, the central heating element and specimen are set as graphite, the insulation layer is set as FR-4 resin, and other spaces are set as vacuum domain; By establishing a coupling study of electromagnetic heat and surface to surface radiation heat transfer, the temperature field distribution of graphite heating can be obtained as shown in Fig. 11. The temperature of graphite heating can reach 2520°C, the temperature of the central specimen can reach 2500°C, and the temperature of the induction coil is 20°C, which meets the experimental loading conditions.
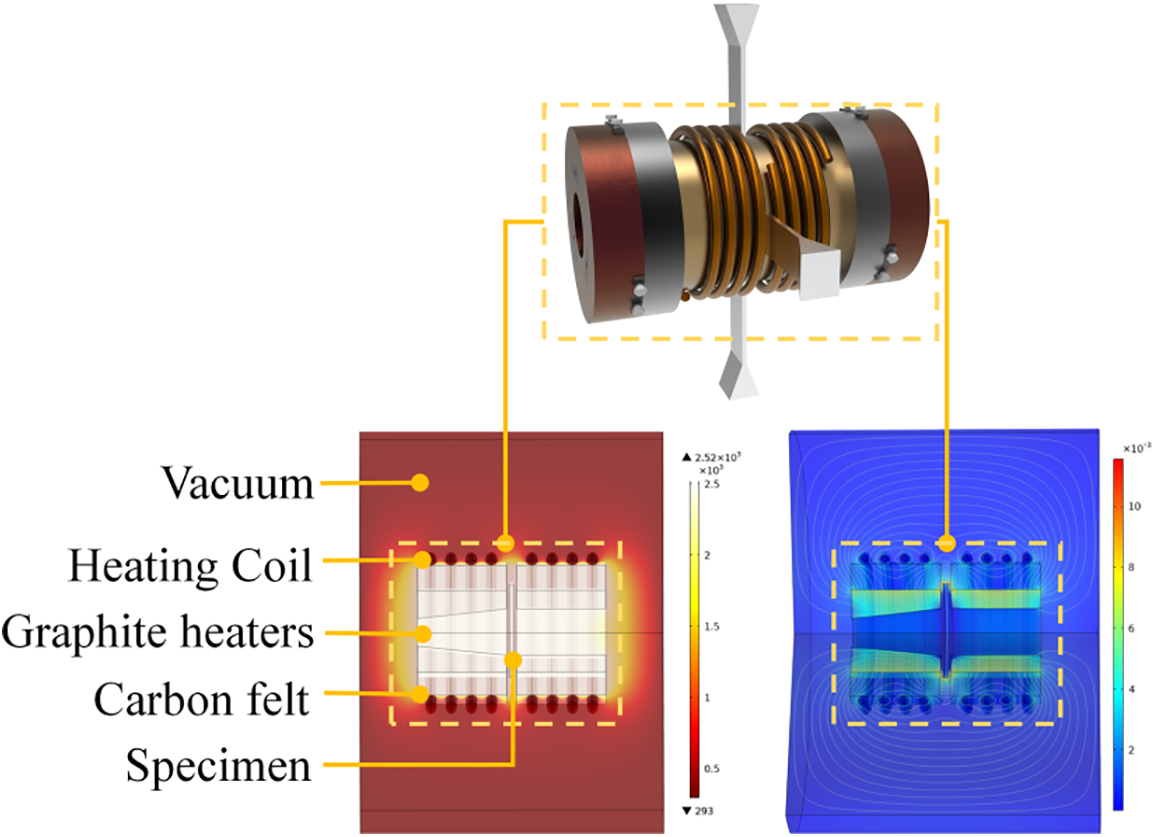
Figure 11: Cloud diagram of temperature field and magnetic field distribution of high temperature furnace
3.3.1 Biaxial Control Strategy
In a multi-axis synchronous control system, the control is composed of two components: synchronization and tracking. Synchronization control can result in synchronization errors, whereas tracking control can lead to tracking errors.
As shown in Fig. 12, for the synchronization control problem of high-temperature biaxial apparatus, the difference from traditional multi axis control is that during biaxial stretching, the
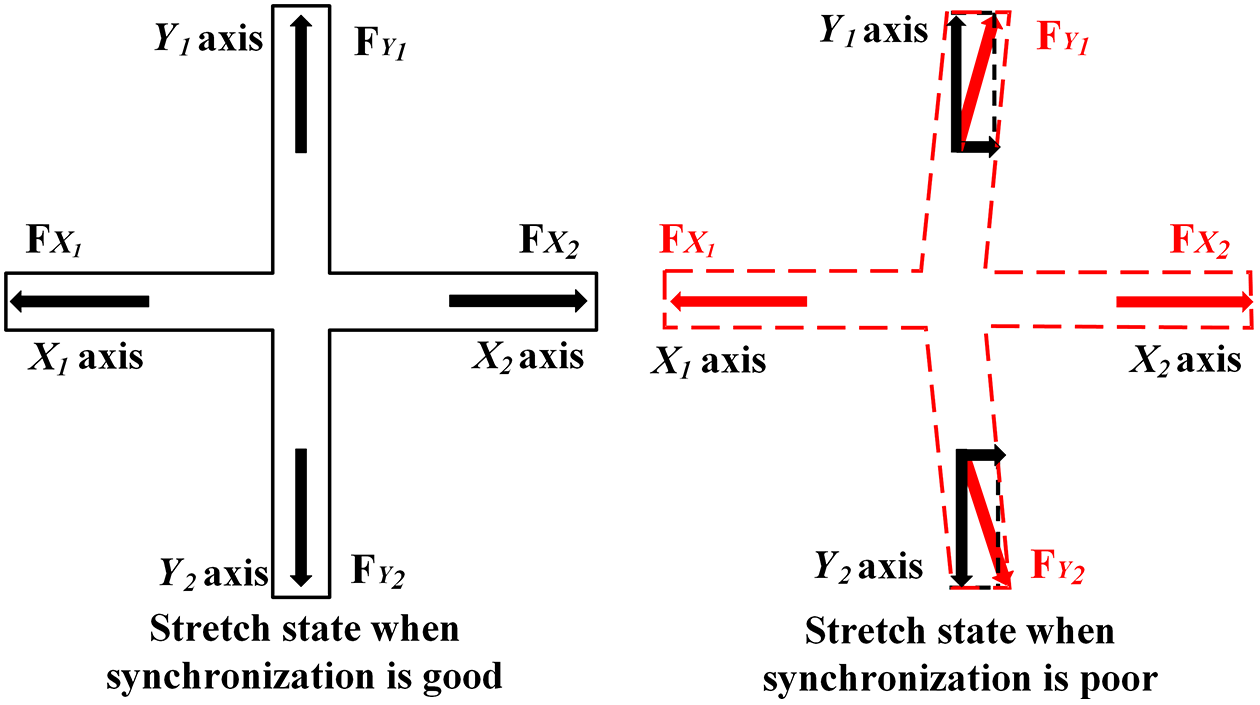
Figure 12: Biaxial specimen force analysis
The control process for the loading spindle motion begins with the industrial computer sending control instructions to the motion controller. The motion controller then executes closed-loop servo operations based on these instructions to facilitate spindle movement. During the movement of the electric cylinder, the grating ruler converts the position of the electric cylinder into pulses and feeds them back to the motion controller. The motion controller obtains the current position, calculates the pulse frequency to be sent, and sends it to the driver. Finally, the motion controller updates based on the feedback from the grating ruler and force sensor, thereby obtaining the real-time displacement and current force value of the spindle motion.
The biaxial experiment uses synchronized main end control for biaxial drive, the position controller uses fuzzy PID control, and its control block diagram is shown in Fig. 13, where
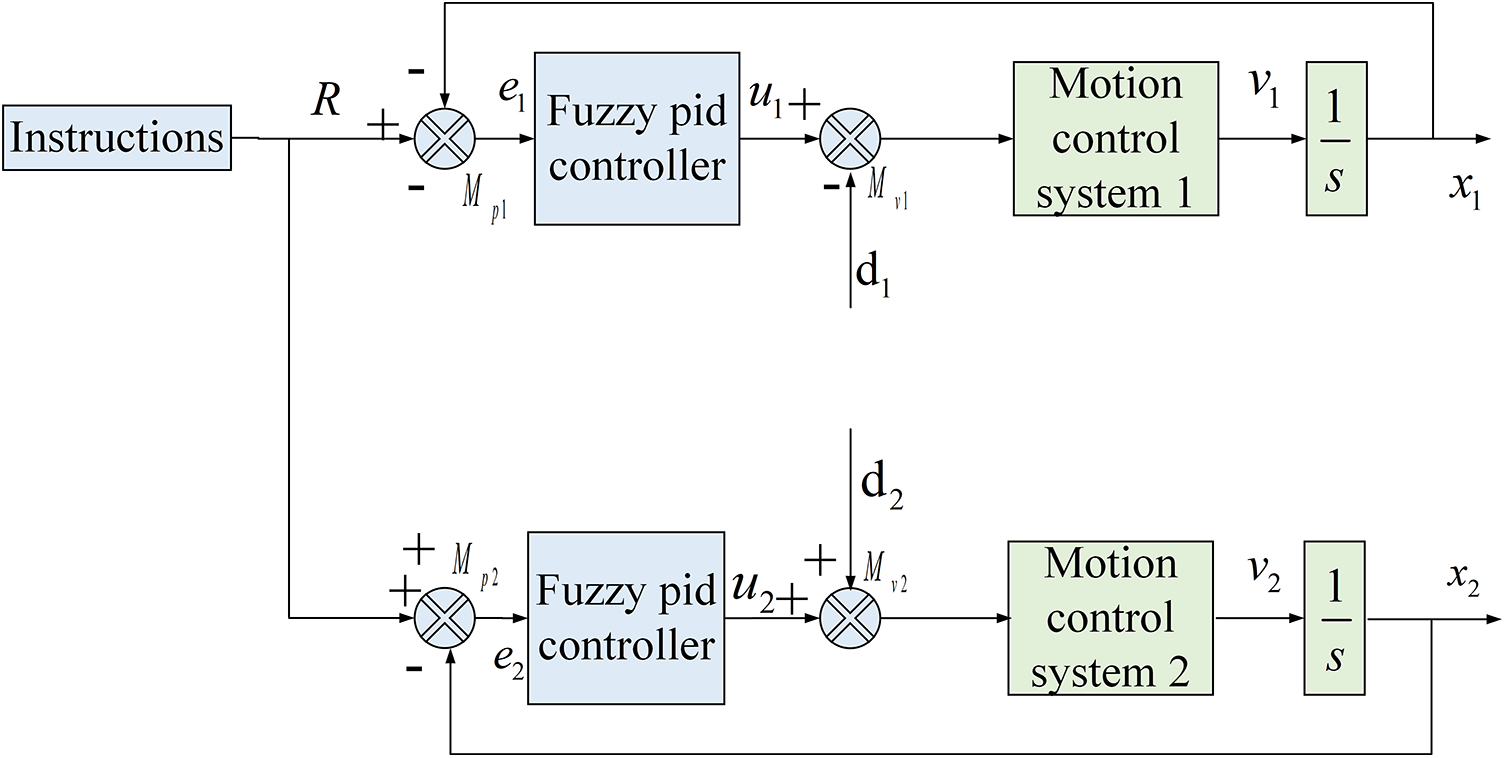
Figure 13: Block diagram of biaxial axis synchronized drive control system
The steady state tracking error of the system with step signal input is, neglecting mechanical and load disturbances:
where
where
Since both axes have the same commanded position, the synchronization error generated during the motion of both axes can be expressed as
As shown in Eq. (3), when the step signal operates in steady state, if
Based on the above description, a synchronization error compensation controller is designed, which adds a synchronization error compensation term part while adding a speed error compensation term, and its principle can be summarized as follows: the actual synchronization error is differentiated, and then the speed synchronization error is obtained. Introducing the speed compensation error coefficient
where
From Eq. (4), a synchronization error compensation controller can be designed with the structure shown in Fig. 14. Through the design of servo gain mismatch cross-coupling controller, the robustness of the system can be ensured, suppressing the system nonparametric saturation, parameter setup and external disturbances, and guaranteeing the anti-disturbance capability of the multi-axis system.
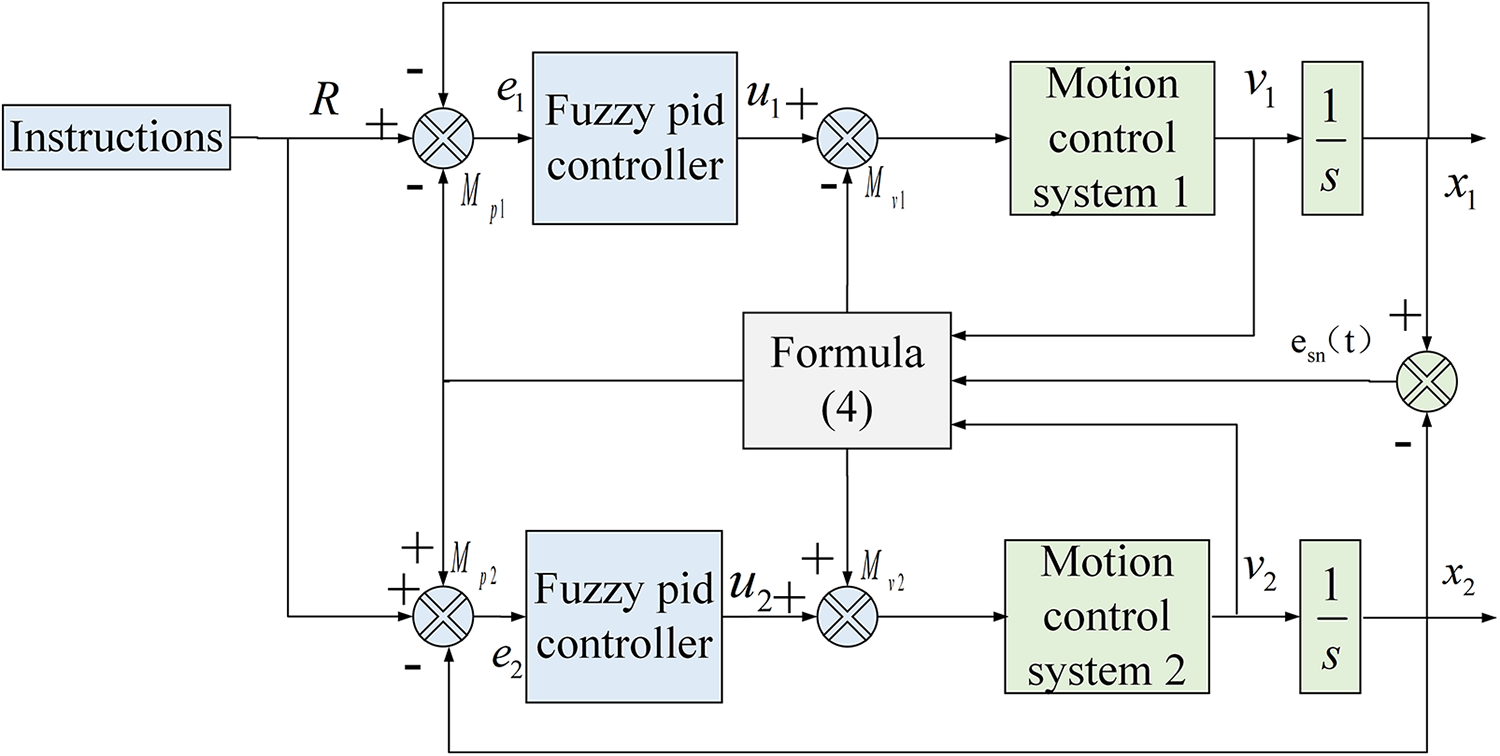
Figure 14: Synchronization error compensation
This study aims to verify the effect of the servo gain mismatch cross-coupling control strategy on the synchronized control of a biaxial system design test, utilizing a cross-shaped specimen. The specimen is made from C-C composites, which are commonly used heat-resistant materials in aerospace vehicles, for tensile experiments at room temperature and ultra-high temperatures. The installation method of the specimen is illustrated in Fig. 15. The biaxial tensile test is carried out according to the synchronous loading strategy, with a load ratio of 1:1, and the strain of the specimen is measured using Digital Image Correlation(DIC). The accuracy of the test specification is required to be less than 2% of the allowable value of the relative error of the force load in the four axes, i.e., the
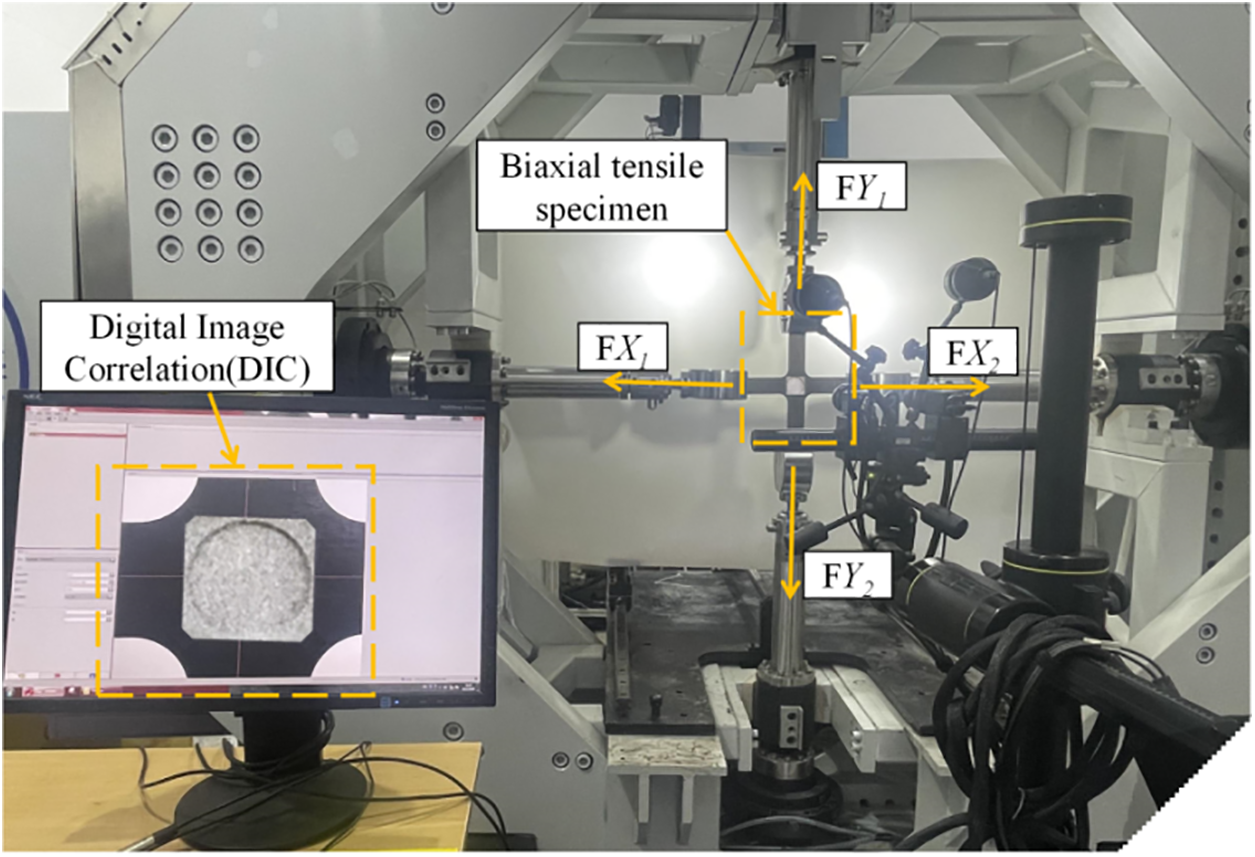
Figure 15: Cross specimen installation
Fig. 16a shows that fracture occurred when the force was stretched to approximately 51,000 N. According to the allowable error value of 2%, the error between the two axes must be within 1000 N. The force values of the four axes were synchronized throughout the test, with no overshoot or undershoot at the endpoint. Fig. 16b indicates that the difference between
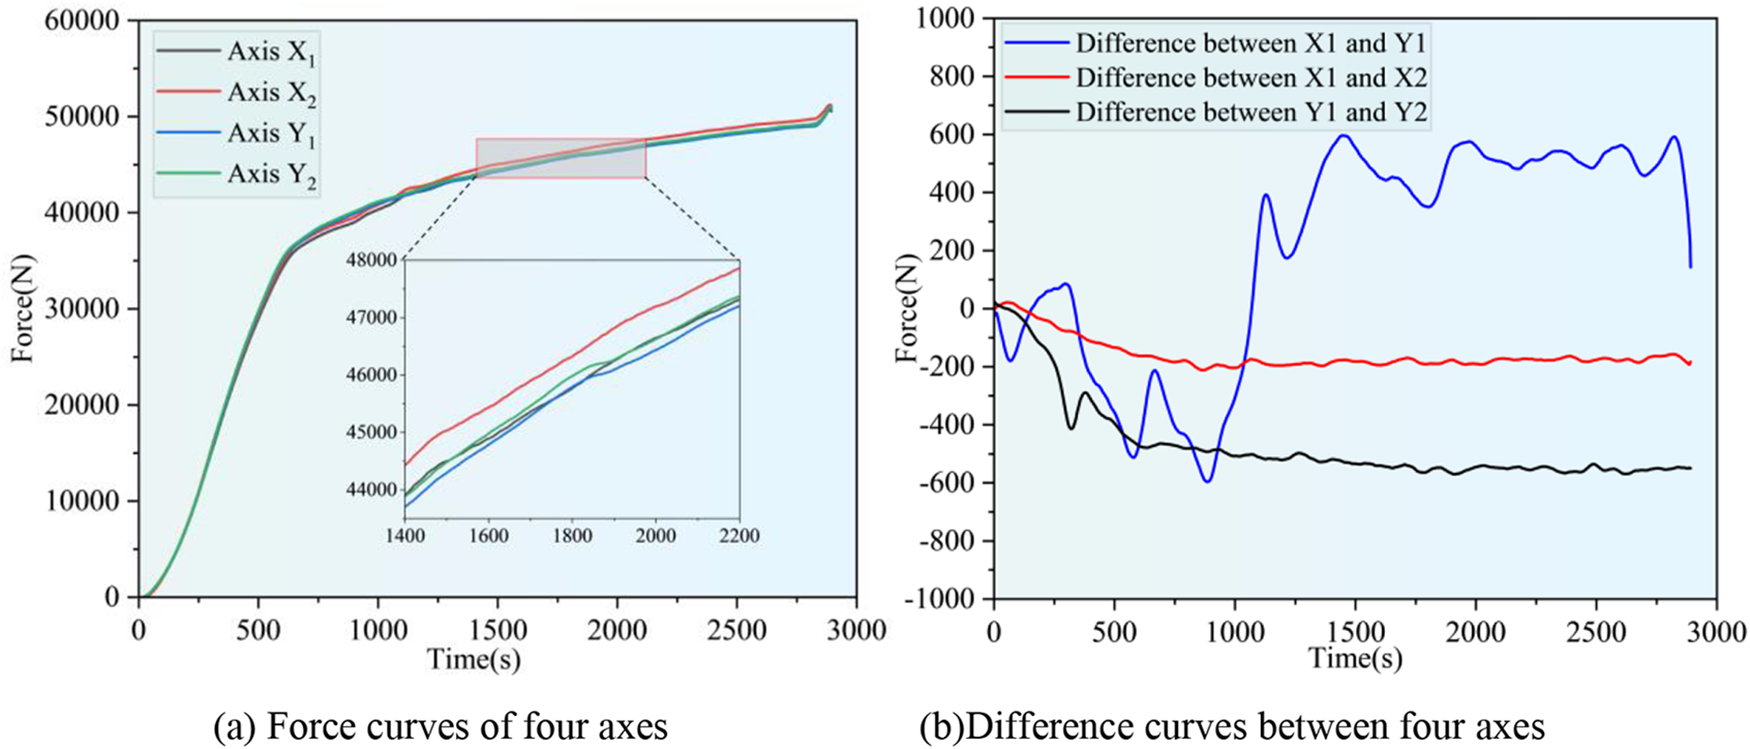
Figure 16: Force variation at room temperature
Test the force variation of biaxial tension at 1700°C under the condition of auxiliary algorithm. From Fig. 17a, it can be seen that the force values of the four axes were basically synchronized from the beginning to the end of the experiment, and there was no overshoot or undershoot at the endpoint. In Fig. 17b, it can be seen that the difference between
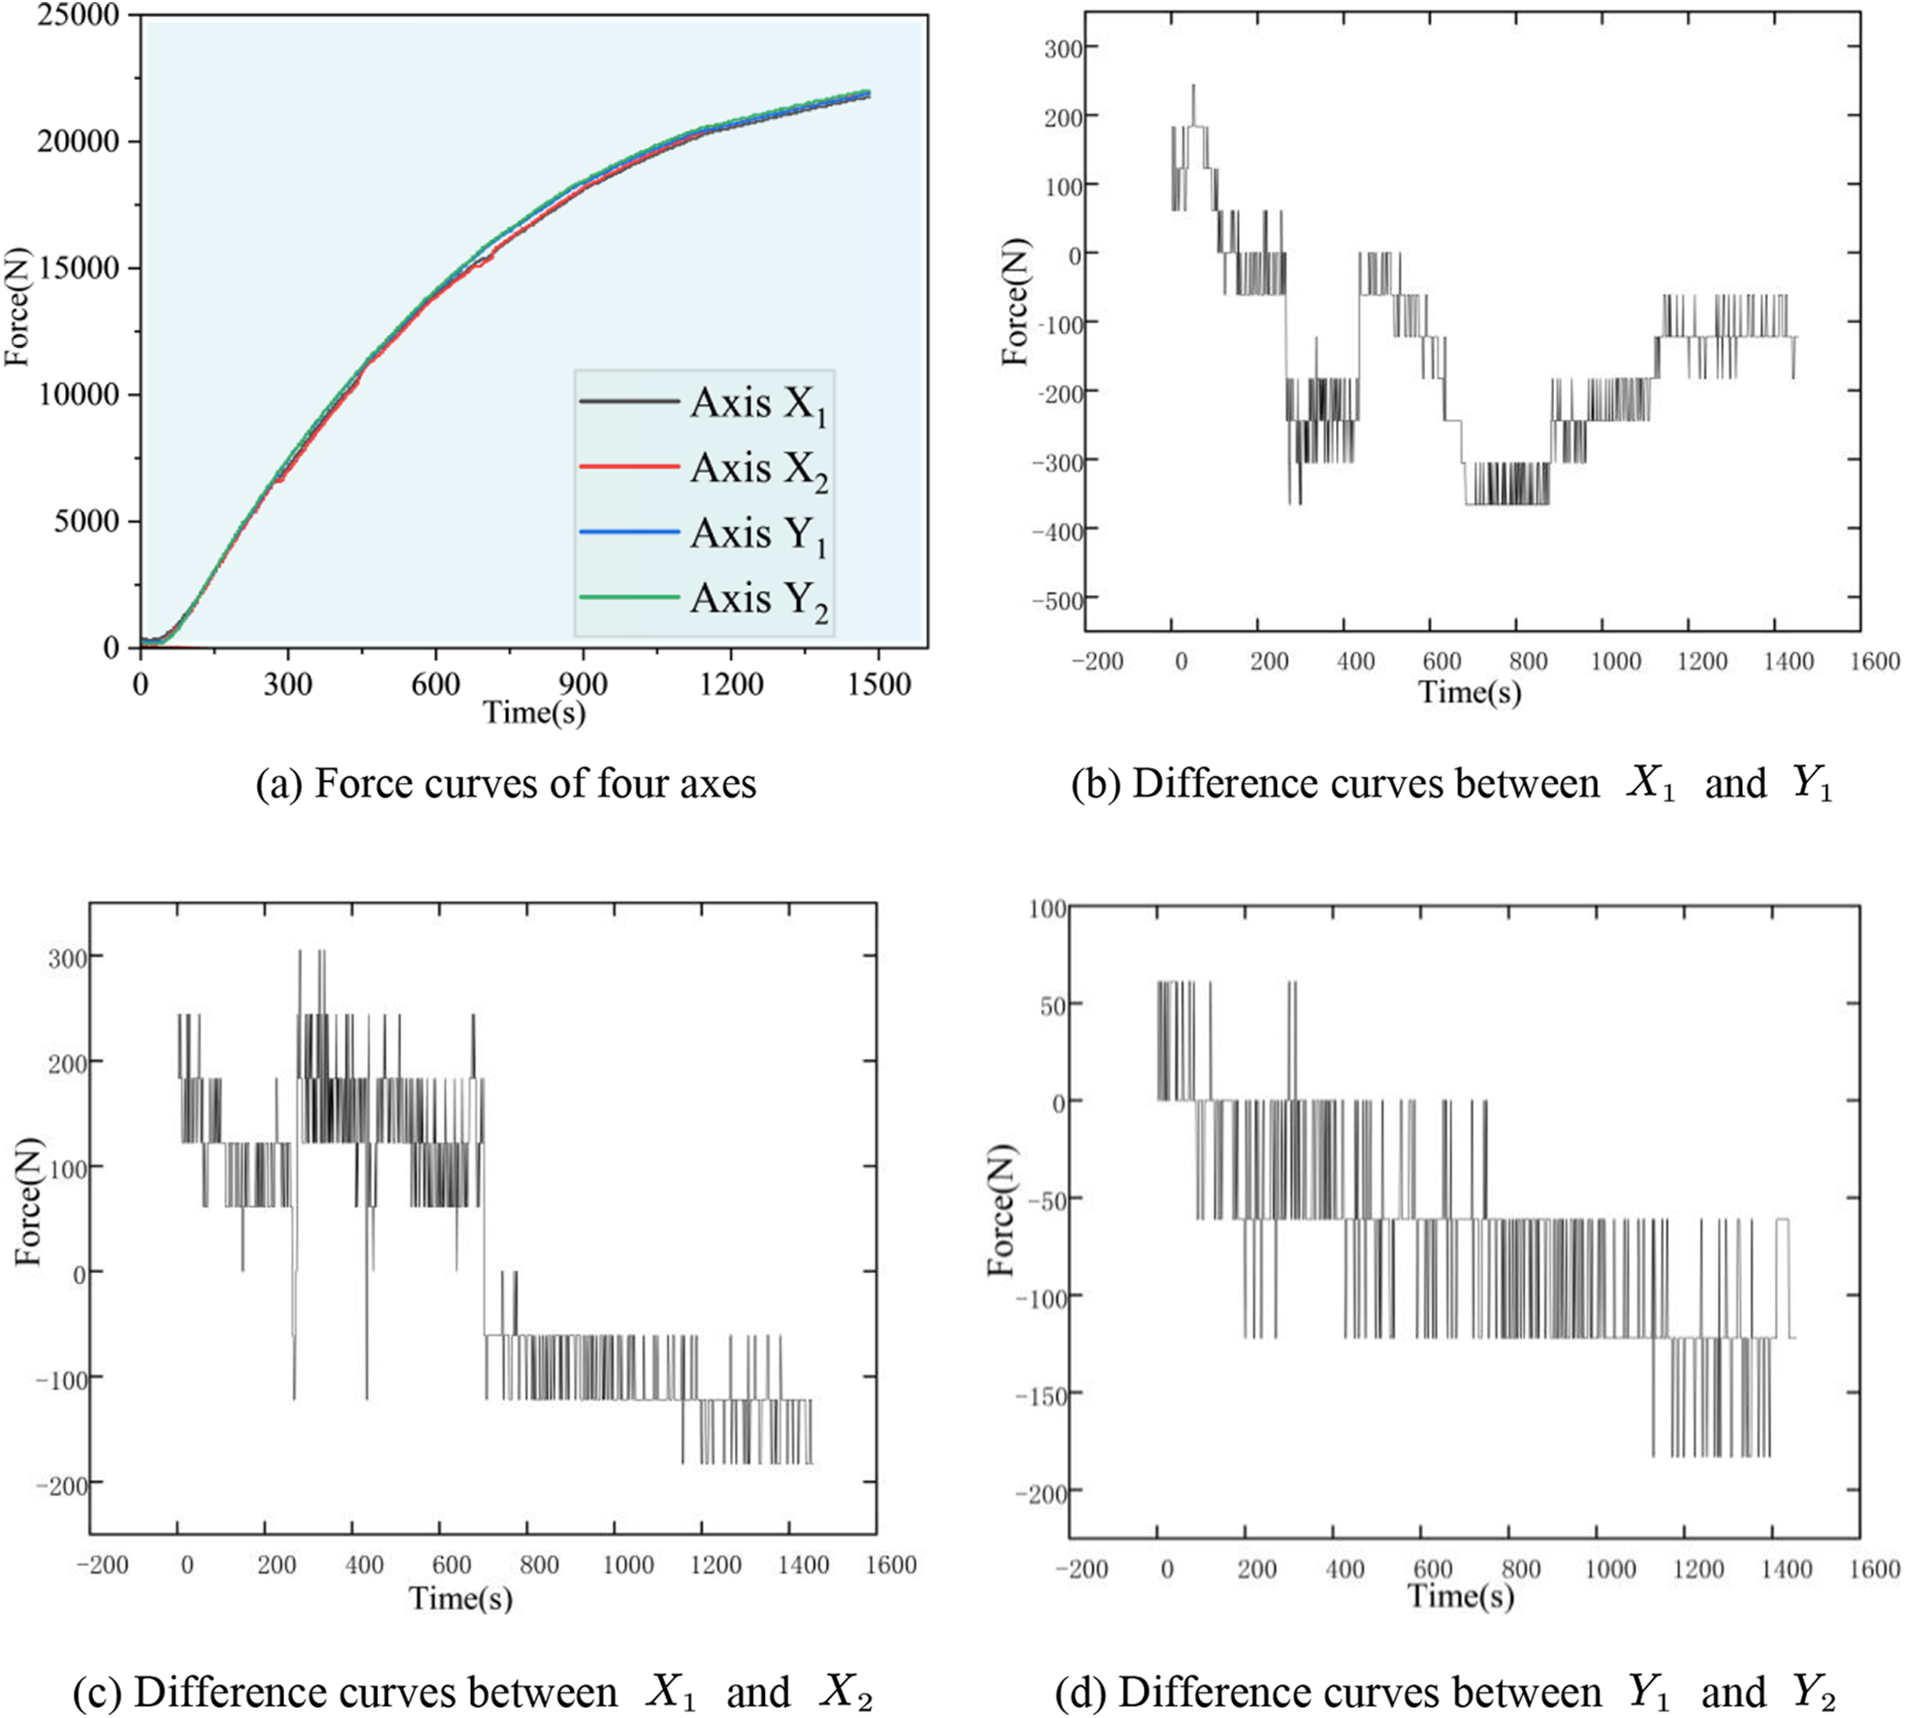
Figure 17: Force variation at 1700°C
Accurate construction of high-temperature conditions is crucial for the success of tensile tests. Unstable loading during operation can negatively affect the experiment and lead to safety issues. Thus, obtaining the temperature distribution of the surrounding components and predicting future changes is essential.
Long Short-Term Memory (LSTM) neural networks are well-suited for predicting significant events with long time intervals due to their unique gating mechanisms. This study inputs temperature time series data from different operating conditions into the LSTM network to establish a data-driven prediction model [30].Therefore, this study utilizes the advantages of LSTM and the collected time series data to reflect the operational status of HTBTA and construct a rule model. Thermocouple sensors were arranged at four key positions for measurement, as shown in Fig. 18. Two heating experiments were conducted under different operating conditions, where (a) was the heating, insulation, and cooling stage at 1400°C, and (b) was the heating and insulation stage at 1000°C, as shown in Fig. 19. The attributes of the collected data are temperature values at four locations. Standardize the collected data before training the model, and divide the training set, test set, and validation set in a 6:2:2 ratio. The parameter settings of LSTM are shown in Table 2.
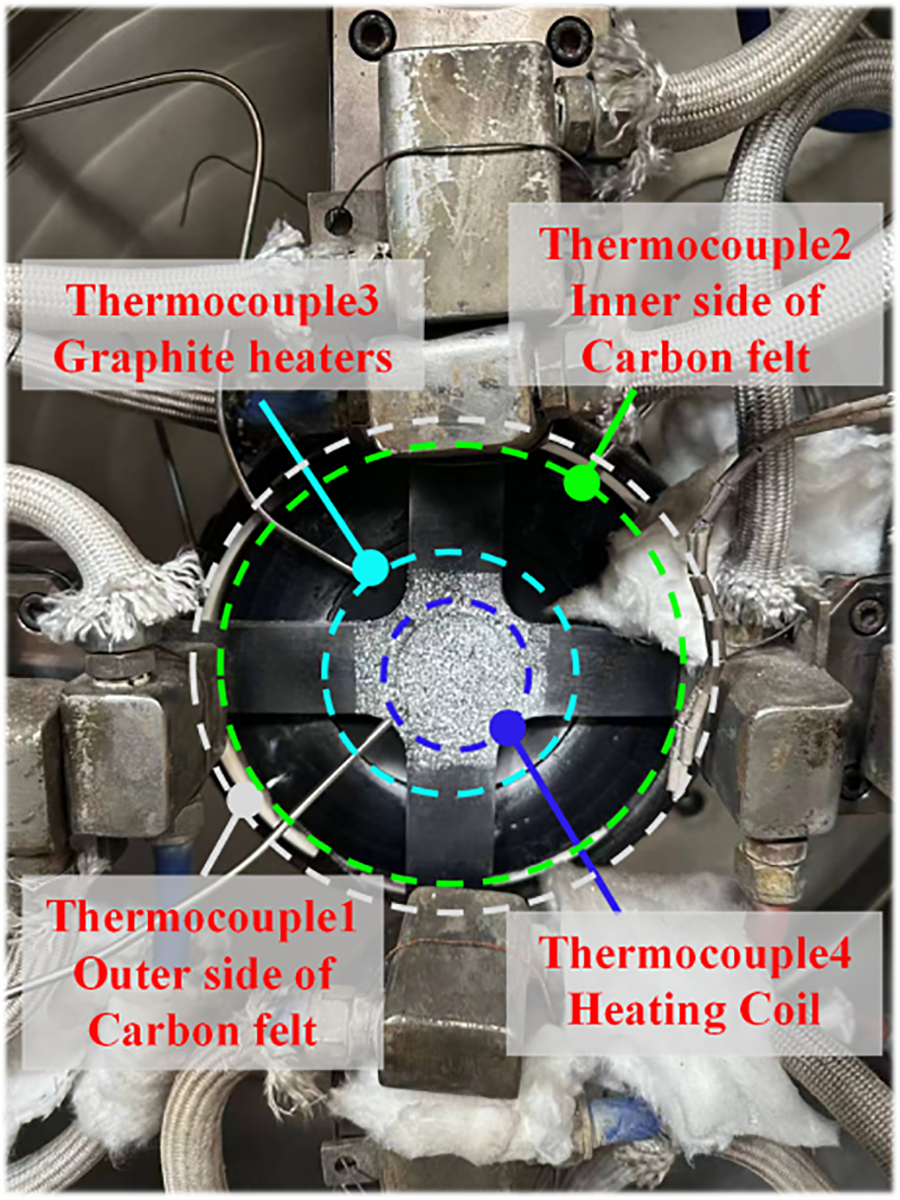
Figure 18: Thermocouple temperature measurement at four points
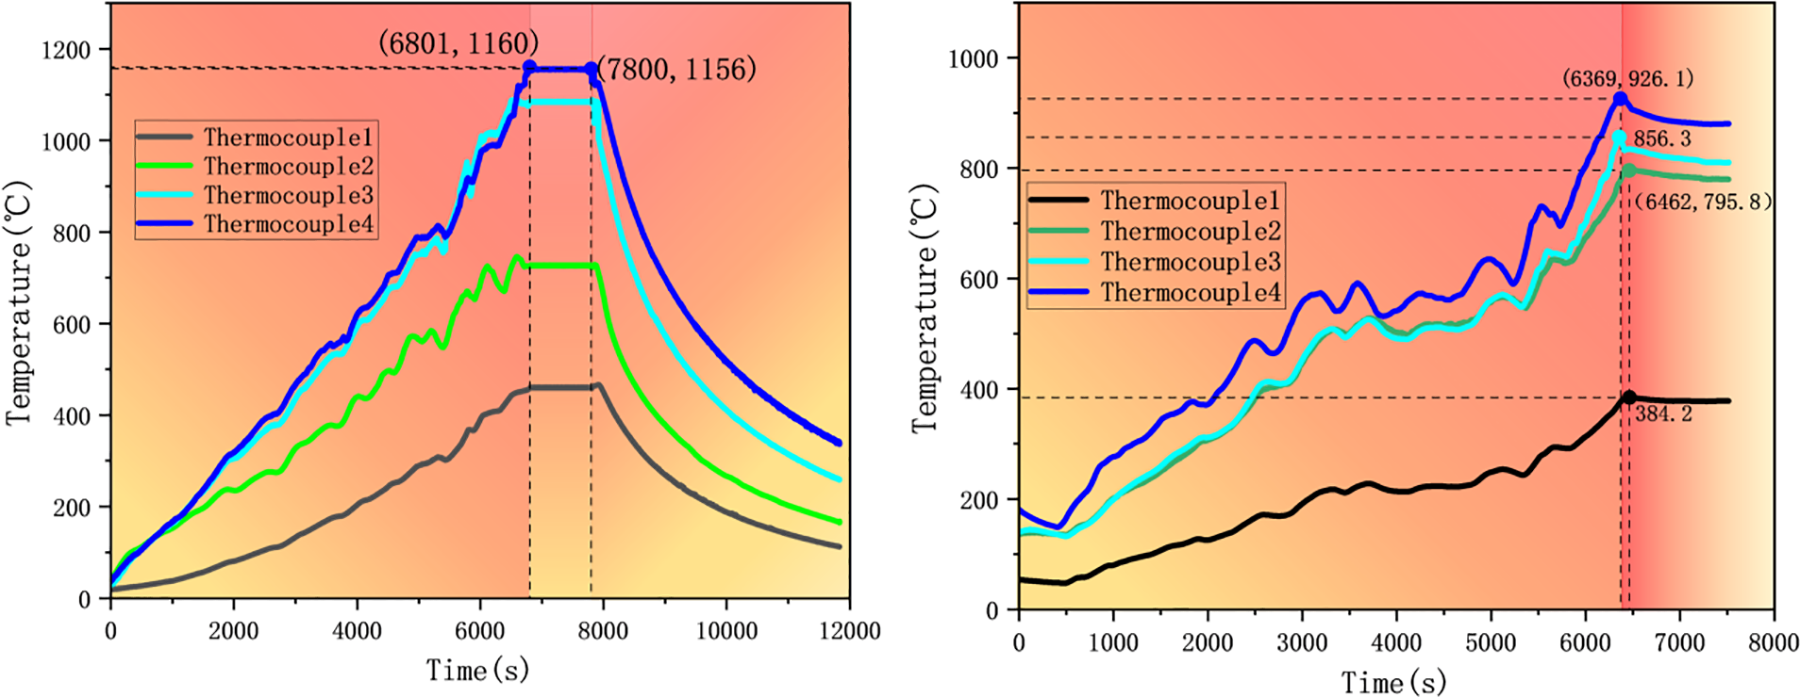
Figure 19: Heating curves of two operating conditions
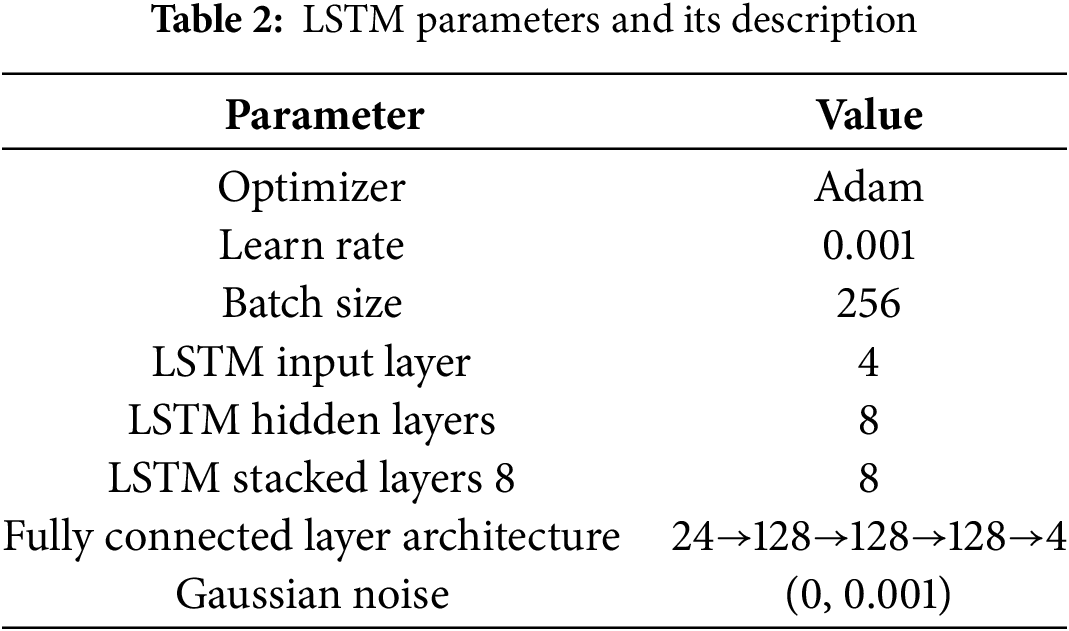
Fig. 20 illustrates the MSE convergence curves of the model training process for both the training and test sets. After 20,000 iterations, the loss values approach 0, becoming negligible after 100,000 iterations. The model training process demonstrates that a high-performance temperature prediction model can be developed using standardized data. The prediction accuracy of the trained model is evaluated using R², Mean Squared Error (MSE), and Mean Absolute Error (MAE).
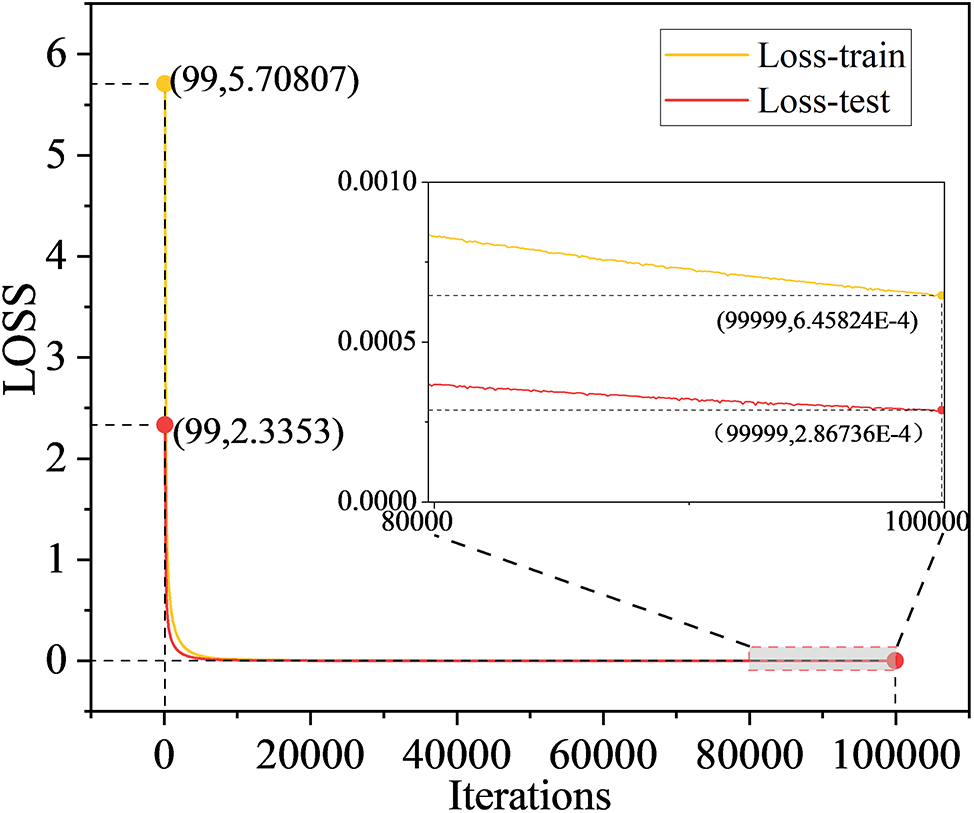
Figure 20: Process of model training
Fig. 21 presents the performance of the trained model on the validation set. The R2, MSE, and MAE values for the predicted and actual temperatures at four points achieve high and acceptable levels. Thus, Fig. 20 confirms that the trained temperature model can accurately predict temperatures for the next 10 s.
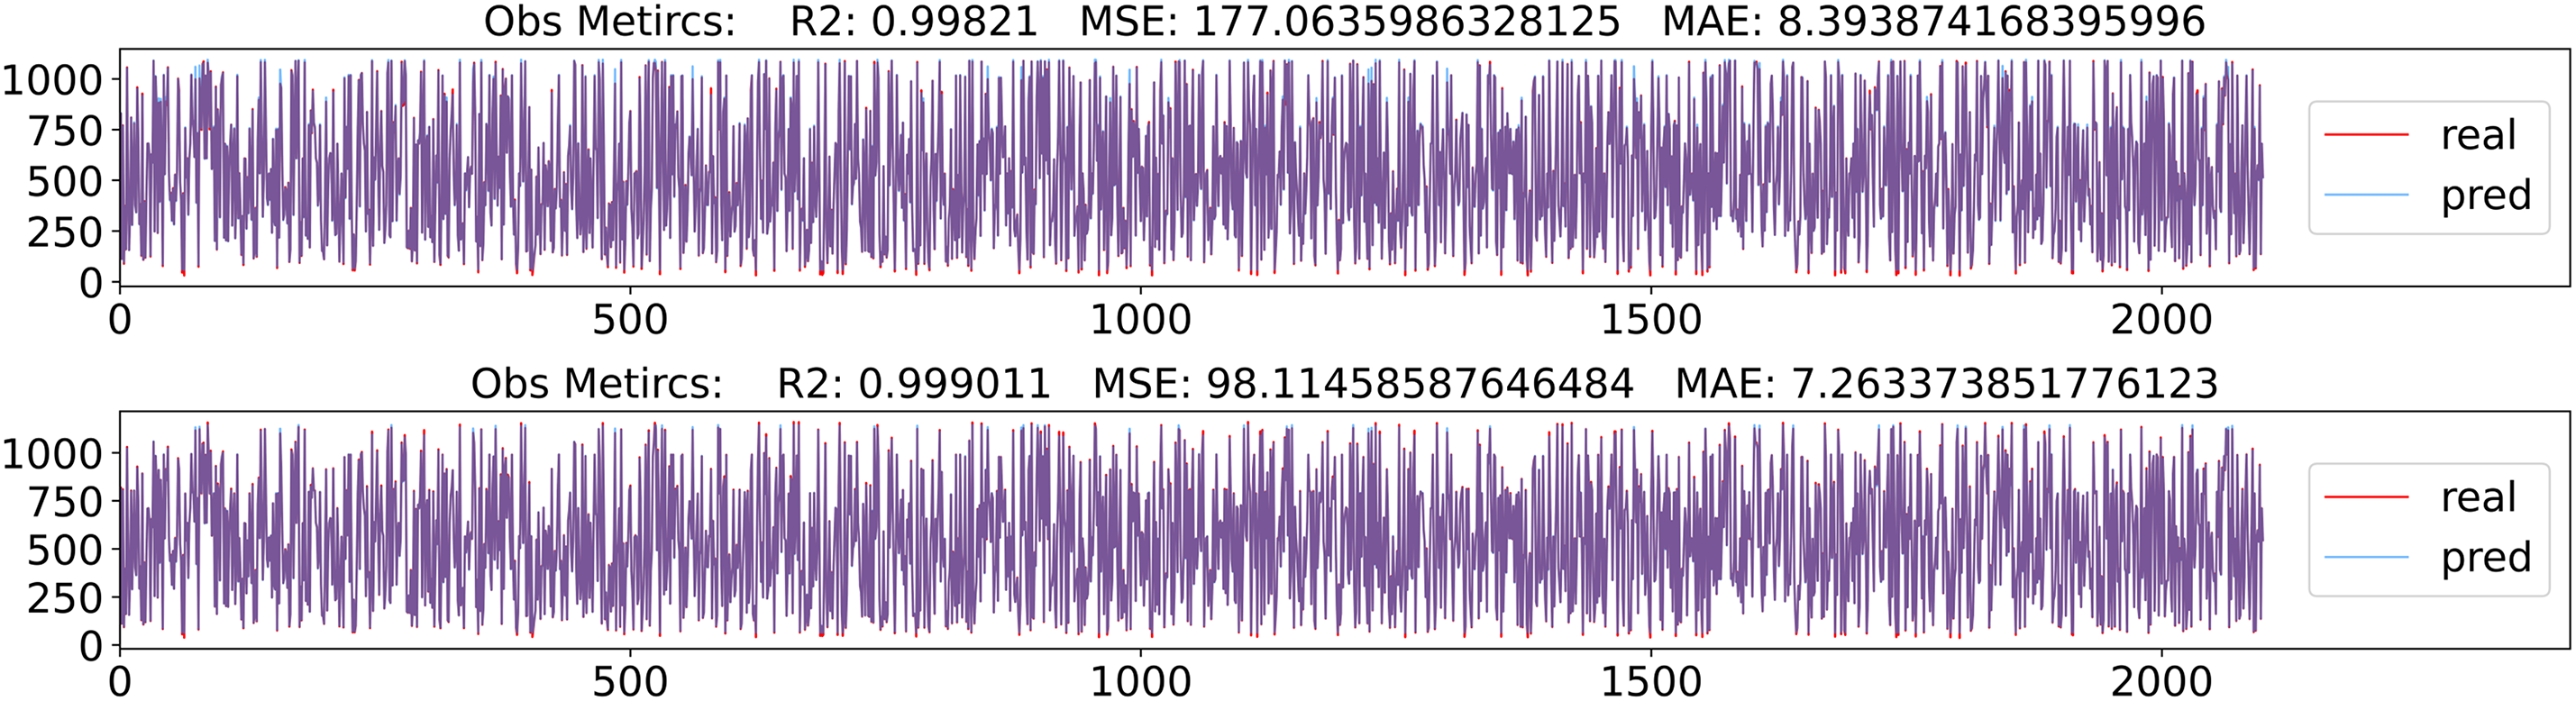
Figure 21: Performance of the temperature prediction model
4 Remote Monitoring Platform Construction
HTBTA requires the collection of the following two types of data during the experiments shown as Fig. 22.
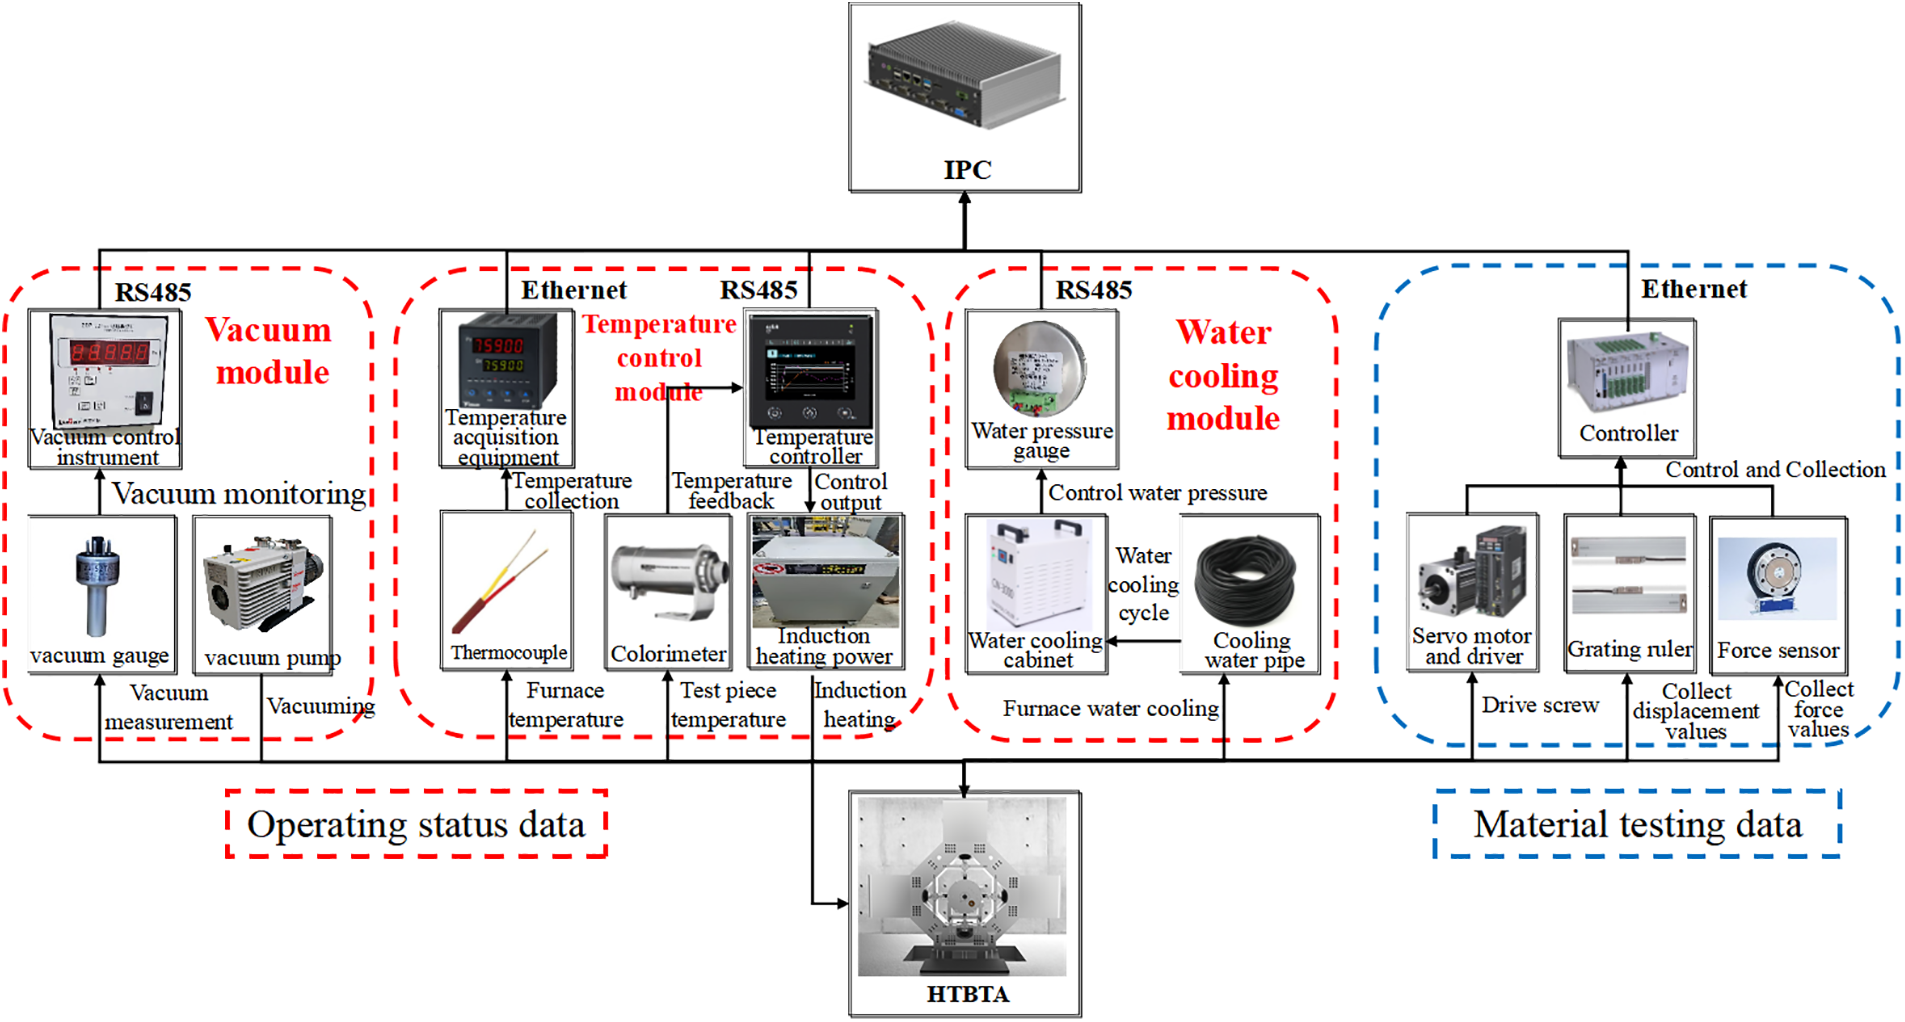
Figure 22: Material test data collection program
(1) Operational status data
The operational status data of the test apparatus indicates the stability of the entire test process. Key data points include the vacuum level measured by the vacuum module, the center loading temperature of the specimen recorded by the colorimeter in the temperature control module, temperature readings from eight thermocouple sensors positioned around the fixture and specimen, and the water pressure measured by the water-cooling module’s pressure gauge. The resistance vacuum gauge, temperature control meter, and water pressure measurement instruments are connected to the industrial control machine via an RS485 serial port. The thermocouple sensors collect data through a temperature acquisition card.
(2) Material test data
The material test data are the target parameters of the test and must be recorded and saved in real time. The mechanical properties of the tested specimen are calculated based on this data. This data primarily includes the force value measured by the pressure transducer during tensile testing and the displacement value of the spindle recorded by the scale.
The acquisition and feedback of test data are managed by the PMAC controller, which is integrated with and connected to the industrial computer’s serial port for data acquisition and command interaction.
To enable remote monitoring of the test apparatus, collected data must be transmitted to a cloud server for storage and then sent to a browser for presentation. This requires using electromagnetic waves for long-distance wireless communication instead of physical cables.
Data transmission is facilitated by a Data Transfer Unit (DTU), which converts data from RS232/RS485 and other serial communication protocols to TCP/IP format. The WebSocket protocol is used for data interaction, involving a handshake request, response to the request, establishment of a connection, and full-duplex communication. Once the WebSocket connection is successfully established, remote data transmission can occur. The on-message function is used to obtain the JSON format data sent by the server for further processing. At the start of the test load, the operational status data of the apparatus updates by collecting corresponding data through various sensors. This data is then encapsulated into JSON format packets and sent to the cloud server by the industrial control machine. When the server requests updated data, it initiates WebSocket communication with the browser, extracts the data according to the WebSocket frame format, and sends the corresponding data frame for parsing in the browser.
To enable real-time display of the virtual model and operation status of the test apparatus, a three-dimensional visualization is constructed using WebGL technology. Users can interact with the model by rotating, zooming, and panning to observe the components and operation mode in detail. They can also click on the components of the apparatus to view detailed information, including the name, number, function, and maintenance cycle.
The data displayed are the real-time operating parameters of the material testing apparatus. This data is continuously collected by various sensors on the apparatus, transmitted to the server, and then retrieved and displayed in real-time charts in the browser via WebSocket. The browser utilizes the WebGL architecture and ECharts visualization plugin to update and render the page based on real-time data, displaying the real-time 3D scene interface as depicted in Fig. 23.
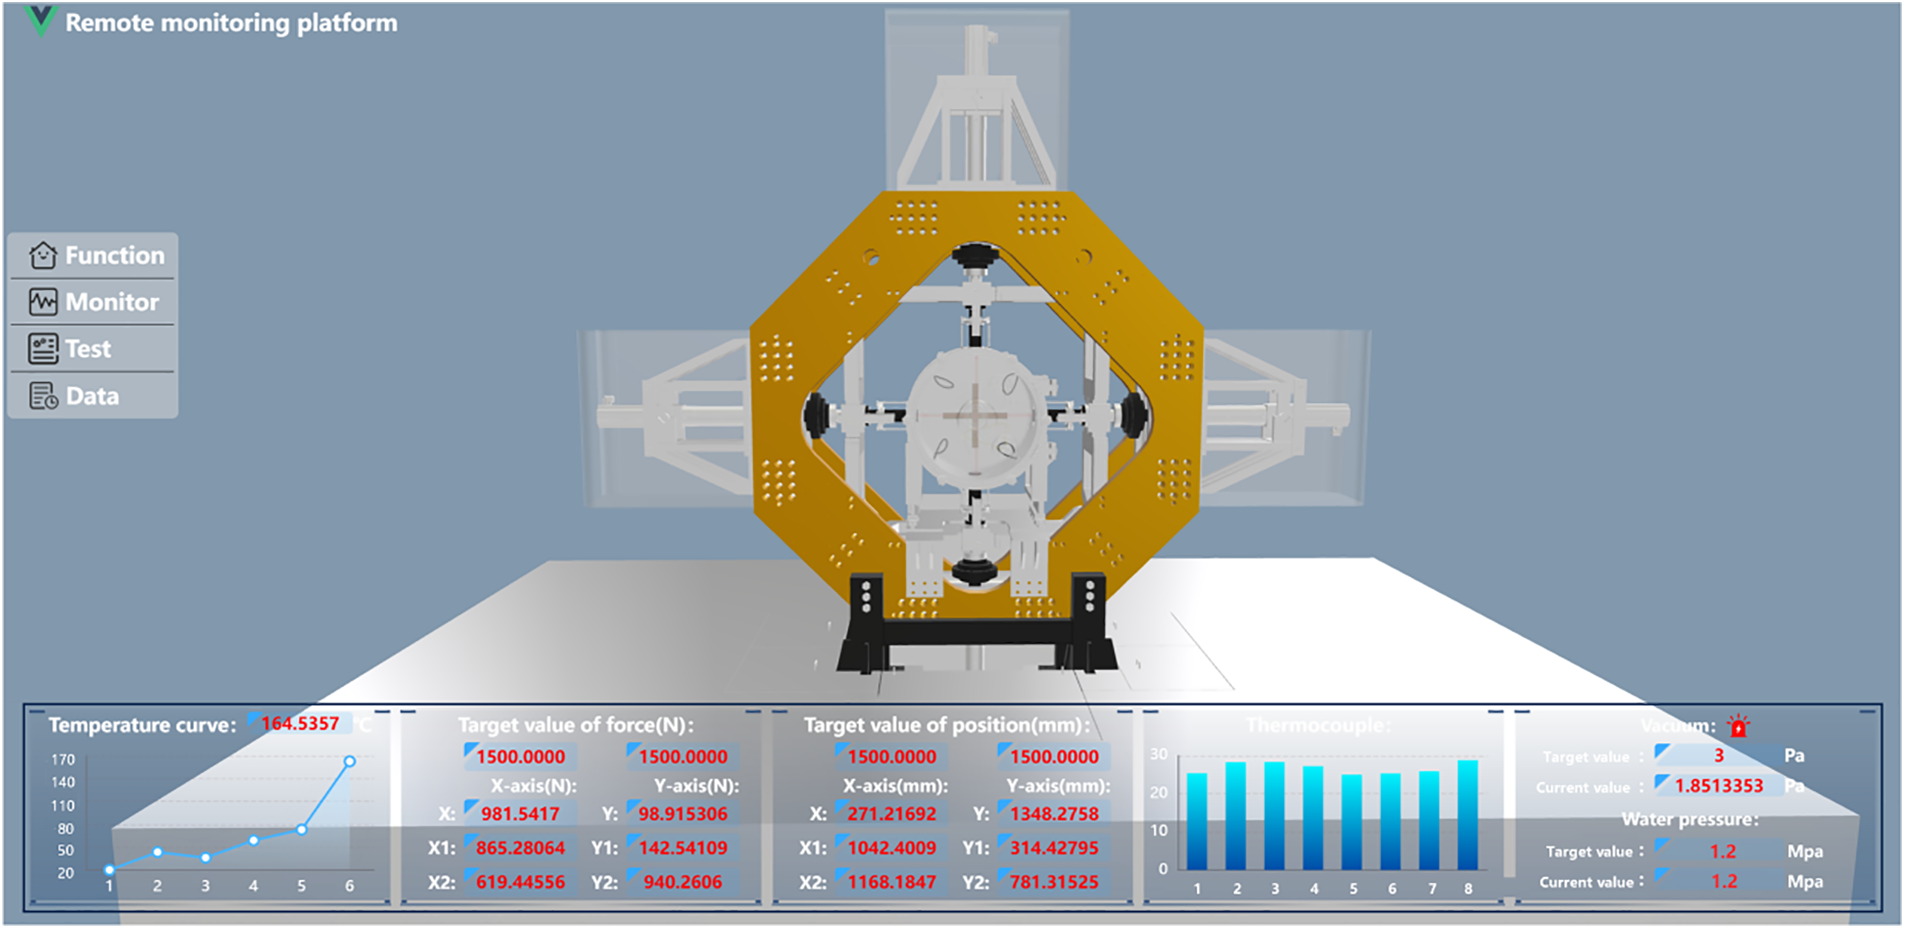
Figure 23: Remote monitoring visualization interface of HTBTA
The visualization interface of this digital system displays key process parameters in real-time. These parameters include the temperature curve of the cross specimen center, the current force and displacement values of the four main axes, the force and displacement values of the loading target, and the temperature readings from eight thermocouples distributed across different components. Additionally, it shows the target and current values for vacuum degree and water pressure.
The three-dimensional model, along with the chart, illustrates the overall structure of HTBTE and the internal operation status of the high-temperature furnace, offering users a more intuitive visual experience. Testing has shown that the data transmission delay between the physical HTBTE and the digital HTBTE consistently remains below 100 ms.
This study presents a digital twin-based modeling and application scheme for HTBTA. It establishes a digital twin model encompassing the design, validation, operation, and maintenance phases, as well as a platform that enables remote visualization and monitoring of the real-time operational status of HTBTA.
The main contributions of this study are as follows: the construction of a five-dimensional digital twin architecture for HTBTA, which includes the physical apparatus, digital apparatus, data, connections, and services. This study established a digital apparatus for HTBTA, designing and modeling it into three modules within a geometric model. Stress analysis, modal analysis, and environmental field analysis were conducted on the physical model to verify HTBTA’s reliability. Additionally, the behavior model designed a servo gain mismatch cross-coupling control strategy. Both experiments at room temperature and 1700°C have confirmed that the synchronous loading error of biaxial force values is less than 2%. The rule model utilized LSTM to predict the internal temperature of the high-temperature furnace 10 s into the future, and the R2 value can reach 0.99 or above through algorithm testing. A digital twin visualization model and scene of HTBTA are built using WebGL, with data transmission delays consistently under 100 ms, enabling remote state monitoring and real-time mapping of the physical apparatus.
Future research should focus on biaxial non-proportional load tests, incorporating friction and wear, fatigue testing, and other force loading methods combined with high-temperature ablation and additional environmental loading methods. Furthermore, innovative approaches such as laser scattering and high-speed camera in-situ observation should also be explored for the digital twin model.
Acknowledgement: The authors would like to express their gratitude to the editors and reviewers for their thorough review and valuable recommendations.
Funding Statement: This work was supported by Natural Science Foundation of China (NSFC), Grant Number 5247052693.
Author Contributions: The authors confirm contribution to the paper as follows: study conception and design: Peng Liu; Jianhai Zhang; Liming Zhou; data collection: Guotai Huang; analysis and interpretation of results: Xiyu Gao; Anran Zhao; draft manuscript preparation: Xiyu Gao. All authors reviewed the results and approved the final version of the manuscript.
Availability of Data and Materials: Due to the nature of this research, participants of this study did not agree for their data to be shared publicly, so supporting data is not available.
Ethics Approval: Not applicable.
Conflicts of Interest: The authors declare no conflicts of interest to report regarding the present study.
References
1. Wang Z, Chu X, Yue Z, Leotoing L, Gao J. A novel mechanical attachment for biaxial tensile test: application to formability evaluation for DP590 at different temperatures. J Mater Res Technol. 2024;28:4025–39. doi:10.1016/j.jmrt.2024.01.023. [Google Scholar] [CrossRef]
2. Zhao J, Zhang S, Wan J, Xu L, Zhou L, Ma Z, et al. Development of in situ fatigue performance testing apparatus for materials under coupling conditions of high-temperature and combined mechanical loads. IEEE Trans Instrum Meas. 2021;70:6012014. doi:10.1109/TIM.2021.3122536. [Google Scholar] [CrossRef]
3. Xing WJ, Yu Z, Liu C, Zhao H. In-Situ testing techniques for mechanical properties of materials: development and applications. Laser Optoelectron Progress. 2023;60(3):0312015. doi:10.3788/lop223365. [Google Scholar] [CrossRef]
4. Wang K, Zhang S, Wang Y, Zhao J, Wan J, Guan S, et al. Multifunctional in situ testing device for investigating the service performance of materials. IEEE Trans Instrum Meas. 2023;72:1–19. doi:10.1109/tim.2023.3239900. [Google Scholar] [CrossRef]
5. Gomez C, Dunn M, Veidt M, Reiner J. Finite element simulation of fiber reinforced composites under bi-axial loading. Int J Comput Methods. 2024;21(8):2241004. doi:10.1142/s0219876222410043. [Google Scholar] [CrossRef]
6. Chen J, Zhang J, Zhao H. Development and experimental verification of a high-temperature and in-plane biaxial testing apparatus. Machines. 2022;10(11):1054. doi:10.3390/machines10111054. [Google Scholar] [CrossRef]
7. Dong X, Huang J, Luo N, Hu W, Lei Z. Design and implementation of digital twin diesel generator systems. Energies. 2023;16(18):6422. doi:10.3390/en16186422. [Google Scholar] [CrossRef]
8. He B, Bai KJ. Digital twin-based sustainable intelligent manufacturing: a review. Adv Manuf. 2021;9(1):1–21. doi:10.1007/s40436-020-00302-5. [Google Scholar] [CrossRef]
9. Lu Y, Liu C, Wang KI, Huang H, Xu X. Digital twin-driven smart manufacturing: connotation, reference model, applications and research issues. Robot Comput Integr Manuf. 2020;61:101837. doi:10.1016/j.rcim.2019.101837. [Google Scholar] [CrossRef]
10. Madni AM, Madni CC, Lucero SD. Leveraging digital twin technology in model-based systems engineering. Systems. 2019;7(1):7. doi:10.3390/systems7010007. [Google Scholar] [CrossRef]
11. Huynh-The T, Pham QV, Pham XQ, Nguyen TT, Han Z, Kim DS. Artificial intelligence for the metaverse: a survey. Eng Appl Artif Intell. 2023;117:105581. doi:10.1016/j.engappai.2022.105581. [Google Scholar] [CrossRef]
12. Liu Z, Zhang Q, Duan J, Liu D. Digital twin-based testing process management for large and complex equipment components. Int J Adv Manuf Technol. 2022;121(5):3143–61. doi:10.1007/s00170-022-09475-8. [Google Scholar] [CrossRef]
13. Tao F, Cheng J, Qi Q, Zhang M, Zhang H, Sui F. Digital twin-driven product design, manufacturing and service with big data. Int J Adv Manuf Technol. 2018;94(9–12):3563–76. doi:10.1007/s00170-017-0233-1. [Google Scholar] [CrossRef]
14. Es-Haghi MS, Anitescu C, Rabczuk T. Methods for enabling real-time analysis in digital twins: a literature review. Comput Struct. 2024;297:107342. doi:10.1016/j.compstruc.2024.107342. [Google Scholar] [CrossRef]
15. Tao F, Sui F, Liu A, Qi Q, Zhang M, Song B, et al. Digital twin-driven product design framework. Int J Prod Res. 2019;57(12):3935–53. doi:10.1080/00207543.2018.1443229. [Google Scholar] [CrossRef]
16. Tao F, Zhang H, Liu A, Nee AYC. Digital twin in industry: state-of-the-art. IEEE Trans Ind Inf. 2019;15(4):2405–15. doi:10.1109/TII.2018.2873186. [Google Scholar] [CrossRef]
17. Tao F, Zhang M, Liu Y, Nee AYC. Digital twin driven prognostics and health management for complex equipment. CIRP Ann. 2018;67(1):169–72. doi:10.1016/j.cirp.2018.04.055. [Google Scholar] [CrossRef]
18. Aheleroff S, Xu X, Zhong RY, Lu Y. Digital twin as a service (DTaaS) in industry 4.0: an architecture reference model. Adv Eng Inform. 2021;47:101225. doi:10.1016/j.aei.2020.101225. [Google Scholar] [CrossRef]
19. Wu Y, Zhou L, Zheng P, Sun Y, Zhang K. A digital twin-based multidisciplinary collaborative design approach for complex engineering product development. Adv Eng Inform. 2022;52:101635. doi:10.1016/j.aei.2022.101635. [Google Scholar] [CrossRef]
20. Zhidchenko V, Startcev E, Kortelainen J, Zeb A, Torvikoski L, Torkabadi S, et al. A microservices-based architecture for data and software management of heavy equipment digital twins. In: 2023 IEEE 21st International Conference on Industrial Informatics (INDIN); 2023 Jul 18–20; Lemgo, Germany: IEEE; p. 1–8. doi:10.1109/INDIN51400.2023.10218021. [Google Scholar] [CrossRef]
21. Schleich B, Anwer N, Mathieu L, Wartzack S. Shaping the digital twin for design and production engineering. CIRP Ann. 2017;66(1):141–4. doi:10.1016/j.cirp.2017.04.040. [Google Scholar] [CrossRef]
22. Wang K, Zhang L, Jia Z, Cheng H, Lu H, Cui J. A framework and method for equipment digital twin dynamic evolution based on IExATCN. J Intell Manuf. 2024;35(4):1571–83. doi:10.1007/s10845-023-02125-0. [Google Scholar] [CrossRef]
23. Luo W, Hu T, Zhang C, Wei Y. Digital twin for CNC machine tool: modeling and using strategy. J Ambient Intell Humaniz Comput. 2019;10(3):1129–40. doi:10.1007/s12652-018-0946-5. [Google Scholar] [CrossRef]
24. Lai X, Wang S, Guo Z, Zhang C, Sun W, Song X. Designing a shape-performance integrated digital twin based on multiple models and dynamic data: a boom crane example. J Mech Des. 2021;143(7):071703. doi:10.1115/1.4049861. [Google Scholar] [CrossRef]
25. Stegmaier V, Schaaf W, Jazdi N, Weyrich M. Simulation model for digital twins of pneumatic vacuum ejectors. Chem Eng Technol. 2023;46(1):71–9. doi:10.1002/ceat.202200358. [Google Scholar] [CrossRef]
26. Venturini S, Bonisoli E, Rosso C, Velardocchia M. A tyre-rim interaction digital twin for biaxial loading conditions. Mech Mach Theory. 2024;191:105491. doi:10.1016/j.mechmachtheory.2023.105491. [Google Scholar] [CrossRef]
27. Zhu Z, Lin Z, Huang J, Zheng L, He B. A digital twin-based machining motion simulation and visualization monitoring system for milling robot. Int J Adv Manuf Technol. 2023;127(9):4387–99. doi:10.1007/s00170-023-11827-x. [Google Scholar] [CrossRef]
28. Cichon T, Roßmann J. Digital twins: assisting and supporting cooperation in human-robot teams. In: 2018 15th International Conference on Control, Automation, Robotics and Vision (ICARCV); 2018 Nov 18–21; Singapore: IEEE. Vol. 2018, p. 486–91. doi:10.1109/ICARCV.2018.8580634. [Google Scholar] [CrossRef]
29. Fonseca IA, Gaspar HM, de Mello PC, Sasaki HAU. A standards-based digital twin of an experiment with a scale model ship. Comput Aided Des. 2022;145:103191. doi:10.1016/j.cad.2021.103191. [Google Scholar] [CrossRef]
30. Hochreiter S, Schmidhuber J. Long short-term memory. Neural Comput. 1997 Nov 15;9(8):1735–80. doi:10.1162/neco.1997.9.8.1735. [Google Scholar] [PubMed] [CrossRef]
Cite This Article
 Copyright © 2025 The Author(s). Published by Tech Science Press.
This work is licensed under a Creative Commons Attribution 4.0 International License , which permits unrestricted use, distribution, and reproduction in any medium, provided the original work is properly cited.
 Downloads
 Citation Tools