
 Submit a Paper
 Propose a Special lssue
 Open Access
ARTICLE

An AI-Enabled Framework for Transparency and Interpretability in Cardiovascular Disease Risk Prediction
1 Department of Computer Science, University of Engineering and Technology, Lahore, 39161, Pakistan
2 Dipartimento di Farmacia e Biotecnologie, Alma Mater Studiorum—Universitá di Bologna, Bologna, 40126, Italy
3 Department of Information Sciences, University of Education, Lahore, 54770, Pakistan
4 Department of Computer Science, National Textile University, Karachi Campus, Karachi, 74900, Pakistan
5 Department of Computer Science, National Textile University, Faisalabad, 37610, Pakistan
6 Department of Computer Engineering, College of Computer and Information Sciences, King Saud University, Riyadh, 11543, Saudi Arabia
7 Department of Electrical Engineering, Computer Engineering, and Informatics, Cyprus University of Technology, Limassol, 3036, Cyprus
8 Department of Computer Science, CTL Eurocollege, Limassol, 3077, Cyprus
* Corresponding Authors: Sheraz Aslam. Email: ; Khursheed Aurangzeb. Email:
Computers, Materials & Continua 2025, 82(3), 5057-5078. https://doi.org/10.32604/cmc.2025.058724
Received 19 September 2024; Accepted 06 February 2025; Issue published 06 March 2025
 View Full Text
 Download PDF
Abstract
Cardiovascular disease (CVD) remains a leading global health challenge due to its high mortality rate and the complexity of early diagnosis, driven by risk factors such as hypertension, high cholesterol, and irregular pulse rates. Traditional diagnostic methods often struggle with the nuanced interplay of these risk factors, making early detection difficult. In this research, we propose a novel artificial intelligence-enabled (AI-enabled) framework for CVD risk prediction that integrates machine learning (ML) with eXplainable AI (XAI) to provide both high-accuracy predictions and transparent, interpretable insights. Compared to existing studies that typically focus on either optimizing ML performance or using XAI separately for local or global explanations, our approach uniquely combines both local and global interpretability using Local Interpretable Model-Agnostic Explanations (LIME) and SHapley Additive exPlanations (SHAP). This dual integration enhances the interpretability of the model and facilitates clinicians to comprehensively understand not just what the model predicts but also why those predictions are made by identifying the contribution of different risk factors, which is crucial for transparent and informed decision-making in healthcare. The framework uses ML techniques such as K-nearest neighbors (KNN), gradient boosting, random forest, and decision tree, trained on a cardiovascular dataset. Additionally, the integration of LIME and SHAP provides patient-specific insights alongside global trends, ensuring that clinicians receive comprehensive and actionable information. Our experimental results achieve 98% accuracy with the Random Forest model, with precision, recall, and F1-scores of 97%, 98%, and 98%, respectively. The innovative combination of SHAP and LIME sets a new benchmark in CVD prediction by integrating advanced ML accuracy with robust interpretability, fills a critical gap in existing approaches. This framework paves the way for more explainable and transparent decision-making in healthcare, ensuring that the model is not only accurate but also trustworthy and actionable for clinicians.Keywords
Several organs in the human body serve a distinct function [1,2]. As a single unit, the heart is responsible for circulating blood throughout the body [3]. If it fails, it can lead to fatal consequences [4]. Furthermore, cardiovascular diseases play a major role in the global disease burden and are strongly associated with hypoxia, a condition of oxygen deprivation [5]. The World Health Organization (WHO) estimates that 17.9 million people die from heart disease, also known as cardiovascular disease (CVD) each year [6,7]. CVD encompasses any irregularity in the heart’s blood vessels, including the narrowing of vessels that transport blood to and from the heart [8,9]. CVD can hinder blood flow, potentially leading to blockages, which may result in a stroke or a major heart attack. There are four main categories into which CVD can be divided [10]. A blockage in blood flow to the ventricular muscle is the first, known as coronary heart disease [11]. Heart problems, ulcers, and cardiac arrest can result from elevated cardiac stress. A transient ischemia attack or stroke falls under the second category [12], caused by a temporary disruption or restriction in blood supply to the brain. Peripheral artery disease, the third type, is caused by an obstruction in the blood supply to the limbs [13]. Prolonged leg pain, ankle and hip hair loss, thigh stiffness, and recurrent ulcers are some of the symptoms of this illness. Several risk factors contribute to the development of CVD, even if its precise cause is not entirely understood [14]. The main risk factors are blood pressure, high blood pressure, high blood sugar, raised cholesterol levels, smoking, obesity, and family history. Early diagnosis can lessen the number of people who die from these conditions [15].
One of the most essential parts of healthcare is figuring out who is at risk for CVD. A patient’s symptoms, doctor’s examination notes, and medical history are the main components of the current approaches for diagnosing and forecasting disease [15]. Checking symptoms against those of individuals who have already received a diagnosis is frequently used to make a diagnosis [16]. Accordingly, an automated intelligent system is necessary for the medical industry to precisely forecast diseases like diabetes, liver disease, heart disease, and tumors [17]. Studies indicated that roughly 67% of doctors can accurately diagnose a patient with cardiac illness [18]. With the help of machine learning (ML) techniques and the abundance of data accessible in the healthcare industry, this disease diagnostic accuracy could be increased [19].
In recent years, research studies have been utilized to apply ML approaches for disease diagnosis and prediction [20–22]. Large healthcare datasets are becoming more widely available, and the healthcare sector is embracing cutting-edge computing technology rapidly, which is the source of this growing interest [23]. Databases containing patient’s electronic health records (EHRs) are currently easily accessible to the healthcare sector, and the amount of information in these databases is growing rapidly. There are many duplicates and imbalances in this raw data. Pre-processing is required to impute missing values, extract essential features, reduce the running time of the training algorithms, and improve classification accuracy [24]. The ML methods predict the outcome by using the trends seen in all of the variables in the dataset and modifying them for the new dataset. When trained on appropriate data, the supervised ML classification techniques can efficiently diagnose and predict the stages of diseases [25]. Early diagnosis and detection of CVD is crucial for protecting patients’ lives. several risk factors influence one’s likelihood of getting CVD. Tobacco use, hypertension, obesity, heart failure, renal disorders, genetic predisposition, and older adulthood are among the high-risk key factors.
In recent years, several studies, such as [26–29], used ML-based methods for the early diagnosis and detection of AD. Despite the significant results of conventional ML methods, these methods often lack the interpretability and explainability of the predictions due to their “black box” characteristics, which often lack transparency [30]. However, the explainability and interpretability of the model’s predictions are essential for crucial applications such as CVD prediction. Given the high stakes in healthcare, clinicians require accurate predictions and insights into how those predictions are derived. Consequently, this study distinguishes itself by integrating eXplainable AI (XAI) techniques like SHAP (SHapley Additive exPlanations) and LIME (Local Interpretable Model-agnostic Explanations) into the CVD risk prediction framework, offering enhanced transparency and interpretability compared to traditional ML models. XAI approach preserves prediction accuracy while augmenting transparency, fostering improved trust and understanding of the decision-making process in healthcare environments. The goal of this research is to diagnose CVD at its early stages by identifying the disease risk factors (such as age-based, cholesterol level, smoking, etc.) using the XAI framework. This approach enables clinicians to understand better the underlying factors influencing predictions, fostering greater trust and utility in clinical settings. In the future, XAI could be included in intelligent healthcare systems that use IoT, cloud computing, and AI, and it is broadly used in the fields of cancer, cardiology, and neurology. The key research objectives of this work are the following:
1. To identify age-based risk factors of CVD.
2. To evaluate the effectiveness of various ML methods for determining these risk factors.
3. To implement XAI framework on the best-fit ML method for better explainability of the results.
The rest of the paper is divided into the following sections: A review on the CVD-related literature is discussed in Section 2. The proposed CVD prediction methodology is provided in Section 3. The experimental results of the proposed ML methods are discussed in Section 4. Finaly, the conclusion and future directions are given in Section 5.
In recent years, with the development of artificial intelligence (AI) in medical sciences, numerous studies have been conducted to reduce the death rate in various medical fields, i.e., Hematoma Evacuation [31], calcific aortic valve disease [32], flap necrosis [33]. Using various ML techniques. Sinha et al. (2024) [34] introduced CARDPSoML, which explores cardiovascular disease prediction using a feature-fusion approach that combines data preprocessing, feature extraction through principal component analysis (PCA), and wavelet transformations. The research employed supervised learning classifiers, such as support vector machines, decision trees, and neural networks, to examine medical report data customized explicitly for patients with diabetes who were at risk of cardiovascular disease. With its high accuracy and specificity, this approach showed potential in detecting cardiovascular disease early in diabetic patients. It suggests that feature fusion with sophisticated machine learning algorithms can improve this process. Paudel et al. (2023) [29] demonstrated that machine learning techniques, particularly the multilayer perceptron, hold significant potential for accurately predicting CVD. Using a dataset of 70,000 instances, the research applied and optimized various algorithms, including decision trees, random forests, multilayer perceptron, and XGBoost, with accuracy rates reaching up to 87%. The findings underscore the value of machine learning in early disease detection, which could substantially mitigate the global impact of CVD by reducing mortality and economic costs. Future work should explore model generalizability and interpretability enhancements to ensure broader applicability in clinical settings. Riyaz et al. (2022) [35] provided an overview of several ML approaches and evaluated the effectiveness of the ML methods used to diagnose various cardiac disorders. The authors examined several ML methods for forecasting the occurrence of cardiac disease, including Support Vector Machine (SVM), Decision Tree (DT), Naive Bayes (NB), KNN, and artificial neural networks (ANN). The average forecast accuracy for each model was calculated to decide which method was the best and worst. The findings indicated that the C4.5 DT approach has the lowest average prediction accuracy of 74% and that ANN has the best average prediction accuracy of 86.91%. Ayon et al. (2022) [36] compared several computational intelligence systems for heart disease prediction. The authors compared seven ML techniques, including SVM, Logistic Regression (LR), Deep Neural Network (DNN), NB, Random Forest (RF), KNN, and DT. The performance of the ML methods was evaluated using Statlog and the Cleveland heart disease dataset acquired from the University of California Irvine (UCI) ML repository. The results indicated that the DNN outperforms other ML methods and achieved 98.15% accuracy in predicting heart disease. Pal et al. (2022) [37] employed different ML techniques, including Multilayer Perceptron (MLP) and KNN, to detect cardiovascular disease using data from the UCI ML repository [38]. The study’s results indicated that the MLP model achieved a high accuracy of 82.47% and a larger area-under-the-curve (AUC) value of 86.41%. Sharma et al. (2020) [39] utilized different ML techniques, including Support Vector Machine (SVM), RF, NB, and Decision Tree (DT) to predict heart disease. The authors used benchmark heart disease data from the University of California Irvine (UCI) ML repository [40]. This dataset consisted of 14 different heart disease-related factors. The results demonstrated that RF provides better prediction accuracy in less time than other ML approaches. Maiga et al. (2019) [41] compared ML algorithms, including Naive Bayes (NB), K-Nearest Neighbor (KNN), Random Forest (RF), and Logistic Regression (LR) for predicting cardiovascular disease based on the cardiovascular risk parameters of patients. The CVD dataset acquired from Kaggle [42] was used to evaluate the performance of the ML methods. The results demonstrated that RF achieved an accuracy of 73%, a sensitivity of 80%, and a specificity of 65%.
Since AI solutions typically need a specialist’s knowledge of ML algorithms, the demand for technologies that make AI more approachable among healthcare practitioners is rising over time. This requirement is vital in healthcare and medicine, where disease diagnosis demands comprehensible and transparent data [43]. Dave et al. (2020) [44] proposed different interpretability strategies to educate practitioners about the interpretability and understandability of eXplainable AI (XAI) systems by utilizing a range of techniques that can be highly useful in the healthcare industry. Medical diagnosis systems are essential to save human lives; thus, we must be confident enough to treat a patient as a black-box model recommends. This study clarifies why explainability AI strategies should be chosen when utilizing AI systems in the medical and healthcare domain to build credibility about the results produced by AI and ML methods. Several research studies indicated that diagnosis and prediction are made possible by XAI predictive algorithms, reducing detection mistakes compared to relying on human expertise. Muneer et al. (2022) [38] provided a comprehensive analytical overview of ML methods, including RF, ECNNs, VGG-16, SVM, CNN, SMOTE, NB, and XG Boost with XAI in the context of recent developments in AI. The results demonstrated that the highest accuracy measure of 98% was achieved using the RF method with an explainable method (SMOTE and ADASYN). Bhatt et al. (2023) [28] examined the effectiveness of various ML algorithms, namely AdaBoost, Random Forest, Gradient Boosting, and Light Gradient-Boosting Machine (LGBM) in heart attack prediction. By employing the LIME explainability framework, the research identifies critical predictive features such as “kcm” and “troponin,” which consistently contribute to prediction accuracy across all models. LGBM achieved the highest accuracy at 99%, showcasing its potential for clinical use in diagnosing heart attacks. The study emphasizes the importance of incorporating eXplainable AI techniques to improve transparency and trust in AI-based healthcare predictions. An improved ensemble learning approach using XAI was proposed by Mienye et al. (2024) [27] for heart disease prediction. XGBoost, Random Forest, and AdaBoost are just a few of the ensemble approaches that this methodology combined with Bayesian optimization to fine-tune the model parameters and increase prediction accuracy. With the interpretability provided by Shapley Additive exPlanations (SHAP), clinicians could understand how particular factors affected predictions. Their model achieved an outstanding sensitivity of 98% on the Cleveland dataset and a specificity of 92% on the Framingham dataset, demonstrating the effectiveness of optimized ensemble approaches in producing high accuracy and transparency in clinical applications. The comprehensive survey of the literature on CVD prediction indicates that several studies were conducted to predict. CVD, however, the studies lack the explainability and interpretability of the findings of the AI/ML methods, which are necessary for the better understanding of clinicians and professionals in making decisions. Consequently, the key objective of this research is to predict age-based high-risk factors of CVD patients by utilizing an eXplainable AI framework in combination with various state-of-the-art ML approaches.
This section provides a detailed methodology for the proposed AI-enabled framework. The proposed framework is comprised of two main components. Firstly, we employed ML methods for the CVD classification. Secondly, an XAI module is incorporated to provide trustworthy and explicable predictions. The local and global explanation of the model is demonstrated by using different plots such as waterfall, bar plot, bee swarm, and summary plot from the XAI framework, including SHAP and LIME. Fig. 1 illustrates the schematic representation of the proposed methodology.
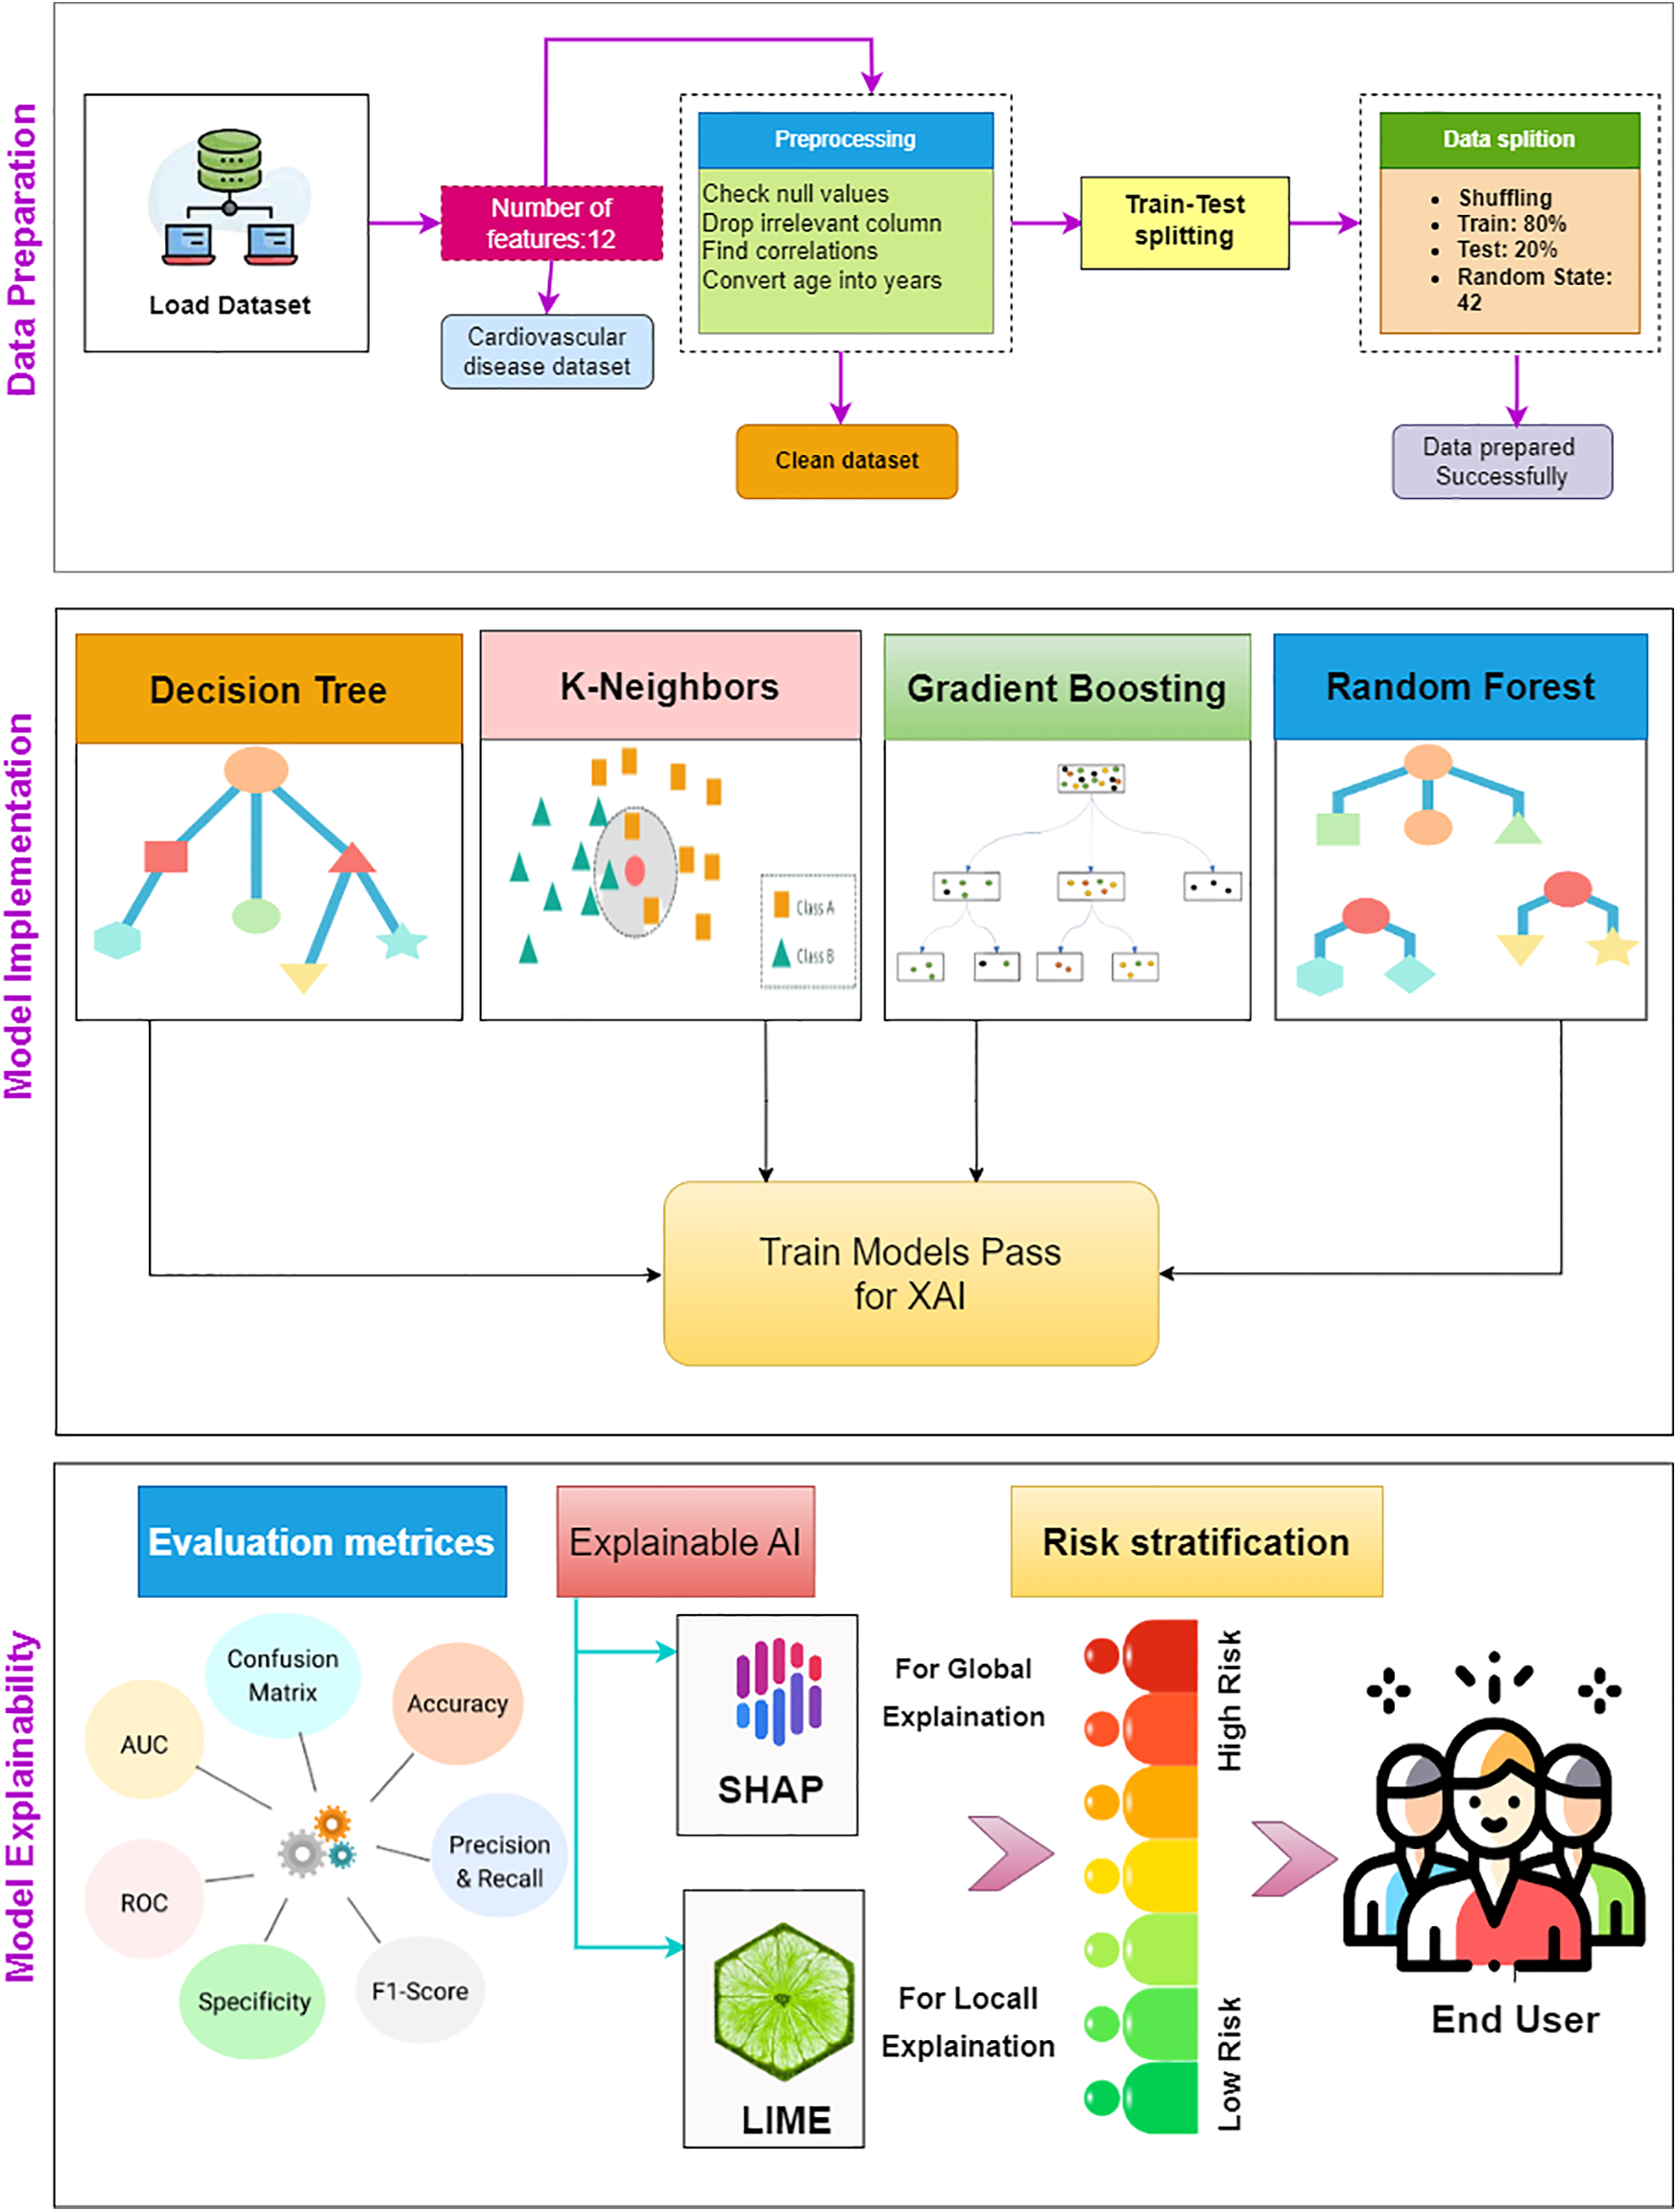
Figure 1: Schematic representation of the proposed AI-enabled framework
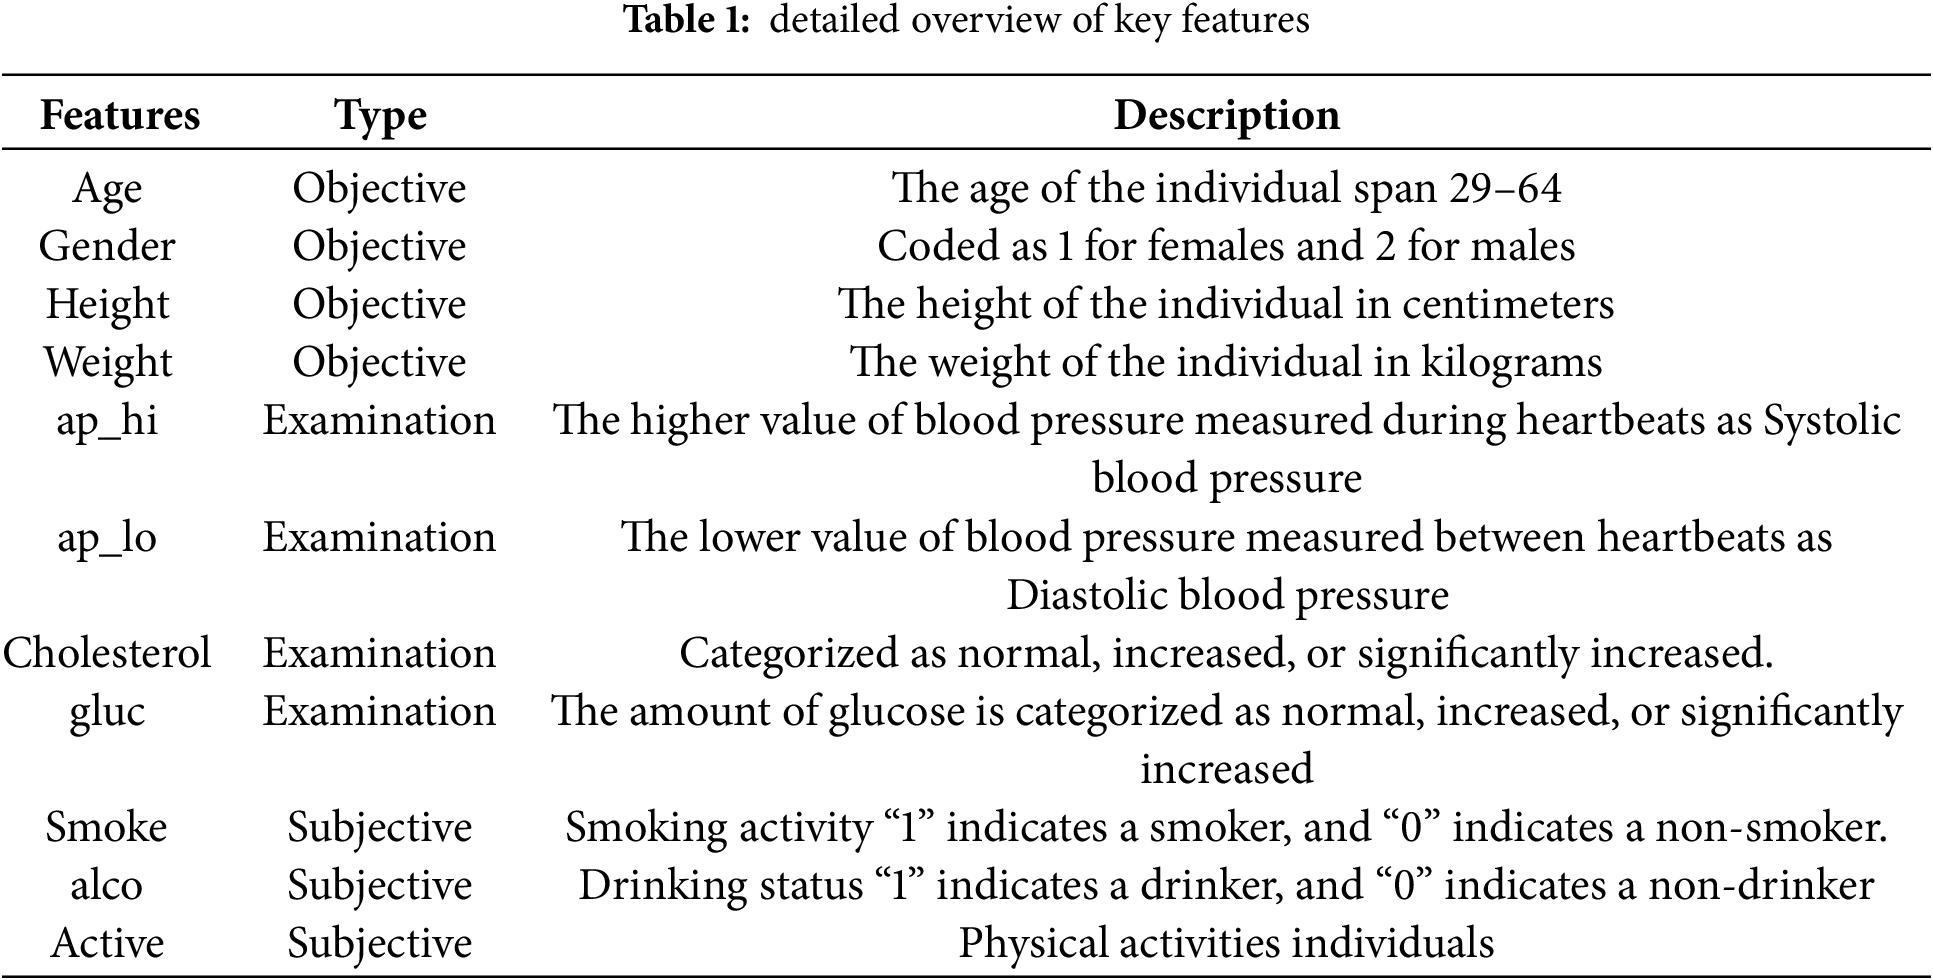
The cardiovascular dataset acquired from Kaggle [42], comprising 70,000 records and 12 features, is used in this work to classify cardiovascular disease. The input features are distinguished into three categories: i) objective features, including gender, age, height, and weight, examination, and subjective ii) subjective features, which include the information provided by the patient, such as whether an individual smoke, drink (alco), etc., iii) examination features show the outcomes of medical reports. Subjects’ gender attributes with values 1 and 2 indicate female or male, respectively. The influence is computed using the diastolic and systolic blood pressure measurements. The patient’s cholesterol and glucose values are given as normal, increased, or significantly increased. Similarly, the patient’s smoking and drinking habits are represented by the binary values of “1” for smokers/drinkers and “0” for non-smokers/non-drinkers. Patients who participated in consistent physical exercise were assigned a value of “1”, while those who did not were assigned a value of “0”. Table 1 provides a detailed description of all the features in the dataset used in this study.
The age distribution by gender within the CVD dataset is illustrated in Fig. 2. The fundamental exploratory analysis shows that males are more prevalent across most age groups, with a significant concentration of individuals aged between 50 and 60. Fig. 3 illustrates the correlation between numerical variables in the dataset. The correlation values range from −1 to 1, where a value close to 1 indicates a strong positive correlation, meaning that as one variable increases, so does the other. In contrast, a value close to −1 indicates a strong negative correlation, where one variable increases as the other decreases. Notable correlations include a moderate positive correlation between age and cardiovascular disease, with a value of 0.24, suggesting that older individuals are more likely to have cardiovascular issues. Likewise, there is a positive correlation between cholesterol level and cardiovascular disease, with a value of 0.22. There is also a notable correlation between gender and smoking, with a value of 0.34, which might suggest differences in smoking habits across genders. These correlations can provide insights into the relationships within the data and are helpful for further analysis or modeling.
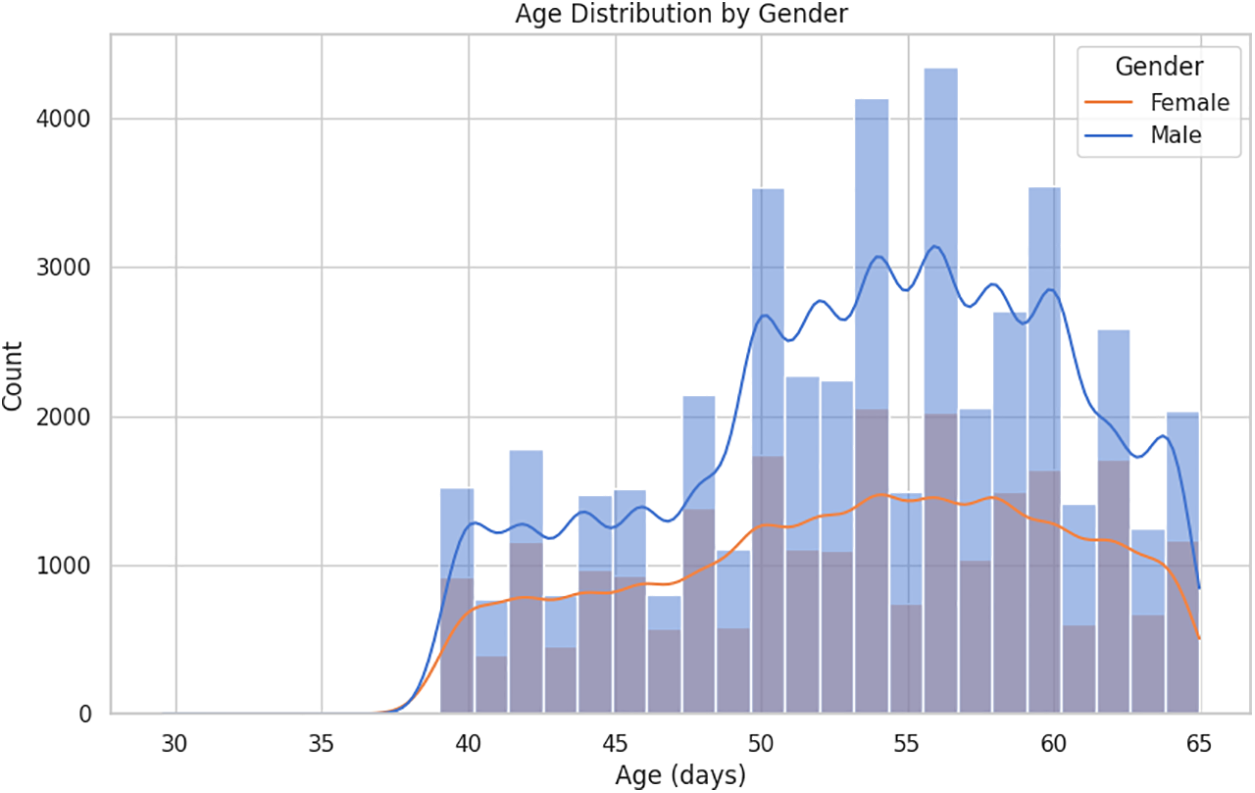
Figure 2: Age distribution by gender
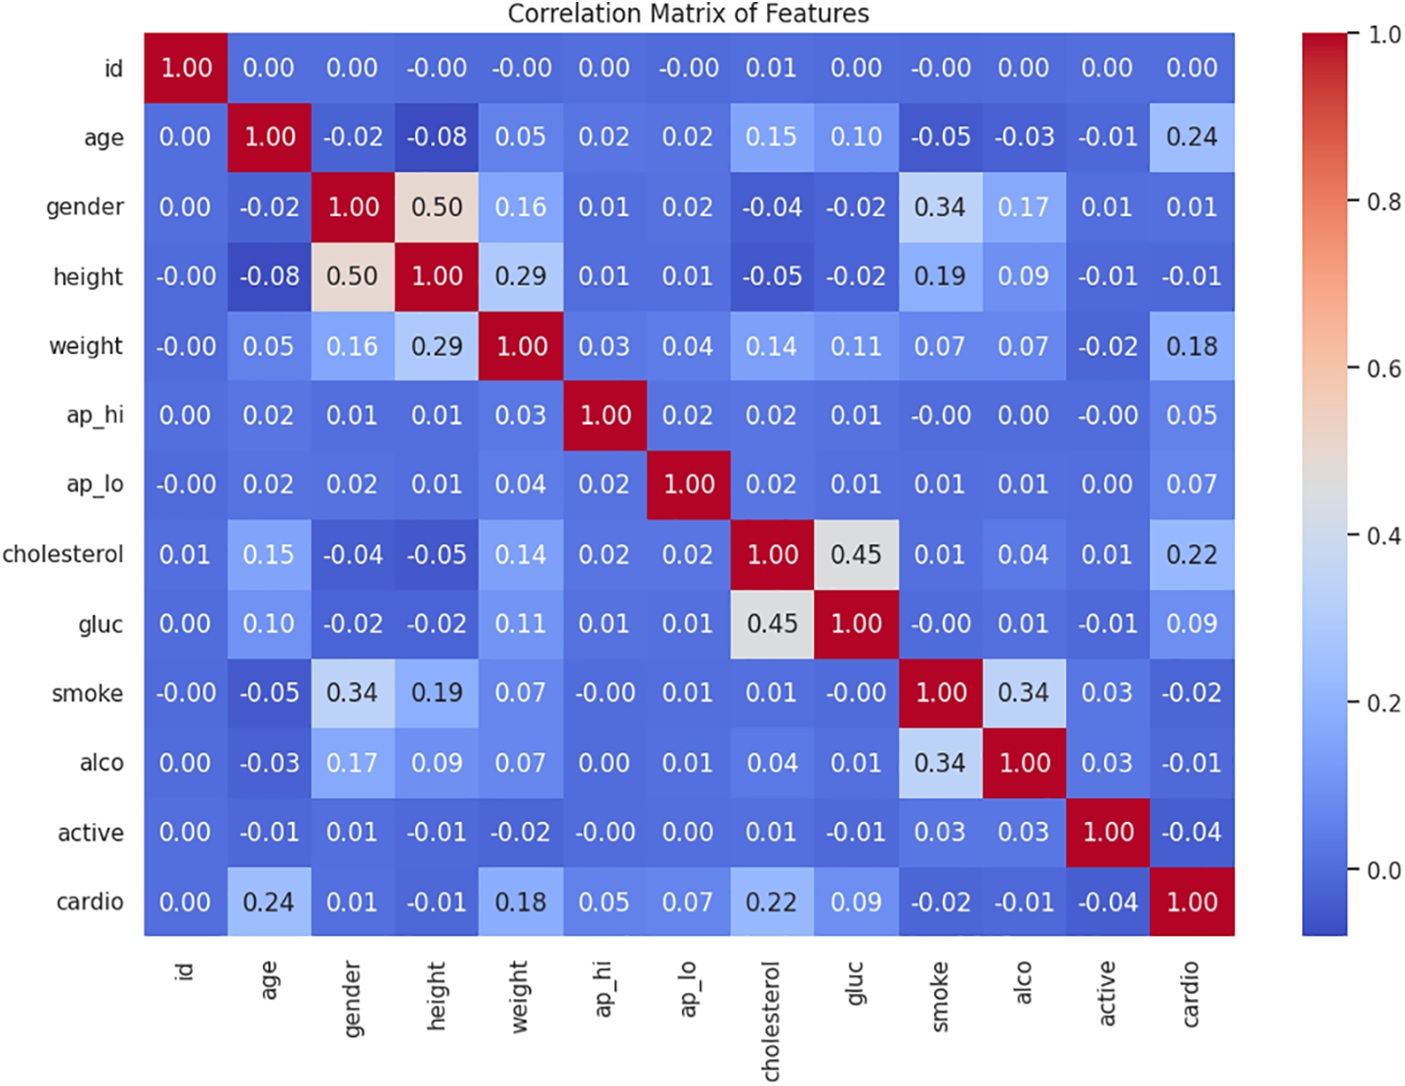
Figure 3: Heatmap of Pearson correlation for all numeric attributes
Preprocessing of the data is a critical phase in ML since the quality of the data and the information that can be extracted from it directly affects how well our model can learn. Handling null and categorical variables, as well as standardization, are the basic preprocessing techniques. In this section, we have presented the preprocessing steps used to preprocess the dataset to use in subsequent stages of the analysis. The objective is to predict the patient’s age-related risk factors, it may be challenging to interpret the patient’s age in days. Therefore, we transformed the age into years so that it is easier to understand the age range affected by cardiovascular disease. We changed the data type of attributes, such as weight and age, into integers. Additionally, we discarded the patient “id” since it is unnecessary for predictive analysis.
3.3 Machine Learning (ML) Module
In this article, we used four ML classifiers, including K-nearest neighbor (KNN), decision tree (DT), random forest (RF), and Gradient Boosting (GB) classifier to predict cardiovascular disease. These ML methods are chosen for their synergistic strengths in handling non-linear and intricate interactions within the dataset. The KNN model is a simple and interpretable model which is efficient for preliminary classification. DT model can effectively elucidate the hierarchy of features due to their intrinsic interpretability. In contrast, GB and RF models are ensemble techniques recognized for enhancing predictive accuracy and mitigating overfitting. Consequently, the proposed framework, comprised of a varied set of ML models, enhances prediction performance and adaptability to diverse patient data by utilizing various algorithms. The selected models are trained on 80% of the CVD dataset, and the remaining 20% is used to evaluate the model’s performance. The subsequent section provides an overview of these ML classifiers and the details of the specific parameter tunings of these models.
3.3.1 K Nearest Neighbor (KNN)
K-Nearest Neighbors (KNN) is a versatile instance-based learning algorithm for classification and regression tasks. It classifies or predicts the value of a query instance based on the majority vote or average of its K-nearest neighbors, determined by a chosen distance metric. While KNN is easy to implement and makes no assumptions about data distribution, it can be computationally intensive and sensitive to the curse of dimensionality. Optimizations like weighted KNN and k-d trees can enhance its efficiency. Despite these limitations, KNN remains a valuable tool in various applications, including image recognition and text categorization. KNN classifier is initialized with the hyperparameter n_neighbors set to 20. This means the model will consider the 20 closest data points when making predictions. The choice of the number of neighbors in the KNN algorithm can vary depending on the dataset and problem at hand. In this specific case, the value of 20 is selected because it resulted in improved accuracy compared to other tested values.
Decision Trees (DT) are a widely used machine learning algorithm for classification tasks, including CVD prediction. The DT classifier is a non-parametric method that categorizes instances by arranging them in a tree from the root to a leaf node, which offers the classification of the instance. In this work, we used the default “best” splitter and the Gini criterion for training the DT classifier, achieving high accuracy, precision, recall, and F1-score. DT classifier is instantiated and trained using the following parameters: Random_State = 42: This parameter sets the random seed for reproducibility. By setting it to 42, the same random sequence will be generated each time the code is run, ensuring consistent results. max_depth = 30: This parameter specifies the maximum depth of the decision tree. It limits the number of levels or splits in the tree. In this case, the maximum depth is set to 30, meaning the tree can have up to 30 levels. Criterion = ‘gini’ determines the impurity measure used to make decisions.
The Random Forest algorithm is a supervised learning technique consisting of many decision trees operating as an ensemble. In this approach, the model leverages multiple trees to make a collective decision by averaging their predictions. Each tree in the Random Forest votes on the outcome and the class with the most votes is selected as the final prediction. Random Forests reduce overfitting problems by building trees from distinct subsets of the data. This makes them particularly effective on large datasets, even when some data points are missing. RF classifier is instantiated using max_depth = 50, random_state = 42, and n_estimators = 40, determining the number of decision trees (or estimators) to be created in the random forest.
Gradient Boosting (GB) is an ensemble learning technique that combines several weak learning models, typically decision trees, to produce a robust predictive model by building trees sequentially, with each new tree correcting the errors of previous ones. This iterative approach enables GB to capture complex patterns in the data effectively. In this study, we employed the GB classifier to predict CVD and achieved high accuracy, precision, recall, and F1-score, demonstrating significant improvement in predictive performance. GB classifier is initiated with some example parameter values: n_estimators = 100 indicates that we want to train 100 weak learners, learning_rate = 0.1 sets the learning rate to 0.1, max_depth = 3 limits the depth of each decision tree to 3, and subsample = 0.8 means that each weak learner is trained on a random 80% subset of the training data.
3.4 eXplainable AI (XAI) Module
This section presents the XAI module of the proposed AI-enabled framework to demonstrate and explain the model’s predictions. With the advancement of AI, it is easy to diagnose the disease at its early stages. However, these models are still regarded as black-box, and their predictions and results are not understandable to end users because of their complexity and highly layered structure. By utilizing strategies that end users typically use to describe systems, such as visual or feature relevance explanations, post hoc explainability techniques provide transparent information about how an implemented model makes its predictions. Previously, several ML models were implemented to predict CVD. Still, these cannot explain how a model can accurately anticipate a specific result and make predictions and which attributes contribute more or less to making a decision. In addition to implementing ML classifiers, XAI is also employed, which is concerned with creating novel techniques for interpreting and explaining ML model’s predictions. For this purpose, LIME and SHAP are implemented to provide a local and global explanation of how the models make their predictions.
3.4.1 Local Interpretable Model-Agnostic Explanations (LIME)
LIME stands for Local Interpretable Model Agnostic Explanation, in which LIME provides explanations for the model’s predictions at an individual level, highlighting the influence of particular features on a case-by-case basis, which is especially beneficial for patient-specific assessments. Several explainers in LIME explain the impact of single instances, i.e., lime tabular, text, and image explainers. In this work, a tabular dataset of patients is used to predict cardiovascular disease; consequently, we have used a tabular explainer in LIME to interpret the results and predictions made by ML classifiers. It works with several parameters necessary for the LIME explanation, such as training data, feature names, class names, and the mode of the problem. For training data, the 2D NumPy array is passed to the LIME explainer, feature names are the list of strings corresponding to attributes in the training data, and the class name is the list of classes used by the explainer (such as Class 0, and Class 1). Furthermore, LIME used the “classification” mode to predict the non-cardio class and cardio class. With the implementation of the LIME model, the input data will be represented in a way that can be easily comprehended by the end users [45]. Due to this, LIME’s output is a list of justifications that emphasize how each characteristic contributed to the estimation of sample data. The Euclidean distance between the two points is calculated to show how far the modified data point is from the initial observation. It indicates which feature(s) of the input data is beneficial for making predictions. The key objective is to develop a trustworthy, understandable explanation of the model’s predictions, which can be achieved by using Eq. (1).
where O represents the original implemented model, a represents the Interpreted model, z represents observations of the original model,
3.4.2 SHapley Additive exPlanations (SHAP)
The results produced by the ML methods need to be interpreted locally and globally for the predictions and results produced to be better explainable. Despite the excellent explainability power at the local level, LIME cannot explain the model at the global level. For this purpose, SHAP is used to enhance the interpretation of the outcome [46]. It has a model-agnostic kernel Explainer, TreeExplainer, DeepExplainer, and LinearExplainer to explain the classifications and results of the models. As discussed earlier, different machine learning models are implemented for cardiovascular disease prediction, i.e., Random Forest, Decision Tree, and Gradient Boosting. In this work, we have used Tree Explainer in the SHAP approach to interpret all these tree models. Then, the SHAP values are compared with the model’s expected values, enhancing its interpretability. Plotting the SHAP values of a feature against its value for each sample in a dataset can assist us in understanding how a particular feature affects the model’s output. To determine the relative value of each input feature for a specific prediction, SHAP applies the concepts of cooperative game theory. The players in the game have a set of strategies and some sort of reward, and SHapley values are used to disclose the contributions of the many players in the game. Strategies are denoted as outcomes procedures, where the player represents variables/features, and the reward means the achieved results. Here, Shapley values show how a specific attribute affected the final prediction. The following Eq. (2) is used to find players’ contributions.
where N represents the number of participants/ features, C represents the subset of N, Z represents the contribution of a random player, and values represent the total values for player C.
The results of the ML models are evaluated using different performance evaluation metrics, including accuracy, precision, recall, and F1-score. These metrics are calculated using a confusion matrix, which presents the true classes and model-predicted classes in a table like structure and indicates the errors and correct classifications made by the classifier. The confusion matrix of binary class classification (0 and 1) is shown in Fig. 4. The confusion matrix is defined using four different terminologies, including True positive (TP), which indicates the number of actual positive classes (‘1’) predicted as positive (‘1’). False Positive (FP) indicates the number of classes the model predicted as positive (‘1’), while these belong to the negative class (‘0’). True Negative (TN) indicates the number of actual negative classes (‘0’) predicted as negative (‘0’). False Negative (FN) indicates the number of classes the model predicted as negative (‘0’), while these belong to the positive class (‘1’). The accuracy, precision, recall, and F1-score are calculated using the terms used in the confusion matrix, and Eqs. (3)–(6) represent the accuracy, precision, recall, and F1-score, respectively.
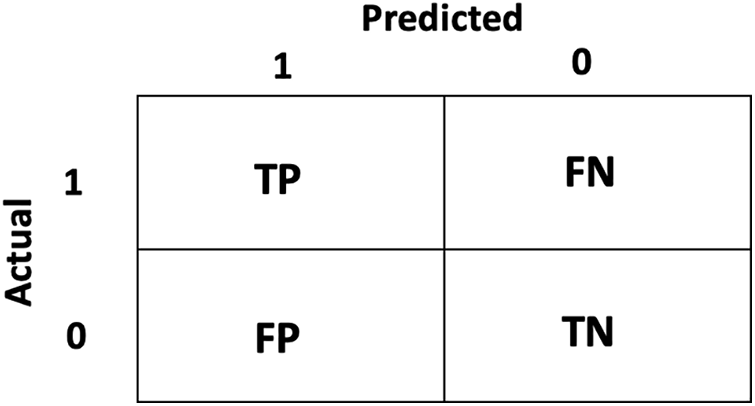
Figure 4: Confusion Matrix indicating the binary class classification
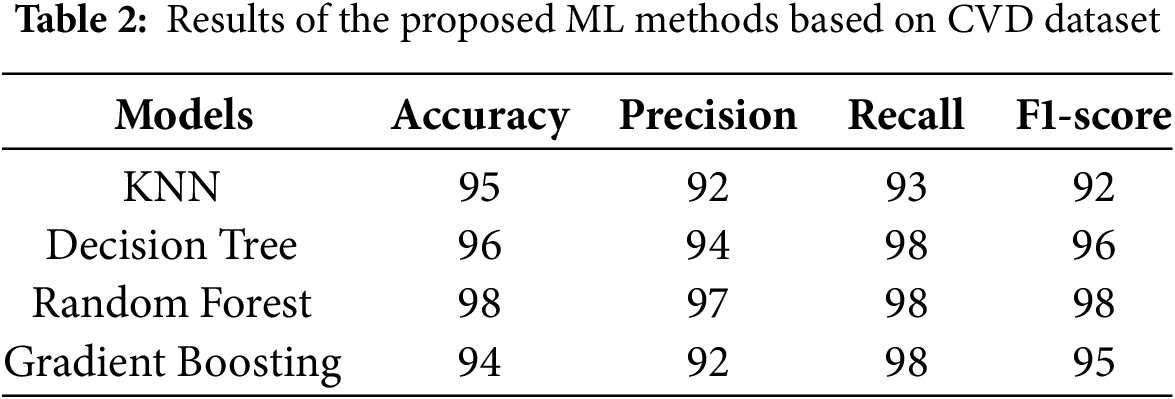
The comparison of results obtained by ML classifiers used in this study is indicated in Table 2. The results indicate that the RF classifier achieves the highest accuracy of 98%, precision of 97%, recall of 98%, and F1-score of 98% for predicting CVD, which indicates overall significant performance in identifying true positives and minimizing false negatives. The DT model indicates slightly less predictive performance than RF with accuracy, precision, recall, and F1-score of 96%, 94%, 98%, and 96%, respectively. However, DT provided the advantage of being inherently interpretable. Table 3 indicates that KNN yields an accuracy of 95%, with a precision of 92% and a recall of 93%. Likewise, GB yields an accuracy of 94%, with precision, recall, and F1-score of 92%, 98%, and 95%, respectively. GB was particularly effective at minimizing false negatives but required fine-tuning to balance performance and overfitting.
This section explains the explainability of implemented models, which establishes the importance of each feature and its impact on the decision-making process. Both local and global aspects serve as an illustration of the explainability. The key elements of the dataset that can be used with LIME and SHAP force diagrams are highlighted in the local explanation. The significance of the attributes to a set of data, for instance, all test data, is shown in the global explanation. The violin distribution summary plot with all the test data is utilized for a global explanation. The implemented models’ number of correct observations mostly shows patients have cardio disease. The Decision Tree, Random Forest, KNN, and Gradient Boosting are used with eXplainable AI methods to determine predictions. Experts could quickly ascertain whether the models were performing accurately using eXplainable AI.
4.2.1 Local Explanations Using Lime
The LIME interpretability plot illustrates the contribution of various features to the model’s prediction for a specific subject. In the LIME explainer, a single random instance is chosen and passed to the LIME explainer with a particular model’s predictions to evaluate the influence of each attribute. The LIME interpretability plot displays the effect of each feature on the target class, indicating whether it has a positive or negative impact on that particular class prediction. This helps understand the contribution and effect of individual features on the model prediction for CVD. The LIME interpretability plot for the importance of individual features on the predictions made by the RF model is shown in Fig. 5. The features on the right side of the vertical line, represented in orange, indicate that these features contribute positively to the model’s prediction, which specifies that these features increase the risk of CVD. In contrast, the features on the left side of the vertical line, represented in blue, indicate that these features contribute negatively to the model’s predictions, which specifies that these features contribute to decreasing the risk of CVD. Furthermore, the length of the bar (orange or blue) represents the strength of each feature on the model’s prediction. For example, Fig. 5 illustrates that the RF model predicts Class 1 (cardio) with a high probability of 0.88, influenced mainly by features such as systolic blood pressure (ap_hi) exceeding 120.00 and age greater than 58.00. Other contributing factors include the patient’s non-consumption of alcohol and a cholesterol level of 2.00. The specific feature values for this prediction are a systolic blood pressure of 140.00, age of 59, diastolic blood pressure of 80.00, weight of 64.00, glucose level of 1.00, and cholesterol level of 2.00, with no alcohol consumption or smoking. This is the benefit of using LIME, in contrast to the interpretability of traditional DT or RF feature importance capability, that LIME interpretability plot indicates the significance of critical features along with their positive/negative impact and the strength of features; influence on the CVD disease predictions.
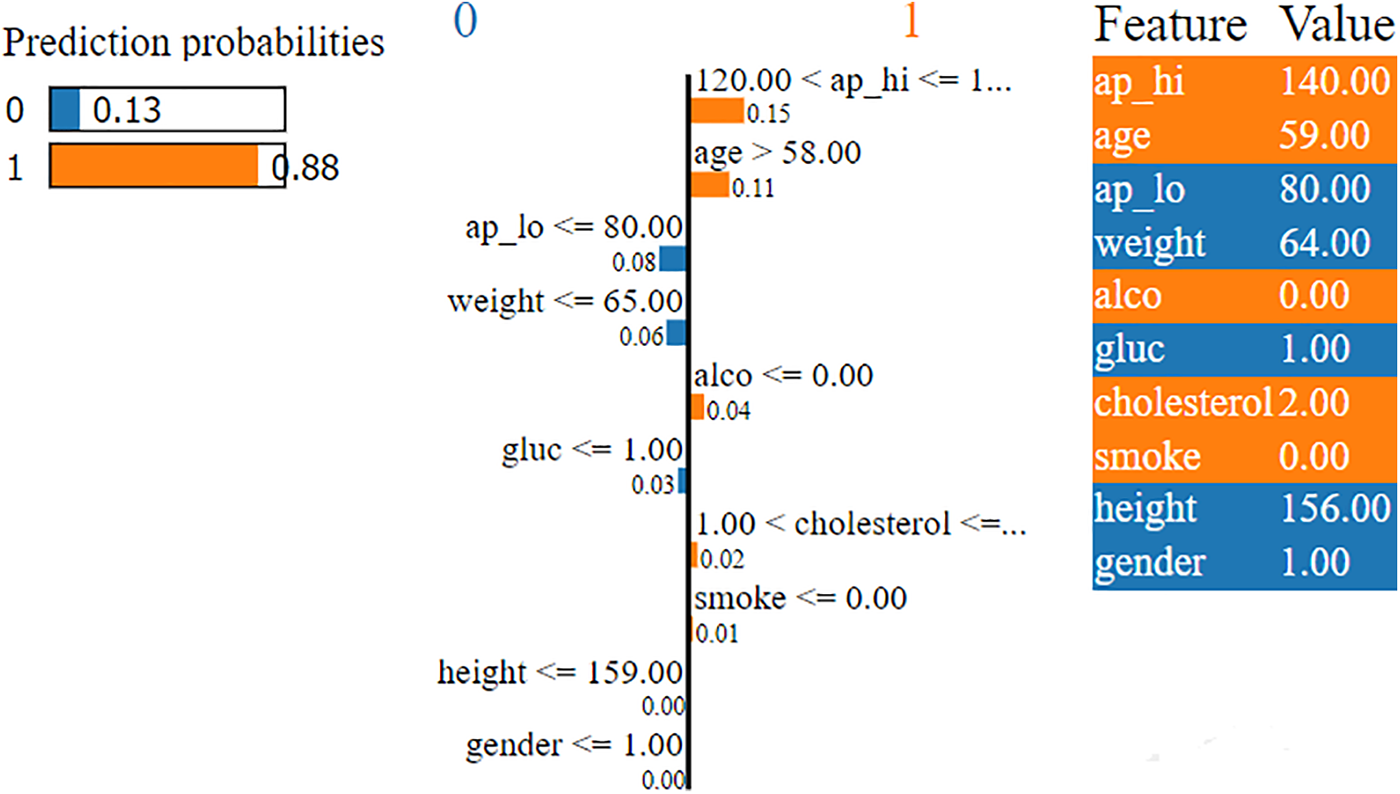
Figure 5: LIME explanation of predictions made by Random Forest
Similarly, Fig. 6 illustrates the prediction probabilities of the DT model, which indicates a high likelihood (1.00) for Class 1, signifying that the model strongly predicts the outcome as Class 1 (cardio). The LIME interpretability plot also indicates that these predictions are influenced mainly by age features, with “age > 58.00” contributing the most (0.12) to Class 1. Other important factors include “
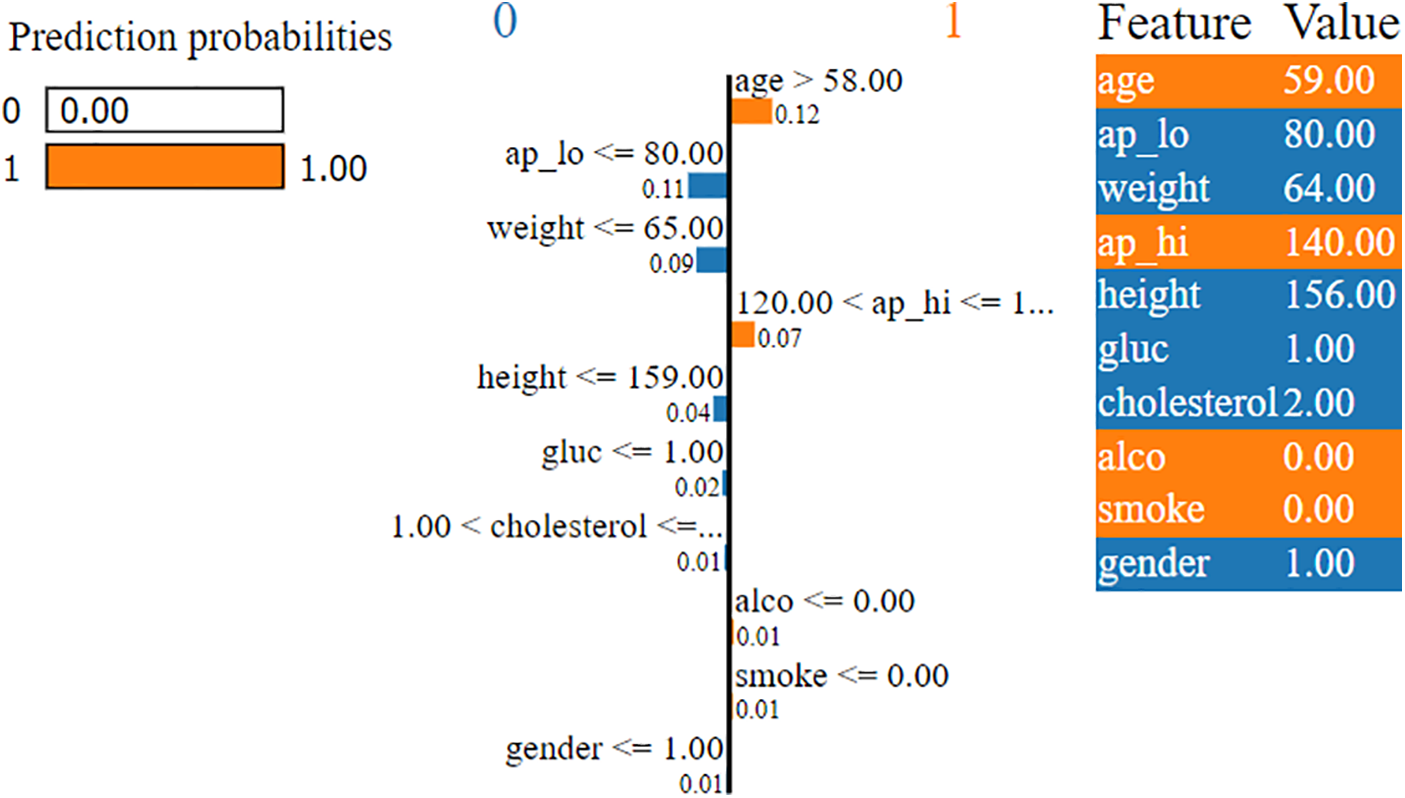
Figure 6: LIME explanation of predictions made by Decision Tree
4.2.2 Global Explanations Using SHAP
SHAP-based XAI provides the explainability and interpretability to model predictions at the global level using several visualization plots, including SHAP summary plot, mean SHAP value plot, SHAP force plot, SHAP waterfall plot, and SHAP Bee Swarm plot. The SHAP summary plot provides a visual summary of the feature significance and respective influence on the model’s predictions at the global level. The global explanation visualizes all the data in a single, easily readable plot. The features are listed on the y-axis, and the importance of each feature is represented along the x-axis, with the highest feature contributing the most to making predictions and the lowest feature contributing the least, if any, to the predictions. When the shape value is 0, no contribution is made by that particular feature in the SHAP summary plot, but as the shape value drops, contributions increase. Each circle in the plot represents a single data point. The color of the dot indicates the value of the features, the blue color represents the lower value of a particular feature, and the red color represents the high value of that specific feature. For instance, Fig. 7 illustrates the SHAP summary plots of the RF model predictions for Class 0 (non-cardio). It can be seen from the plot that ‘ap_hi’ and ‘age’ had the most significant influence on the model predictions. Additionally, it can be noted that the broader areas against the ap_hi feature are on the left side, which indicates the higher density of samples, suggesting that these data points are more common for ap_hi for the non-cardio class. It can be derived from the plot that lower cholesterol levels and younger ages have positive SHAP values, which suggests a lower risk of CVD. In contrast, features like alcohol and smoking tend to have negative SHAP values, which indicates that alcohol consumption and smoking could contribute to a higher risk of CVD. The SHAP summary plot for Class 1 (cardio) is shown in Fig. 8. It can be seen from the plot that features such as ap_hi, age, ap_lo, and cholesterol tend to have positive SHAP values, which suggests a higher level of these features is associated with increased CVD risk. On the other hand, the features such as alcohol and smoke show a mix of SHAP values, which indicates varying impacts on the prediction.
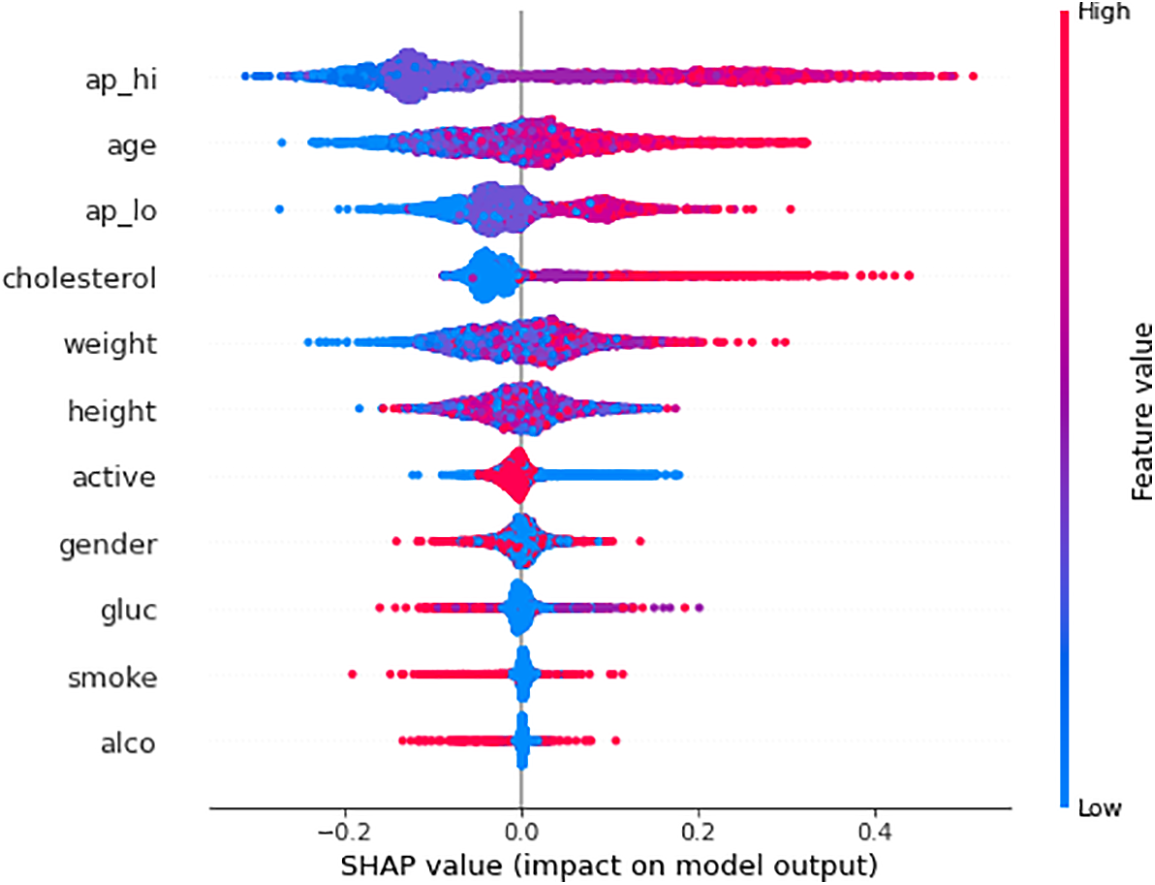
Figure 7: SHAP summary plot of RF model predictions for Class 0 (Non-CVD)
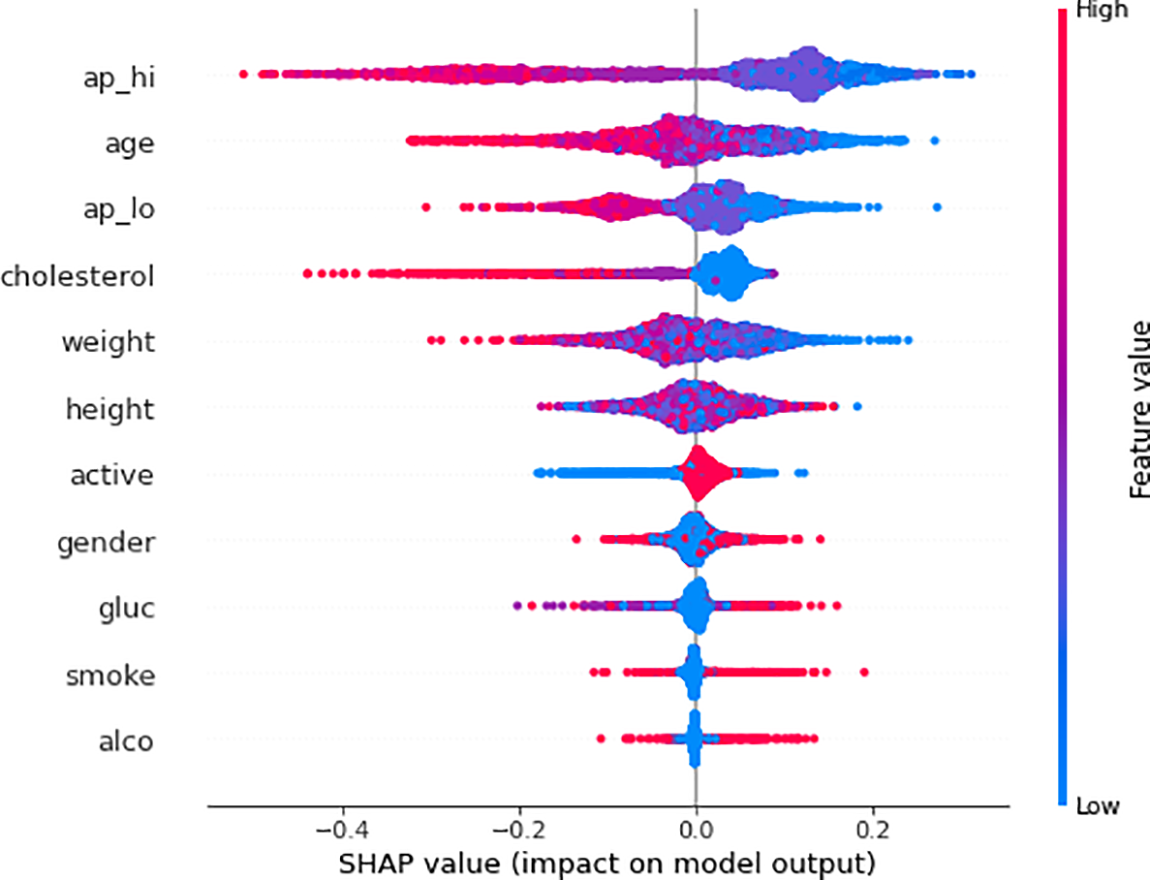
Figure 8: SHAP summary plot of RF model predictions for Class 1 (CVD)
Fig. 9 illustrates the mean SHAP value plot (also known as the SHAP bar plot), which visualizes the mean impact of each feature on the model’s predictions for Class 0 and Class 1. It can be seen from the mean SHAP value plot that age and systolic blood pressure (ap_hi) are the most significant features driving the ML model’s predictions, particularly in determining the likelihood of cardiovascular disease (Class 1). Age has the most substantial impact, significantly increasing the probability of a positive prediction for cardiovascular disease, followed by ap_hi and weight. The plot uses color to indicate how each feature contributes to the model’s predictions, with red indicating influence towards non-cardiovascular (Class 0) and blue towards cardiovascular disease (Class 1). This means the SHAP value plot reveals the critical features (such as age, ap_hi, and weight) that are crucial in predicting cardiovascular outcomes.
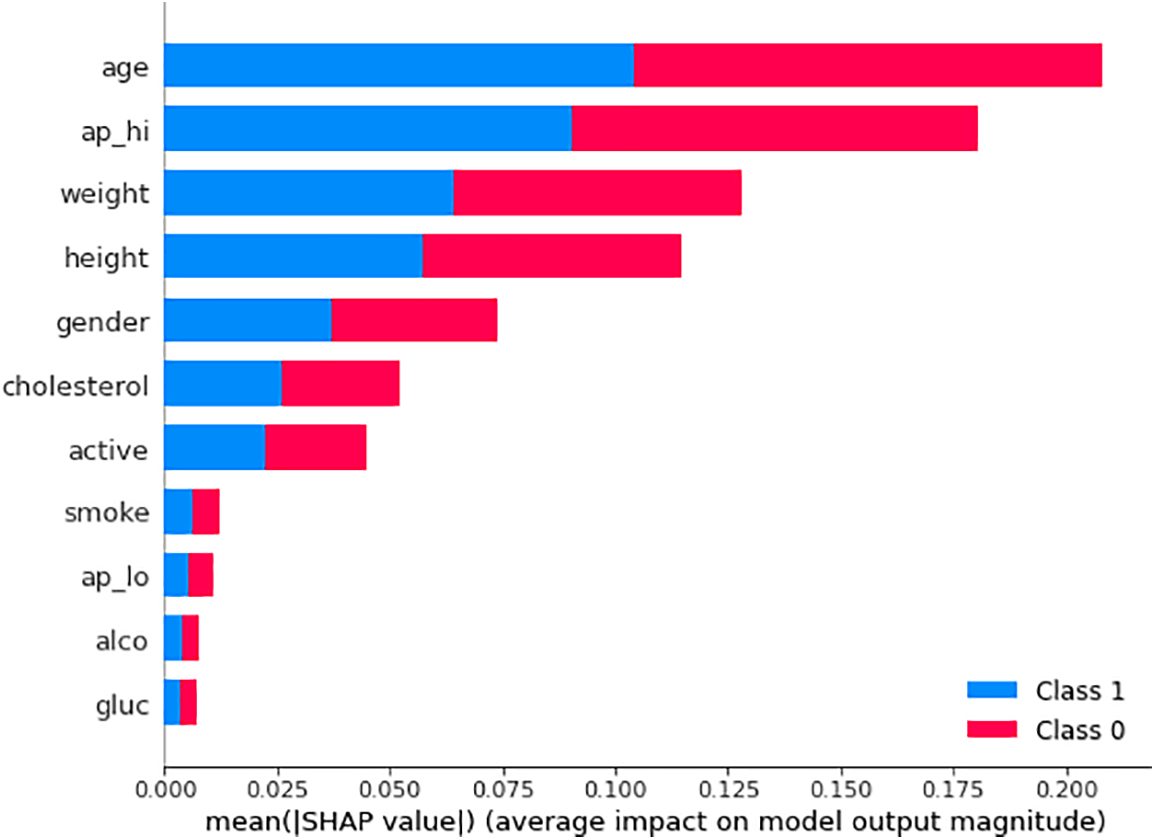
Figure 9: Mean SHAP value plot
The SHAP waterfall plot is illustrated in Fig. 10, which indicates the contribution of various features to the model’s output for a specific prediction. The x-axis represents the SHAP values, which indicate the impact of each feature on the prediction. Features with positive SHAP values push the prediction higher, while those with negative values make it lower. The feature ap_hi has the most significant negative impact on the prediction, reducing the predicted value by 0.32. ap_lo (diastolic blood pressure) also has a negative impact but is smaller (−0.1). Other features like weight, age, and height have smaller negative impacts, while features like cholesterol slightly increase the prediction. The model’s final prediction (f(x)) is 0.075, slightly above the base value, indicating a low risk according to the model.
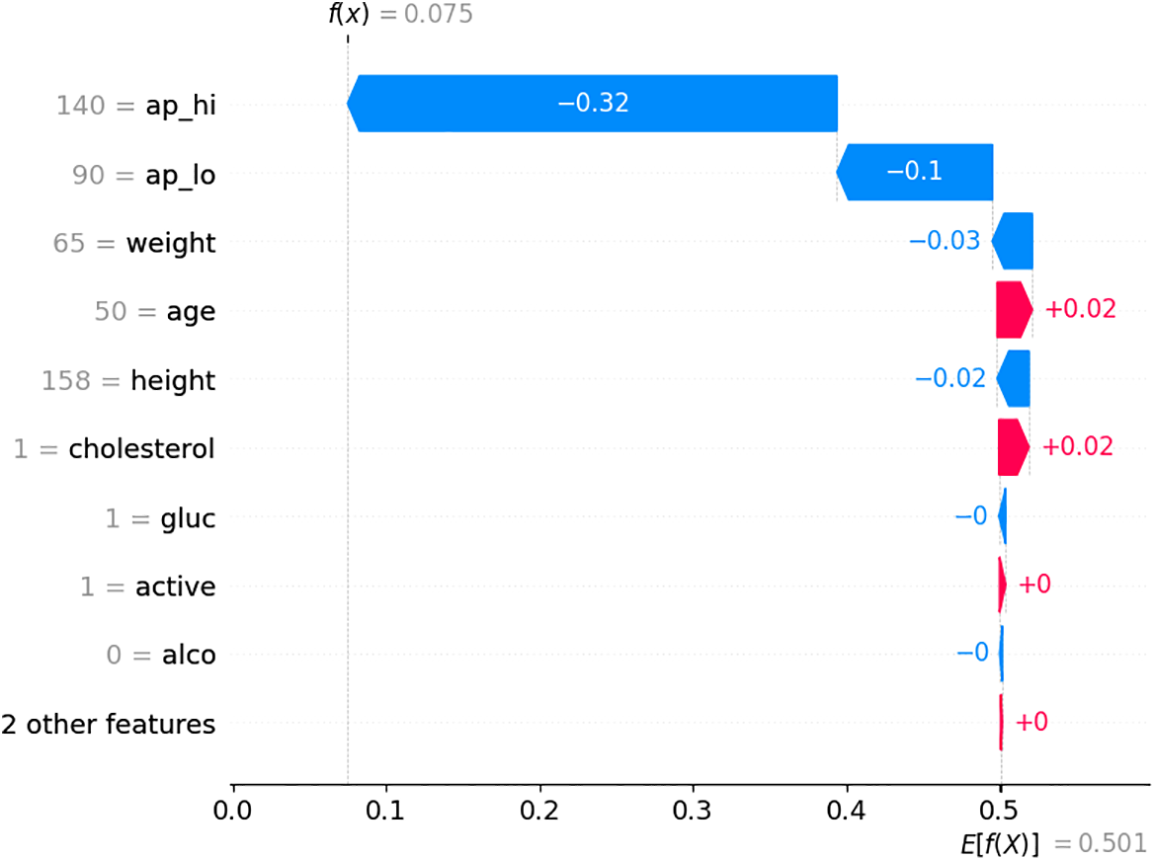
Figure 10: SHAP waterfall plot
Fig. 11 provides a sequential breakdown of how each feature’s contribution leads to the final prediction. The base value starts at 0.51, the average model prediction before considering any specific feature values. Features like ap_lo (80.0), height (156.0), active (1.0), cholesterol (1.0), and ap_hi (120.0) push the prediction down (left, red), indicating they reduce the probability. In contrast, features like age (61.0) and gender (1.0) push the prediction up (right, blue), increasing the likelihood. The plot visually breaks down each feature’s positive and negative influences on the final prediction. This plot effectively shows how each feature adds or subtracts from the base value, leading to the final model output.
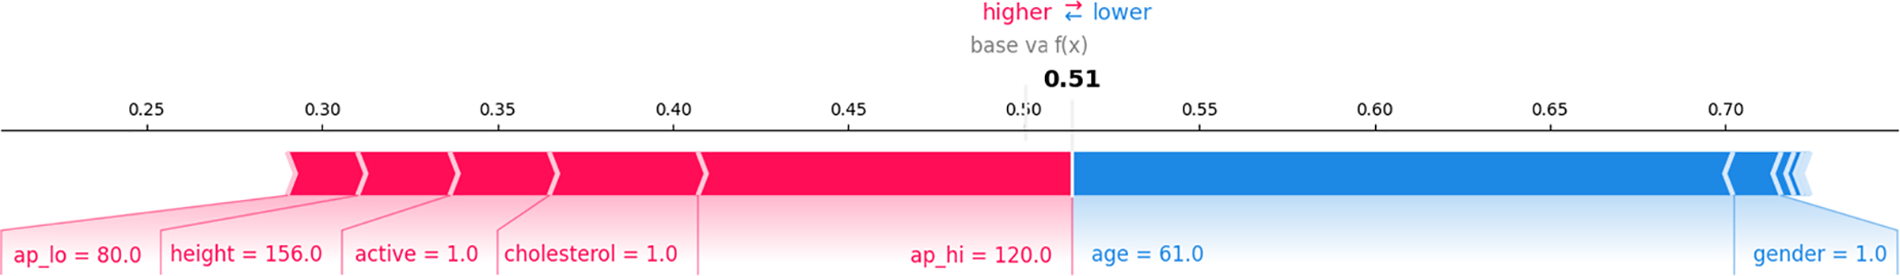
Figure 11: SHAP force plot
Fig. 12 shows the impact of each feature across multiple predictions, not just a single instance. Each dot represents a single prediction, with its position along the x-axis showing the SHAP value (impact) and its color representing the feature value (red for high values, blue for low values). The features are sorted by their overall importance, with ap_hi (systolic blood pressure) having the most significant impact across predictions. For example, higher values of ap_hi (red dots) tend to decrease the prediction, as shown by the dots on the left, while lower values (blue dots) have a less significant impact. The plot visually demonstrates how different values of features like age, cholesterol, and blood pressure influence the model’s predictions across the dataset.
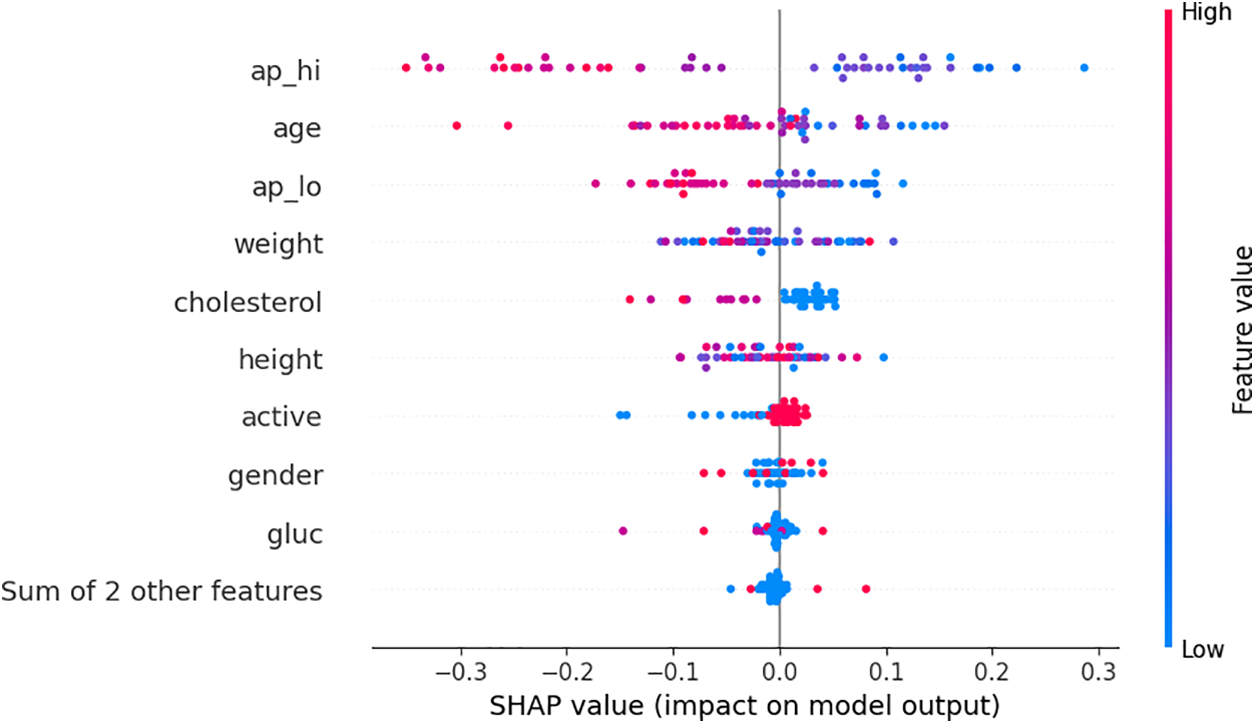
Figure 12: Bee swarm plot
These SHAP visualizations are crucial for understanding and interpreting the predictions of an ML model, particularly in complex, high-stakes domains like healthcare. The proposed XAI module provides significant insights into how different features, such as blood pressure, age, and cholesterol level, contribute to the model’s decisions in classifying CVD individuals. The mean SHAP value plot helps identify the most influential features for a specific prediction, the SHAP waterfall plot shows the cumulative effect of each feature on the final prediction, and the SHAP Bee swarm plot offers a broader view of how features impact predictions across the dataset. This work aims to ensure that the model’s decisions are transparent, justifiable, and aligned with domain knowledge, essential for building trust in the model and making informed decisions based on its outputs. In summary, these findings indicated that the proposed XAI framework, comprised of SHAP and LIME integrated into the ML model, facilitates local and global interpretability of the model’s predictions. SHAP provides a comprehensive perspective on feature importance across the entire dataset, quantifying the contribution of each feature towards the overall model prediction. In contrast to SHAP, LIME provides explanations at an individual prediction level, highlighting the influence of particular features on a case-by-case basis, which is especially beneficial for patient-specific assessments. Together, the proposed XAI framework offers a detailed explainability and interpretability of the model’s predictions, enhancing the framework’s transparency and dependability for clinical application. Consequently, this will help doctors and clinicians to identify high-risk patients and personalized treatment plans according to the most critical contributing factors. For example, if high blood pressure and cholesterol are significant risk factors, clinicians can prioritize interventions to address these risk factors. This strategy encourages personalized treatment approaches, allowing medical professionals to attend to each patient’s health needs and possibly enhancing patient outcomes by concentrating on the most critical risk factors. Overall, The findings of the proposed AI-enabled framework provide substantial benefits compared to traditional ML techniques for diagnosing CVD. Despite the significant results of traditional ML methods, these methods often lack the interpretability and explainability of the predictions due to their “black box” characteristics, which often lack transparency. However, the proposed framework utilizes data-driven insights to discern nuanced patterns and interactions among risk factors that may be overlooked. Moreover, incorporating XAI techniques improves the transparency of the model’s predictions, enabling clinicians to comprehend and have confidence in the decision-making process. This integration of high accuracy (by ML methods) in predicting CVD and the explainability and interpretability of these predictions (by XAI framework) signifies progress in personalized medicine, offering more precise, data-driven care customized to particular patient profiles. Furthermore, the proposed eXplainable AI framework is model-agnostic, allowing for interpreting diverse machine learning models across different domains. This adaptability enables the proposed framework to be applied to CVD diseases and several other medical and clinical tasks where comprehending feature contributions is essential for therapeutic decision-making.
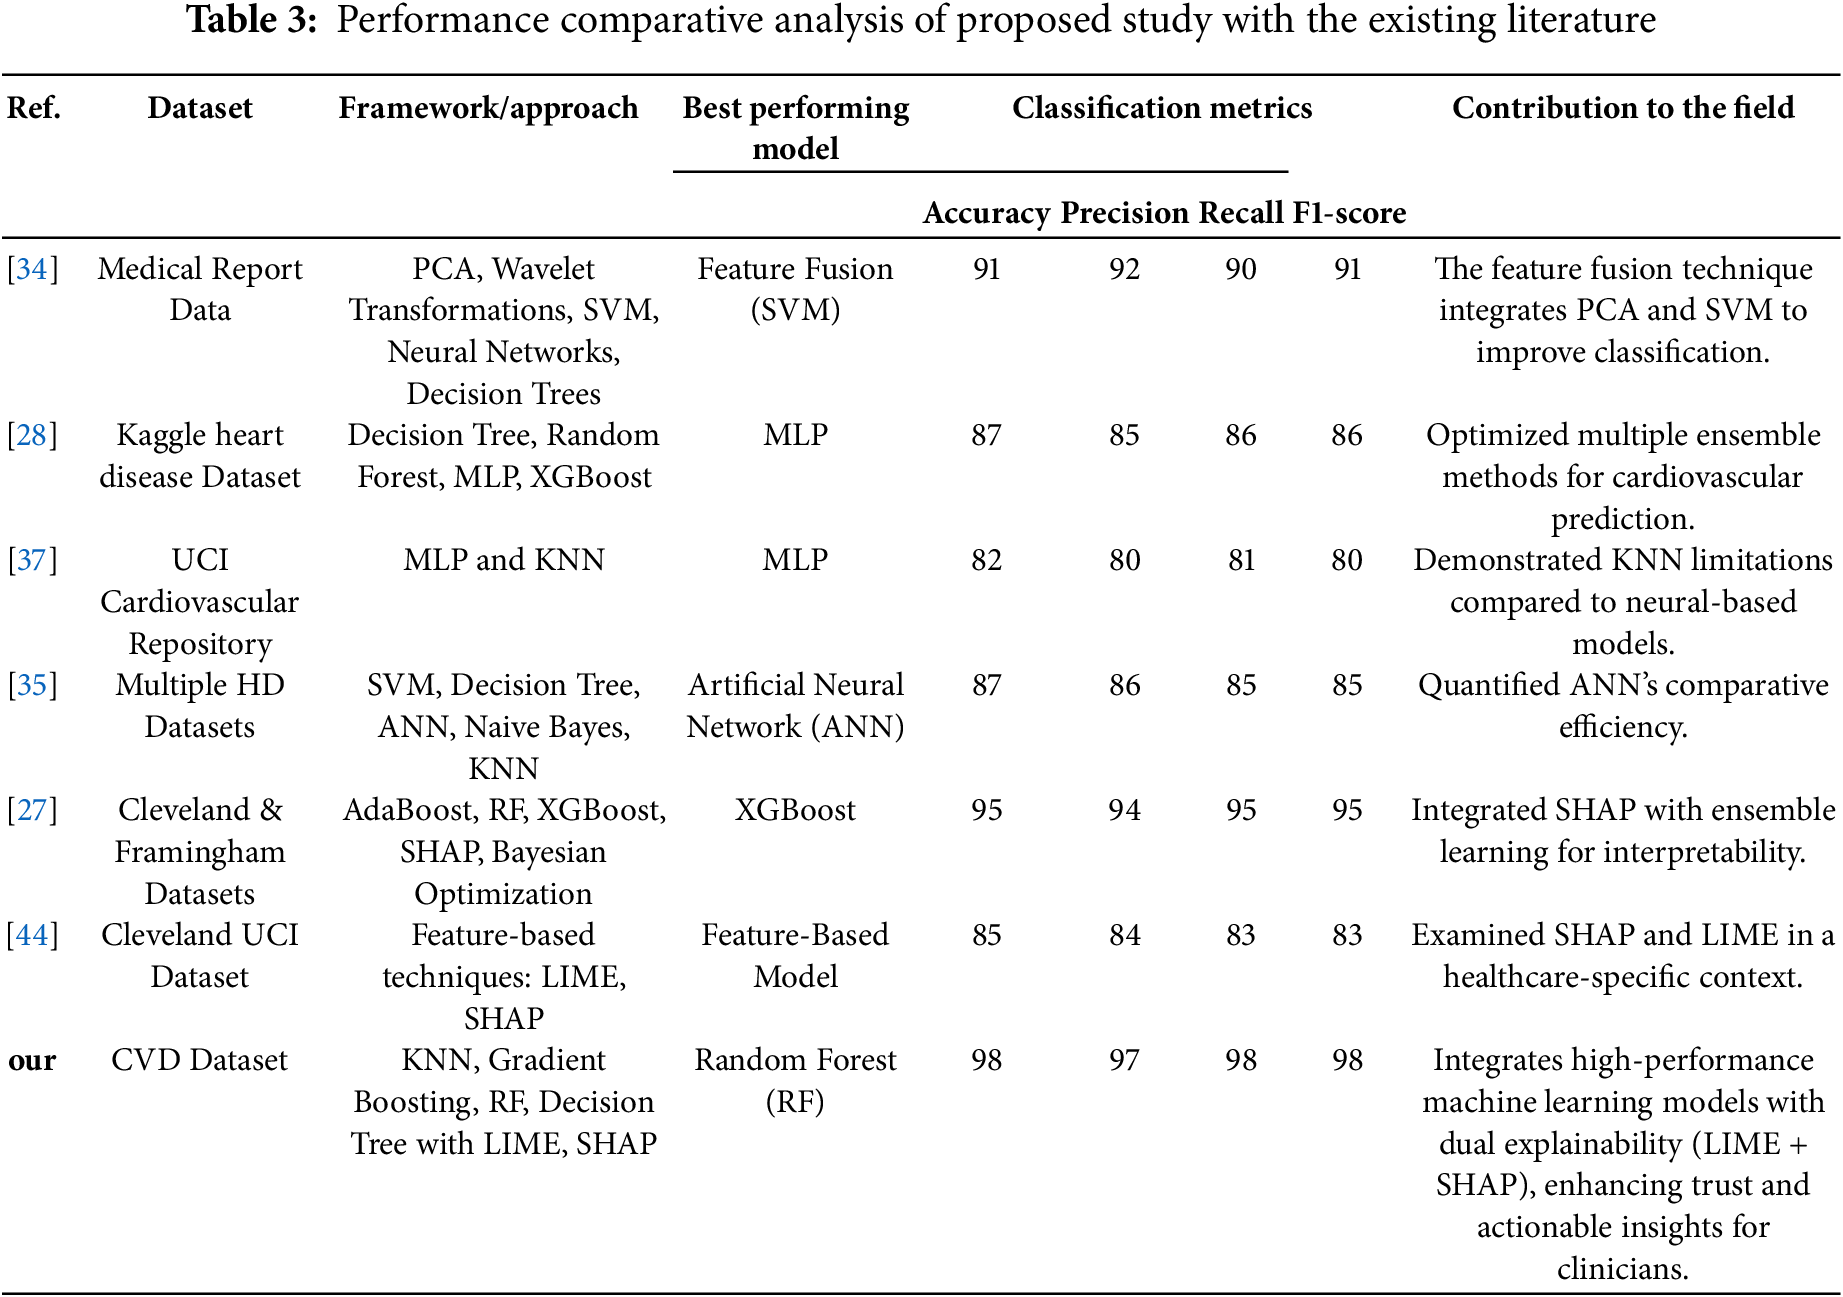
The comparative analysis in Table 3 highlights that the proposed framework outperforms existing methods by integrating advanced machine learning (ML) techniques with a dual-layer eXplainable AI (XAI) framework, combining LIME for local interpretability and SHAP for global insights.
Cardiovascular disease is a severe health condition that can lead to potentially life-threatening complications. Numerous lives could be saved by identifying high-risk factors for chronic CVD, such as high blood pressure, being overweight, cholesterol, and smoking. In our proposed work, an AI-enabled framework is proposed to facilitate better clinicians and professionals in finding high-risk factors of CVD. The results show that the RF model achieves the highest accuracy of 98%, with precision at 97%, recall at 98%, and an F1-score of 98%. The LIME tool is used to explain the prediction of the individual instances, and the SHAP framework is used for global interpretation of the results and predictions made by the ML methods. The explainability of the findings is visualized using several LIME and SHAP plots, such as summary plot, bar plot, force plot, and bee swarm plot, which are used for global explanation. The results of the proposed AI-enabled framework establish a new benchmark for CVD risk prediction by integrating advanced ML methods with robust interpretability, paving the way for more explainable and transparent decision-making in healthcare. Furthermore, the proposed framework’s explainability and real-time predictive capabilities indicate its suitability for integration into clinical decision support systems, enhancing diagnostic precision and patient outcomes. Future research should focus on validating the XAI techniques integrated with traditional ML methods in diverse medical and clinical environments to evaluate their generalizability and robustness across diverse demographics and healthcare systems.
Acknowledgement: We would like to thank the editor and the anonymous reviewers for taking the time to review and provide valuable comments.
Funding Statement: This research is funded by Researchers Supporting Project Number (RSPD2025R947), King Saud University, Riyadh, Saudi Arabia.
Author Contributions: Isha Kiran and Shahzad Ali contributed equally to conceptualize the analysis, collected the data, conducted the analysis, and wrote the manuscript. Sajawal ur Rehman Khan, Musaed Alhussein, Sheraz Aslam and Khursheed Aurangzeb reviewed and edited the manuscript. All authors reviewed the results and approved the final version of the manuscript.
Availability of Data and Materials: The data that support the findings of this study are openly available in Kaggle at https://www.kaggle.com/datasets/sulianova/cardiovascular-disease-dataset (accessed on 05 February 2025).
Ethics Approval: Not applicable.
Conflicts of Interest: The authors declare no conflicts of interest to report regarding the present study.
Abbreviations
| AI | Artificial Intelligence |
| ANN | Artificial Neural Network |
| CVD | Cardiovascular Disease |
| DL | Deep Learning |
| DNN | Deep Neural Network |
| DT | Decision Tree |
| EHR | Electronic Health Record |
| KNN | K-Nearest Neighbor |
| LIME | Local Interpretable Model-Agnostic Explanations |
| LR | Logistic Regression |
| ML | Machine Learning |
| MLP | Multilayer Perceptron |
| NB | Naive Bayes |
| PCA | Principal Component Analysis |
| RF | Random Forest |
| SHAP | SHapley Additive exPlanations |
| SVM | Support Vector Machine |
| XAI | eXplainable AI |
| WHO | World Health Organization |
References
1. Ramalingam V, Dandapath A, Raja MK. Heart disease prediction using machine learning techniques: a survey. Int J Eng Technol. 2018;2(8):684–7. [Google Scholar]
2. Hu R, Feng H. Lenticulostriate artery and lenticulostriate-artery neural complex: new concept for intracerebral hemorrhage. Curr Pharm Des. 2017;23(15):2206–11. doi:10.2174/1381612823666170220163750. [Google Scholar] [PubMed] [CrossRef]
3. Seckeler MD, Hoke TR. The worldwide epidemiology of acute rheumatic fever and rheumatic heart disease. Clin Epidemiol. 2011;3:67–84. doi:10.2147/CLEP. [Google Scholar] [CrossRef]
4. Ali MM, Paul BK, Ahmed K, Bui FM, Quinn JM, Moni MA. Heart disease prediction using supervised machine learning algorithms: performance analysis and comparison. Comput Biol Med. 2021;136(4):104672. doi:10.1016/j.compbiomed.2021.104672. [Google Scholar] [PubMed] [CrossRef]
5. Zhao Y, Xiong W, Li C, Zhao R, Lu H, Song S, et al. Hypoxia-induced signaling in the cardiovascular system: pathogenesis and therapeutic targets. Signal Transduct Target Ther. 2023;8(1):431. doi:10.1038/s41392-023-01652-9. [Google Scholar] [PubMed] [CrossRef]
6. Fluschnik N, Ojeda F, Zeller T, Jørgensen T, Kuulasmaa K, Becher PM, et al. Predictive value of long-term changes of growth differentiation factor-15 over a 27-year-period for heart failure and death due to coronary heart disease. PLoS One. 2018;13(5):e0197497. doi:10.1371/journal.pone.0197497. [Google Scholar] [PubMed] [CrossRef]
7. Lotufo PA. Trends in cardiovascular diseases and heart disease death rates among adults aged 45–64: Brazil, 2000–2017. Sao Paulo Med J. 2019;137(3):213–5. doi:10.1590/1516-3180.2019.1373.220719. [Google Scholar] [PubMed] [CrossRef]
8. Princy RJP, Parthasarathy S, Jose PSH, Lakshminarayanan AR, Jeganathan S. Prediction of cardiac disease using supervised machine learning algorithms. In: 2020 4th International Conference on Intelligent Computing and Control Systems (ICICCS); 2020; Madurai, India: IEEE. p. 570–5. [Google Scholar]
9. Bing P, Liu W, Zhai Z, Li J, Guo Z, Xiang Y, et al. A novel approach for denoising electrocardiogram signals to detect cardiovascular diseases using an efficient hybrid scheme. Front Cardiovasc Med. 2024;11:1277123. doi:10.3389/fcvm.2024.1277123. [Google Scholar] [PubMed] [CrossRef]
10. Swathy M, Saruladha K. A comparative study of classification and prediction of Cardio-Vascular Diseases (CVD) using Machine Learning and Deep Learning techniques. ICT Express. 2022;8(1):109–16. doi:10.1016/j.icte.2021.08.021. [Google Scholar] [CrossRef]
11. Dutta A, Batabyal T, Basu M, Acton ST. An efficient convolutional neural network for coronary heart disease prediction. Expert Syst Appl. 2020;159(2):113408. doi:10.1016/j.eswa.2020.113408. [Google Scholar] [CrossRef]
12. Gupta HV, Farrell AM, Mittal MK. Transient ischemic attacks: predictability of future ischemic stroke or transient ischemic attack events. Ther Clin Risk Manag. 2014;27–35. doi:10.2147/TCRM. [Google Scholar] [CrossRef]
13. Kremers B, Wübbeke L, Mees B, Ten Cate H, Spronk H, ten Cate-Hoek A. Plasma biomarkers to predict cardiovascular outcome in patients with peripheral artery disease: a systematic review and meta-analysis. Arterioscler Thromb Vasc Biol. 2020;40(9):2018–32. doi:10.1161/ATVBAHA.120.314774. [Google Scholar] [PubMed] [CrossRef]
14. Govender RD, Al-Shamsi S, Soteriades ES, Regmi D. Incidence and risk factors for recurrent cardiovascular disease in middle-eastern adults: a retrospective study. BMC Cardiovasc Disord. 2019;19(1):1–7. doi:10.1186/s12872-019-1231-z. [Google Scholar] [PubMed] [CrossRef]
15. Reddy KVV, Elamvazuthi I, Aziz AA, Paramasivam S, Chua HN, Pranavanand S. Heart disease risk prediction using machine learning classifiers with attribute evaluators. Appl Sci. 2021;11(18):8352. doi:10.3390/app11188352. [Google Scholar] [CrossRef]
16. Anupama Y, Gediya L, Kazi A. Heart disease prediction using machine learning. Int Res J Eng Technol. 2021;8(9):1325–9. [Google Scholar]
17. Kaur S, Singla J, Nkenyereye L, Jha S, Prashar D, Joshi GP, et al. Medical diagnostic systems using artificial intelligence (AI) algorithms: principles and perspectives. IEEE Access. 2020;8:228049–69. doi:10.1109/ACCESS.2020.3042273. [Google Scholar] [CrossRef]
18. Sharma H, Rizvi M. Prediction of heart disease using machine learning algorithms: a survey. Int J Recent Innov Trends Comput Commun. 2017;5(8):99–104. [Google Scholar]
19. Alaa AM, Bolton T, Di Angelantonio E, Rudd JH, Van der Schaar M. Cardiovascular disease risk prediction using automated machine learning: a prospective study of 423,604 UK Biobank participants. PLoS One. 2019;14(5):e0213653. doi:10.1371/journal.pone.0213653. [Google Scholar] [PubMed] [CrossRef]
20. Luan S, Yu X, Lei S, Ma C, Wang X, Xue X, et al. Deep learning for fast super-resolution ultrasound microvessel imaging. Phys Med Biol. 2023;68(24):245023. doi:10.1088/1361-6560/ad0a5a. [Google Scholar] [PubMed] [CrossRef]
21. Fang W, Sun W, Fang W, Zhao S, Wang C. Clinical features, treatment, and outcomes of patients with carfilzomib induced thrombotic microangiopathy. Int Immunopharmacol. 2024;134(7):112178. doi:10.1016/j.intimp.2024.112178. [Google Scholar] [PubMed] [CrossRef]
22. Prasad VK, Verma A, Bhattacharya P, Shah S, Chowdhury S, Bhavsar M, et al. Revolutionizing healthcare: a comparative insight into deep learning’s role in medical imaging. Sci Rep. 2024;14(1):1–39. doi:10.1038/s41598-024-71358-7. [Google Scholar] [PubMed] [CrossRef]
23. Uddin S, Khan A, Hossain ME, Moni MA. Comparing different supervised machine learning algorithms for disease prediction. BMC Med Inform Decis Mak. 2019;19(1):1–16. doi:10.1186/s12911-019-1004-8. [Google Scholar] [PubMed] [CrossRef]
24. Pasha SJ, Mohamed ES. Novel Feature Reduction (NFR) model with machine learning and data mining algorithms for effective disease risk prediction. IEEE Access. 2020;8:184087–108. doi:10.1109/ACCESS.2020.3028714. [Google Scholar] [CrossRef]
25. Goel S, Deep A, Srivastava S, Tripathi A. Comparative analysis of various techniques for heart disease prediction. In: 2019 4th International Conference on Information Systems and Computer Networks (ISCON); 2019; Mathura, India: IEEE. p. 88–94. [Google Scholar]
26. Khan H, Javaid N, Bashir T, Akbar M, Alrajeh N, Aslam S. Heart disease prediction using novel Ensemble and Blending based Cardiovascular Disease Detection Networks: EnsCVDD-Net and BlCVDD-Net. IEEE Access. 2024; 12:109230–54. [Google Scholar]
27. Mienye ID, Jere N. Optimized ensemble learning approach with explainable AI for improved heart disease prediction. Information. 2024;15(7):394. doi:10.3390/info15070394. [Google Scholar] [CrossRef]
28. Bhatt CM, Patel P, Ghetia T, Mazzeo PL. Effective heart disease prediction using machine learning techniques. Algorithms. 2023;16(2):88. doi:10.3390/a16020088. [Google Scholar] [CrossRef]
29. Paudel P, Karna SK, Saud R, Regmi L, Thapa TB, Bhandari M. Unveiling key predictors for early heart attack detection using machine learning and explainable AI technique with LIME. In: Proceedings of the 10th International Conference on Networking, Systems and Security; 2023; Dhaka, Bangladesh. p. 69–78. [Google Scholar]
30. Hassija V, Chamola V, Mahapatra A, Singal A, Goel D, Huang K, et al. Interpreting black-box models: a review on explainable artificial intelligence. Cognit Comput. 2024;16(1):45–74. doi:10.1007/s12559-023-10179-8. [Google Scholar] [CrossRef]
31. Zhang C, Ge H, Zhang S, Liu D, Jiang Z, Lan C, et al. Hematoma evacuation via image-guided para-corticospinal tract approach in patients with spontaneous intracerebral hemorrhage. Neurol Ther. 2021;10(2):1001–13. doi:10.1007/s40120-021-00279-8. [Google Scholar] [PubMed] [CrossRef]
32. Huang Y, Wang C, Zhou T, Xie F, Liu Z, Xu H, et al. Lumican promotes calcific aortic valve disease through H3 histone lactylation. Eur Heart J. 2024;45(37):3871–85. doi:10.1093/eurheartj/ehae407. [Google Scholar] [PubMed] [CrossRef]
33. Zhu X, Yu G, Lv Y, Yang N, Zhao Y, Li F, et al. Neuregulin-1, a member of the epidermal growth factor family, mitigates STING-mediated pyroptosis and necroptosis in ischaemic flaps. Burns Trauma. 2024;12:tkae035. doi:10.1093/burnst/tkae035. [Google Scholar] [PubMed] [CrossRef]
34. Sinha A, Narula D, Pandey SK, Kumar A, Hassan MM, Jha P, et al. CARDPSoML: comparative approach to analyze and predict cardiovascular disease based on medical report data and feature fusion approach. Health Sci Reports. 2024;7(1):e1802. doi:10.1002/hsr2.1802. [Google Scholar] [PubMed] [CrossRef]
35. Riyaz L, Butt MA, Zaman M, Ayob O. Heart disease prediction using machine learning techniques: a quantitative review. In: International Conference on Innovative Computing and Communications; 2022; New Delhi, India: Springer. Vol. 3, p. 81–94. [Google Scholar]
36. Ayon SI, Islam MM, Hossain MR. Coronary artery heart disease prediction: a comparative study of computational intelligence techniques. IETE J Res. 2022;68(4):2488–507. doi:10.1080/03772063.2020.1713916. [Google Scholar] [CrossRef]
37. Pal M, Parija S, Panda G, Dhama K, Mohapatra RK. Risk prediction of cardiovascular disease using machine learning classifiers. Open Med. 2022;17(1):1100–13. doi:10.1515/med-2022-0508. [Google Scholar] [PubMed] [CrossRef]
38. Muneer S, Rasool MA. A enhancing healthcare outcomes with explainable AI (XAI) for disease prediction: a comprehensive review. Int J Adv Sci Comput. 2022;1(1):37–42. [Google Scholar]
39. Sharma V, Yadav S, Gupta M. Heart disease prediction using machine learning techniques. In: 2020 2nd International Conference on Advances in Computing, Communication Control and Networking (ICACCCN); 2020; Greater Noida, India: IEEE. p. 177–81. [Google Scholar]
40. UCI Machine Learning Repository. Heart Disease Dataset. 1988 [cited 2024 Sep 5]. Available from: https://archive.ics.uci.edu/dataset/45/heart+disease. [Google Scholar]
41. Maiga J, Hungilo GG, Pranowo. Comparison of machine learning models in prediction of cardiovascular disease using health record data. In: 2019 International Conference on Informatics, Multimedia, Cyber and Information System (ICIMCIS); 2019; Jakarta, Indonesia: IEEE. p. 45–8. [Google Scholar]
42. Sulianova. Cardiovascular disease dataset; 2024 [cited 2024 Sep 5]. Available from: https://www.kaggle.com/datasets/sulianova/cardiovascular-disease-dataset. [Google Scholar]
43. Tjoa E, Guan C. A survey on explainable artificial intelligence (XAItoward medical XAI. IEEE Trans Neural Netw Learn Syst. 2020;32(11):4793–813. doi:10.1109/TNNLS.2020.3027314. [Google Scholar] [PubMed] [CrossRef]
44. Dave D, Naik H, Singhal S, Patel P. Explainable AI meets healthcare: a study on heart disease dataset. arXiv:201103195. 2020. [Google Scholar]
45. Samek W. Explainable artificial intelligence: understanding, visualizing and interpreting deep learning models. arXiv:170808296. 2017. [Google Scholar]
46. Lundberg SM, Erion G, Chen H, DeGrave A, Prutkin JM, Nair B, et al. From local explanations to global understanding with explainable AI for trees. Nat Mach Intell. 2020;2(1):56–67. doi:10.1038/s42256-019-0138-9. [Google Scholar] [PubMed] [CrossRef]
Cite This Article
 Copyright © 2025 The Author(s). Published by Tech Science Press.
This work is licensed under a Creative Commons Attribution 4.0 International License , which permits unrestricted use, distribution, and reproduction in any medium, provided the original work is properly cited.
 Downloads
 Citation Tools