
 Submit a Paper
 Propose a Special lssue
 Open Access
ARTICLE

X-OODM: Leveraging Explainable Object-Oriented Design Methodology for Multi-Domain Sentiment Analysis
1 Department of Computer Science, University of Engineering and Technology, Lahore, 54890, Pakistan
2 Department of Computer Science (RCET Campus, GRW), University of Engineering and Technology, Lahore, 52250, Pakistan
3 Artificial Intelligence Centre (AIRC), Ajman University, Ajman, 346, United Arab Emirates
4 Smith School of Business, University of Maryland, College Park, MD 20742-5151, USA
* Corresponding Author: Muhammad Shoaib. Email:
Computers, Materials & Continua 2025, 82(3), 4977-4994. https://doi.org/10.32604/cmc.2025.057359
Received 15 August 2024; Accepted 22 October 2024; Issue published 06 March 2025
 View Full Text
 Download PDF
Abstract
Incorporation of explainability features in the decision-making web-based systems is considered a primary concern to enhance accountability, transparency, and trust in the community. Multi-domain Sentiment Analysis is a significant web-based system where the explainability feature is essential for achieving user satisfaction. Conventional design methodologies such as object-oriented design methodology (OODM) have been proposed for web-based application development, which facilitates code reuse, quantification, and security at the design level. However, OODM did not provide the feature of explainability in web-based decision-making systems. X-OODM modifies the OODM with added explainable models to introduce the explainability feature for such systems. This research introduces an explainable model leveraging X-OODM for designing transparent applications for multidomain sentiment analysis. The proposed design is evaluated using the design quality metrics defined for the evaluation of the X-OODM explainable model under user context. The design quality metrics, transferability, simulatability, informativeness, and decomposability were introduced one after another over time to the evaluation of the X-OODM user context. Auxiliary metrics of accessibility and algorithmic transparency were added to increase the degree of explainability for the design. The study results reveal that introducing such explainability parameters with X-OODM appropriately increases system transparency, trustworthiness, and user understanding. The experimental results validate the enhancement of decision-making for multi-domain sentiment analysis with integration at the design level of explainability. Future work can be built in this direction by extending this work to apply the proposed X-OODM framework over different datasets and sentiment analysis applications to further scrutinize its effectiveness in real-world scenarios.Keywords
Web-based applications are critically important in the modern digital landscape because they provide organizations with a means of attracting and retaining valued customers. For instance, these include constructs for user recommendations [1], tools to help improve users’ decisions and levels of engagement and satisfaction [2], and agents that could mine online reviews to extract valuable knowledge from user-generated content [3]. Explainability in such web-based decision-making systems can help explain the system’s generated recommendations [4]. In the last few years, explanations have come into evidence in recommender systems to enable better user comprehension, trust, and effective decision-making [5]. The explanations provide a reason behind the recommendations, thus helping users evaluate suggestions in domains such as e-commerce and social networking [6,7].
Explainability in web-based sentiment analysis systems includes high computation costs [8], sophisticated model interpretation [9], problems of scalability, and design variations for individual users [10–12]. The rapid increase of web applications led to the increased demand for systems that could analyze and interpret user sentiment across various domains. Most present systems for sentiment analysis emphasize correctness and performance, while ignoring the importance of explainability [13,14]. This deficiency results in systems that are effective but not readily interpretable by end-users, thereby limiting their practical utility in decision-making processes.
Traditional object-orientated design methods (OODM), which include OODM [15], semantic web (SW)-OODM [16], reverse (R)-OODM [17], and Secure (S)-OODM [18], have provided strong base design for the construction of object-oriented based systems. Requirements of an object-oriented design are given in [19]. In the existing literature, various studies [20–23] provided guidelines for implementing the object-oriented design methodology in different domains, e.g., healthcare [24,25], university administrative information system [26]. The studies [27–30] integrated explainability, while metrics for object-oriented designs are discussed in [31,32]. However, existing studies lack the features of explainability in object-oriented design methodology for a web-based multi-domain sentiment analysis application. Hence, there is a need to propose an explainable framework that provides the interpretations in web-based multi-domain sentiment analysis.
The Explainable Object-Oriented Design Methodology (X-OODM) [33] presented the constructs for incorporating explainability features in web-based systems at the design level. This research extends X-OODM for multi-domain sentiment analysis incorporation in web-based object-oriented designs. This X-OODM for multi-domain sentiment analysis bridges the gap of X-OODM by providing models and components of sentiment analysis that guarantee system transparency and directly impact user experience and decision-making. The multi-domain sentiment analysis X-OODM provides reasons why a certain sentiment classification has been made to make the system more trustworthy. The study uses a suite of design quality metrics developed for the explainable model to evaluate the incorporation of X-OODM for multi-domain sentiment analysis. These metrics are validated using a web-based application of multi-domain sentiment analysis, which increases and quantifies the system’s explain ability. The findings show that including these metrics early in the design process leads to applications that are transparent, trustworthy, functionally robust, and user-friendly. Our X-OODM for multi-domain sentiment analysis improves the design of web-based applications by incorporating components like transparency, reliability, trustworthiness, and fairness. This makes decision-making processes more rational, understandable, and optimal for better results. This framework with explainability characteristics establishes a new benchmark for future web-based multi-domain sentiment application development.
The paper is organized as follows: the next section discusses related work, Section 3 covers the proposed work and the metrics of the explainable model. Section 4 presents the results and discussion, and Section 5 concludes the paper.
Object-oriented design methodologies (OODMs) have emerged as effective ways of developing web-based applications, like e-commerce or social networking sites. OODMS provides a systematic structure for designing large-scale, dynamic web applications that combine the complexity of navigation patterns with sophisticated computational behavior. The Object-Oriented Hypermedia Design Method is one of the most famous approaches, which describes a structured procedure comprising the phases of conceptual design, navigational design, abstract interface design, and implementation [34]. Rossi et al. [35] treat web applications as views of conceptual models, applying abstraction primitives to design conceptual and navigational structures. The application of OODMs allows developers to construct web applications that scale, reuse, and are modular, and to properly manage the complex data structures necessary for large applications.
2.1 Object-Oriented Design Methodology
Liang et al. [21] introduced the Design with Objects (DwO) method to enhance the computability, reusability, and interchangeability of the same data of objects in modules. This method deals with electronic assemblies and their problems regarding components. Abad Shah [15] created Object-Oriented Design Methodology OODM for web applications; this is a combination of the waterfall software development lifecycle and the activities of the web. OODM, however, did not apply all steps of the software development lifecycle. Ghani et al. [17] proposed the Reverse Object-Oriented Design Methodology R-OODM whereby designs of web applications are obtained using OODM design phase models and mapping XML schemas to object databases, represented as graphs.
2.2 Secure Metrics of Object-Oriented Design Methodology
Kiewkanya et al. [22] emphasized a maintainability model in object-oriented design that focuses on modifiability and understandability as the two desirable states of maintenance. They used metrics and discriminant techniques to discern how maintainability correlates with structural complexity, which they translated into scores using weighted sum and predicted level techniques. Arshad et al. [18] have enhanced the OODM by the integration of security principles in the design, which incorporates the design phase because there are no such concerns in the existing methodologies of OODM in web application development. S-OODM is proposed and is tested at the design level, which is a secure object-oriented design methodology. Similarly, Kadam et al. [23] adopted the security adoption for measuring and reducing risks of numerous vulnerabilities; security guidelines were adopted at design time for improving security through security metrics. Jangra et al. [24] provided the use of object-oriented databases in the attributes of health case management systems, including re-design of structure for data and schema views, temporal data, and multimedia data management. Mohapatra et al. [25] implemented an object-oriented methodology in a cloud healthcare system to secure sensitive information, which increased modularity and flexibility. This methodology results in greater collaboration and communication between the components of the system due to the enhanced behavioral aspects. Nwokoro et al. [26] depicted the description of the object-oriented analysis and design methodology applied for a university management system, citing that object relationship increase efficiency in data retrieval with the functioning of the system.
2.3 Neural Representation Using Object-Oriented Design Methodology
Arulprakash et al. [27] conducted research on neural representation in explainable Artificial Intelligence (AI) using scientific methods within object-oriented approaches; instead, teaching approaches based on feature importance made it possible to reveal dependencies between weight and the distribution of loss. They offered the main parameter with the possibility of extension to business parameters such as the function of loss distribution computation. Geyer et al. [28], on the other hand, proposed a structural view in designing the components of custom methods of machine learning based on explanations provided by the systems. To deal with the black-box nature of these models, they carried out a component-based approach with the help of systems engineering where the explanation of the models was evaluated qualitatively and quantitatively relative to the component-based models.
Furthermore, these works demonstrate the versatility and applicability of object-oriented approaches in different areas, including web and cloud-based healthcare systems, explainable AI, or the systems of university management that note enhancement of systems maintainability, security, and data well management. Real-time studies or an application of these methodologies to bigger data sets and crowder more complex applications are potential future work.
In the proposed work, the OODM framework is modified by introducing the explainability features at the design level for web-based multidomain sentiment analysis applications. The proposed X-OODM for multidomain sentiment analysis design is given in subsection below followed by the proposed metrics at the design level.
3.1 X-OODM for Multi-Domain Sentiment Analysis
X-OODM [33] extends OODM [16] and enhances web-based applications by emphasizing explainability throughout the analysis and design phases, which leads to better decision-making. This affects existing design approach models, such as the informational, navigational, operational, user interface, and component models as shown in Fig. 1. Application of this integration improves the interpretation of the system by the user towards the knowledge about web applications.
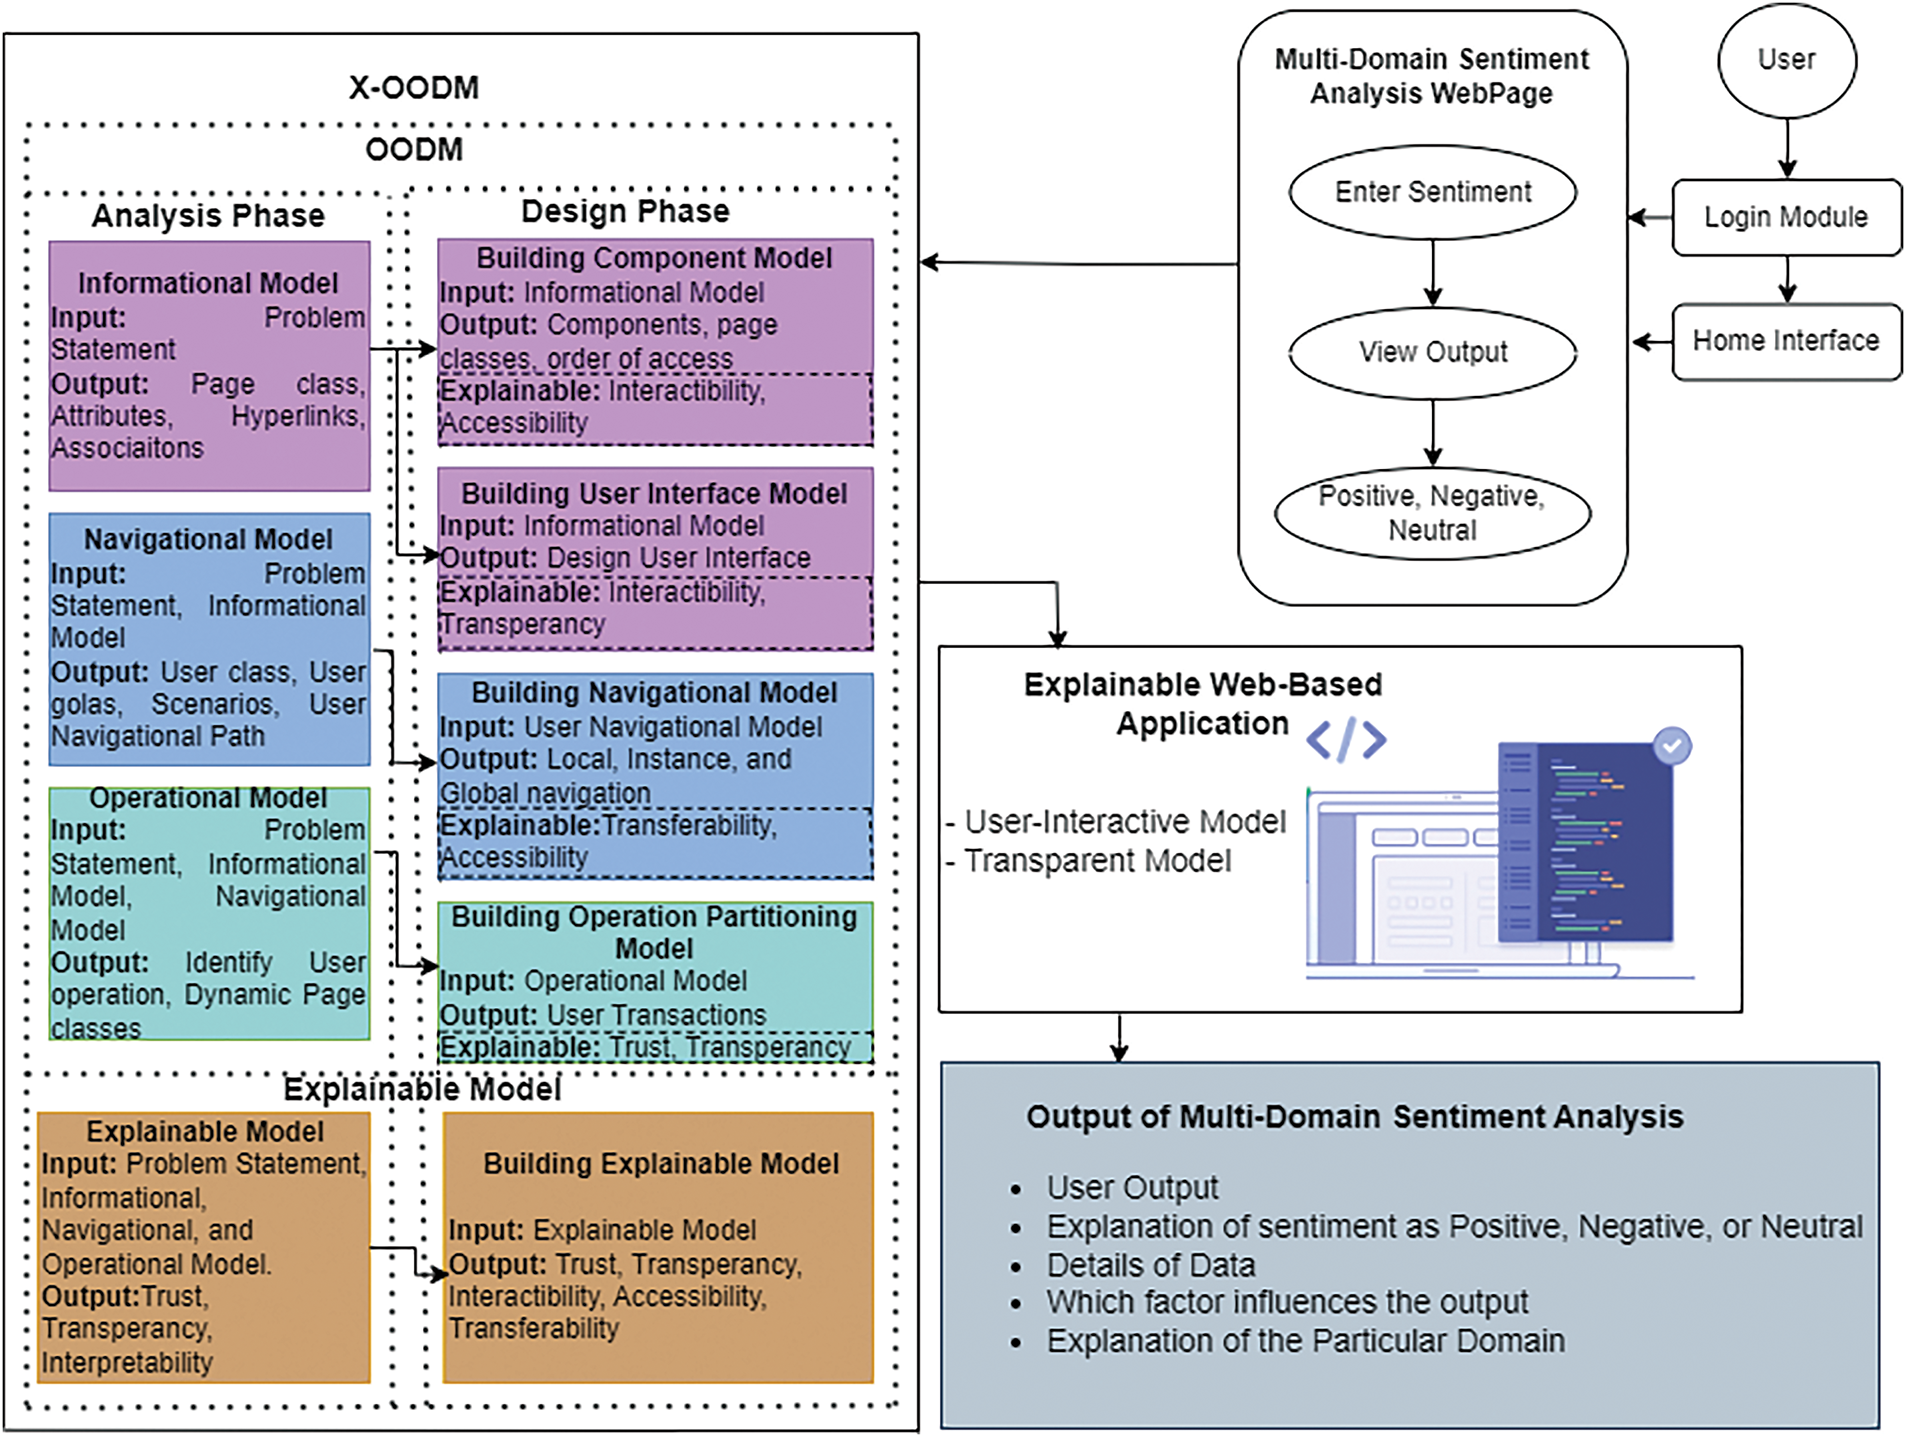
Figure 1: X-OODM framework for multidomain sentiment analysis
It encompasses explainability in the various models in the system as can be elucidated by the multi-domain sentiment analysis, which is depicted in Fig. 2. Various studies [27–30] reflect on the explainability importance in compliance aspects with legal provisions which provide internal working of the application related to regulations.
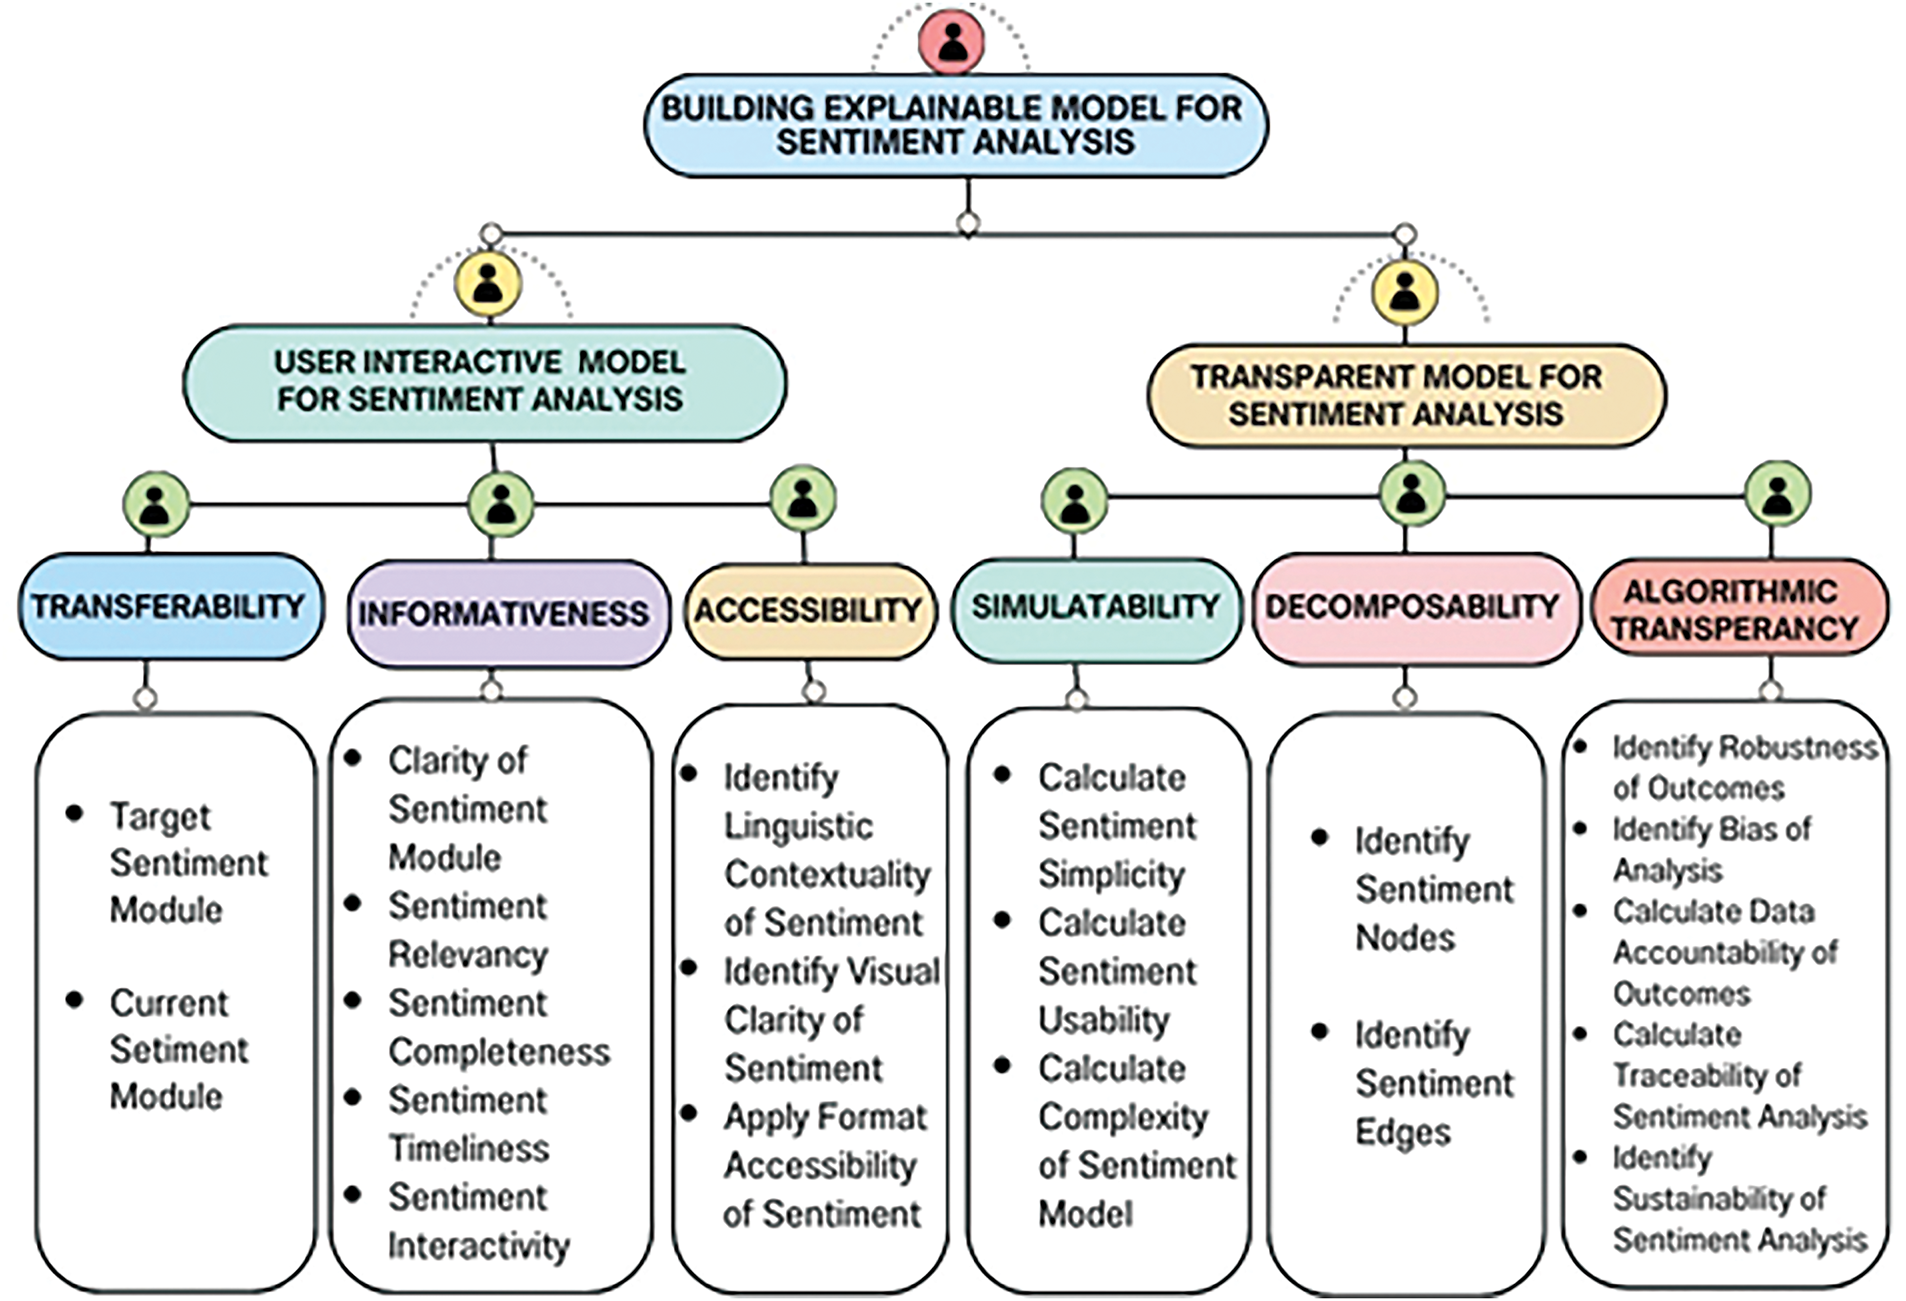
Figure 2: Design parameters for building explainable model for user context with proposed X-OODM multi-domain sentiment analysis
3.2 X-OODM Design Quality Metrics for Multidomain Sentiment Analysis
We employed X-OODM to integrate the concept of explainability into web-based multi-domain sentiment analysis applications by combining different components in user requirements. The important components of a user-interactive model are operations, including transferability, informativeness, and accessibility, whereas, for a transparent model, there is simulatability, decomposability, and algorithmic transparency. All these models pass on every combined input into the explainable model so that every aspect of the application is transparent.
3.3 Schema Representation of the Explainable Model of User Context for Multidomain Sentiment Analysis
Abstract graph of the explainable schema for building an explainable model of user context is defined in Fig. 3 and the following terms are used in each layer of the model:
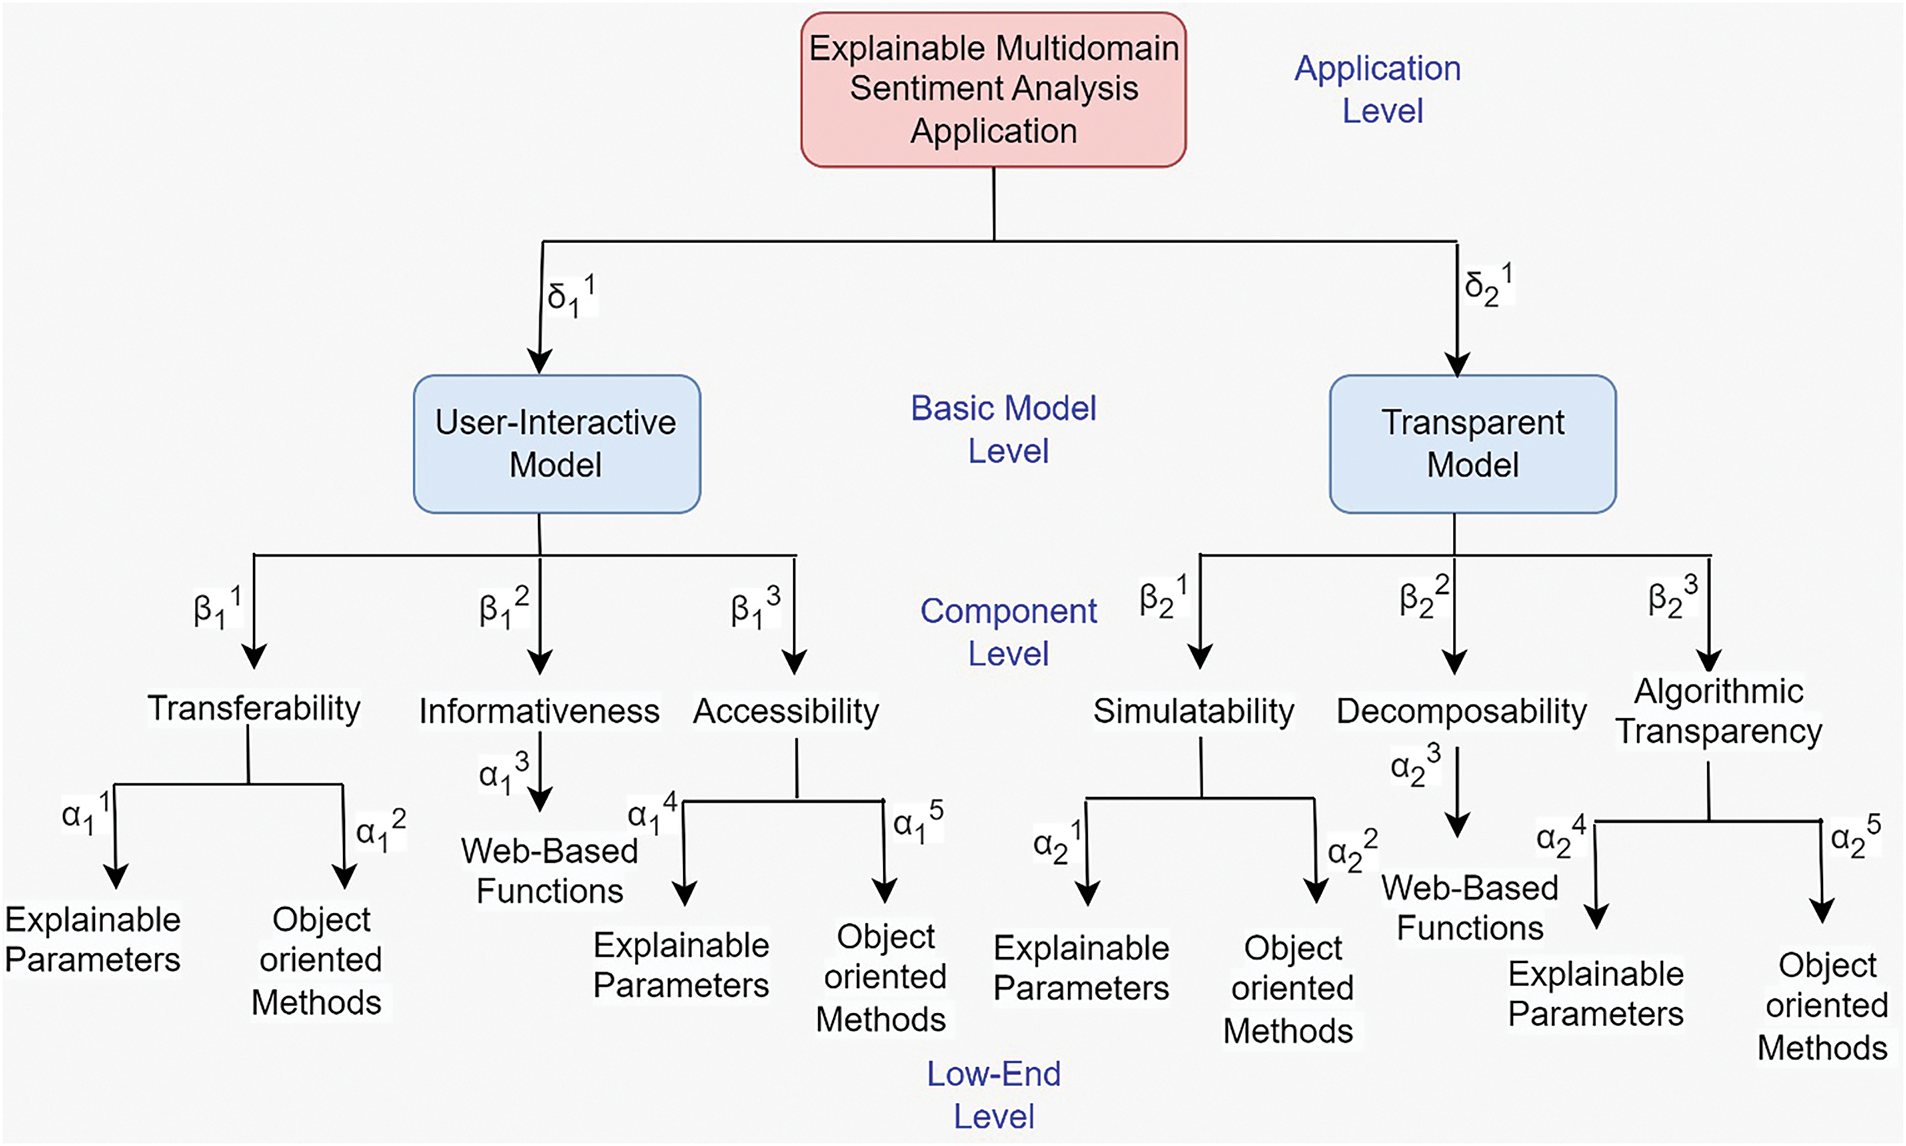
Figure 3: Abstract graph for components building of explainable model for multidomain sentiment analysis
The numbers including d, b, s, p, c, and r present the model and components that provide explainability in web-based applications at the design level for building an explainable model of user context. Interaction Graph ‘R’ is used to define the measurements related to the design quality of explainable. This graph further denotes its vertices E(R), defined in Eq. (1).
Here, 1 ≤
Table 1 depicts the bidirectional edges denoting more than one edge from the single vertex. Therefore, different vertices are assigned to the edges using a unique symbol. Here, 1 ≤
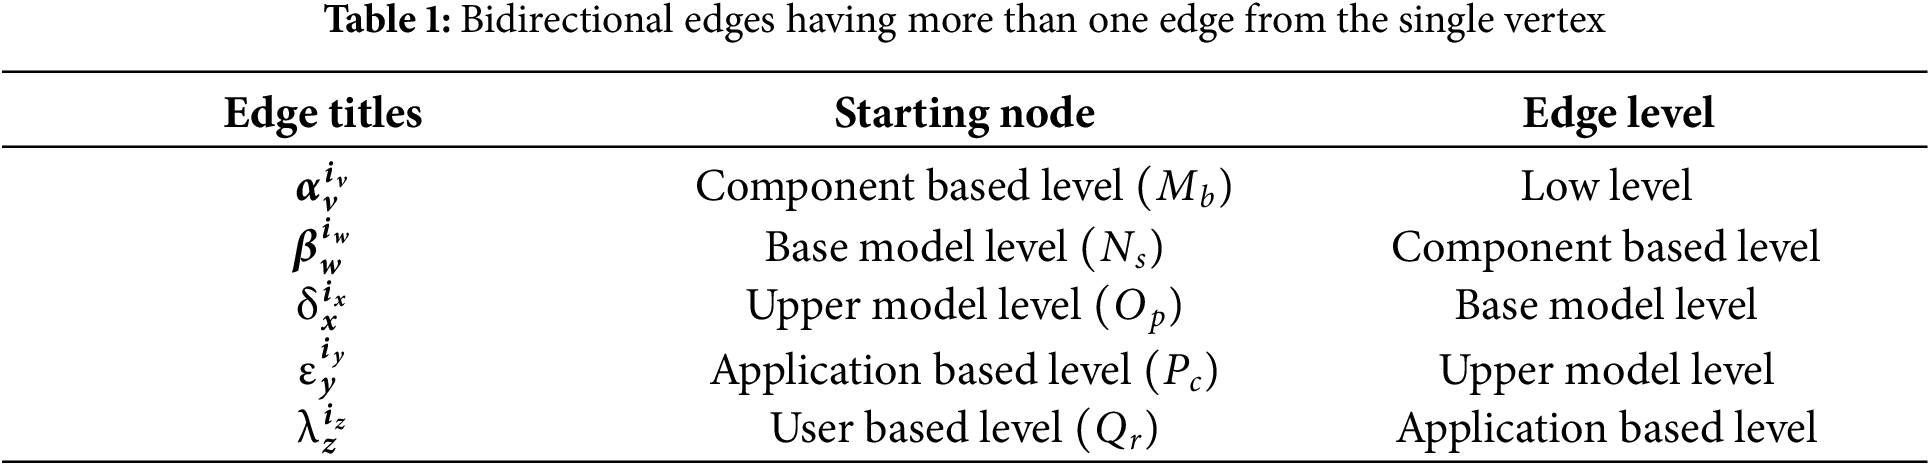
The defined edges are revolved in the following order:
In terms of interaction edges between the distinct vertices of the abstract graph, explainable components, is described as follows:
The defined explainable models are used to enhance the trust of user on the web-based applications which further categorized into the subcomponents that are represented in Fig. 2.
3.4 Explainable User Interactivity Modulation for Multidomain Sentiment Analysis
User Interactive Model develops as a fundamental method that includes transferability, informativeness, and accessibility. This model integrates individuals into the sentiment analysis process by implementing domain-specific information and context through interactive interfaces and feedback mechanisms. Using visualization tools and explanation interfaces, users may get explicit explanations for sentiment predictions, which helps them grasp the analytic results.
Transferability enhances the ability of the system to communicate information. It integrates the attributes to provide domain-specific information for users to improve the model. The Eq. (3) presents the transferability metrics, and the average impact of the transferability is achieved in Eq. (4).
Informativeness provides the interface that successfully delivers information through application in relevant, clear, and efficient ways. It increases the users’ understanding, confidence, and trust in the system’s operations. The metrics are defined in the Eq. (5) and average ratio in Eq. (6).
Accessibility presents the data to users more clear and understandable manner irrespective of data analysis. It is achieved by implementing simple language and removing any advanced terminologies that are difficult to understand.
The Eq. (7) gives the complete accessibility metrics, and the average ratio of the accessibility metrics is defined in Eq. (8).
Various components are used to measure the user interactive model. The metrics of Eqs. (3), (5), and (7) are added up in Eq. (9) to measure the overall impact on the model.
XUIM is measured in Eq. (10) and Eq. (11) shows the average impact of the model.
3.5 Explainable Transparency Modulation for Multidomain Sentiment Analysis
Transparency is the major gain of trust for the users in the sentient analysis application. It provides the details and a clear decision process to the users. Various methodologies are implemented to gain a transparent system for applications. These methodologies allow the users to understand and observe the output of the model in the multidomain sentiment analysis applications.
Simulatability in a transparent model allow the users to replicate and grasp the model’s decision-making process. It also enhances the user confidence in the model’s output by enhancing the accuracy and fairness of the prediction.
Various components such as usability, simplicity, and model’s complexity are measured in the simulatability presented in Eq. (12) and average ratio in Eq. (13).
Decomposability provides the conversion of the large problem into smaller components that help the users to easily grasp the knowledge. Users can enhance the model’s prediction by integrating the specifications, characteristics, and decision rules. These components are merged back in a way that can easily be managed by the users.
Decomposability metrics are calculated by implementing in Eq. (14) and Eq. (15) describes the average ratio.
3.5.3 Algorithmic Transparency
Transparency of the algorithm in an explainable model is critical for building trust in its predictions. This refers to making the algorithm’s inner workings and decision-making processes transparent and accessible to users. Explainable models can boost their usability and efficiency across a wide range of applications, allowing users to make more informed decisions based on a better understanding of the model’s behavior via algorithmic transparency, which is estimated in Eq. (16).
The average ratio has the impact on the overall transparent model defined in Eq. (17).
The above-mentioned metrics of XTPM are used to measure transparency in explainability. The overall design metrics are combined in Eq. (18).
The overall impact of the XTPM is measured in Eq. (19) and average impact in Eq. (20).
We define the metrics of individual components of explainable model and merge them into respective model. Given defined models such as User Interactive model and Transparent model have directly impact on the explainability of the web-based application as shown in Eq. (21) and average impact is defined in Eq. (22).
The value of the overall metrics presents that the explainable model is implemented successfully. The average acceptance scale to introduce the explainability for the end users in the web-based applications is based on the [26] and by using the web content accessibility guidelines. The following defined is the range of the metrics values:
Low (<10), Medium (10 to 20), High (>20)
The highest value of the metric measured indicates that the model is implemented perfectly and achieves explainability in all aspects.
3.6 Explainable Design Complexity Calculation for Multidomain Sentiment Analysis
Various components of explainable model are implemented in the web-based application which define the Explainable Design Quality Complexity Metric given as follows:
The unique value is assigned to each relation of edge as a weight value. The average design complexity of explainable web-based application is calculated as
This metric defines the overall complexity of the web-based application by introducing the explainability and interaction of its various components.
The web-based multidomain sentiment analysis application is considered as a case study to evaluate the design quality metrics of explainable model defined in this work. In this web-based application for multidomain sentiment analysis various explainable models are introduced to provide the detail web-based application at the user end. In the multidomain sentiment analysis, users are interacting with the application and give input as a sentence of specific domain and get the output as a positive, negative, or neutral sentiment. We consider the web-based application for multidomain sentiment analysis which provides the explainability using various parameters illustrated in Fig. 4.
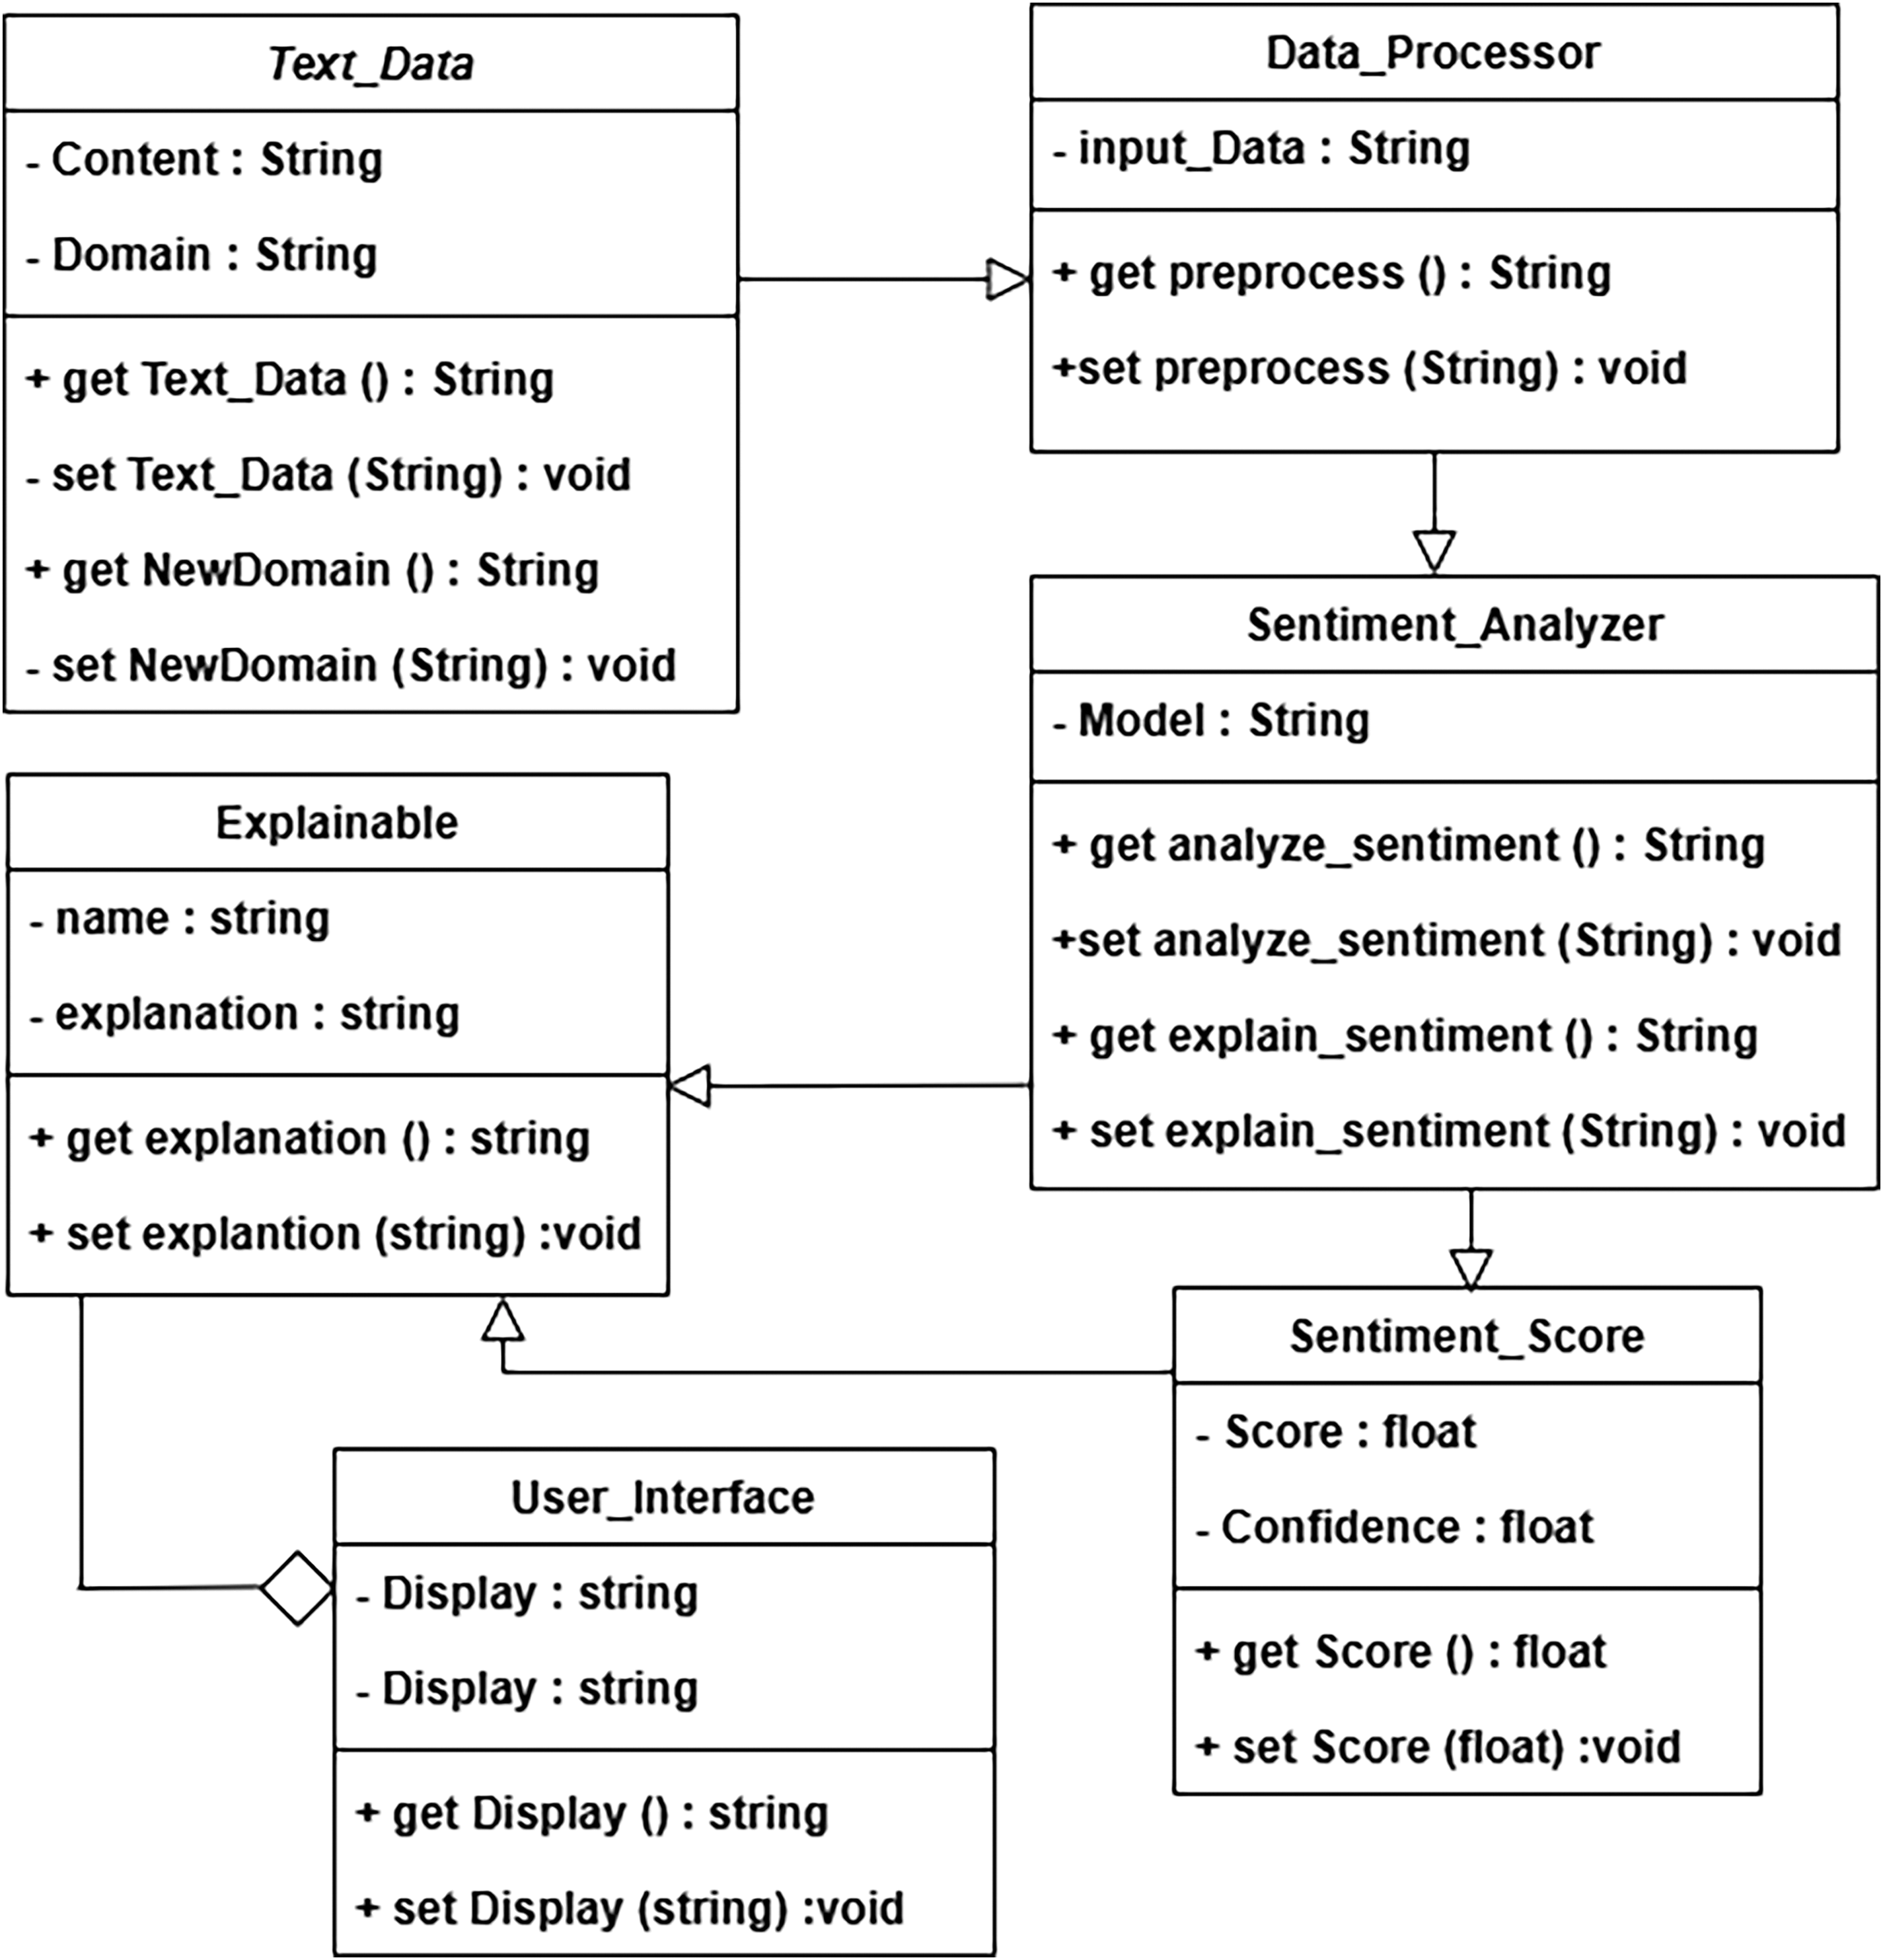
Figure 4: UML for multidomain sentiment analysis design with explainable model building
Various numbers of users are interacted with the application and the defined parameters ensure the explainability to implement numerous factors in the application. The factors include relevancy, completeness, timeliness, language relevancy, edges, and nodes. These factors provide the information to the respective component which further transfers to each related model.
This information enables the explainable model which helps to enhance the performance of the system and provide the secure, transparent, interpretable, and interactive system to the user. The systems explainability can be checked through these parameters. Moreover, these parameters can be incorporated according to the requirements of the users.
For the evaluation of the defined metrics, we consider the different scenarios of the case study. The low-level parameters and their working are defined in Table 2.
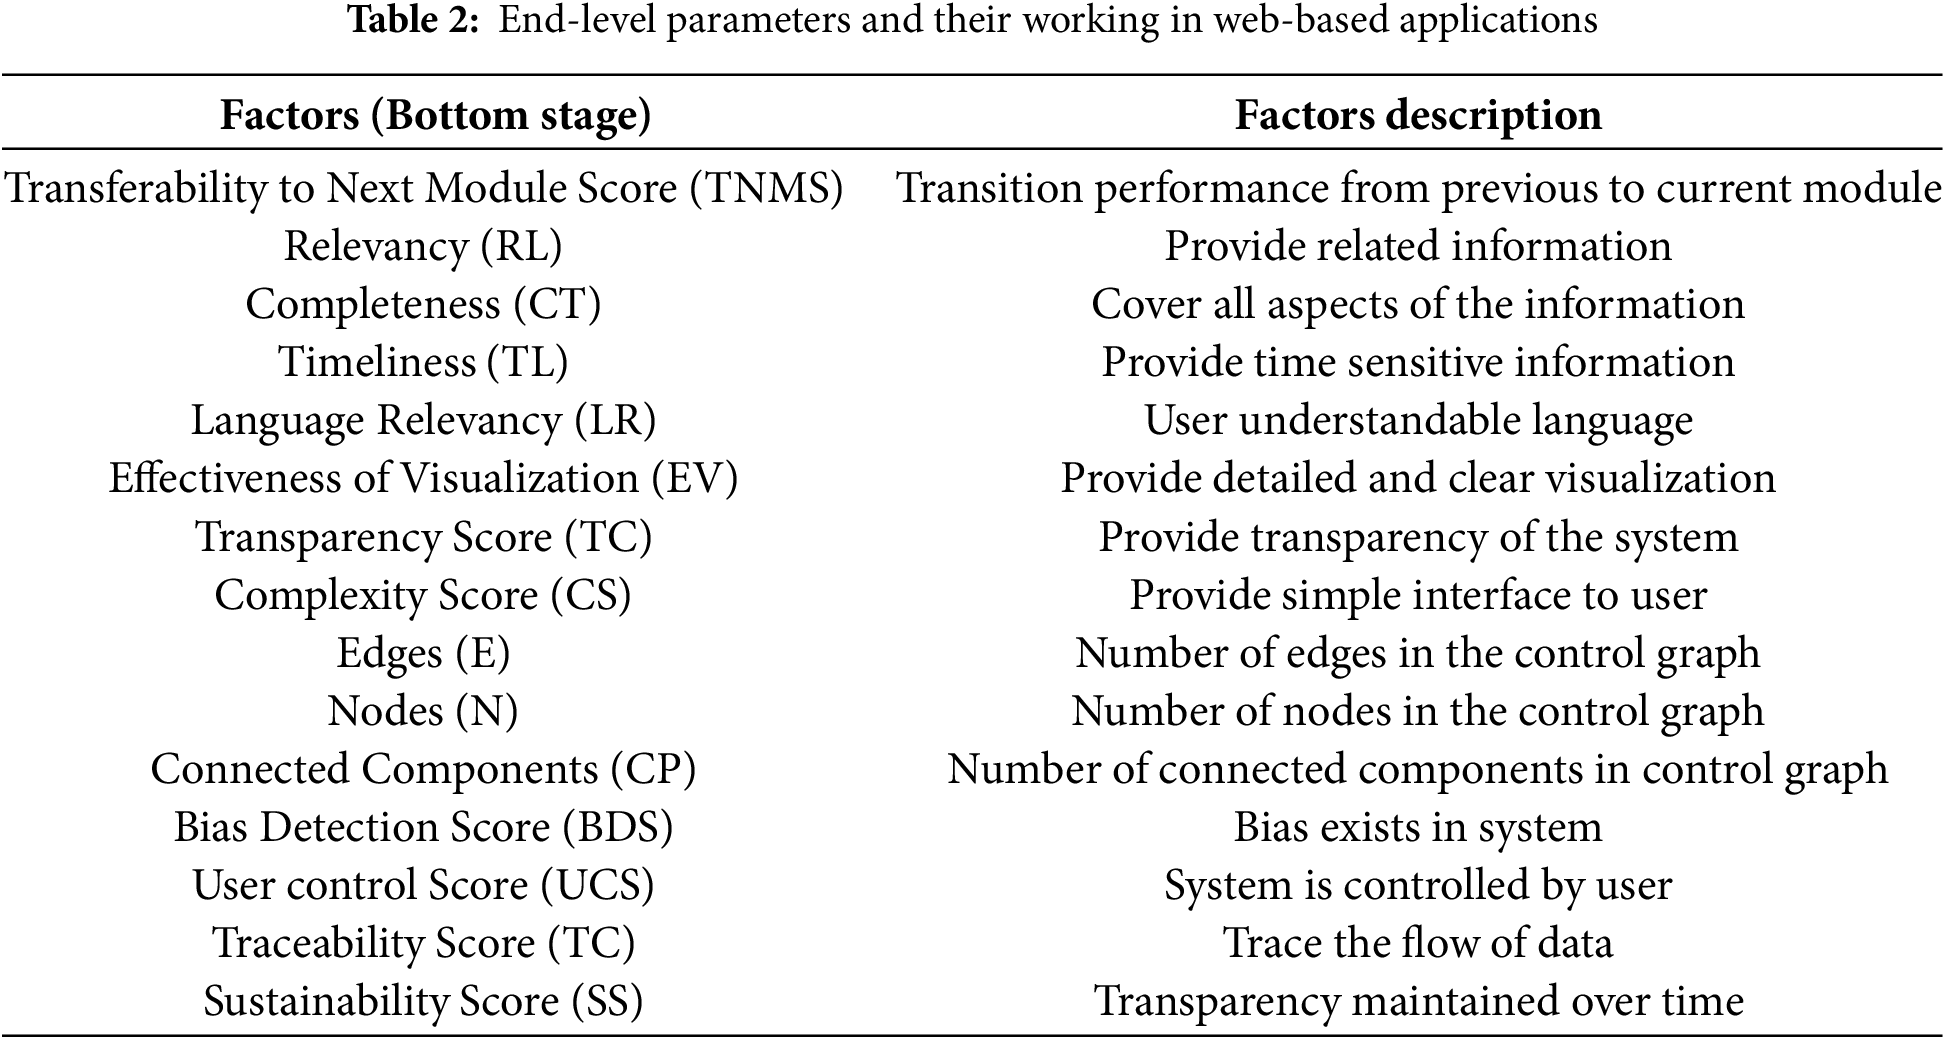
These parameters help to implement the explainability in the overall application for the user and transfer data from the databases to the user interface. The user gets the details of each module in the web-based application through the implemented parameters which helps to deal with the transparent system.
4.1 Scenario 1: Explainable Transparency Using XUIMM and XTPM
In the user-interactive model, the aim is to make the system explainable at the user interface. To introduce this explainability, we implement three parameters in this model. Therefore, the complexity of the user-interactive model is calculated using three scenarios. Fig. 5 depicts Scenario 1 where the green line is moved from the XUIMM to the transferability parameter and simulatability parameter from the XTPMM.
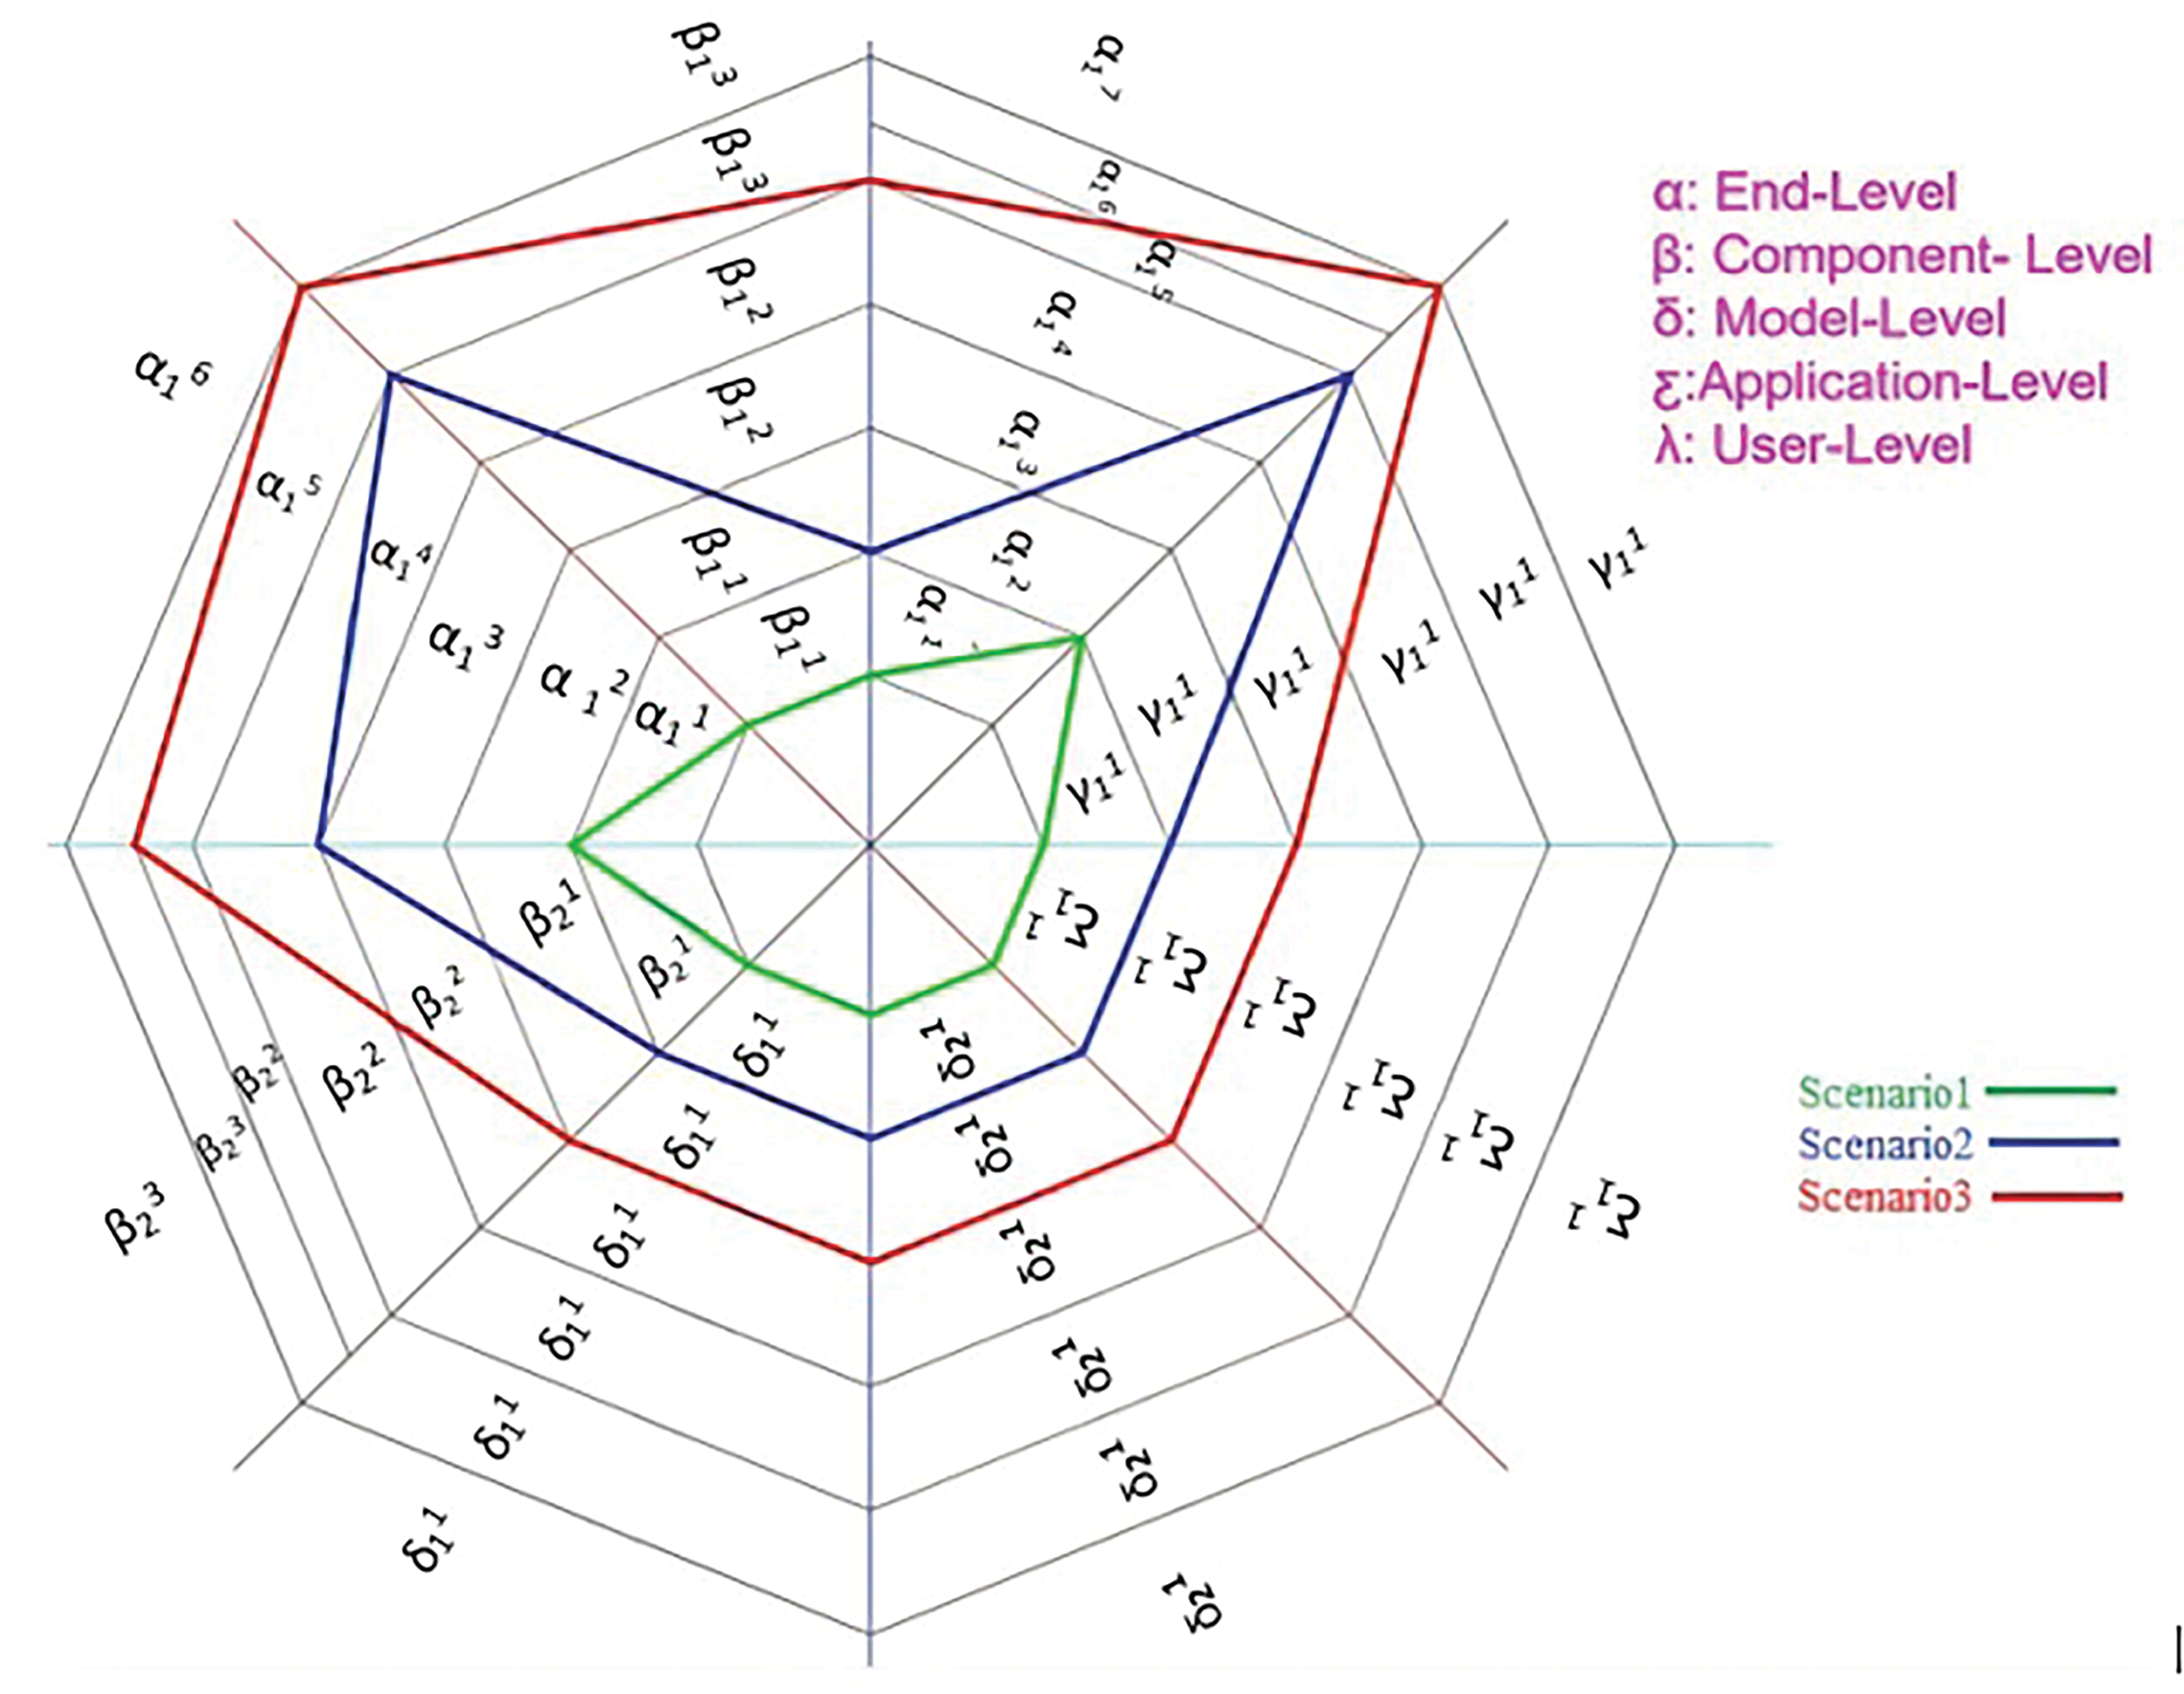
Figure 5: Spiral Graph showing the comparative evaluations for Scenario 1 (Green), Scenario 2 (Blue) and Scenario 3 (Red) of web-based application for multi-domain sentiment analysis
The total number of edges is the complexity of this parameter. The complexity of the transferability parameter to introduce explainability is calculated using Eq. (25) which is 5 units.
Eq. (26) provides the complexity of simulatability factors of XTPMM which is 6 units.
4.2 Scenario 2: Transferability and Informativeness Using XUIMM and XTPM
In Scenario 2 for user-interactive model, the transferability and informativeness parameters are implemented. In Fig. 5, the green and blue lines are used to calculate the complexity of the defined parameters. The Eq. (27) describes that the complexity is 9 units to implement this model.
We consider two parameters of XTPMM such as simulatability and decomposability to evaluate the complexity of this model in explainable model. The 10 units are used to define the complexity of this scenario mentioned in Eq. (28) by using the lines green and blue presents in Fig. 5.
4.3 Scenario 3: Algorithmic Transparency Using XUIMM and XTPM
Explainability of the web-based application can extend by incorporating one more parameter in XUIMM and XTPMM which is accessibility and algorithmic transparency. In Scenario 3, we incorporate all the three defined models which enhance the explainability of the system. Fig. 5 depicts the green, blue, and red lines intersecting each level. Therefore, we select all the edges of the XUIMM to calculate its complexity which is 12 units defined in Eq. (29).
The three parameters are defined in XTPMM including simulatability, decomposability, and algorithmic transparency. In Scenario 3, all these parameters are used to measure the complexity of the model. The major emphasizes of the complexity described in Eq. (30) is the factors that are defined in this model such as TC, CS, E, N, CP, UCS, BDS, TC, and SS.
The average complexity to implement all the parameters of XUIMM is calculated with defined factors such as TNMS, RL, CT, TL, LR, and EV. All the scenarios are considered to get the average complexity of the user-interactive model which is (5 + 9 + 12)/3 = (26)/3 = 8 units. The Average explainable complexity of the transparent model is calculated to be (6 + 10 + 15)/3 = (31)/3 = 10 units, which is acceptable for this model.
4.4 Explainable Design Complexity Modulation
The design complexity metrics determine the overall complexity of the web-based application to introduce the explainable model. Different scenarios are considered to measure the complexity with various parameters of defined models. Green, blue, and red lines in Fig. 5 depict the complete scenarios to calculate complexity by providing details of each model. The design complexity of this web-based application is measured with the XDCM metrics by evaluating the unit cost of each factor and parameters involved in the model.
The average design complexity is 10 to 20 units in this case study of a web-based multidomain sentiment analysis application which is calculated as (25/26). It is the perfect case as it is less than the total number of components. Therefore, our design-level explainable model is an extremely simple system for web-based applications.
In this proposed work, design quality metrics of the explainable model for web-based applications are evaluated for multi-domain sentiment analysis. An abstract graph is utilized to implement the explainable model on web-based applications. Design models are defined to develop design quality metrics, including Explainable User-Interactive Model Metrics, Explainable Transparent Model Metrics, and Explainable Design Complexity Metrics. The defined metrics are evaluated using a case study of a web-based multi-domain sentiment analysis application, and results are compared with the assigned work range in this study. The X-OODM can be integrated into existing methodologies as a learning curve by facilitating developers with object-oriented design and explainability principles. System developers map the components of explainability, including transferability, fairness, and transparency, into the multi-domain sentiment analysis application, which is then implemented through various tools and libraries to ensure the explainable design level. These explained elements such as transferability, fairness, and transparency are mapped to the multi-domain sentiment analysis application developed by the system developers for the purpose of implementation using different tools and libraries to ensure an appropriate explainable design level.
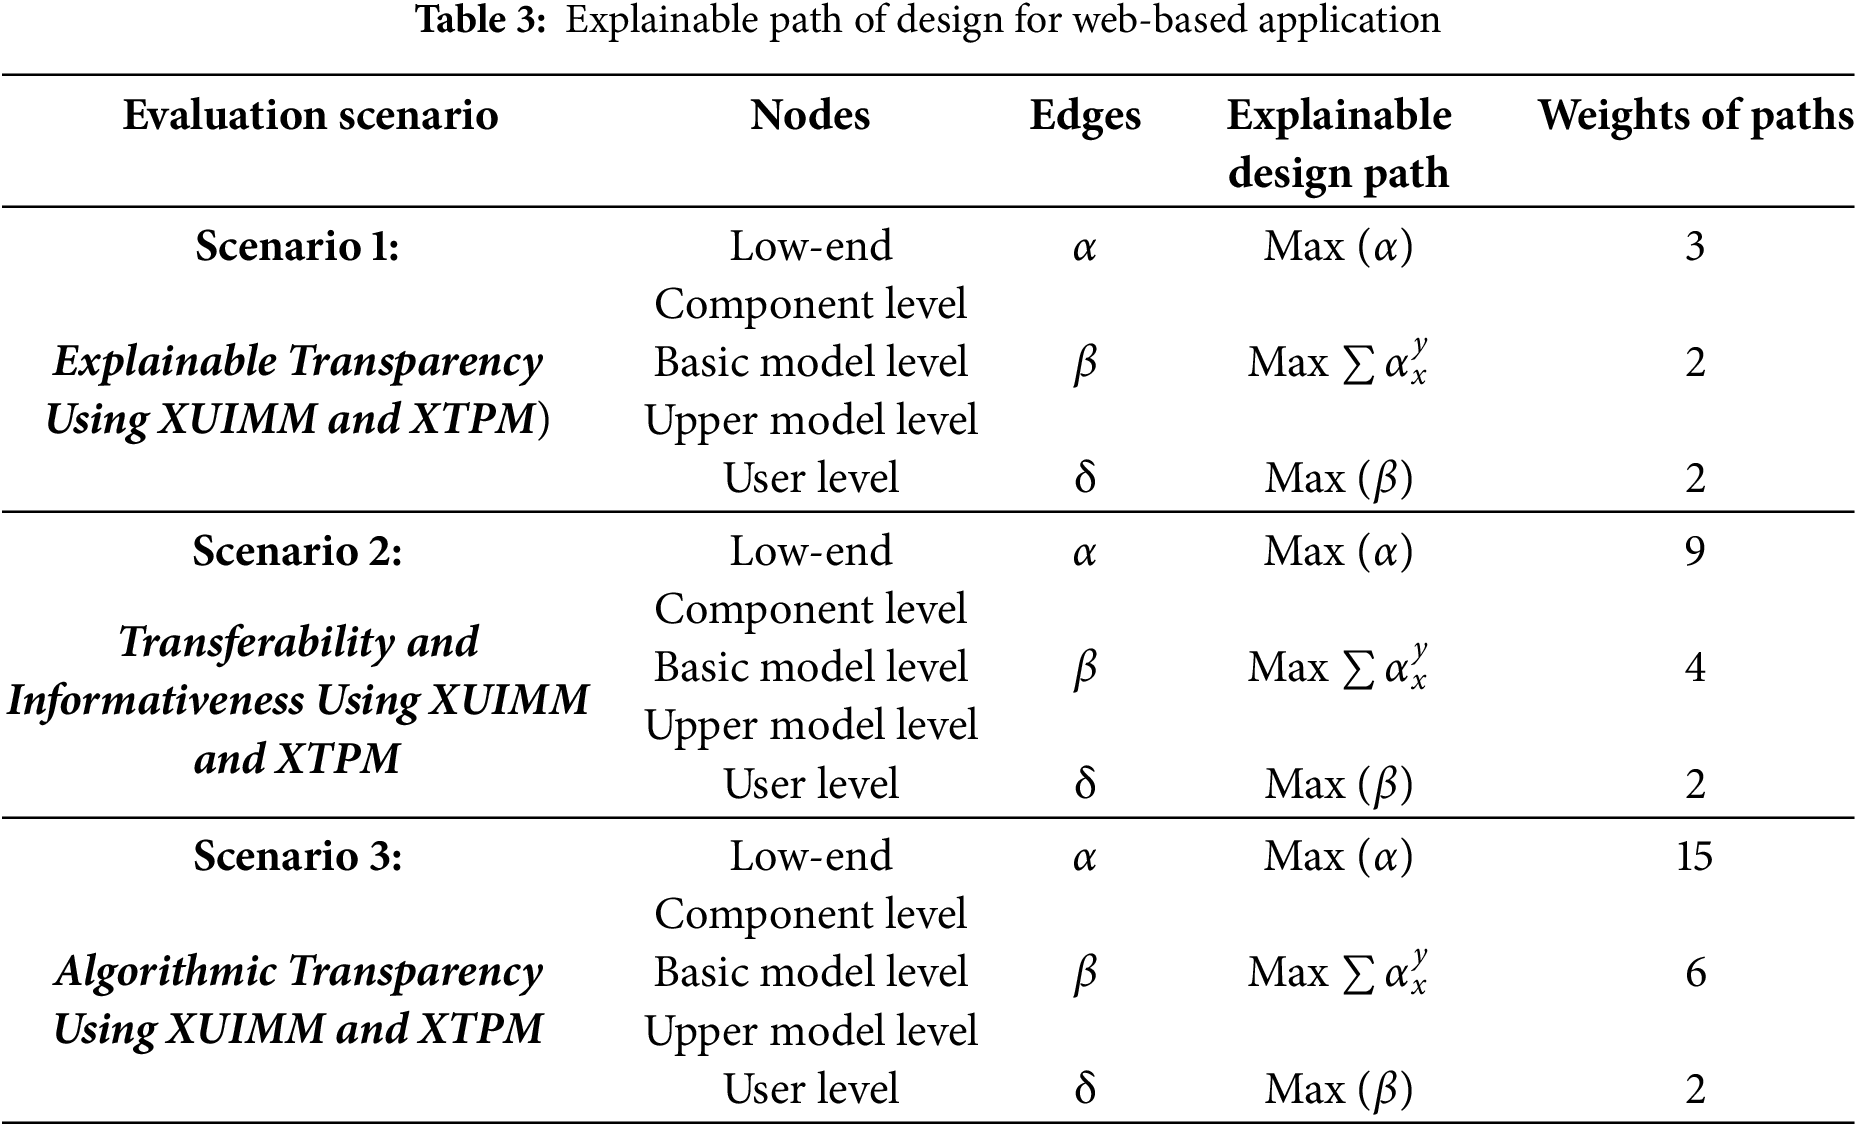
In Table 3, we present the results of every overall scenario and, after that, benchmark it to the realistic result. The results of the defined metrics are validated against benchmark values obtained from experts in web-based applications. Defined metrics yield accurate values that are consistent with the predicted parameters. Parameters such as completeness, timeliness, and interaction time with other modules are employed to measure scalability at the design level. The values of these parameters are utilized to assess the scalability of the system when large data is input to the application. The optimal model is the one that provides higher explainability in the web-based application, which corresponds to the defined metrics with the maximum values.
This research highlights that X-OODM serves as an important contribution to developing multi-domain sentiment analysis systems by enriching the traditional OODM with explainability attributes. It fills up the critical gap of transparency and interpretability that so far existed without explanations inside web-based applications of sentiment analysis. The proposed methodology makes all the design elements, from data structure to user interfaces, more transparent with better user trust and decision-making. Thus, the experiments prove that explainability should be introduced early in the design process to result in sturdy, user-friendly, and trustworthy systems. This contribution thus marks a new benchmark for future work on sentiment analysis systems, such that systems are not only highly accurate but also understandable and reliable when presented to end-users. The paper further introduces design quality metrics such as Explainable User-Interactive Model Metrics, Explainable Transparent Model Metrics, and Explainable Design Complexity Metrics which are fundamental in assessing the explainability of multi-domain sentiment analysis systems. Using these metrics, the research reveals that the deployment of X-OODM based sentiment analysis systems increases the transparency of the system while holding its design complexity at manageable levels to make applications of the system more efficient and interpretive.
Acknowledgement: The authors sincerely acknowledge the support from collaborators for this research.
Funding Statement: The authors acknowledge the support of the Deanship of Research and Graduate Studies at Ajman University under Projects 2024-IRG-ENiT-36 and 2024-IRG-ENIT-29.
Author Contributions: Conceptualization, proposed framework and developing the methodology for writing the original work were led by Abqa Javed. Abdul Jaleel, M. Shoaib and M. Deriche supervised the algorithm implementation, data analysis and results, developed by Abqa Javed. Sharjeel Nawaz contributed in validation, investigation, resources, data curation and original draft preparation. M. Shoaib leaded the final writing whereas M. Deriche worked on review, edition, validation and funding acquisition. All authors reviewed the results and approved the final version of the manuscript.
Availability of Data and Materials: Data used in this research are available on request.
Ethics Approval: Not applicable.
Conflicts of Interest: The authors declare no conflicts of interest to report regarding the present study.
References
1. Swacha J, Kulpa A. Evolution of popularity and multiaspectual comparison of widely used web development frameworks. Electronics. 2023;12(17):3563. doi:10.3390/electronics12173563. [Google Scholar] [CrossRef]
2. Bektemyssova G, Guldana S, Yerassyl A. Application of recommended systems for E-commerce. Procedia Comput Sci. 2024;231:329–34. doi:10.1016/j.procs.2023.12.212. [Google Scholar] [CrossRef]
3. Abdessamad B, Boumhidi A, Nfaoui EH. Mining online reviews to support customers’ decision-making process in E-commerce platforms: a narrative literature review. J Organ Comput Electron Commerce. 2022;32(1):69–97. doi:10.1080/10919392.2022.2053454. [Google Scholar] [CrossRef]
4. Georgios K, Davrazos G, Kotsiantis S. Explainable artificial intelligence-based decision support systems: a recent review. Electronics. 2024;13(14):2842. doi:10.3390/electronics13142842. [Google Scholar] [CrossRef]
5. Alexandra VA, Bădică C. Recommender systems: an explainable AI perspective. In: 2021 International Conference on Innovations in Intelligent Systems and Applications (INISTA); 2021; Kocaeli, Turkey: IEEE. p. 1–6. [Google Scholar]
6. Rajesh S, Ray S. Explanations in recommender systems: an overview. Int J Bus Inf Syst. 2016;23(2):248–62. doi:10.1504/IJBIS.2016.078909. [Google Scholar] [CrossRef]
7. Fabian G, Tomitza C, Winkelmann A. Comparing expert systems and their explainability through similarity. Decis Support Syst. 2024;182(1):114248. doi:10.1016/j.dss.2024.114248. [Google Scholar] [CrossRef]
8. Guanghao X, Yan K, Zhou X. A distributed learning-based sentiment analysis methods with web applications. World Wide Web. 2022;25(5):1905–22. doi:10.1007/s11280-021-00994-0. [Google Scholar] [CrossRef]
9. Phan HT, Nguyen NT, Tran VC, Hwang D. A sentiment analysis method of objects by integrating sentiments from tweets. J Intell Fuzzy Syst. 2019;37(6):7251–63. doi:10.3233/JIFS-179336. [Google Scholar] [CrossRef]
10. Ribana R, Bohn B, Duarte MF, Garcke J. Explainable machine learning for scientific insights and discoveries. IEEE Access. 2020;8:42200–16. doi:10.1109/ACCESS.2020.2976199. [Google Scholar] [CrossRef]
11. David G, Stefik M, Choi J, Miller T, Stumpf S, Yang GZ. XAI—explainable artificial intelligence. Sci Robot. 2019;4(37):eaay7120. doi:10.1126/scirobotics.aay7120. [Google Scholar] [PubMed] [CrossRef]
12. Vera LQ, Gruen D, Miller S. Questioning the AI: informing design practices for explainable AI user experiences. In: Proceedings of the 2020 CHI Conference on Human Factors in Computing Systems; 2020; Honolulu, HI, USA. p. 1–15. [Google Scholar]
13. Federico N, Aliprandi C, Capeci F, Cuadros M. Sentiment analysis on social media. In: 2012 IEEE/ACM International Conference on Advances in Social Networks Analysis and Mining; 2012; USA: IEEE. p. 919–26. [Google Scholar]
14. Rudresh D, Dave D, Naik H, Singhal S, Omer R, Patel P, et al. Explainable AI (XAIcore ideas, techniques, and solutions. ACM Comput Surv. 2023;55(9):1–33. doi:10.1145/3561048. [Google Scholar] [CrossRef]
15. Shah A. OODM: an object-oriented design methodology for development of web applications. In: Information modeling for internet applications. Nijmegen, The Netherlands: IGI Global; 2003. p. 189–229. [Google Scholar]
16. Farooq A, Ahsan S, Shah A. Engineering semantic web applications by using object-oriented paradigm. arXiv:1006.4562. 2010. [Google Scholar]
17. Ghani MU, Zafar M, Arshad MJ, Asif KH, Shah AA. Reverse object-oriented design methodology (R-OODM). J Facu Eng Technol. 2014;21(2):60–81. [Google Scholar]
18. Arshad S. S-OODM: a secure object-oriented design methodology. Pak J Sci. 2010;62(1). [Google Scholar]
19. Walker IJ. Requirements of an object-oriented design method. Softw Eng J. 1992;7(2):102–13. doi:10.1049/sej.1992.0011. [Google Scholar] [CrossRef]
20. Marinescu R. Measurement and quality in object-oriented design. In: 21st IEEE International Conference on Software Maintenance (ICSM’05); 2005; Budapest, Hungary: IEEE. p. 701–4. [Google Scholar]
21. Liang WY, O’Grady P. Design with objects: an approach to object-oriented design. Comput-Aid Des. 1998;30(12):943–56. doi:10.1016/S0010-4485(98)00050-5. [Google Scholar] [CrossRef]
22. Kiewkanya M, Jindasawat N, Muenchaisri P. A methodology for constructing maintainability model of object-oriented design. vol. 6, In: In: Proceedings of the Fourth International Conference on Quality Software (QSIC); 2004; Braunschweig, Germany: IEEE. p. 206–13. [Google Scholar]
23. Kadam SP, Joshi S. Secure by design approach to improve security of object-oriented software. In: 2015 2nd International Conference on Computing for Sustainable Global Development (INDIACom); 2015; New Delhi, India: IEEE. p. 24–30. [Google Scholar]
24. Jangra K, Dua K. Healthcare management information systems with object-oriented methodology. Int J Inform Technol. 2012;5(1):234–9. [Google Scholar]
25. Mohapatra S, Paul K, Roy A. Object-oriented modeling of cloud healthcare system through connected environment. In: Applications of Internet of Things: Proceedings of ICCCIOT 2020; 2021; Singapore: Springer Singapore. p. 151–64. [Google Scholar]
26. Nwokoro I, Nwatu AN. Application of object-oriented analysis and design methodology in modeling of university administrative information system. Acad Lett. 2021. doi:10.20935/AL3853. [Google Scholar] [CrossRef]
27. Arulprakash E, Martin A. An object-oriented neural representation and its implication towards explainable AI. Int J Inform Technol. 2024;16(3):1303–18. doi:10.1007/s41870-023-01432-2. [Google Scholar] [CrossRef]
28. Geyer P, Singh MM, Chen X. Explainable AI for engineering design: a unified approach of systems engineering and component-based deep learning. arXiv:2108.13836. 2021. [Google Scholar]
29. Arrieta AB, Rodríguez ND, Ser JD, Bennetot A, Tabik S, Barbado A, et al. Explainable Artificial Intelligence (XAIconcepts, taxonomies, opportunities and challenges toward responsible AI. Inf Fusion. 2020;58(3):82–115. doi:10.1016/j.inffus.2019.12.012. [Google Scholar] [CrossRef]
30. Huynh TD, Tsakalakis N, Helal A, Stalla-Bourdillon S, Moreau L. A methodology and software architecture to support explainability-by-design. arXiv:2206.06251. 2022. [Google Scholar]
31. Hsiao JHW, Ngai HHT, Qiu L, Yang Y, Cao CC. Roadmap of designing cognitive metrics for explainable artificial intelligence (XAI). arXiv:2108.01737. 2021. [Google Scholar]
32. McCabe TJ, Butler CW. Design complexity measurement and testing. Commun ACM. 1989;32(12):1415–25. doi:10.1145/76380.76382. [Google Scholar] [CrossRef]
33. Javed A, Shoaib M, Jaleel A. X-OODM: explainable object-oriented design methodology. IEEE Access. 2024;12(2):150807–23. doi:10.1109/ACCESS.2024.3477553. [Google Scholar] [CrossRef]
34. Schwabe D, Rossi G. An object-oriented approach to web-based applications design. Theory Pract Object Syst. 1998;4(4):207–25. doi:10.1002/(ISSN)1096-9942. [Google Scholar] [CrossRef]
35. Rossi G, Schwabe D, Lyardet F. Web application models are more than conceptual models. In: Advances in Conceptual Modeling: ER’99 Workshops on Evolution and Change in Data Management, Reverse Engineering in Information Systems, and the World Wide Web and Conceptual Modeling; 1999 Nov 15–18; Paris, France. Berlin/Heidelberg: Springer; 1999. p. 239–52. [Google Scholar]
Cite This Article
 Copyright © 2025 The Author(s). Published by Tech Science Press.
This work is licensed under a Creative Commons Attribution 4.0 International License , which permits unrestricted use, distribution, and reproduction in any medium, provided the original work is properly cited.
 Downloads
 Citation Tools