
 Submit a Paper
 Propose a Special lssue
 Open Access
ARTICLE

Smart Grid Security Framework for Data Transmissions with Adaptive Practices Using Machine Learning Algorithm
1 School of Built Environment, Engineering and Computing, Leeds Beckett University, Leeds, LS13HE, UK
2 Department of Computer Science and Engineering, Chennai Institute of Technology, Chennai, 602109, India
3 Centre for Research Impact & Outcome, Chitkara University, Chandigarh, 140401, India
4 Department of Electronics and Communication Engineering, Panimalar Engineering College, Chennai, 600123, India
5 Department of Self-Development Skill, Common First Year Deanship, King Saud University, Riyadh, 11362, Saudi Arabia
6 Department of Computer Science, College of Computer and Information Sciences, King Saud University, Riyadh, 11543, Saudi Arabia
7 Department of Information Systems, College of Computer and Information Sciences, King Saud University, Riyadh, 11543, Saudi Arabia
* Corresponding Author: Shitharth Selvarajan. Email:
(This article belongs to the Special Issue: Best Practices for Smart Grid SCADA Security Systems Using Artificial Intelligence (AI) Models)
Computers, Materials & Continua 2025, 82(3), 4339-4369. https://doi.org/10.32604/cmc.2025.056100
Received 14 July 2024; Accepted 02 February 2025; Issue published 06 March 2025
 View Full Text
 Download PDF
Abstract
This research presents an analysis of smart grid units to enhance connected units’ security during data transmissions. The major advantage of the proposed method is that the system model encompasses multiple aspects such as network flow monitoring, data expansion, control association, throughput, and losses. In addition, all the above-mentioned aspects are carried out with neural networks and adaptive optimizations to enhance the operation of smart grid networks. Moreover, the quantitative analysis of the optimization algorithm is discussed concerning two case studies, thereby achieving early convergence at reduced complexities. The suggested method ensures that each communication unit has its own distinct channels, maximizing the possibility of accurate measurements. This results in the provision of only the original data values, hence enhancing security. Both power and line values are individually observed to establish control in smart grid-connected channels, even in the presence of adaptive settings. A comparison analysis is conducted to showcase the results, using simulation studies involving four scenarios and two case studies. The proposed method exhibits reduced complexity, resulting in a throughput gain of over 90%.Keywords
Enhancing the security of interconnected grid components is crucial for the transformation of traditional smart grid networks. This would facilitate a reduction in total demand and encourage the development of an interactive system. Furthermore, smart grid networks must deliver demand responses to end users in a clear and useful manner. It is imperative to underscore that these responses must exclude any interaction with other users. Smart grids enable real-time monitoring and control, allowing for the efficient utilization of allocated resources. To enhance the detection of failure scenarios in smart grid development, it is imperative to create standards for all important systems. This will provide improved management of total power system disruptions by employing continuous learning principles, as suggested in the proposed strategy. The enhanced interconnection of units within the smart grid requires adaptable monitoring of information flows to efficiently handle dynamic fluctuations. Nonetheless, establishing connections only via graph networks facilitates effective supervision and regulation of the entire smart grid. As a result, we execute data modifications flawlessly, exceeding the efficiency of conventional grid operations. In contrast, these links utilize an adaptable strategy, suggesting the possibility of modifications in smart grids and extensive network administration. Moreover, subsequent to determining the requisite probability, we monitor the losses in data transmissions. In this context, we apply the proposed technique, leading to diminished durations of data breaches. As a result, the previously described modifications and visual associations eliminate any disruptions, ensuring the stability and credibility of the entire smart grid network for users, along with very useful alternatives. Fig. 1 depicts a block schematic of the proposed methodology, highlighting its integration with smart grid connections and underscoring its security attributes.
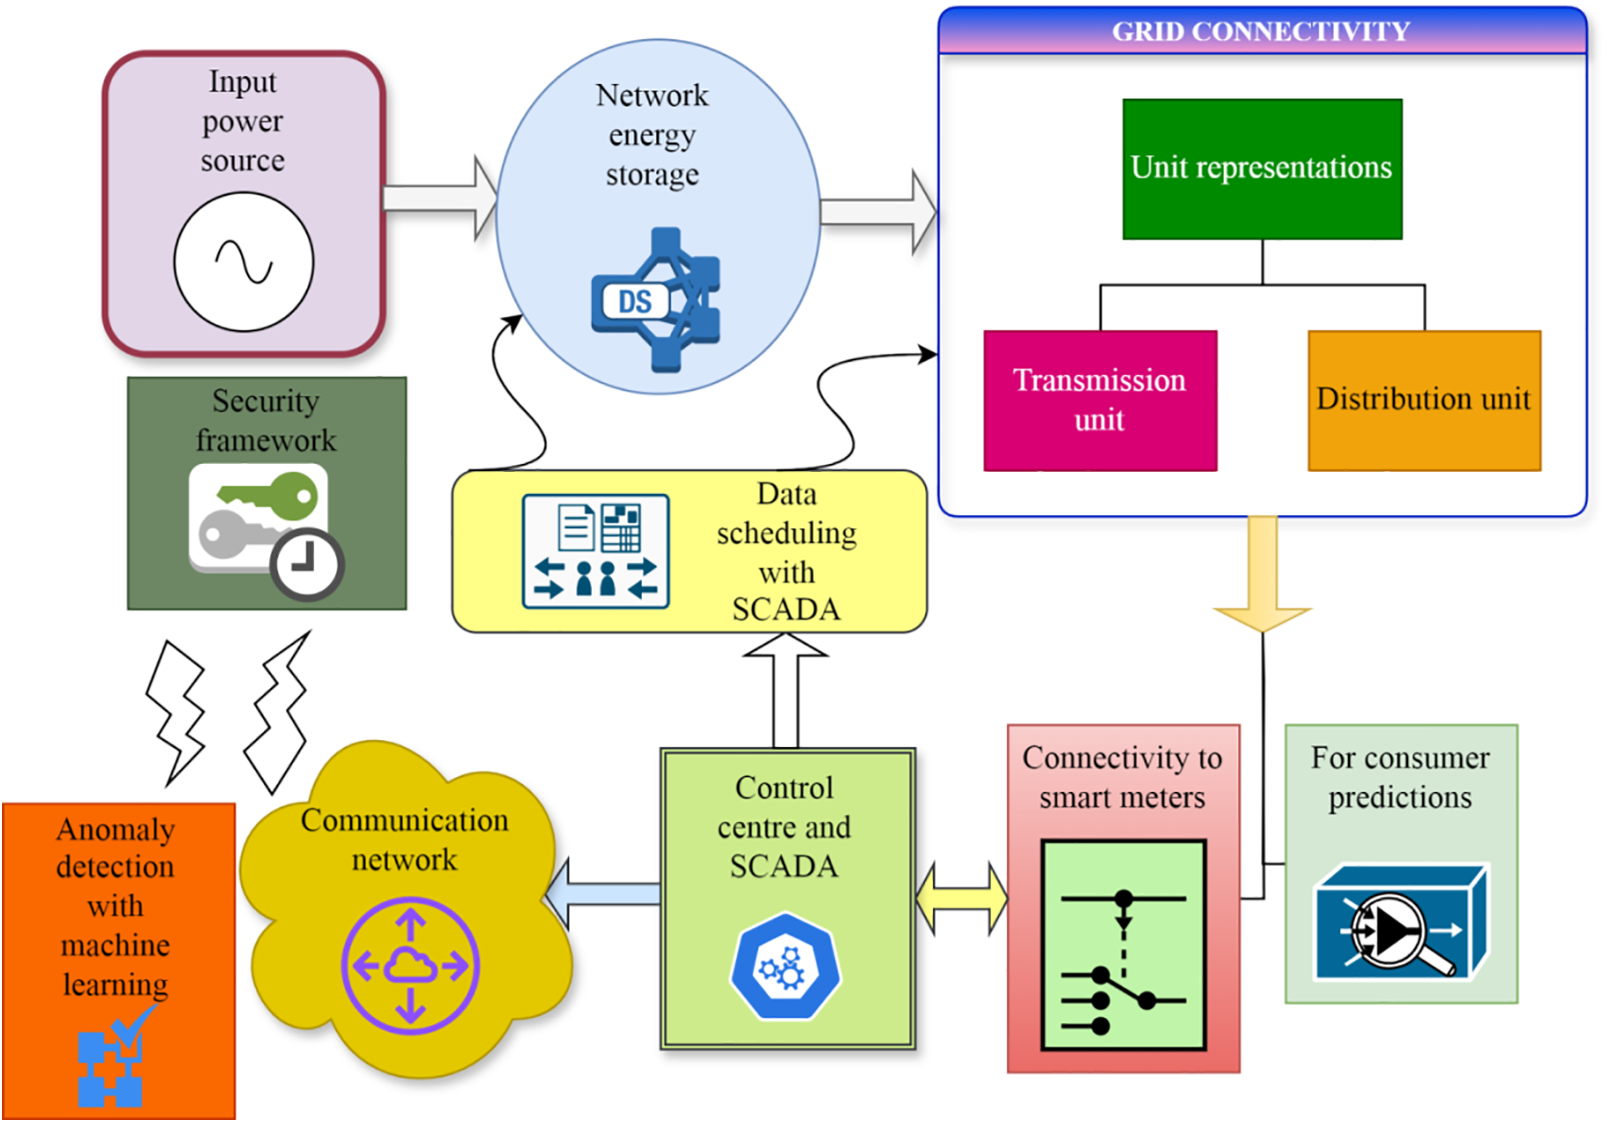
Figure 1: Block diagram of the proposed method for smart grid with security measures
The smart grid, which incorporates digital communication networks for the efficient distribution of power, necessitates the security of all components, including smart meters, sensors, and interconnectivity frameworks, to enable communication among devices and advanced infrastructures. Physical infrastructures limit smart grid units to maintain a suitable balance between supply and demand, hence preventing any unauthorized access. Furthermore, it is imperative to formulate extensive security procedures to preserve the integrity of networked representations and to execute suitable optimizations to diminish energy consumption. Conversely, if integrated smart grid functions utilize machine learning, predictive maintenance can be executed, hence reducing operational durations and alleviating undesirable network flows, which prevents energy losses. Fig. 1 depicts the linkage of input power sources to grid units, accompanied by relevant storage units. We divide the grid into two segments: transmission and distribution. Data scheduling is independently managed for each unit. We implement a scheduling protocol to safeguard essential data and enhance connectivity with smart meters. This allows each user to accurately forecast their grid use. The outlined scenario utilises separate control centres and an autonomous communication unit. Machine learning algorithms, embedded inside a holistic security framework for each interconnected grid unit, detect irregularities. This ensures the prevention of data loss in each grid.
1.1 Background and Related Works
To comprehend the functionality of smart grids concerning security-based transmissions, it is essential to examine the existing literature that offers a comprehensive examination of connected concepts. Therefore, with a comprehensive study, it is feasible to modernise the current infrastructure, allowing for the assessment of security risks by incorporating modification considerations. Furthermore, it is feasible to modify the system model systematically, hence employing standard representations. In [1], all challenges associated with traditional units are analysed, hence establishing a reformed network for power units. Thus, a possible correlation between innovative methods that enhance communication units is governed. The implementation of a control unit resolves all privacy-related issues, hence establishing linkages based on immutable variables inside a changed infrastructure spanning three domains. While infrastructure is suitable for smart grids, it is possible to create a comprehensive field just based on current cases; hence, constructing a network with advanced features becomes considerably more difficult. A power trapping method is analyzed, emphasizing possible risks associated with increased power usage that lead to reduced security features in cases of data processing imbalance [2]. Hybrid network processes are utilized to avert such imbalances, guaranteeing that actual smart meters provide equitable information to all end users. The discussion on the correlation coefficient reveals markedly low values, complicating the attainment of optimal categorization outcomes due to the predominance of detrimental behavior. The efficiency is reduced by 2% due to dimensionality challenges faced during feature extraction with a large dataset in interconnected units.
In contrast, current challenges and necessary solutions for cloud-based smart grid systems are analyzed, including intrusion detection units. Considering the variety of intrusion kinds, potential preventive solutions can be proposed through either rule-based or tree-based techniques [3]. The principal constraint of the rule-based technique is that the smart grid is incapable of operating in adaptable environments, hence restricting it to achieving only validated solutions where attacks are alleviated through continuous learning opportunities. Nonetheless, the previously mentioned instance operates within conditional units; however, similar possibilities are also observable with unconditional units through the incorporation of smart metering infrastructure, thereby enabling data exchange between entities without compliance with regulations or hierarchical protocols [4]. Thus, existing infrastructure may be maintained, facilitating the implementation of autonomous control at a low cost, while reducing losses. Owing to unconventional methodology, feasible solutions can only be achieved using quantum key protocols; consequently, for every infrastructure alteration, a unique environment must be established by enabling key agreements inside the available grid units. Smart grids, characterized by bidirectional flows, can incorporate other technologies alongside the Internet of Things, enhancing communication to reduce various losses in interconnected grid units [5]. This bidirectional flow considers existing infrastructures, implementing replacements at each level for internal compensations, where predictive maintenance actions occur. The majority of existing infrastructures are designed based on a unique flow analysis, making them unsustainable beyond certain thresholds.
Furthermore, to maintain stability in smart grids, deep learning techniques are utilized, integrating two separate processes for data normalization and transformation [6]. Subsequently, the input, hidden, and output terminals for smart grid stability are examined, yielding clear signs at this stage with neural networks to improve security beyond established criteria. A systematic approach is utilized for the dynamic interconnection of grid units at three levels, employing statistical analysis to guarantee security in all interconnected scenarios. This type of connection results in significant losses at concealed terminals, hence hindering the implementation of effective predictive maintenance for interconnected smart grid systems. Mathematical approaches for standard representations are devised, permitting broad interconnections between two independent nodes, including both internal and external units [7]. The substitution of three layers with two node connections employs a dual strategy, guaranteeing the dynamic establishment of all targeted resources, and averting fundamental reproductions in this scenario. In the described scenario, security patterns are reduced, and at equilibrium points, propagation-based scenarios are implemented, supplanting previously established units. Additionally, a blockchain-based methodology can be utilized for security solutions alongside an adaptive clustering technology, which reduces communication distance while maintaining necessary connectivity speed [8]. Block setups enhance the minimization of total delays and transmissions, while guaranteeing comprehensive security at each block. Table 1 presents a comparison of the existing and suggested methods concerning the specified objective patterns.

1.2 Research Gap and Motivation
Table 1 indicates that existing systems do not adhere to adaptive tactics, resulting in diminished data control and unregulated security. The diminished security characteristics of the smart grid unit exacerbate the complexity of connected networks, despite the presence of automatic detection systems utilizing deep learning and artificial intelligence approaches. To achieve comprehensive security, it is essential to connect the grid graphically, enabling optimal decision-making, a practice not adhered to in current methodologies. Furthermore, both reporting and monitoring grid units must be impervious to robust attacks; thus, it is essential to categorize tasks inside smart grid representations. Furthermore, to address the research gaps, solutions must be offered to the following enquiries:
Q1: Can the smart grid effectively reduce required power and voltage flows in response to detectable variations?
Q2: Is it possible to perform data modifications while preserving the associated flows in line connection representations?
Q3: Is it feasible to diminish attack durations in the smart grid while preventing losses, thereby optimizing throughput?
A security model incorporating stochastic optimisation is presented to enhance the existing technique, facilitating a thorough environmental study and the discovery of vulnerabilities [20]. The security model encompasses a collection of data attributes, resulting in a reduction of noise features throughout each pre-processing phase, while complexity is diminished through the identification of numerous elements. The primary disadvantage of stochastic optimisation is that it incorporates only probability-based data features, which can alter the scaling units used in training and classification, hence compromising the security of smart grids. Furthermore, an assessment technique is implemented to identify diverse frameworks in smart grids, so ensuring that index representations are accurately delivered, as hybrid security conditions are maintained despite data injections and varied service metrics [21]. Although hybrid security mitigates risks during data transmission, the analyzed system lacks adaptability to dynamic settings, hence compromising the smart grid measurement unit. Furthermore, each framework necessitates the implementation of crucial measures through the provision of corresponding relaxations, which is impracticable in real time due to fluctuating environmental variables. Additionally, the consumption aspects in smart grids are examined, with energy representations identifiable by a mixed neural network approach [22]. Given that neural networks offer a weighted unit under hidden conditions, the potential for data manipulation significantly increases in this context, necessitating mitigation at earlier stages. Despite a reduction in data tampering, isolated instances are found, resulting in a skewed dataset that undermines security inside the smart grid system.
In order to address the deficiencies described above, it is essential to include a learning model into the smart grid system. This model should include graph connectivity and adaptive solutions. Therefore, the primary aim of the suggested study is as follows:
• The objective is to decrease the volume of data and determine the number of channel transitions, which can help detect potential cases of identification in smart grids.
• In order to optimize data corrections, it is important to establish control at the required line units.
• The objective is to enhance the efficiency of smart grid units by minimizing data losses and detecting attack periods.
The novelty of the proposed method resides with respect to security framework in smart grid units where a design model is represented by following adaptive strategies. Conversely, for establishing complete security over smart grid units, the data transmission connectivity is introduced with adjustment of false data, thereby complete changes are identified which makes the grid to be more secure as compared to other methods where no adjustments are made. Further in the proposed method for every individual lines in grids a control strategy is followed therefore supplied power remains at stable state hence unnecessary attack periods are avoided.
The effective execution of smart grid security, involving all data operations performed using SCADA, necessitates the utilization of suitable parameters. Consequently, it is imperative to establish a standardized system model to guarantee the effective implementation of grid systems, allowing for requisite modifications. Furthermore, the requirement for an analytical framework that provides a uniform method for addressing various sorts of threats is perpetual and immutable at any point in time. Consequently, the existing infrastructure can be considered a feasible alternative for all enquiries, yielding economical answers.
During the early stages of data representation in a smart grid, it is challenging to distinguish between different networks that deliver the same data across the system. Therefore, in the proposed system, the continuous flow from interconnected networks is monitored and transmitted to the control center using Eq. (1) [14].
where,
Eq. (1) demonstrates that by utilizing SCADA, a shared communication unit may be built for n flows, effectively managing operational risks. Each network monitors the individual flow of both supply and capacity. Any anomalous flows in any state must be decreased.
In order to monitor the flow in networks, it is necessary to examine both the source and sink nodes in SCADA. By doing so, any increase in flow can indicate a potential reduction in capacity. Let’s define the data capacity of each network as the sum of
To demonstrate the feasibility of flows min-max representations, one might examine the scenario where the capacity is altered, leading to the disconnection of source units from sink units. Hence, in any situation when the flow in a smart grid surpasses the limit, it is necessary to follow a direction representation as specified in Eq. (3).
In order to minimize inaccuracies in smart grid measurements caused by fluctuations in voltage and current values over time, it is imperative to automatically modify the required data. This will prevent errors that may arise from manual adjustments made by external users. Therefore, these types of modifications can be expressed in a standardized format, as shown in Eq. (4) [2].
where,
Eq. (4) demonstrates that increasing the number of changes to its maximum value results in a decrease in error values, leading to an increase in gain across all interconnected SCADA units. Thus, implementing these alterations results in a compromised security, which effectively safeguards against full data failures in the event of cyber-attacks.
To calculate the overall number of redundancies in each SCADA connectivity, all ideal combinations are processed. This allows for the assessment of unknown data measurements in case of data modifications. Let’s denote the unknown data measurements as
To demonstrate the potential of data manipulation, random values can be assigned at each stage, allowing for the calculation of changes in voltage and power measurements. Therefore, a back access criteria can be devised to solve all inconsistent systems, which effectively lowers total redundancy as stated in Eq. (6).
By monitoring the value of phasor measurements that indicate the stability of current and voltage, it becomes possible to make precise adjustments. This is achieved by implementing a conversion technique that involves transforming analog-to-digital units at each stage of data processing. Therefore, the Eq. (7) can be used to represent the greatest observable alterations [8].
where,
According to Eq. (7), it is essential to regulate phase changes in all connected channels using filters. This allows for the modification of all blocks in the system, hence enhancing the stability of smart grids. In this situation, misleading information from smart grids is effectively managed through the use of filters that ensure accurate readings.
When variables are linked to respond to specific functions, it is necessary to represent all coordinate systems in an identical manner. This means that any changes made to individual values will have an impact on the entire smart grid system. Therefore, in order to minimize the effects of changes, it is necessary to adhere to the restriction outlined in Eq. (8).
Parametric identification is a valuable metric that should be used to assess significant changes. The rearrangement theorem is used to demonstrate the feasibility of replacing values with equal ones. However, with this particular sort of replacement, it is only possible to modify the existing grid measurements. It is not possible to add new measurements due to the requirement of enabling high security features, as specified by the limitation in Eq. (9).
When fault measurements occur in a smart grid, it is necessary to have a secondary control in place to ensure the system remains stable. This control should include the generation of power sources to maintain a specific set of values. By doing so, the entire smart grid system, including any possible interconnections, will be better protected. This is outlined in Eq. (10) [11].
where,
Eq. (10) states that individual line values must be measured in order to regulate the total load units effectively, hence ensuring that the producing units operate within the right operating limits. Hence, the need of complete relay blocks is circumvented, hence preventing tripping conditions in smart grid units and ensuring the protection of data during normal operation conditions.
By incorporating ordinary extensions into smart grid measures, it is possible to regulate the internal state representations comprising input and output units. Therefore, it is possible to monitor comprehensive dynamic controls throughout a specific time period in this scenario, thereby avoiding the need for intricate analysis as stated in Eq. (11).
In order to demonstrate the control systems indicated above, an automated control theory can be utilized. This involves connecting one component to another and employing linearization to enable precise measurements. Furthermore, the state relationship can be determined in this scenario by adhering to the constraint specified in Eq. (12).
Each smart grid connection must have a distinct definition of vulnerabilities in order to efficiently examine all potential locations and detect intrusions produced by other grid measurements within a shorter timeframe. Therefore, the total attack periods can be denoted using Eq. (13) in the following manner [17]:
where,
Eq. (13) establishes that in order to address all sorts of demand in a smart grid, it is necessary to give an appropriate reaction. This response allows for the identification of weaknesses in the relevant states, ultimately reducing the likelihood of connectivity issues. In this instance, it is possible to limit the false rate and lower the delay for SCADA communication over the entire grid.
In order to optimize the efficiency of smart grid units, it is necessary to assess the potential channel conditions and ensure that a comprehensive data integrity is maintained throughout the entire network. Eq. (14) indicates the potential for a secure grid design with enhanced throughput [1].
where,
Eq. (14) states that security control must be implemented effectively to integrate data features and necessary system contents. Therefore, in order to decrease the number of low availability situations in connected grid networks throughout the specified time period, it is necessary to increase the number of discoveries.
To ensure uninterrupted data transmission, it is crucial to minimize the occurrence of packet losses. This will help prevent any significant downtime during security events. Therefore, the overall number of configuration errors in this scenario can be minimized by preventing the occurrence of exploitable situations, as described in Eq. (15), by the implementation of appropriate human interventions [7].
where,
Eq. (15) states that it is necessary to prevent full intervention in smart grids in order to minimize standards infractions. Furthermore, the false negative rates for each dataset can be monitored during the first time period in order to minimize all types of delays, resulting in a reduction of patches at this point.
The aforementioned characteristics are essential for enhancing the security of smart grids, effectively minimizing vulnerabilities. Therefore, in order to achieve the desired min-max aim, a composite framework is required, as outlined in Eqs. (16) and (17).
In order to get a balanced solution in smart grids, it is necessary to analyze trade-offs with min-max criteria by integrating the composite functions into a single objective, as illustrated in Eq. (18).
Integrating machine learning models with the relevant parameters into smart grid systems is essential for maximizing operational efficiency and achieving optimal performance. The following is a description of the optimization technique.
In order to effectively manage complex data types associated with smart grid measurements, it is imperative to get a comprehensive understanding of the characteristics of the smart grid through the utilization of machine learning algorithms. By doing so, it becomes feasible to minimize overall mistakes even in the presence of large-scale environmental conditions. Due to the increased volume of data observed in each grid, there is a potential for an increase in anomalies. This can lead to the failure of linked equipment and the inability to give accurate phasor, voltage, and power measurements. One significant benefit of incorporating machine learning algorithms in smart grid systems is the ability to learn from both current and past situations, and analyze this information in real-time to reach desired outcomes. In this sort of learning, the comparison statement encompasses all possible outcomes for reaching complete stability, hence enhancing reliability as well. On the other hand, any modifications in the smart grid necessitate prompt resolution. Therefore, real-time monitoring is employed along with suitable solutions using machine learning algorithms. This ensures that all adaptive capabilities are executed, even when new data features are present. In addition, as stated in the system model, it is imperative to minimize human intervention in this form of grid connectivity. This may be achieved through the use of machine learning, which allows for continual enhancements to be noticed at all times. This is accomplished by creating relevant reports that are connected to the control center. By minimizing errors and vulnerabilities, it becomes feasible to implement previous learning elements that enhance planning capabilities. As a result, real-time exact solutions can be delivered with scalable units. Despite the existence of vulnerabilities, machine learning may effectively address predictive maintenance by adhering to individual timetables and preventing the failure of working components [23].
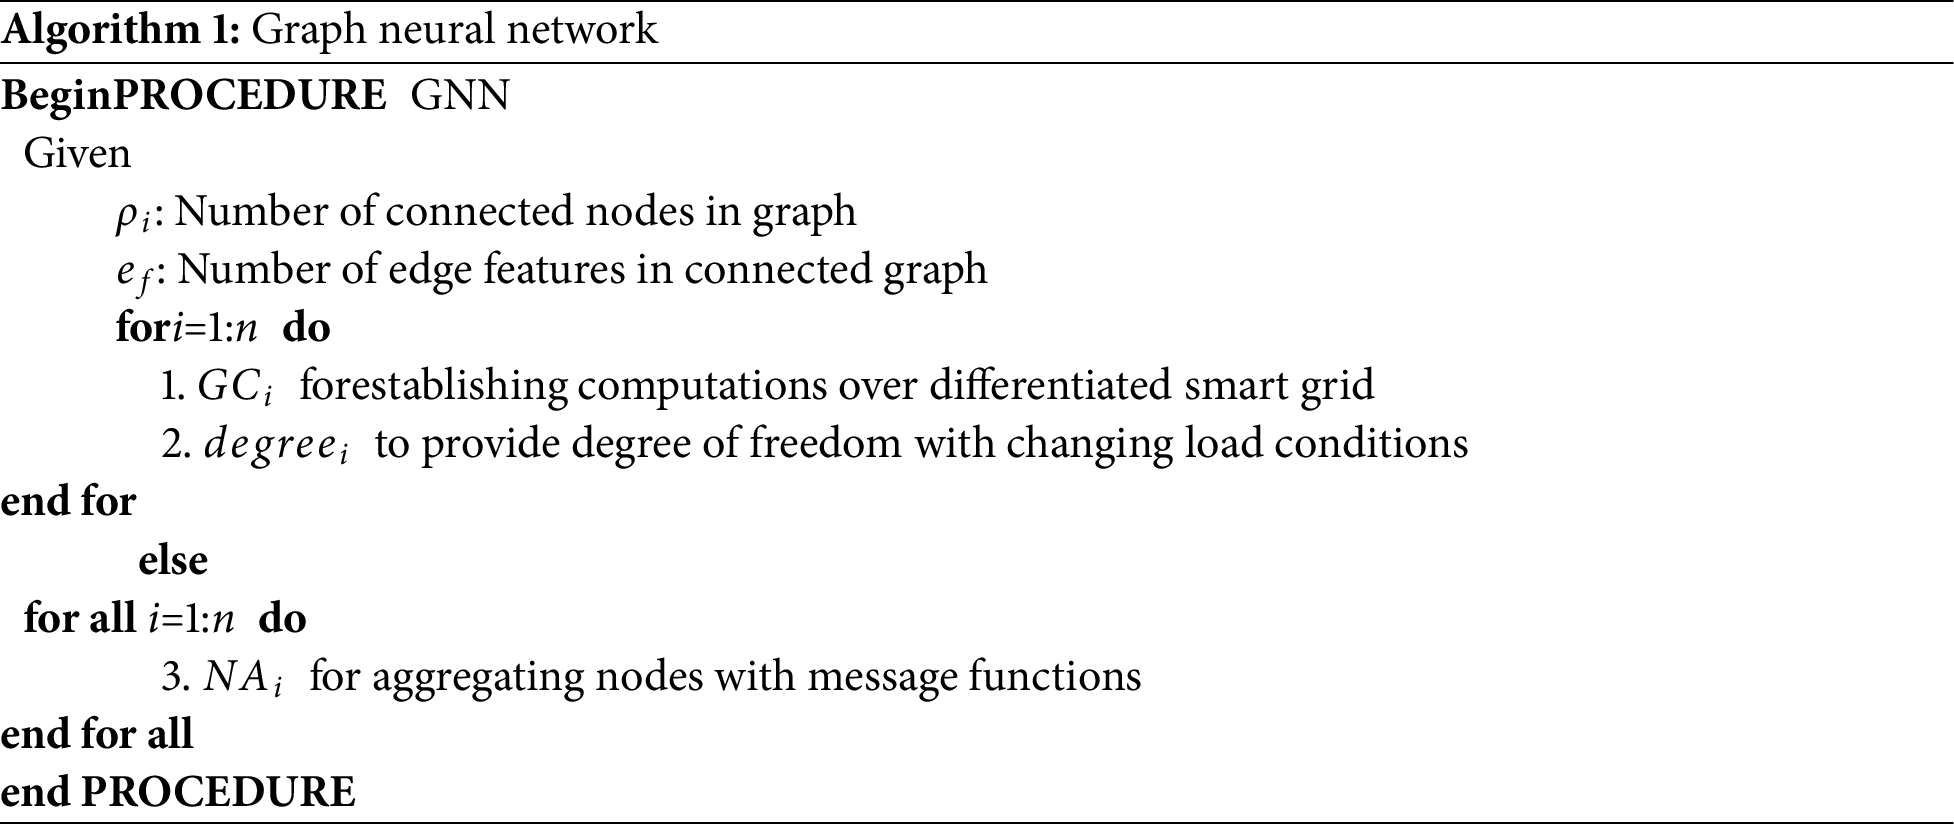
In the context of a smart grid, it is necessary to use a systematic modeling approach that follows a graph structure in order to detect anomalies occurring at different stages. Therefore, the suggested method utilizes a graph neural network, where all interconnected devices for creating smart grids are fully transformed into graph systems. One significant benefit of using graph neural networks in smart grids is the ability to mitigate the risk of full failure in parallel networks that are coupled in a cascading manner. This leads to improved balance and reliability in all communication channels. In order to identify any abnormal actions, it is important to create a model of the smart grid network by establishing appropriate interconnection. This will enhance the stability of the grid. Graph neural networks are meant to gather comprehensive information on interconnected substations in a certain area, enabling the identification of consumption trends. For each connected graph that represents nodes with complete information on loads, generation capacity, voltage, and power rating, continuous monitoring will be conducted. A comparison will be done with existing cases, and optimal judgments will be made based on insightful findings, without any more involvement. In order to make optimal judgments, it is necessary for the connected graph to be well-suited. This can only be achieved by following smart grid active patterns. By doing so, we may avoid complete reliance and vulnerability in this scenario. In order to enhance decision-making accuracy and minimize grid connectivity downtime, isolated data points are specifically identified by focusing just on border context, hence preventing anomalies. The translation process involving graphical units is accompanied by mathematical representations as outlined below.
In order to monitor the transmission of information between various nodes, it is essential to set up a message computational unit that exists inside corresponding layers by linking adjacent nodes. Therefore, these computations contribute to the formation of a distinct smart grid network, as stated in Eq. (19).
where,
Eq. (19) states that in order to compute interconnected graphical units, it is essential to determine historical data for all connected nodes, thereby establishing the necessary communication channel.
In order to construct streamlined transmission lines in a smart grid, it is essential to modify the level of operations where each node is required to monitor many interconnected channels. Therefore, in this particular kind, it is necessary to monitor the individual node factors as specified in Eq. (20).
where,
Eq. (20) states that while weights remain constant, it becomes feasible to establish connections between nodes of different values, hence achieving the necessary grid connectedness. Moreover, this sort of connectivity decreases the overall complexity of the intended structure by allowing for distinguishable conditions to be attained.
By utilizing many layers, it becomes feasible to combine different node characteristics, requiring updates to be performed by comparing prior state functions. Hence, it is necessary to modify all the comprehensive combined characteristics associated with node locations in order to present updated information, as specified in Eq. (21).
where,
Eq. (21) demonstrates that neighboring nodes can be combined to form grid units, allowing for the possibility of changing representations at each stage without altering the link representations. The block model with sequential instructions is depicted in Figs. 2 and 3, although flow representations are also included (Algorithm 1).
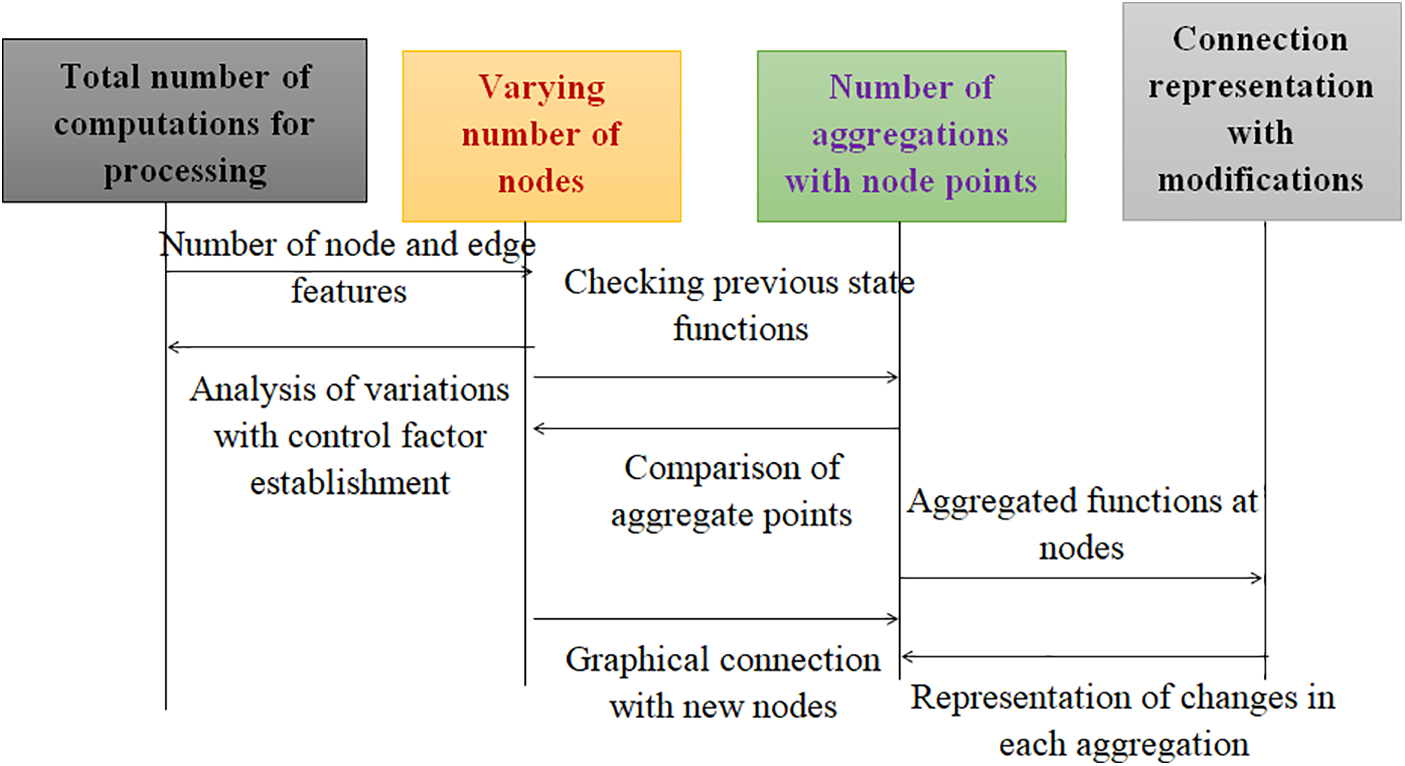
Figure 2: Graph neural networks for smart grid
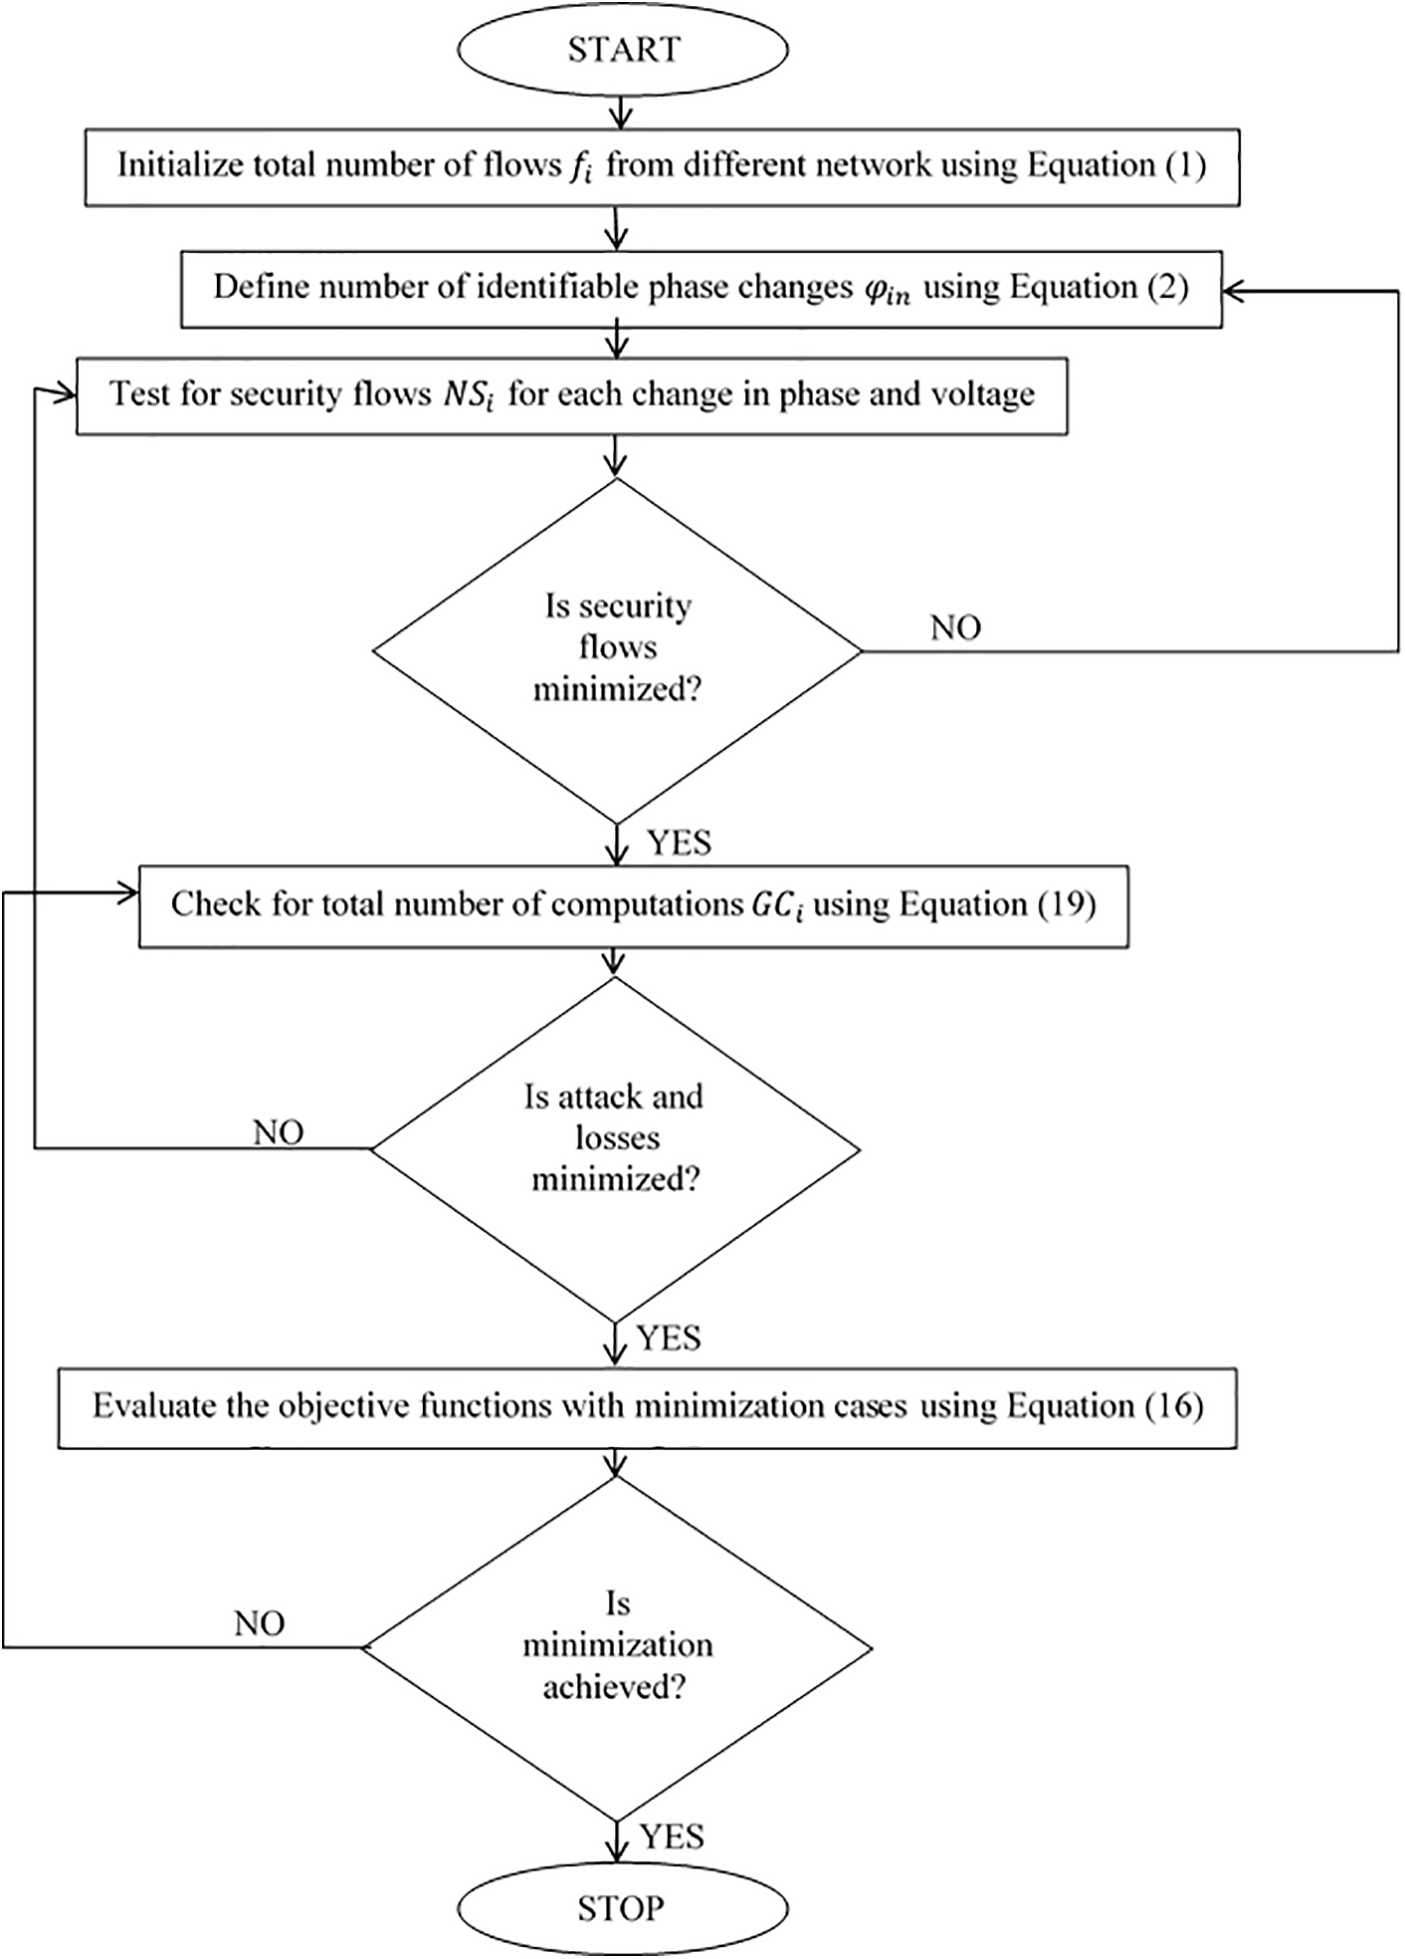
Figure 3: Flow chart of minimization function using graph neural networks
3.2 Adaptive Smart Grid Security
In order to enhance the flexibility of the smart grid, which is implemented with several security measures, it is imperative to minimize the interference caused by numerous parameters. This will enable the identification of uncertainties in a more accurate manner. All observed indications can be obtained by enhancing the state of actions through the integration of a smart grid in the form of a directed graph. This allows for the connection of both the network and its components, enabling accurate readings. All sorts of conditional dependencies are explicitly described, including the component functions that include necessary operational states where appropriate outputs are identified at various states. By utilizing adaptive networks in smart grids, it becomes feasible to promptly update all components in real-time. Moreover, if the adaptive threshold descends below a specific level, dependencies can be detected by considering the current and prior observation states. An important benefit of implementing an adaptive smart grid in the smart grid system is the ability to accurately detect all underlying faults. This allows for the establishment of a direct relationship between security-related variables. As a result, there is no need for a complete redesign of the grid networks, and quick decisions can be made to promptly address any uncertainties. On the other hand, by using adaptive units, it is feasible to avoid equipment failures by keeping individual schedules for future operation. This allows for the establishment of an effective monitoring unit with an equivalent control technique. Furthermore, it is also noted that risk assessment requires proactive measures to mitigate potential risks, taking into account time constraints for responding to any dynamic changes. Probabilistic reasoning is employed to manage uncertainties by utilizing linked variables. This approach minimizes the impact on grid stability while maximizing the utilization of sensor data. The adaptive smart grid can be represented analytically using the following equations.
The concept of conditional variables is introduced using prior state representations, allowing for the attainment of two distinct probabilities. Consequently, updates are monitored using low interference units. Therefore, by utilizing random distributions, it is feasible to decrease the occurrence of component failures in the smart grid, as stated in Eq. (22).
where,
Eq. (22) states that in order to account for changing probabilities, it is essential to use suitable load units. This allows for the adjustment of overload conditions by considering specific combinations of relative states.
Adaptive interference necessitates determining the degree of reliance in this scenario, thus necessitating the provision of security alerts in response to fluctuating environmental variables. Therefore, it is necessary to minimize overall interference while ensuring that marginal probabilities remain consistent, as specified in Eq. (23).
where,
Eq. (23) states that in order to meet the full load demand and ensure grid security, a high level of alertness is required. Fault conditions are identified based on two scenarios. Furthermore, timely solutions can be implemented at this stage to address any necessary remedial steps.
The adaptive technique in smart grid units requires the explicit definition of the probability of occurrence for each parameter when they are modified, together with an indication of the expected outcomes. Throughout this procedure, it is necessary to consider all environmental circumstances. The total number of occurrences is tracked using Eq. (24) in the following manner:
where,
Eq. (24) suggests that establishing a decision support unit can facilitate changes in occurrence and enhance the learning process to optimize the required combinations of conditions. Furthermore, the likelihood of an event taking place is also a factor in determining the necessary recommendations for achieving complete control. The block representation with step-by-step indications are indicated in Figs. 4 and 5 and flow representations are also provided (Algorithm 2). Also Table 2 provides the indication of variables that are used for representing the system model and optimizaiton algorithm.

Figure 4: Adaptive learning networks for smart grid

Figure 5: Flow chart of maximization function using adaptive networks


This section focuses on achieving real-time outcomes for smart grids by analyzing variations in data and tracking the network flow in its initial condition. During this process, a secure communication infrastructure is developed to enable transmission at the required smart grid units. Continuous learning leads to changes in real-time results in relation to flow signals. Additional substations and control centers are identified in the proposed method, ensuring compliance with physical access requirements. As a result of these reductions, end user interfaces are monitored to provide an accurate status of the grid. Alerts are used to achieve preventive measures at different stages, with little complexity. Additional protocols are implemented to effectively handle loads throughout different time periods, ensuring that correct scheduling is maintained and access controls are only granted during designated periods. Furthermore, the results are not limited to individual load lines. Instead, the analysis takes into account complete load units, allowing for the measurement of the status of each interconnected terminal. In the aforesaid example, a bidirectional representation is established, enabling the smart grid system to operate across a broader range of operational conditions, resulting in consistent outcomes over time. Furthermore, the interconnected graphical units experience little repercussions, allowing for the preservation of adaptive techniques to accommodate both input and output loads. Thanks to its adaptive character, unpredictable scenarios are transformed into predictable operations, resulting in minimal losses when observing variations in probability. In addition, the integration of smart grids ensures the allocation of future loads within distinct frameworks, hence enabling expected behavior and suitable control mechanisms. Four scenarios are evaluated to observe real-time consequences. Comparative outcomes are presented in Table 3, indicating the significance of each scenario.
Scenario 1: Determination of network flows
Scenario 2: Possibility of data expansions
Scenario 3: Total attack periods
Scenario 4: Throughput and losses

The technical analysis of proposed method with smart grids are carried out with observation of total amount of data that is present under traffic conditions where in proposed method total lag remains at 5 s for connected lines. Therefore during this type of delay, indications are provided with proper commands, thereby irregularities are prevented at this state but the grid remains at active condition even after presence of delays where testing is carried out with adaptive optimizations in proposed method. Further flow of information is observed thus establishing connections between different networks without loss of data and the main contribution is made by separating networks at various points hence communication risks are reduced. Moreover the simulation analysis is carried out with respect to power and line values at the time of network establishment as variations can be observed with respect to type of attacks that are made at present at necessary time periods.
Subsequently for analyzing the outcomes in smart grid framework operational frameworks are taken with time stamp denotations, location of substations, relevant current and voltage values and consumed power. Additionally, event data with security features are represented with grid descriptions, appropriate response, type of event and equivalent response from interconnected grid units. All the above mentioned parameters are combined in the form of configurations thus indicating total loads and data that are used for transmission in smart grids. Hence the case studies are designed based on three measurable techniques that consist of information, operation and grid infrastructures.
In the proposed method uncertainties are measured with respect to identifiable changes where phase measurements are made with respect to connected channels. Since uncertainties in smart grids are increased at both generation and demand side it is necessary to incorporate a flexible technique for handling changes in data units. Therefore in proposed method, an adaptive procedure is followed, thus determining both previous and next state aggregations, thereby all changing nodes are identified at short period of time. In case if uncertainties are observed for interconnected lines, then in the proposed method, graphical connectivity between different grid units are provided with security alerts for overcoming load demands. Moreover adaptive learning techniques are introduced in this case for solving all uncertainties and change in smart grid event are monitored and reported to control center. As a result of proper identification the uncertainty flows are controlled all over the network hence a shared communication unit is established in this case with block identifications.
The real-time results obtained from the connected smart grid are transformed into a comparable format for automatic adjustments. This is achieved through the use of a distributed open-source platform, which allows for the systematic description of the grid’s design. As a result, it becomes feasible to compare the flow of electric distribution systems. In this example, the integrated system units are calibrated to handle fault circumstances efficiently, allowing for quick testing capabilities. Furthermore, the network topology is equipped with logical connection. This means that during the simulation, the whole number of interconnected links are detected and processed by node units without any alterations to the load profiles. Another potential objective for using this form of communication is to identify prospective attack vectors. By doing so, any disruptions that result in the accurate identification of users can be acknowledged, thereby reducing the need for extensive responses.
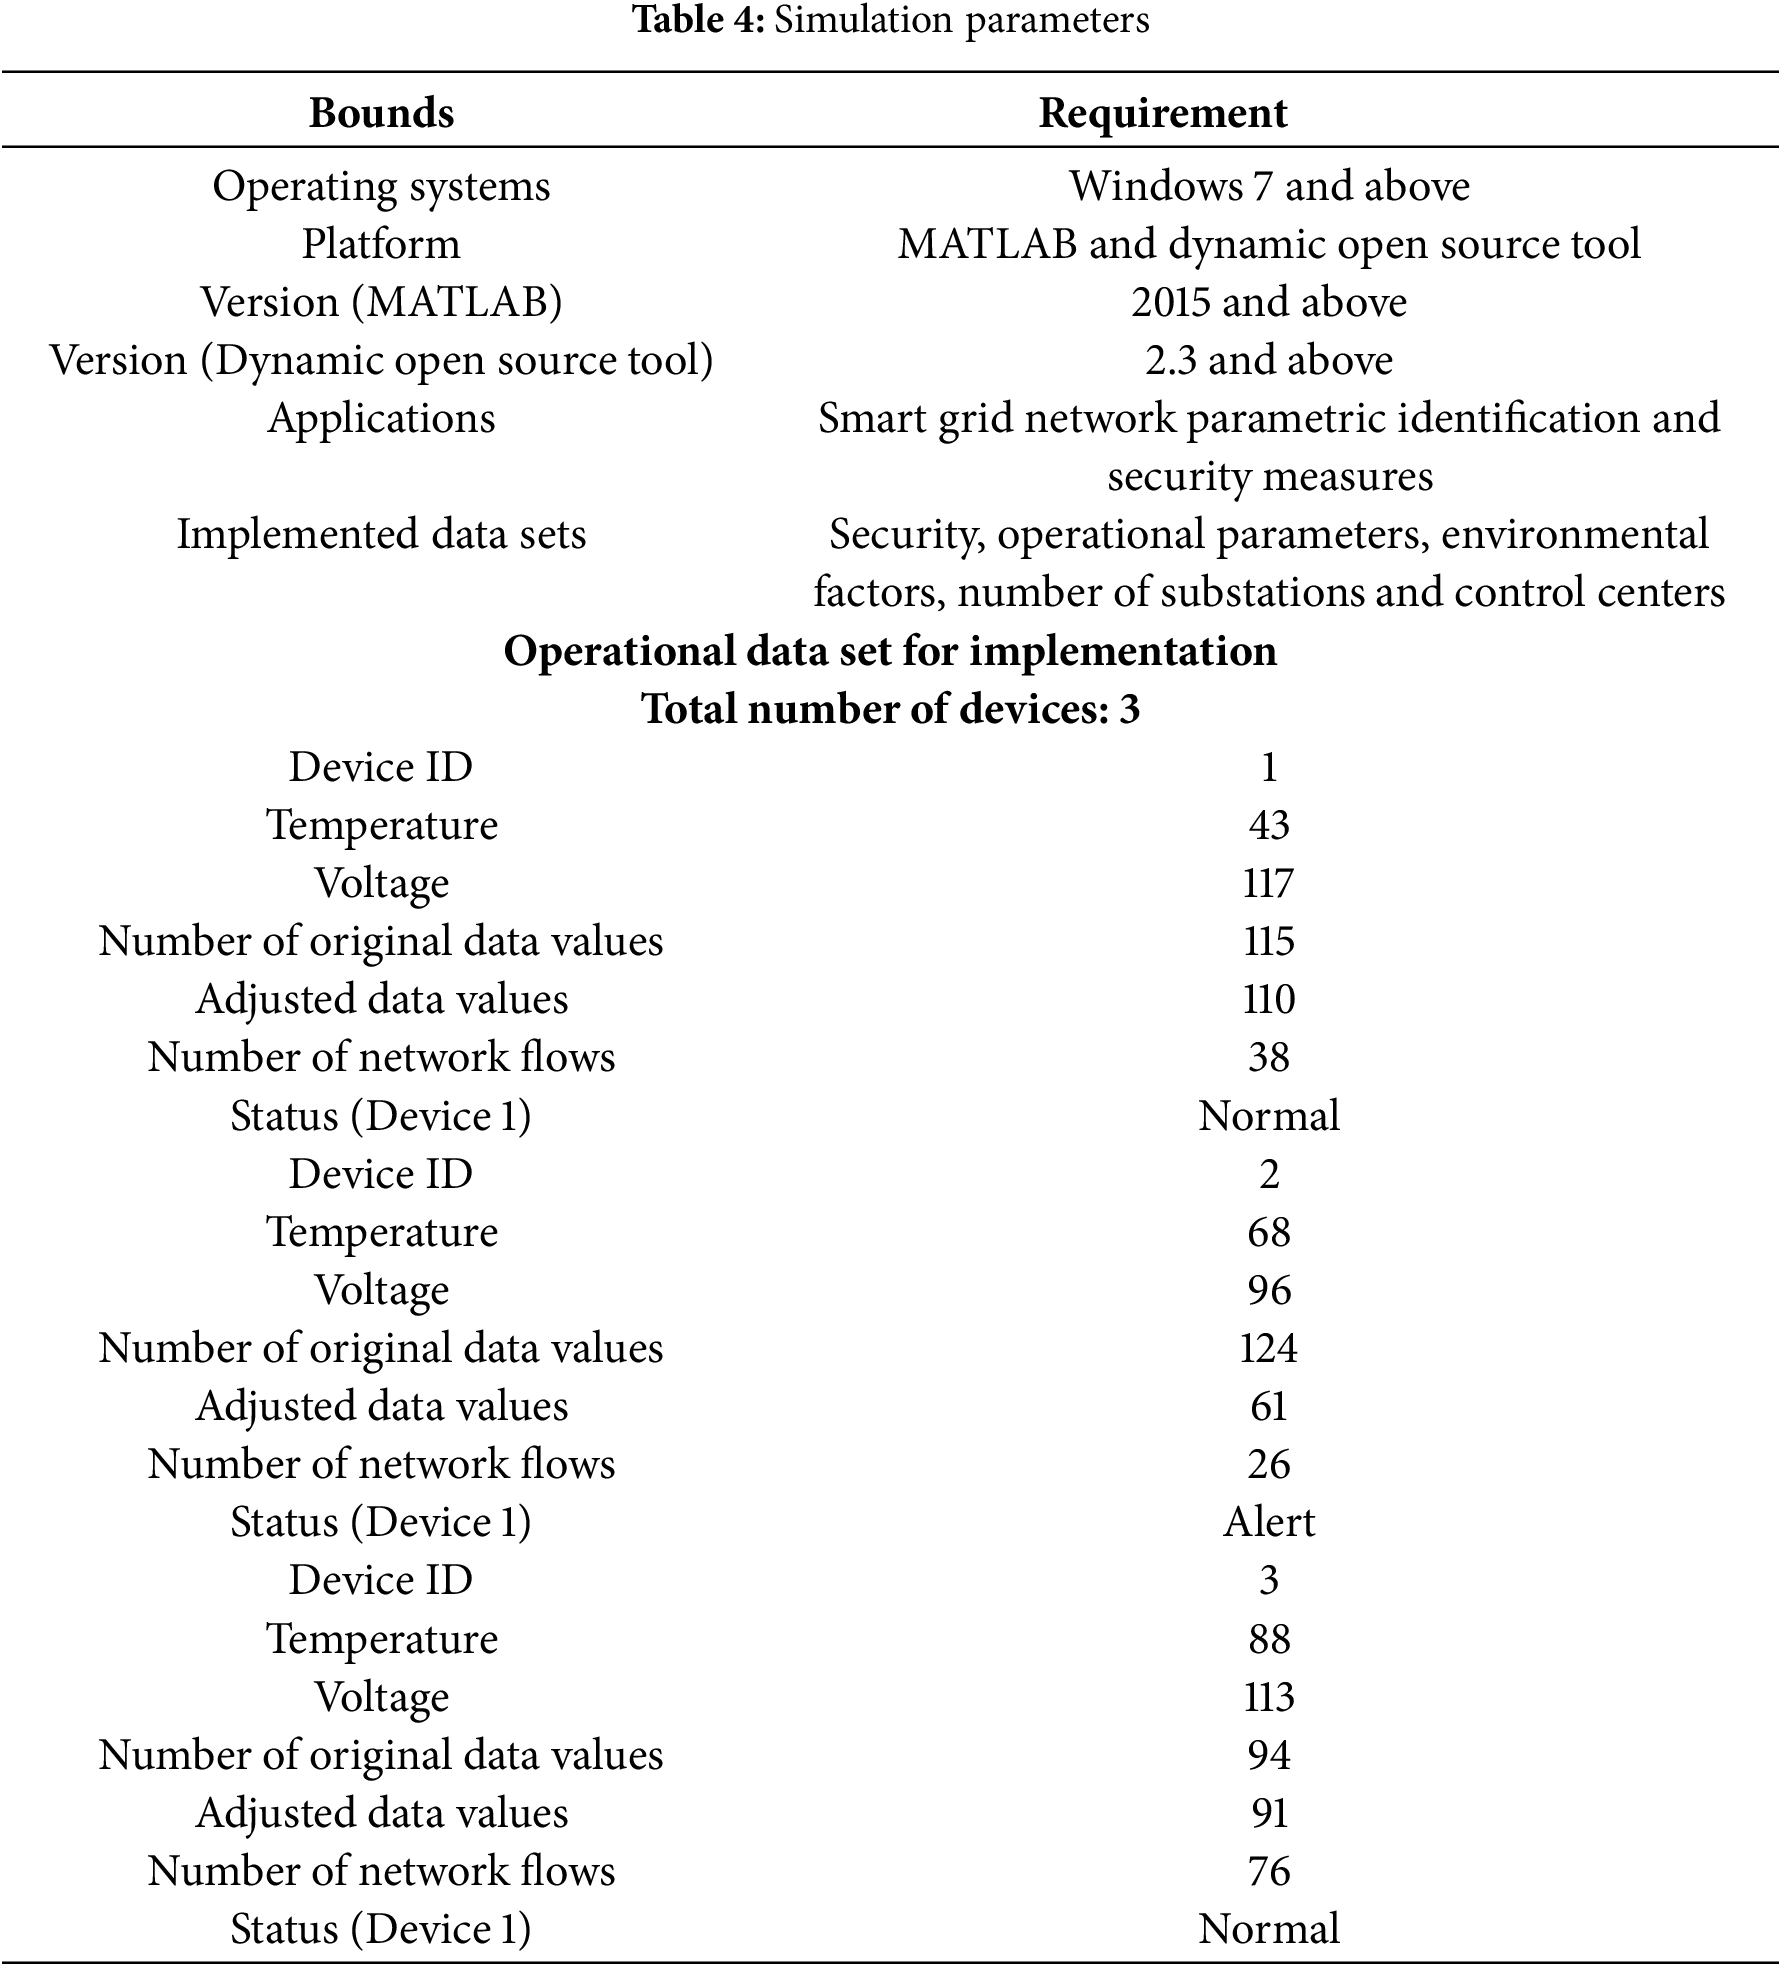
A safe framework with adaptive characteristics has been established to monitor the status of the smart grid, wherein the connections of three devices are verified in real time. An individual identity for device 1 can be generated when both temperature and voltage are maintained within specified ranges. Consequently, both the original and altered data stay essentially identical, thereby enabling the network to converge towards permissible state models. Consequently, proper fluxes will ensure the device operates normally. However, the condition for device 2 will be entirely altered, as both temperature and voltage values are diminished due to lower adjusted data values. Consequently, the data flow in the specified smart grids is lowered, causing the device to function in an alert state. Table 4 presents the data regarding the defined limits and criteria for addressing the needs related to power consumption and safety in a smart grid system. In the given dataset, the frequency of operation is regulated and kept at a standard rate of 50 to 60 Hertz. Within this range, only acceptable fluctuations in voltages are provided. However, if any changes occur beyond this range, an alarm is issued to the end users. Thus, the system may be made secure by addressing two potential scenarios: data threats and load disturbances. The control center has the capability to remotely manage and supervise other establishments through an equivalent simulation architecture. Furthermore, both the operating ranges and individual ratings are established to determine the operational status and indicate suitable configurations. The following text provides a comprehensive description of the circumstances that have been taken into account.
4.1.1 Scenario 1: Determination of Network Flows
In this scenario, the potential flows from each network will be computed based on the connected communication units, with the objective of minimizing the load flow at each grid-connected unit. Reducing network flows allows for the identification of comprehensive threats, specifically focusing on necessary patterns. This, in turn, maximizes security by establishing adaptive communication infrastructures. Reducing the network flows ensures that graphical network connections are established correctly, allowing for accurate determination of error probabilities in each flow. In addition, the presence of recognizable patterns in this situation is also minimized, as the measurement of phase values is closely controlled using separate filters, ensuring stability for interconnected grid units. In contrast, this particular sort of natural modeling allows the user to locate past instances of groupings. Consequently, appropriate measures may be implemented in terms of security, and each user has the ability to promptly safeguard against inaccurate information inside the grid.
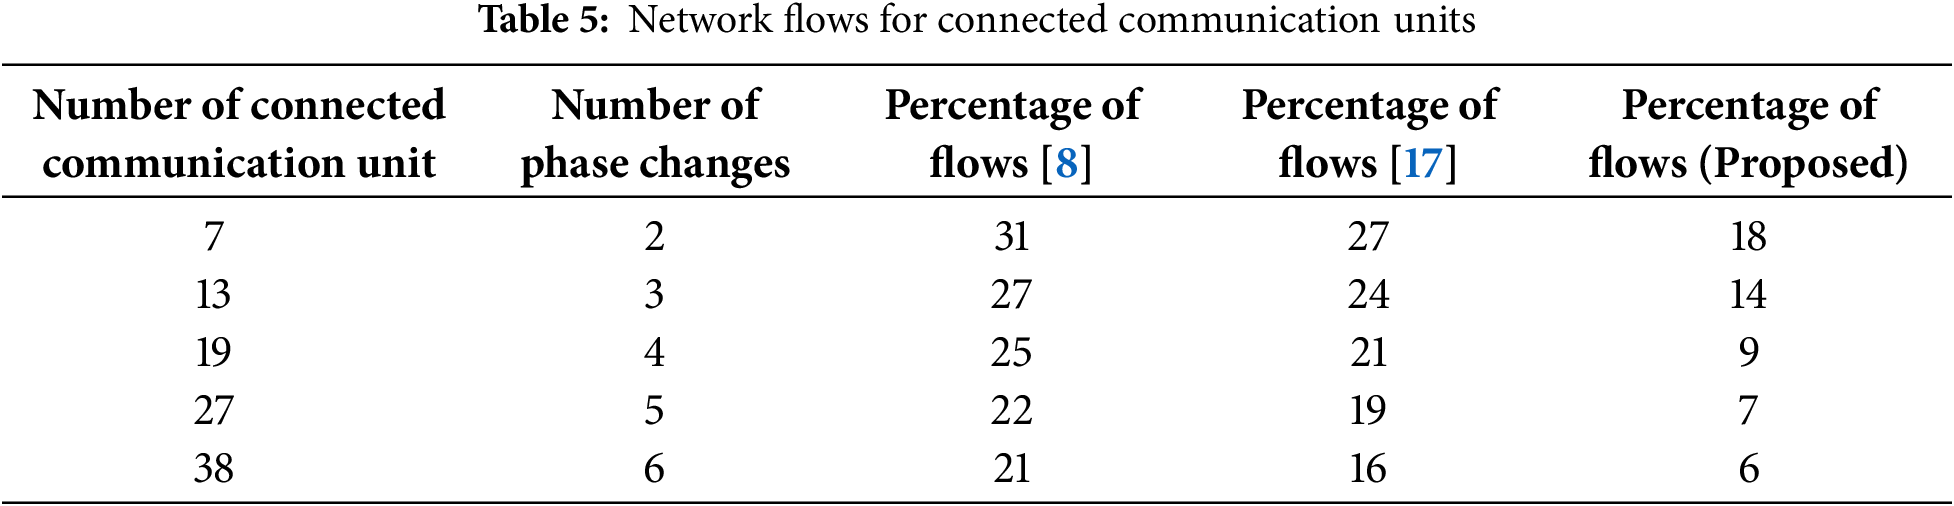
Fig. 6 and Table 5 present the simulation results of network flows for the proposed and existing methodologies. Fig. 6 clearly indicates that network flows are diminished in the predicted model relative to the existing technique. Reductions in network flows are attributable to discernible patterns inside each channel, enabling users to run the smart grid with enhanced security measures. The verification of network flow outcomes indicates that the number of connected communication units is restricted to 7, 13, 19, 27, and 38, with phase shifts occurring at 2, 3, 4, 5, and 6. Consequently, the observed proportion of flows in the aforementioned scenario is 31%, 27%, 25%, 22%, and 21% for the existing technique [8]. The anticipated model exhibits flow percentages of 18%, 14%, 9%, 7%, and 6%, attributable to the restrictions inherent in the associated communication unit. Consequently, by determining lower flows, the smart grid may enhance security for all units and maintain preventive measures.

Figure 6: Flow measurements with connected communication units
4.1.2 Scenario 2: Possibility of Data Expansions
Preventing the insertion of fake data is crucial in the smart grid system, particularly when the network is expanded at multiple locations. Adjustments must be implemented in such cases to ensure the accuracy and reliability of the data. Therefore, in this situation, all potential data expansions are recognized by making certain adaptive changes at related sites. In this situation, both power and line flows are consistently maintained, and controls are supplied for all interconnected equipment to ensure smooth operation. Natural indications are also provided for easy monitoring. Similarly, the ability to make changes to data depends on the level of freedom that is available in the connectivity of the smart grid. Therefore, by reducing the degree of freedom, smart grids can achieve a restricted number of lines while retaining similar loads, thus ensuring regularized flows with indicated data. Through data changes, both nodes and edges are idenified, and a certain limit is set for the smart grid to preserve the same data until the units are detached.
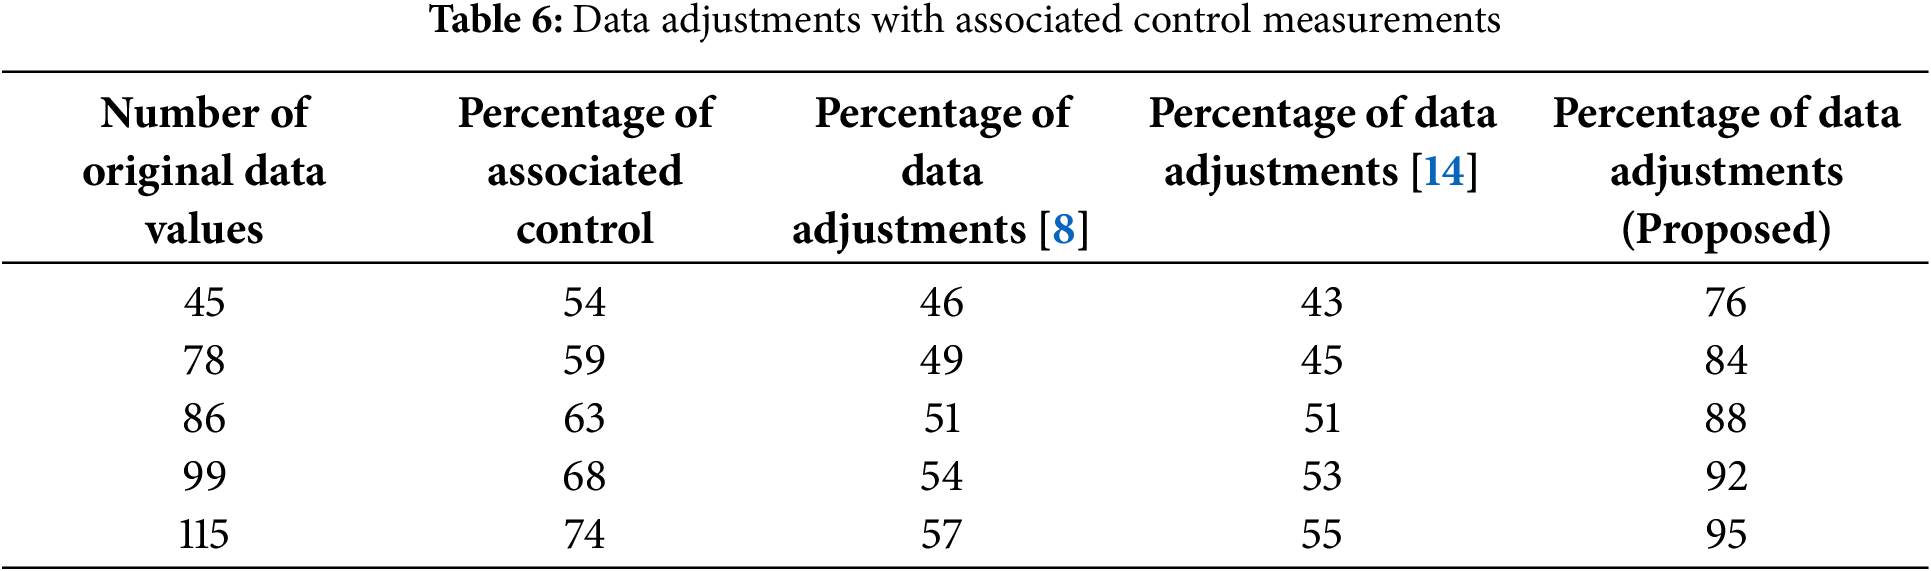
Fig. 7 and Table 6 demonstrate the potential for data expansions for both the present and suggested approaches. Fig. 7 demonstrates that data is optimized in the predicted model relative to the existing technique. The primary cause of data expansion is the extensive precautions used in smart grid systems concerning power and line values, which effectively avoid disruptions in units. Subsequently, in this scenario, comprehensive regulation of associations and adaptations is implemented, hence minimizing interference for all potential load levels and corresponding degree measurements. To validate the results of this scenario, the original data values from smart grids are 45, 78, 86, 99, and 115, with corresponding control levels maximised at 54%, 59%, 63%, 68%, and 74%. Therefore, in the aforementioned situation, the percentages of data adjustments are found to be 76%, 84%, 88%, 92%, and 95%, respectively. Consequently, with greater adjustments, it becomes feasible to identify the entire number of events that occurred with failure signals.

Figure 7: Number of adjustments and associated control for original data values
4.1.3 Scenario 3: Total Attack Periods
In this scenario, the probability of assault occurrences is assessed to safeguard smart grids from accessing external states. Given the challenge of managing multiple interconnected units simultaneously, it is essential to track changes at regular intervals in order to effectively regulate the overall data outbreak. In order to monitor the attack periods in this scenario, both the demand and response from grid units will be observed, and any changes made by users will be accurately identified. When the user’s response is not adequate, it is necessary to implement methods to decrease the overall duration of attacks, while still ensuring the adaptive character of smart grids and considering the likelihood of selecting failure scenarios. To detect the answer, the original message function is examined in the starting state and compared with current state representations. Hence, when receiving such messages, the variations in input states are communicated to the control center, and the duration of the attacks should be minimized accordingly.
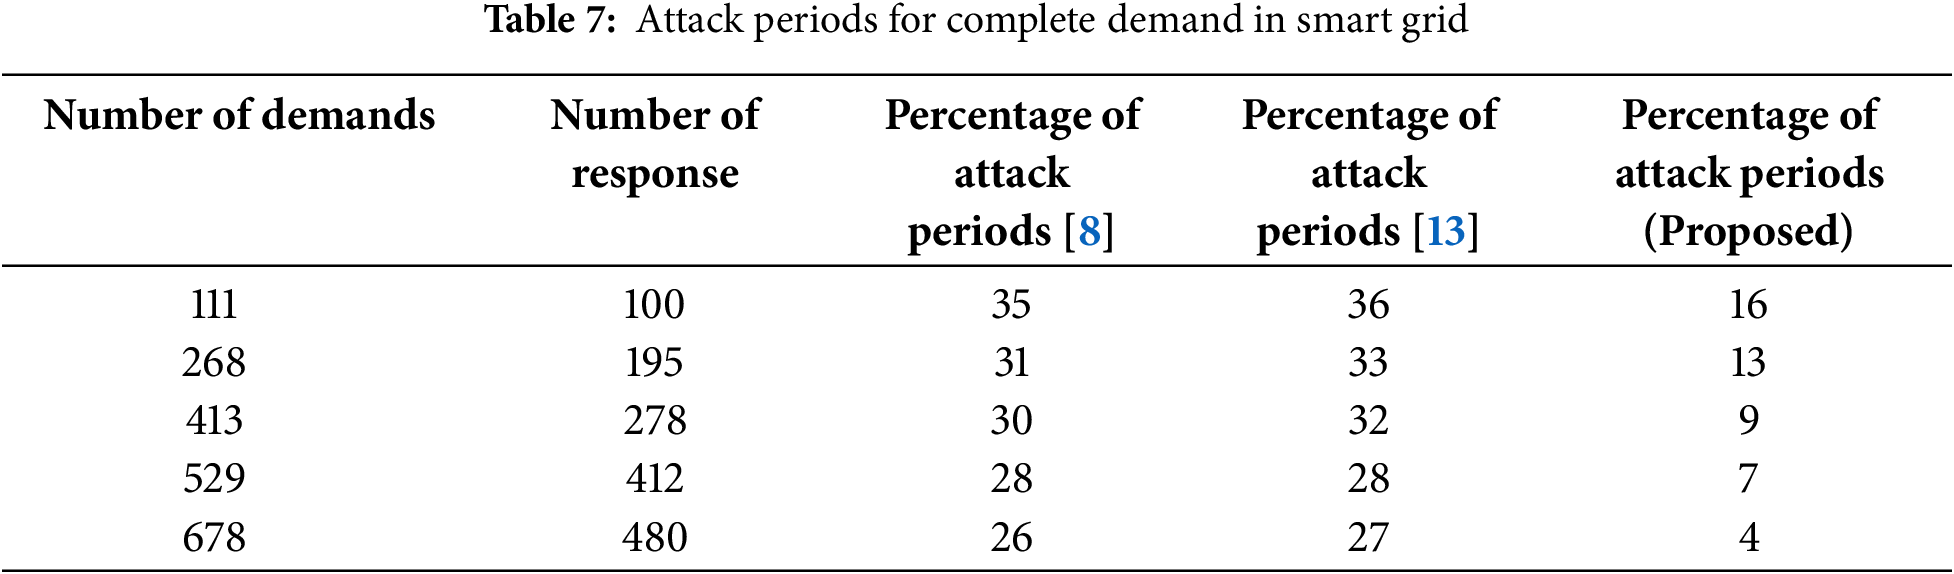
Fig. 8 and Table 7 illustrate the comparison of total attack durations for the proposed and existing methodologies. Fig. 8 indicates that the proposed strategy effectively reduces attack periods in comparison to the present method. The assault periods are easily recognized by examining all non-connected grid units, as no definitive indications are provided at this stage. However, for interconnected scenarios including graphical units, specific indications are given by representing both edges and nodes inside smart grid connectivity. The verification of overall attack periods reveals a demand count of 111, 268, 413, 529 and 678, with a response period of 100, 195, 278, 412 and 480. Consequently, the percentage of attack periods for the specified requests and responses is diminished to 35%, 31%, 30%, 28%, and 26% under the current methodology [8]. However, using the proposed strategy, the assault durations are diminished to 16%, 13%, 9%, 7%, and 4%, so enabling an enhancement in reaction through security measures.

Figure 8: Possibility of attack periods with demand and response periods
4.1.4 Scenario 4: Throughput and Losses
Once potential assaults are detected, it is necessary to identify the resulting losses in smart grids. Therefore, in this situation, the total losses are given along with equal throughput signals to assess the overall performance of smart grids. In order to measure the total losses in smart grids, all potential interventions with the initial measurements are watched and recorded at the control center. Consequently, the negative data is isolated from the control center, so preventing the inclusion of related data from smart grid measures. Additionally, losses will also arise from deviations in conventional representations, resulting in the representation of data with distinct features in the system. On the other hand, the smart grid is capable of responding to changing environmental conditions since it includes individual features. As a result, there is comprehensive availability of data. The presence of data availability allows for the detection of deviations and the reduction of losses.
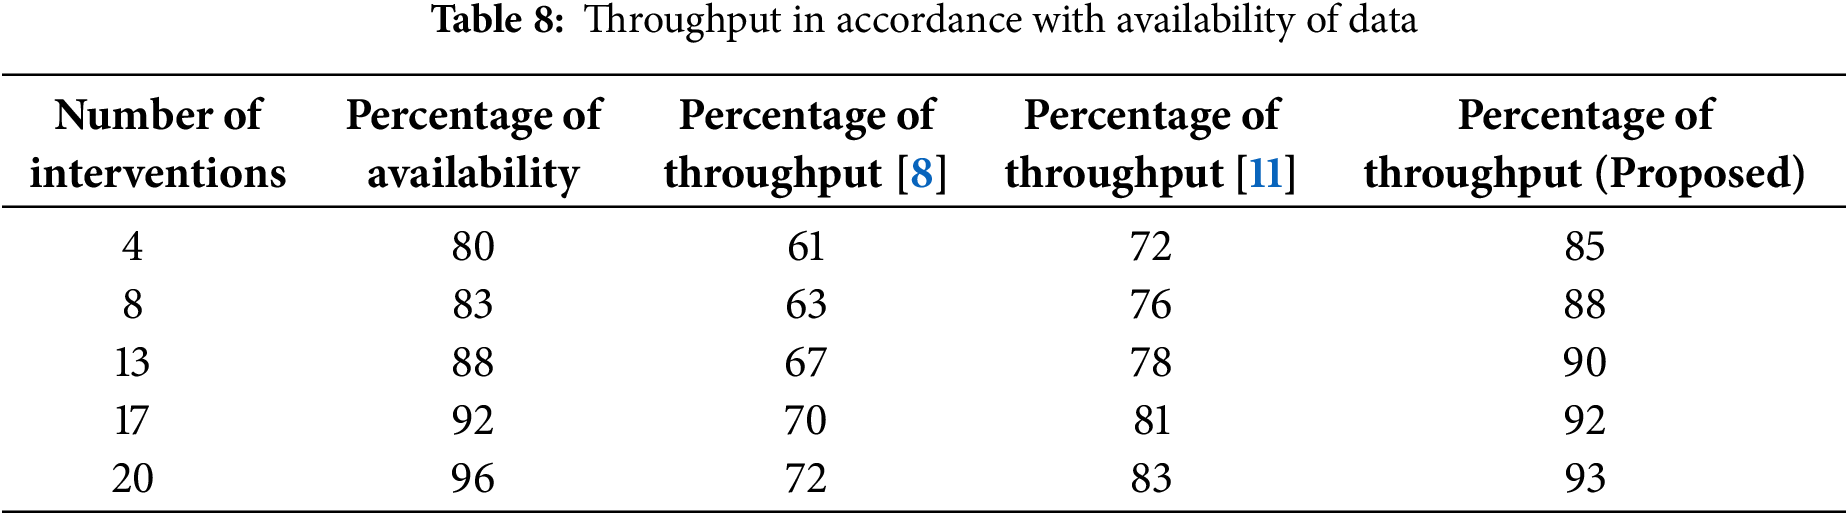
Fig. 9 and Table 8 provide the comparative results for losses and throughput of both the proposed and existing approaches. Fig. 9 indicates that losses diminish with higher throughput in the predicted model compared to the existing approach. The primary cause of the decrease in loss is the proper architecture of connected smart grids, enabling accurate computations at both the edge and nodes. To validate the loss representations, the number of interventions recorded are 4, 8, 13, 17, and 20, with corresponding availability percentages of 80%, 83%, 88%, 92%, and 96%. Consequently, for these interventions, the availability percentage of throughput is maximised to 61%, 63%, 67%, 70%, and 72% in the existing approach [8], whereas the projected strategy achieves maximum throughput of 85%, 88%, 90%, 92%, and 93%, respectively. Consequently, as throughput increases, adequate security measures are upheld in the smart grid, ensuring suitable communication is facilitated.

Figure 9: Throughput and loss measurements for number of interventions
With the introduction of machine learning algorithms that utilize graphical units and adaptable characteristics, it is imperative to examine performance measures in order to observe entire efficiency and throughput. The smart grid data set will experience numerous variations as a result of hyper-parametric instances, which directly impact the operation of grid connected components and therefore degrade security features. On the other hand, performance measures in machine learning offer potential avenues for incorporating enhancements, where reliability may be assessed through high-performance indicators. Therefore, the suggested method involves the analysis of two case studies to evaluate performance measures, as outlined below:
Case study 1: Convergence characteristics
Case study 2: Time complexity
4.2.1 Case Study 1: Convergence Characteristics
A test mechanism is offered in smart grid connectivity to indicate comprehensive variances, enabling the identification of ideal results through convergence characteristics. Given that machine learning algorithms often encounter unconstrained scenarios, it is crucial to assign adaptive probabilities to different nodes in order to establish a degree of freedom in smart grids. Due to the presence of numerous phases in representing learning characteristics, a fixed pattern cannot be applied in grid connected systems. Therefore, it is imperative to find a precise solution within a limited timeframe. Thus, machine learning techniques offer flexible solutions for incomplete connections by speeding up the training process, thereby minimizing the operational risks associated with all connected sites. Furthermore, the accuracy of machine learning models is enhanced by the convergence of distinctive features, resulting in the generation of a time-varying node by selecting individual probabilities.
Fig. 10 displays the convergence characteristics of both the proposed and existing techniques. Based on Fig. 10, it is evident that the projected method achieves early convergence compared to the present method [8]. The potential options for early convergence arise from independent parameters that are depicted by network flows with fewer line flows. In order to assess the convergence characteristics, the total number of iterations is examined at step intervals of 10, 20, 30, 40, 50, 60, 70, 80, 90, and 100. The proposed model achieves early convergence at the 40th iteration, with 6% of network flows. However, the current method only reaches convergence at the 80th iteration, when the network fluxes climb to 21%. Early convergence refers to the reduction of high risk factors, allowing for the provision of solutions to non-linear scenarios during a proper maintenance time.

Figure 10: Comparison of convergence with total number of iterations
4.2.2 Case Study 2: Time Complexity
In order to carry out a certain task function in smart grids, it is crucial to engage in continuous learning, which consists of two distinct periods: training and testing. However, the duration required to comprehend the adaptive attributes in a smart grid must be minimized, thereby reducing the overall time frame for specific instances. In order to train the input data set, individual measurements must be provided after acquiring the essential characteristics. However, the proposed method reduces the initial time period for solving network flow problems due to transformations and advancements in smart grid technology. If the time complexity is present in a smart grid, it becomes more challenging to route power values in particular directions, leading to a rise in the complexity of grid measurements. This complexity should be minimized during the first connectivity stages. Furthermore, it is necessary to measure the bounding values. This allows for the provision of solutions within shorter time periods, especially when dealing with enormous data sets.
Fig. 11 illustrates the comparison of time complexities between the proposed and existing methodologies. Fig. 11 demonstrates a reduction in time complexity for the suggested method when compared to the existing methodology [8]. By utilizing a dynamic open source platform, the smart grid represents search data during connectivity periods, allowing for the provision of suitable learning characteristics. Even at a later stage, when the input is enlarged to a huge set of values, the learning characteristics remain same, thereby preventing any worst-case scenarios. As a result, the initial state of representations is optimized more effectively. In order to assess the temporal complexity, the optimal epoch conditions are chosen with step sizes of 20, 40, 60, 80, and 100. By applying these conditions, the complexities at different time periods are lowered to 14.4, 13.1, 12.8, 12.3, and 11.7 s, respectively, when compared to the present approach. The difficulties in the proposed approach have been decreased to 7.4, 6.2, 5.7, 4.8, and 4.1 s, resulting in optimum solutions with reduced time periods.
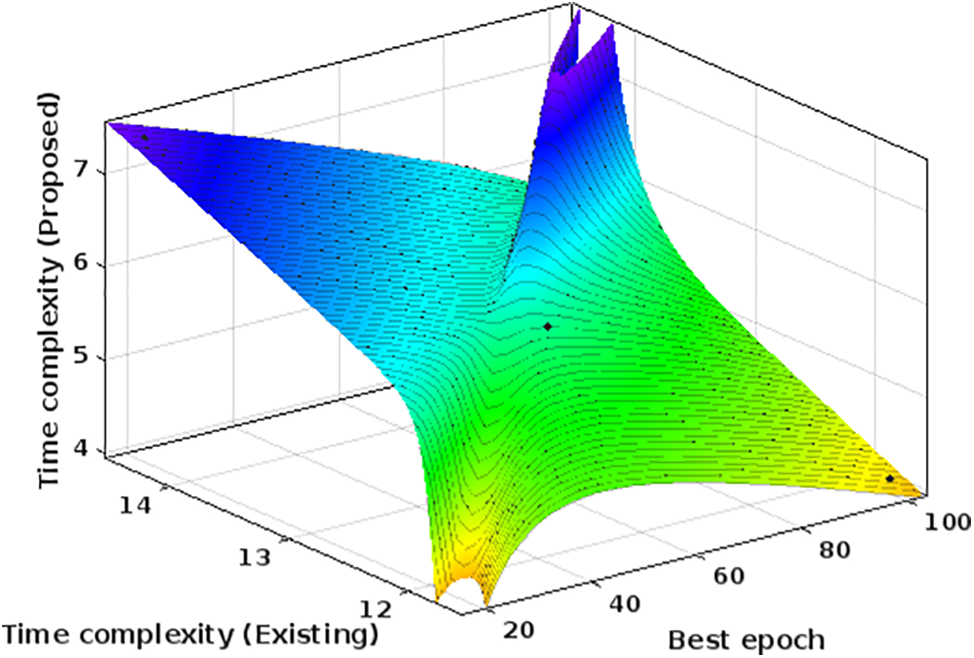
Figure 11: Complexities for smart grid with variations in time periods
For Figs. 6–11, the units of measurements are not considered as only parametric measurements are made for smart grids by considering security factors. In addition, the indicated data types does not require any unit as priorities are made with respect to communicaiton units.
The measurements of the smart grid, which encompass variations in phase changes, voltage, or power levels, must be communicated securely using continuously learning adaptive features. Therefore, the development of smart grid systems must be designed to effectively accommodate changing surroundings through the utilization of graphical connection, incorporating node and edge representations. The suggested technique observes the network flows in these types of connections to prevent grid failures. As a result, the connected communication unit can maintain appropriate flows without affecting the interconnected units. Furthermore, the smart grid is safeguarded by probability adjustments. Consequently, it is necessary to examine the previous condition of aggregations along with the interconnected channels to minimize fluctuations in the smart grid. If a greater number of changes are made, the overall properties of the grid will be impacted, resulting in the loss of the original data characteristics and a decrease in security features. It is essential to increase the data units by including both line and power values in order to optimize connected control systems and prevent any major modifications in this scenario.
The synergistic impact of integrating machine learning with graphical connections and adaptive networks is examined in this study. The efficiency is evaluated through the analysis of four scenarios and two case studies. The first scenario involves analyzing the entire flow of smart grid networks, taking into account phase changes. This results in a reduction of flows by 6% compared to the conventional approach, which only provides 21% flow control. In the next scenario, data is altered and expansions are made, specifically with the goal of maximizing results. As a result, it is possible to attain a success rate of 95% for the suggested model and 74% for the present approach. In addition, the attack times are reduced by 4% and there is an improvement in throughput of 93% for the remaining cases. In the future, security measures can be enhanced by implementing automated modifications to both the training and testing phases, while also reducing flow controls.
Acknowledgement: Not applicable.
Funding Statement: This research was supported by the Researchers Supporting Project number RSP2025R244, King Saud University, Riyadh, Saudi Arabia.
Author Contributions: Conceptualization: Shitharth Selvarajan and Hariprasath Manoharan. Methodology: Shitharth Selvarajan and Hariprasath Manohara. Software: Taher Al-Shehari, Hussain Alsalman and Taha Alfakih. Validation: Taher Al-Shehari, Hussain Alsalman and Taha Alfakih. Formal analysis: Taher Al-Shehari, Hussain Alsalman and Taha Alfakih. Investigation: Taher Al-Shehari, Hussain Alsalman and Taha Alfakih. Resources: Taher Al-Shehari, Hussain Alsalman and Taha Alfakih. Data curation: Taher Al-Shehari, Hussain Alsalman and Taha Alfakih. Writing—original draft preparation: Shitharth Selvarajan and Hariprasath Manoharan. Writing—review and editing: Shitharth Selvarajan and Hariprasath Manoharan. Visualization: Taher Al-Shehari, Hussain Alsalman and Taha Alfakih. Supervision: Shitharth Selvarajan and Hariprasath Manoharan. Project administration: Shitharth Selvarajan and Hariprasath Manoharan. All authors reviewed the results and approved the final version of the manuscript.
Availability of Data and Materials: Not applicable.
Ethics Approval: Not applicable.
Conflicts of Interest: The authors declare no conflicts of interest to report regarding the present study.
References
1. Haji Mirzaee P, Shojafar M, Cruickshank H, Tafazolli R. Smart grid security and privacy: from conventional to machine learning issues (threats and countermeasures). IEEE Access. 2022;10:52922–54. doi:10.1109/ACCESS.2022.3174259. [Google Scholar] [CrossRef]
2. Mohammad F, Al-Ahmadi S, Al-Muhtadi J. RoGRUT: a hybrid deep learning model for detecting power trapping in smart grids. Comput Mater Contin. 2024;79(2):3175–92. doi:10.32604/cmc.2023.042873. [Google Scholar] [CrossRef]
3. Ferrag MA, Babaghayou M, Yazici MA. Cyber security for fog-based smart grid SCADA systems: solutions and challenges. J Inf Secur Appl. 2020;52:102500. doi:10.1016/j.jisa.2020.102500. [Google Scholar] [CrossRef]
4. Prateek K, Maity S, Amin R. An unconditionally secured privacy-preserving authentication scheme for smart metering infrastructure in smart grid. IEEE Trans Netw Sci Eng. 2023;10(2):1085–95. doi:10.1109/TNSE.2022.3226902. [Google Scholar] [CrossRef]
5. Sharma K, Malik A, Batra I, Sanwar Hosen ASM, Abdul Latif Sarker M, Seog Han D. Technologies behind the smart grid and Internet of Things: a system survey. Comput Mater Contin. 2023;75(3):5049–72. doi:10.32604/cmc.2023.035638. [Google Scholar] [CrossRef]
6. Al-Bossly A. Metaheuristic optimization with deep learning enabled smart grid stability prediction. Comput Mater Contin. 2023;75(3):6395–408. doi:10.32604/cmc.2023.028433. [Google Scholar] [CrossRef]
7. Selvarajan S, Manickam S, Manoharan H, Laghari SUA, Uddin M, Abdelhaq M, et al. Testing and substantiation of zero trust devices with blockchain procedures for secured data transfer approach. Human-Centric Comput Inf Sci. 2024;14:1–16. doi:10.22967/HCIS.2024.14.042. [Google Scholar] [CrossRef]
8. Kiran A, Mathivanan P, Mahdal M, Sairam K, Chauhan D, Talasila V. Enhancing data security in IoT networks with blockchain-based management and adaptive clustering techniques. Mathematics. 2023;11(9):2073. doi:10.3390/math11092073. [Google Scholar] [CrossRef]
9. Ruhul Amin BM, Taghizadeh S, Rahman MS, Hossain MJ, Varadharajan V, Chen Z. Cyber attacks in smart grid-dynamic impacts, analyses and recommendations. IET Cyber-Phys Syst. 2020;5(4):321–9. doi:10.1049/iet-cps.2019.0103. [Google Scholar] [CrossRef]
10. Agnew D, Aljohani N, Mathieu R, Boamah S, Nagaraj K, McNair J, et al. Implementation aspects of smart grids cyber-security cross-layered framework for critical infrastructure operation. Appl Sci. 2022;12(14):6868. doi:10.3390/app12146868. [Google Scholar] [CrossRef]
11. Rabie OBJ, Selvarajan S, Alghazzawi D, Kumar A, Hasan S, Asghar MZ. A security model for smart grid SCADA systems using stochastic neural network. IET Gen Trans Dist. 2023;17(20):4541–53. doi:10.1049/gtd2.12943. [Google Scholar] [CrossRef]
12. Yu T, Da K, Wang Z, Ling Y, Li X, Bin D, et al. An advanced accurate intrusion detection system for smart grid cybersecurity based on evolving machine learning. Front Energy Res. 2022;10:903370. doi:10.3389/fenrg.2022.903370. [Google Scholar] [CrossRef]
13. Ranganathan R, Qiu R, Hu Z, Hou S, Pazos-Revilla M, Zheng G, et al. Cognitive radio for smart grid: theory, algorithms, and security. Int J Digit Multimed Broadcast. 2011;2011:502087. doi:10.1155/2011/502087. [Google Scholar] [CrossRef]
14. Hu C, Liu Z, Li R, Hu P, Xiang T, Han M. Smart contract assisted privacy-preserving data aggregation and management scheme for smart grid. IEEE Trans Depend Secure Comput. 2023;21(4):2145–61. doi:10.1109/TDSC.2023.3300749. [Google Scholar] [CrossRef]
15. Syrmakesis AD, Alcaraz C, Hatziargyriou ND. Classifying resilience approaches for protecting smart grids against cyber threats. Int J Inf Secur. 2022;21(5):1189–210. doi:10.1007/s10207-022-00594-7. [Google Scholar] [CrossRef]
16. Achaal B, Adda M, Berger M, Ibrahim H, Awde A. Study of smart grid cyber-security, examining architectures, communication networks, cyber-attacks, countermeasure techniques, and challenges. Cybersecurity. 2024;7(1):10. doi:10.1186/s42400-023-00200-w. [Google Scholar] [PubMed] [CrossRef]
17. Yasin Ghadi Y, Mazhar T, Aurangzeb K, Haq I, Shahzad T, Ali Laghari A, et al. Security risk models against attacks in smart grid using big data and artificial intelligence. PeerJ Comput Sci. 2024;10:e1840. doi:10.7717/peerj-cs.1840. [Google Scholar] [PubMed] [CrossRef]
18. Selvarajan S, Manoharan H, Khadidos AO, Khadidos AO, Alshareef AM, Alsobhi AY. Secured 6G communication for consumer electronics with advanced artificial intelligence algorithms. IEEE Trans Consum Electron. 2024;70(3):5711–8. doi:10.1109/TCE.2024.3382779. [Google Scholar] [CrossRef]
19. Jiang Q, Lu Y, Wang B, Zhang L, Long W. Assessment of security index for SCADA systems in smart grids. In: 2022 IEEE 22nd International Conference on Communication Technology (ICCT); 2022 Nov 11–14; Nanjing, China: IEEE. Vol. 2022, p. 1218–23. doi:10.1109/ICCT56141.2022.10072804. [Google Scholar] [CrossRef]
20. Gunduz MZ, Das R. Smart grid security: an effective hybrid CNN-based approach for detecting energy theft using consumption patterns. Sensors. 2024;24(4):1148. doi:10.3390/s24041148. [Google Scholar] [PubMed] [CrossRef]
21. Upadhyay D, Zaman M, Joshi R, Sampalli S. An efficient key management and multi-layered security framework for SCADA systems. IEEE Trans Netw Serv Manage. 2021;19(1):642–60. doi:10.1109/TNSM.2021.3104531. [Google Scholar] [CrossRef]
22. Wali A, Alshehry F. A survey of security challenges in cloud-based SCADA systems. Computers. 2024;13(4):97. doi:10.3390/computers13040097. [Google Scholar] [CrossRef]
23. Tariq N, Asim M, Khan FA. Securing SCADA-based critical infrastructures: challenges and open issues. Procedia Comput Sci. 2019;155:612–7. doi:10.1016/j.procs.2019.08.086. [Google Scholar] [CrossRef]
Cite This Article
 Copyright © 2025 The Author(s). Published by Tech Science Press.
This work is licensed under a Creative Commons Attribution 4.0 International License , which permits unrestricted use, distribution, and reproduction in any medium, provided the original work is properly cited.
 Downloads
 Citation Tools