
 Submit a Paper
 Propose a Special lssue
 Open Access
ARTICLE

TB-Graph: Enhancing Encrypted Malicious Traffic Classification through Relational Graph Attention Networks
School of Cyber Science and Technology, Information Engineering University, Zhengzhou, 450001, China
* Corresponding Author: Shengli Liu. Email:
Computers, Materials & Continua 2025, 82(2), 2985-3004. https://doi.org/10.32604/cmc.2024.059417
Received 07 October 2024; Accepted 26 November 2024; Issue published 17 February 2025
 View Full Text
 Download PDF
Abstract
The proliferation of internet traffic encryption has become a double-edged sword. While it significantly enhances user privacy, it also inadvertently shields cyber-attacks from detection, presenting a formidable challenge to cybersecurity. Traditional machine learning and deep learning techniques often fall short in identifying encrypted malicious traffic due to their inability to fully extract and utilize the implicit relational and positional information embedded within data packets. This limitation has led to an unresolved challenge in the cybersecurity community: how to effectively extract valuable insights from the complex patterns of traffic packet transmission. Consequently, this paper introduces the TB-Graph model, an encrypted malicious traffic classification model based on a relational graph attention network. The model is a heterogeneous traffic burst graph that embeds side-channel features, which are unaffected by encryption, into the graph nodes and connects them with three different types of burst edges. Subsequently, we design a relational positional coding that prevents the loss of temporal relationships between the original traffic flows during graph transformation. Ultimately, TB-Graph leverages the powerful graph representation learning capabilities of Relational Graph Attention Network (RGAT) to extract latent behavioral features from the burst graph nodes and edge relationships. Experimental results show that TB-Graph outperforms various state-of-the-art methods in fine-grained encrypted malicious traffic classification tasks on two public datasets, indicating its enhanced capability for identifying encrypted malicious traffic.Keywords
While encryption technology enhances data security, it concurrently poses serious challenges to network security. The report published by Zscaler reveals that attackers are increasingly resorting to encrypted communication during their attacks. The low cost of encrypted communication technologies has significantly aided attackers. Almost 86% of attacks use encrypted channels across multiple stages of the kill chain. From the initial phases of phishing and malware delivery to the subtleties of command-and-control activities as well as data exfiltration, cybercriminals leverage encryption to shield their intentions. Fig. 1 displays the top five industries worldwide that were most impacted by encrypted attacks from 2022 to 2023. The two industries that experienced the greatest growth were Education and Services, with increases of 276.4% and 81.9%, respectively. The increasing adoption of encryption by these industries to protect sensitive data and communications has, in turn, attracted threat actors. This has led to a surge in cyber-attacks aimed at stealing sensitive information.
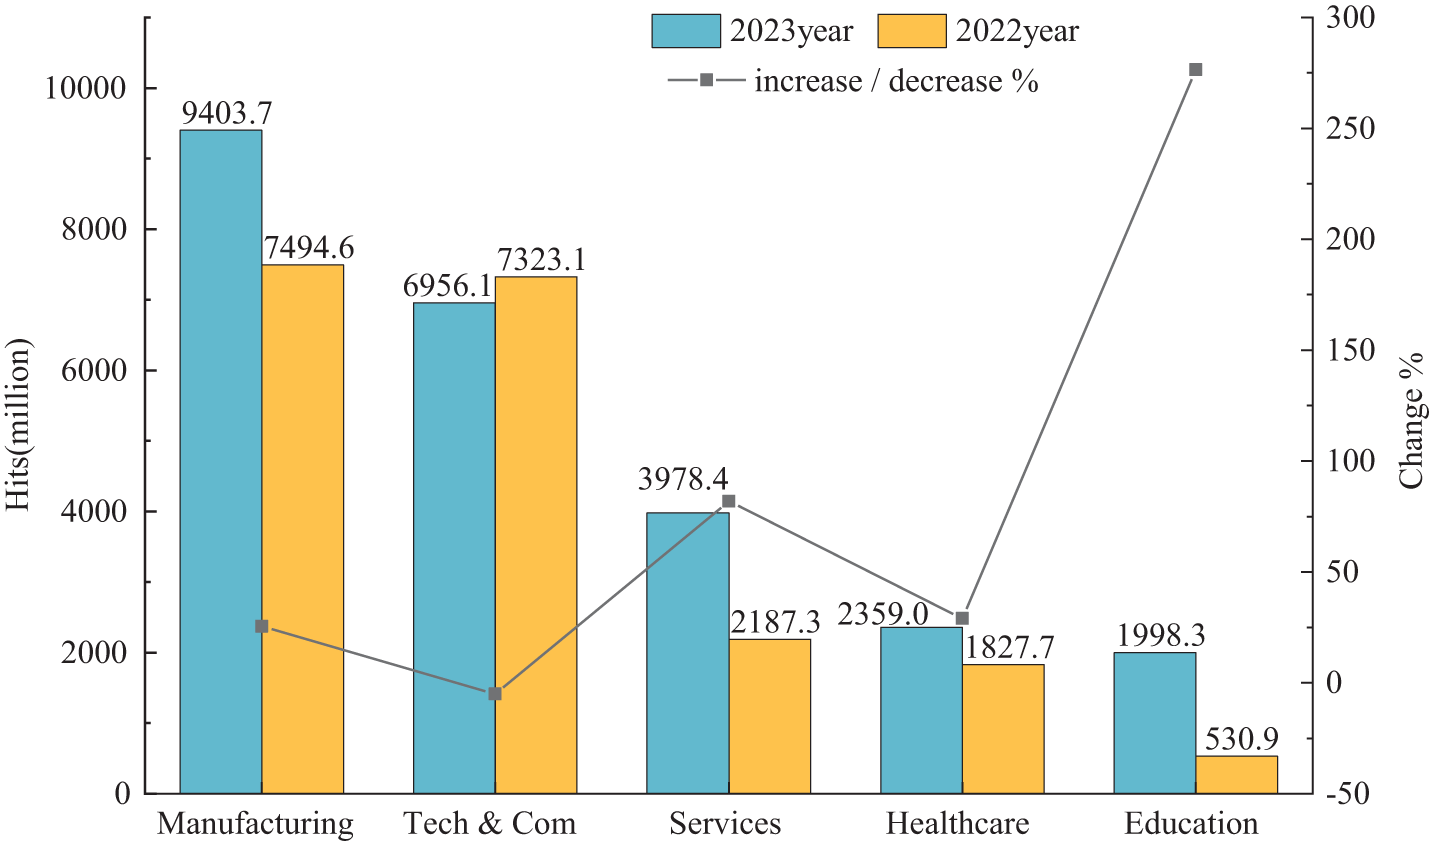
Figure 1: The top five industries globally most affected by encrypted attacks from 2022 to 2023. The horizontal axis represents five distinct industries. The vertical axis shows the frequency of encrypted attacks and the change in growth rate for each sector
Current methods for classifying malicious traffic mainly focus on two strategies: (1) machine learning-based methods, which extract feature information from traffic data, input these features into machine learning models for training, and ultimately obtain detection results; (2) deep learning-based methods, which perform representation learning from raw traffic data, enabling deep learning models to automatically extract features. However, existing methods have limitations: primarily, machine learning research concentrates on basic statistical features, failing to capture key attack behaviors hidden within encrypted traffic. Additionally, encrypted traffic in different scenarios has varying characteristics, making these statistical features less stable. Most deep learning research focuses on mining features from raw bytes, sequence information, and transport layer security (TLS) handshake features, neglecting important host-to-server interaction information and failing to extract critical attack behavior patterns. Effectively representing encrypted malicious traffic for refined identification remains a significant challenge.
Recently, employing graph convolution networks (GCN) to process unstructured data like network traffic has shown certain advantages [1,2]. Owing to their powerful representation capabilities, GCN can simultaneously train on both node attributes and relationships between nodes. To tackle the challenges posed by encrypted network traffic, this paper introduces the TB-Graph model, an encrypted malicious traffic classification model based on a relational graph attention network. In simple terms, TB-Graph first converts traffic sessions into an undirected heterogeneous graph, with traffic bursts as nodes and three different types of edges connecting them. Subsequently, it embeds the traffic side-channel features, which are unaffected by encryption, into the graph nodes as node attributes, thereby enhancing the descriptive power of network traffic characteristics. Following this, we design relational positional coding combined with RGAT to learn the representation of the traffic burst graph. Finally, the graph representation is fed into a classification layer to predict its label. In the experimental section, we conduct a series of experiments using public datasets to demonstrate the effectiveness of our model. The experimental results show that the TB-Graph model surpasses almost all baseline methods, achieving the best performance on the datasets used. In summary, the contributions of this paper are as follows:
1. We develop a novel graph model for classifying encrypted malicious traffic. To our knowledge, this is the first study to treat the traffic bursts as nodes in the graph. It consists of traffic burst graph construction, relational positional coding, side-channel feature embedding, and the RGAT encoder module.
2. From the perspective of network traffic transmission behavior, we design three flexible edge relationships to connect burst nodes in the graph, aiming to comprehensively mine the rich behavioral information hidden during packet transmission.
3. We design relational positional coding and side-channel feature embedding, integrating this useful information with the traffic burst graph to assist the RGAT in iteratively updating the features of graph nodes more effectively.
4. To evaluate the effectiveness of our model, we conducted a series of experiments, and the results confirmed the validity of our method.
Section 2 reviews related works on encrypted malicious traffic classification; Section 3 provides a detailed description of our model; Section 4 presents the related experiments and analyzes the results; Section 5 concludes the paper.
The field of encrypted malicious traffic detection has evolved over the years, encompassing a wide array of models. The field of encrypted malicious traffic detection has evolved over the years, encompassing a wide array of models. The focus is on the current mainstream deep learning-based traffic identification models and the emerging graph neural network approaches.
2.1 Deep Learning-Based Methods
With the widespread adoption of deep learning models, many traffic classification methods have been developed based on these techniques. Due to encryption reducing the availability of highly discriminative features, most efforts attempt to extract as many features as possible from multiple perspectives, such as different types of features and different feature extraction models. Dai et al. [3] comprehensively extracted features from multiple angles, including traffic statistical features, TLS handshake fields, and certificates, and applied various machine learning models for classification, with the extreme gradient boosting (XGBoost) model achieving the highest accuracy rate of 97.71%. Gu et al. [4] used three independent feature extraction networks for pre-training, fully exploring the diversity and heterogeneity of TLS traffic. However, as the TLS protocol continues to evolve, the features selected by this method need to be updated promptly. Zeng et al. [5] further increased the number of non-encrypted features (temporal and statistical features) and performed importance selection on the feature set to enhance the capability of identifying encrypted malicious traffic. Considering the serialization and bidirectional semantic nature of network traffic, Cai et al. [6] proposed a structure that utilizes a bidirectional temporal convolutional neural network combined with a multi-head self-attention mechanism to better capture the semantic features of network traffic. It demonstrates more accurate detection capabilities for some highly concealed abnormal traffic. Cui et al. [7] constructed a stable channel-level behavior sequence, based on the intent of malware attacks, which uses multiple transformer modules to capture internal sequence similarities. However, in practice, it is a binary classification method that requires the construction of multiple independent subnetworks to capture the relationships between different sequences. This results in a significant consumption of model parameters and computational resources. Zhu et al. [8] utilized two independent models: bidirectional long short-term memory (Bi-LSTM) and one-dimensional convolutional neural network (1DCNN) to extract temporal and spatial features, respectively. To detect encrypted remote access trojan traffic, Zhang et al. [9] used a representation learning method to learn the embeddings of flow sequences at different stages of the trojan lifecycle and the payloads of data packets. This approach improves the binary classification accuracy for remote access attacks. Chen et al. [10] believed that inputting all features into the model is not advisable, adopting a multi-head self-attention mechanism to focus on learning key features and generating the most important combined features. However, this approach has only been tested on datasets with the TLS 1.2 protocol, and its detection efficiency may decrease on datasets with the TLS 1.3 protocol.
While these methods partially alleviate the issue of insufficient discriminative features, they require the extraction of multi-perspective features, which complicates the detection process. Furthermore, existing methods for traffic feature mining often tailor the extraction of traffic features to the characteristics of each specific scenario, task by task and scene by scene. This results in excellent performance in certain scenarios for the existing methods, but a decline in performance when switched to other scenarios. How to extract effective features and ensure their robustness to improve the fine-grained multi-classification performance of encrypted malicious traffic remains an unsolved challenge.
2.2 Graph Neural Network-Based Methods
Another mainstream approach involves transforming network traffic data into a graph structure, which encompasses a vast number of packet nodes and connection attribute information. A novel DApp fingerprinting method using Graph (GraphDApp) [11] used packet length sequences as a node feature and defined adjacency relationships between nodes based on the upstream and downstream direction information. It then uses a graph neural network to extract features from the constructed graph structure data for final classification. However, this method lacks the extraction of flow statistics and external topological structure information. Traffic interaction attribute graph (G-TIAG) [12] treated network flows as nodes and used flow features extracted by CICFlowmeter [13] as attributes for the nodes. It creates edges based on whether different flows share a common IP (Internet Protocol) address. The experimental results indicate that the G-TIAG approach requires further enhancement in dealing with imbalanced data. Hong et al. [14] used encrypted sessions as nodes with session statistical features as the attributes of the corresponding nodes. They construct a KNN (K-Nearest Neighbour) graph between any two samples based on the visual feature similarity of encrypted traffic and use the GraphSAGE model to achieve binary classification of graph nodes. Fu et al. [15] explored the spatiotemporal characteristics of network behavior using graph representation learning algorithms for the accurate identification of remote-control attacks within the TLS protocol. Additionally, the selection of comparative baseline methods is limited, lacking the necessary persuasive power. The attack fingerprint based on graphs of time-window (TGPrint) [16] proposed an attack fingerprint identification technique based on a time-windowed graph. It treats ports as nodes, the communication relationships between attacker and victim hosts as edges, and incorporates multiple characteristics as edge attributes to construct attack graphs for each individual attack. The approaches may result in the construction of a large-scale graph representation for long-lived sessions. The node in [17] represented a network flow with attributes corresponding to the protocol field information of the network flow, allowing it to learn complex relationships between any network flows while retaining protocol field information of the traffic.
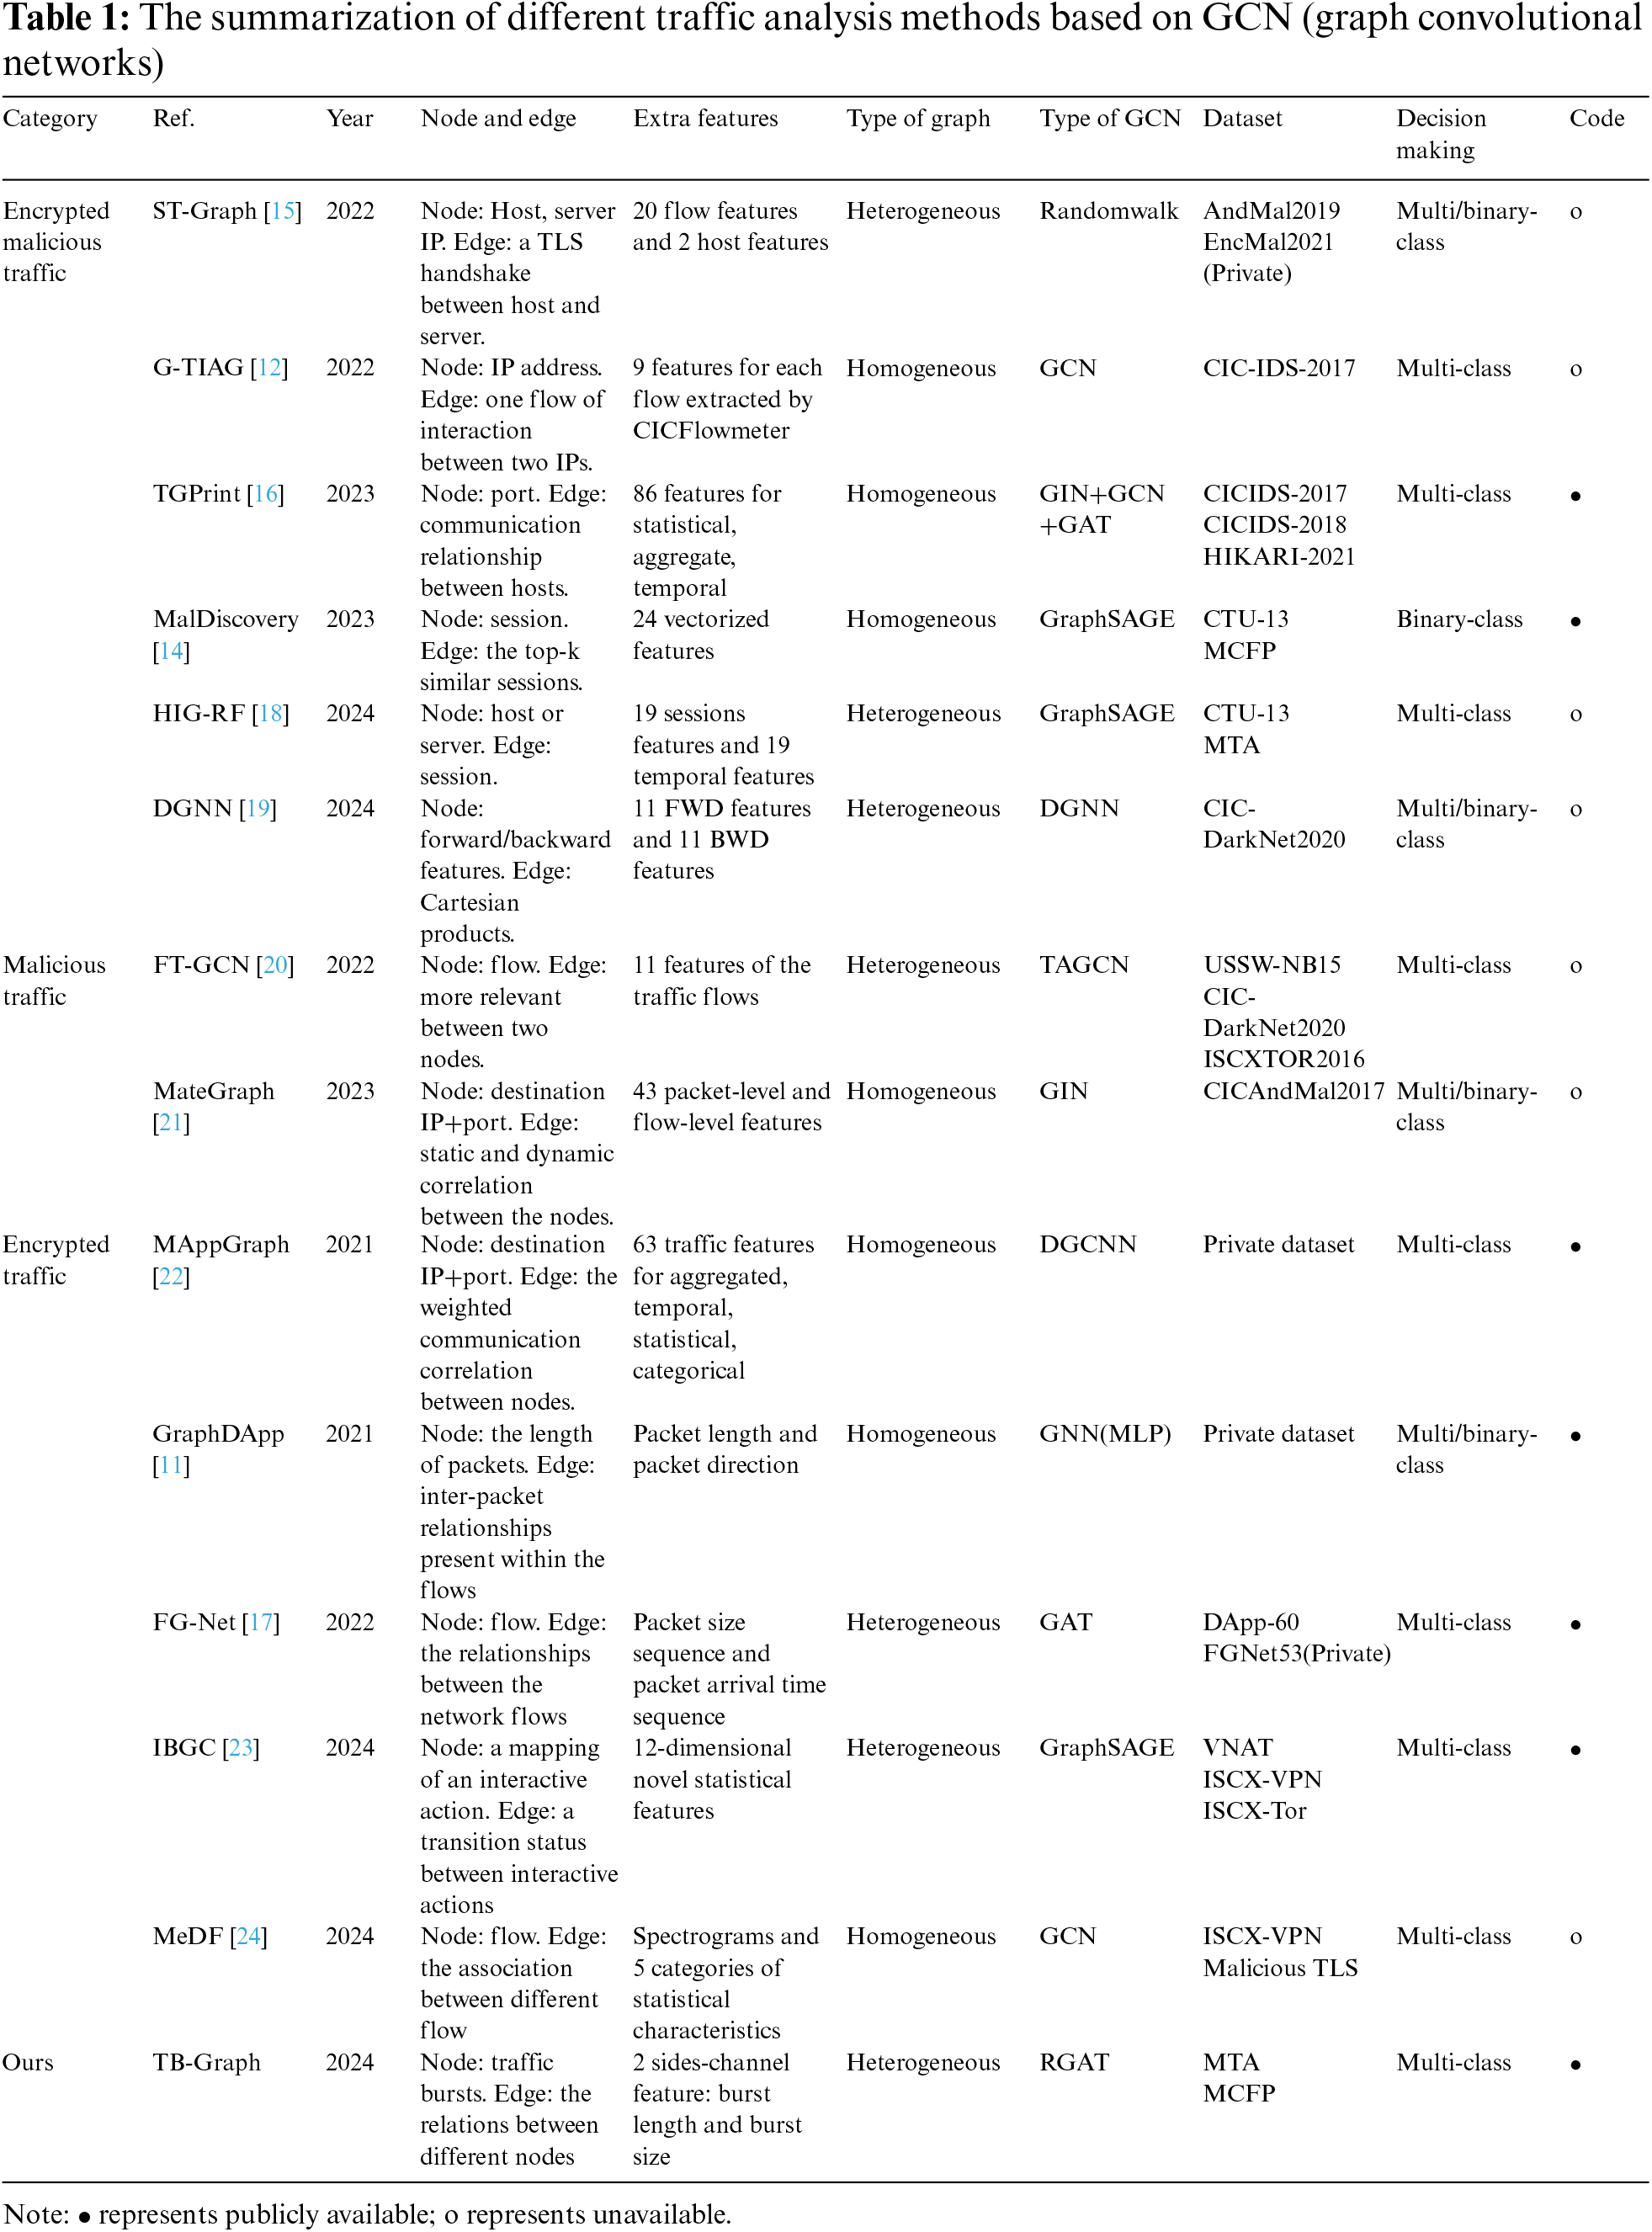
The powerful data representation capabilities of graph representation learning can help alleviate the issues of incomplete data mining, which are common in traditional machine learning methods. However, these methods are applicable for coarse-grained detection of benign/malicious encrypted traffic, but they do not perform well in the fine-grained identification of malicious encrypted traffic categories with covert attack behaviors. Moreover, noise in the traffic flows can easily render these methods ineffective. Typically, these approaches solely employ the most basic form of Graph Neural Networks (GNN), failing to capitalize on the unique advantages offered by various cutting-edge GNN models. In Table 1, we summarize related works and list the main novelties of our approach compared to these methods: (1) Construction of traffic behavior patterns: we innovatively use traffic bursts as graph nodes, which not only accurately describe network data transmission and interaction behaviors but also significantly reduce operation time and save storage space; (2) Introduction of relational position coding and side-channel information: ingeniously integrated with RGAT networks, this allows the TB-Graph to flexibly extract the relationships between the current node and its neighbors during feature extraction.
In this part, we offer an in-depth account of our model. The entire model is depicted in Fig. 2 and consists of data processing, traffic graph construction, the RGAT model and a classifier. The TB-Graph model first preprocesses the raw data packets and then converts them into a traffic burst graph. To uncover potential traffic information, side-channel features and meticulously designed relational positional coding are added to the traffic burst graph. Subsequently, a graph convolutional network is employed to learn the representations of the traffic burst graph. Further, an aggregation layer aggregates the representations of all nodes to obtain a holistic graph representation as a feature vector. Finally, in the classification layer, we utilize a fully connected layer to identify the application of the packet. In the subsequent text, we will elaborate on the architecture and components.
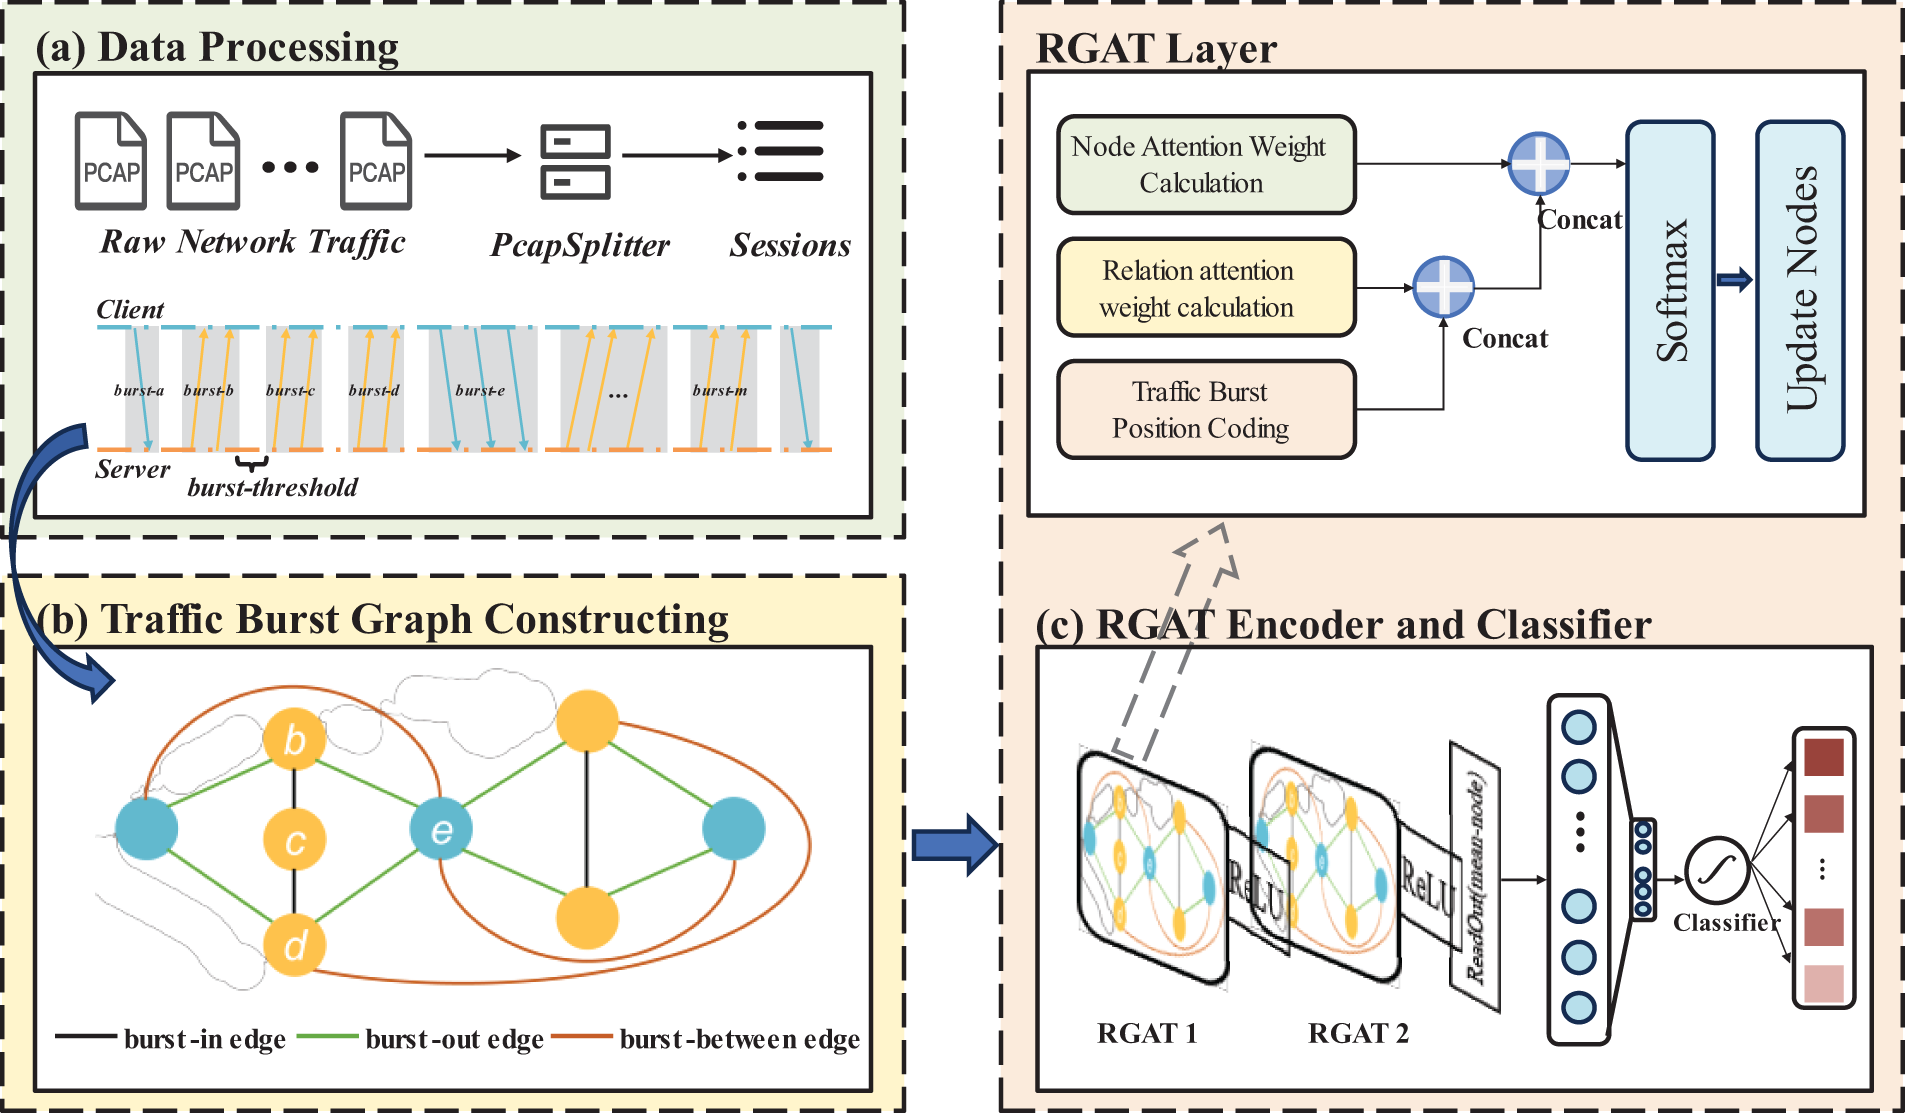
Figure 2: It provides an overview of our model. These three components are integrated into an end-to-end model that can automatically learn network traffic features and generate corresponding graph representations for each session
3.1 Traffic Burst Graph Constructing
Nodes Creation. Unlike previous work, due to the vast number of network packets, we do not treat each packet as an independent entity. Instead, we use traffic bursts as graph nodes. A sequence of data packets sent continuously in the same direction is referred to as a burst. To prevent long intervals between traffic packets from being classified as part of the same burst, we set a burst threshold
Edge Creation. After determining the vertices, it is necessary to introduce appropriate edges to represent the relationships between traffic bursts and construct the graph. However, simply connecting these burst nodes can easily lead to the weakening or loss of temporal features [11]. Considering the status of packet interactions between the host and the server, we design three edges to connect the relationships between different nodes: (1) burst-in edge: edges between consecutive bursts in the same direction; (2) burst-out edge: edges between consecutive bursts in different directions; (3) burst-between (burst-bt) edge: edges between the first and last burst nodes of adjacent bursts in the same direction. Fig. 3 is a simple example where packets between the client and server are segmented into different bursts according to the communication transmission direction, treated as graph vertices, and connected using the three edge types we designed. Initially, bursts that are in the same direction but exceed the threshold
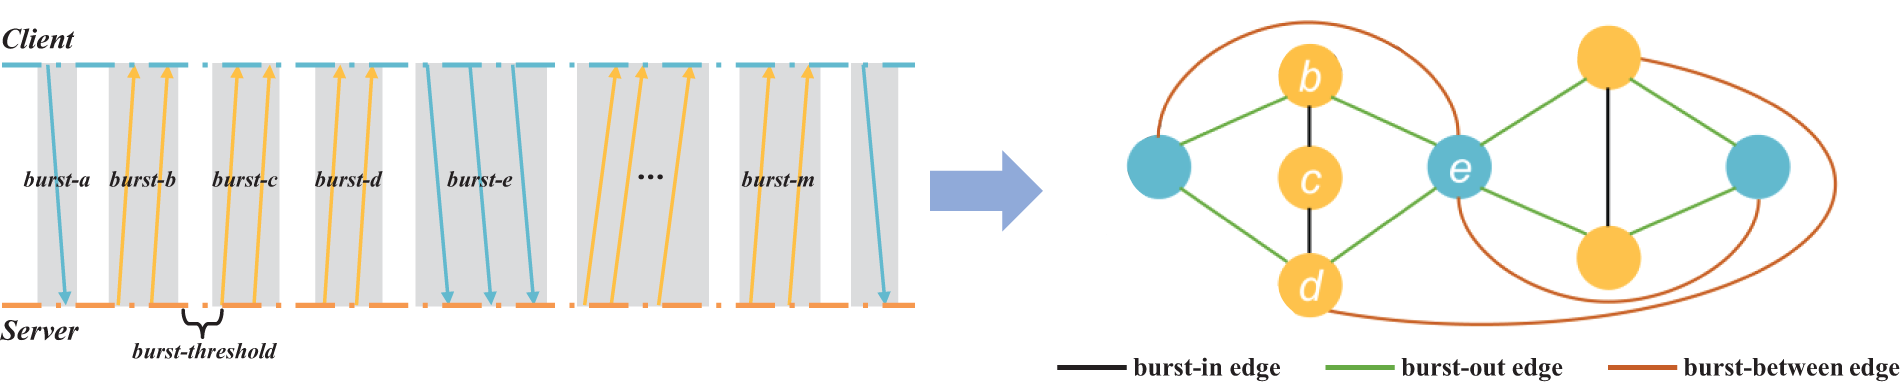
Figure 3: The description of packet burst graph construction. Original packet interaction transmissions are divided into bursts according to direction and then transformed into a compact graph structure
Since users send different types of requests to the server, the number and frequency of sent packets, or the sending intervals, may vary. Similarly, the frequency of server responses can change with the type of user request. The differences in these interactive behaviors will ultimately be reflected in the patterns of packet transmission, both upstream and downstream. The burst-in and burst-out edges can effectively capture the frequency of client-server interactions. The burst-bt edges can involve the characteristics of unidirectional traffic transmission.
3.2 Relational Position Coding
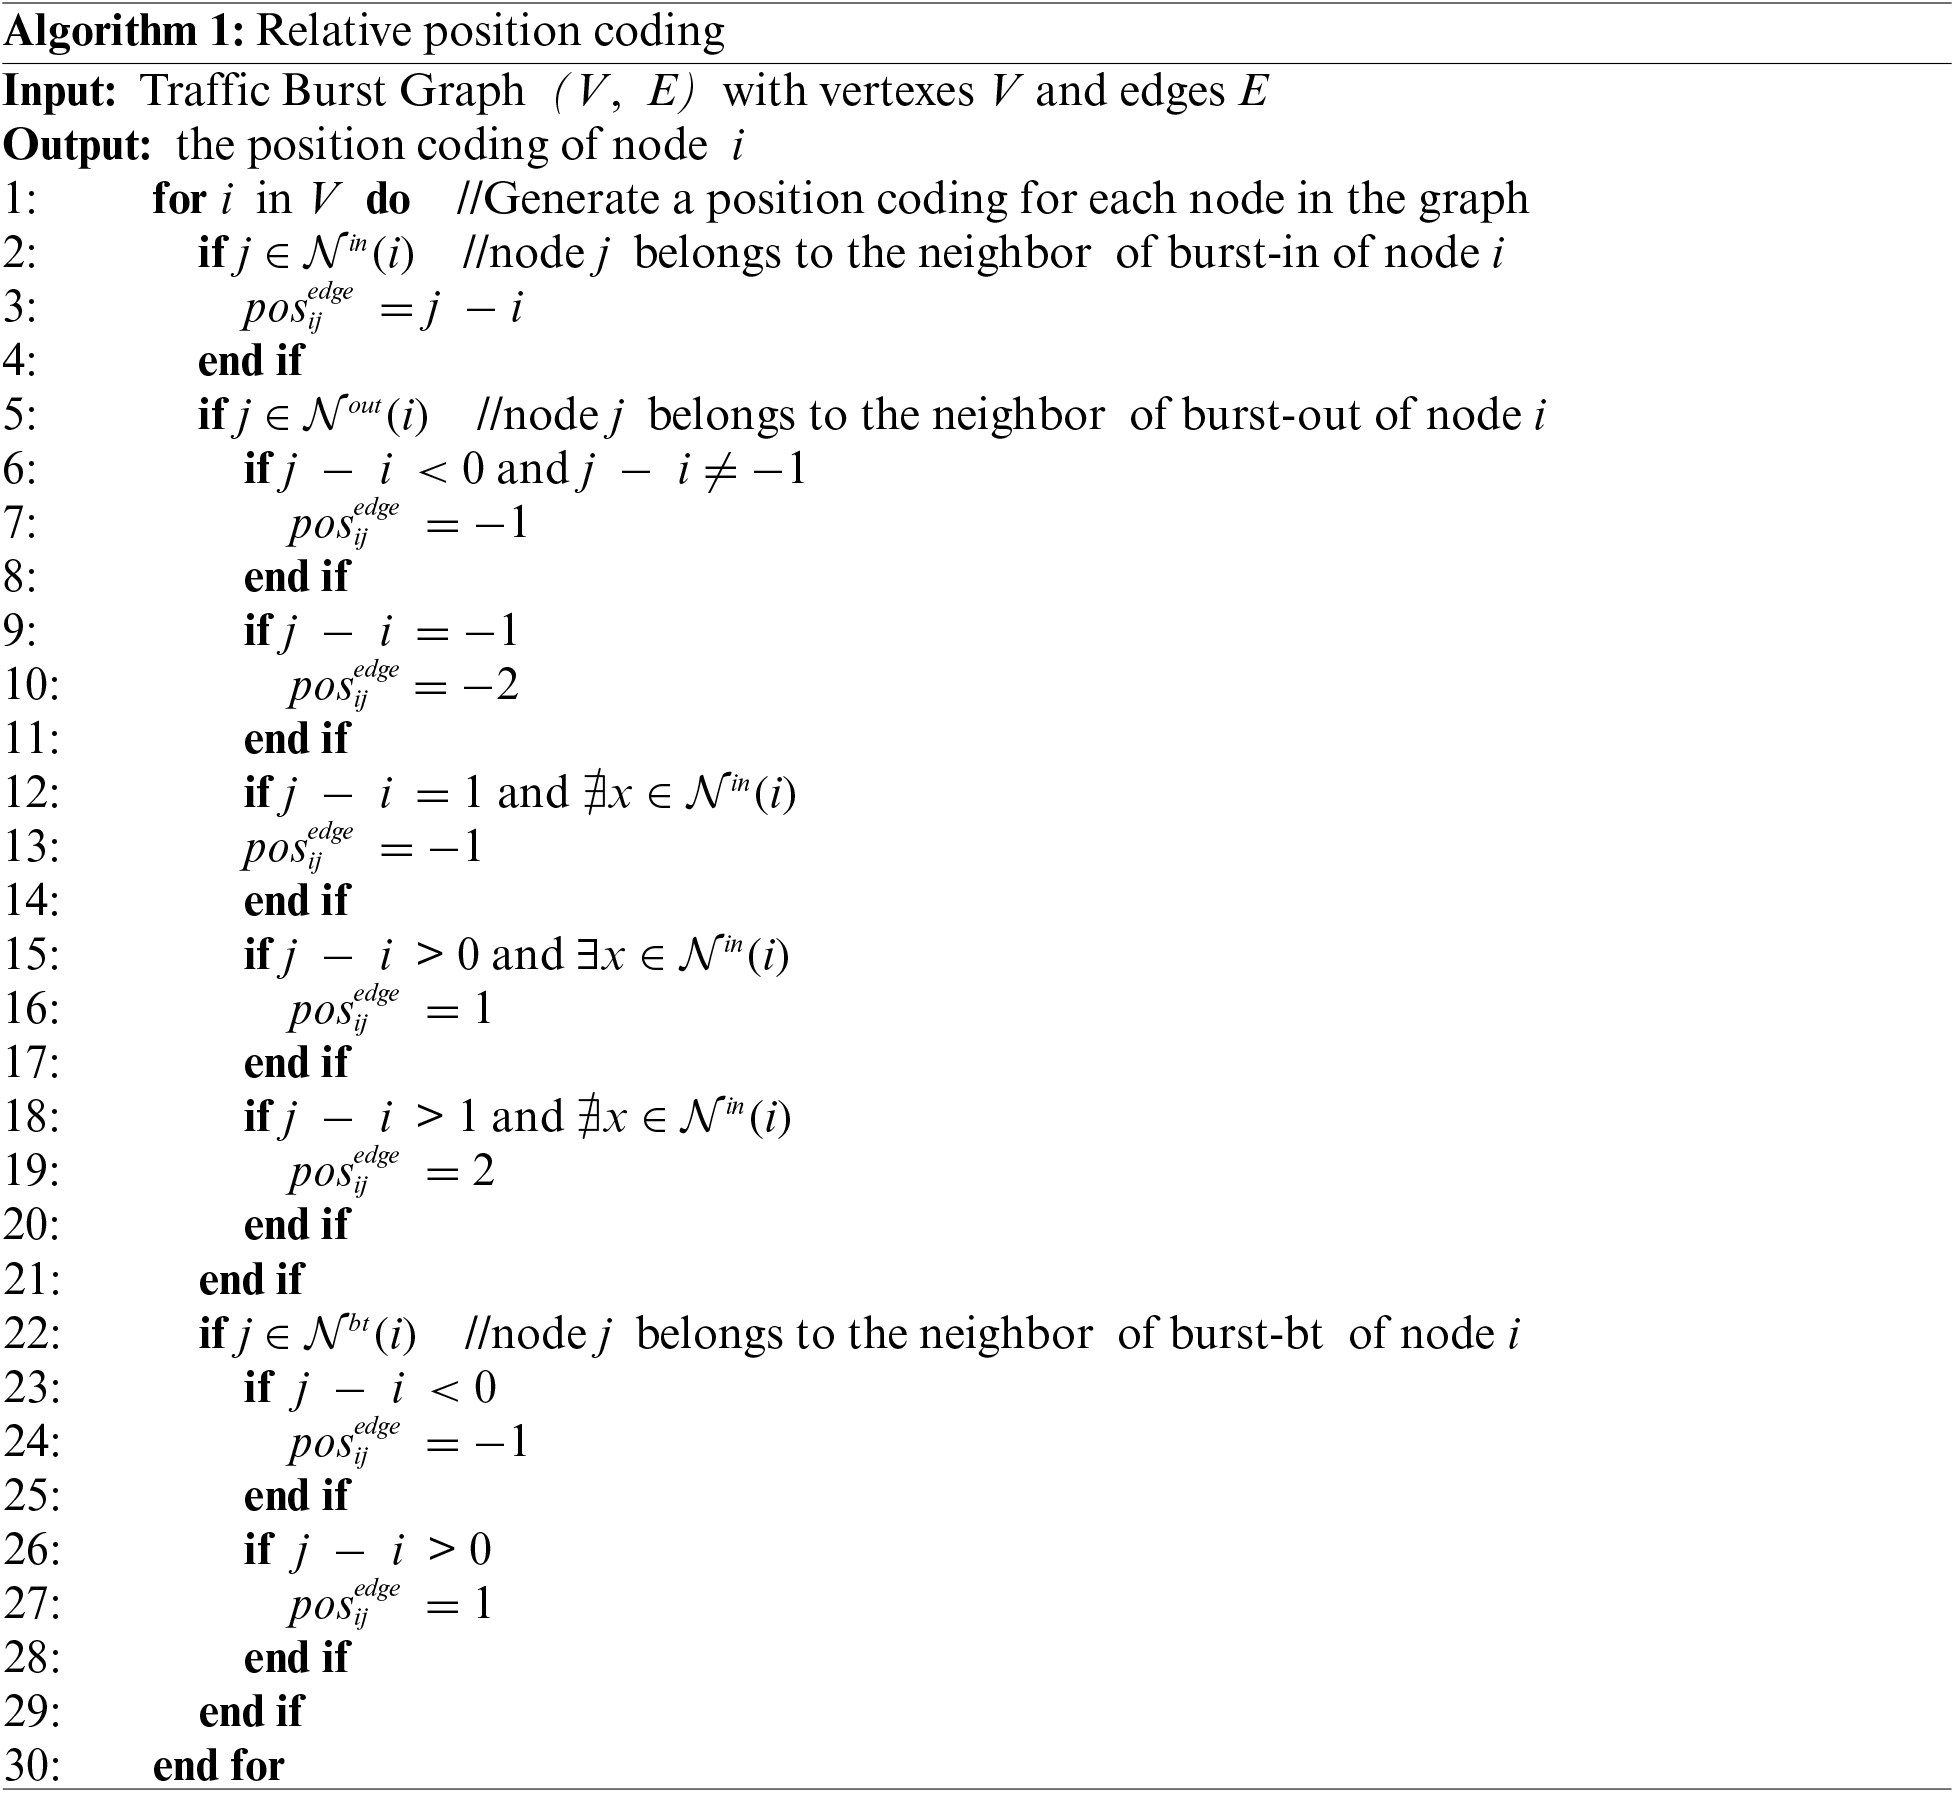
The generated graph structure is inherently an unordered data structure, which diminishes the temporal nature of the original traffic sequence. The ordered sequence of traffic packets is a crucial part of the traffic pattern. To preserve as much of this information as possible, FA-Net [26] designed simple relative and absolute positional coding for packets, combined with the self-attention mechanism in the transformer to capture the order relationships between bursts. However, absolute positional coding requires modeling based on the length of the input traffic sequence. If an unpredictable traffic sequence length is encountered, it would require re-learning. Since most traffic sequences are of unpredictable lengths, absolute positional coding is not considered. Therefore, we improved the relative positional coding to assist the RGAT in better identifying the latent structure of the traffic sequence. Based on the three types of edge relationships in traffic bursts, it is easy to determine that the range of burst-in edges for a single node is [0, 2], the range of burst-out edges is [0, 4], and the range of burst-bt edges is [0, 2]. The corresponding coding ranges are [−1, 1], [−2, 2], and [−1, 1], respectively. The design algorithm for the relative positional coding of a single node is shown in Algorithm 1.
To illustrate the working mechanism of the traffic burst positional coding clearly, Table 2 presents an example of the positional coding for node e in Fig. 2. Compared to absolute and relative positional coding, our method not only has a smaller coding range but also brings bursts from the same sender closer together, enhancing the unidirectional temporal sequence of the traffic flow.
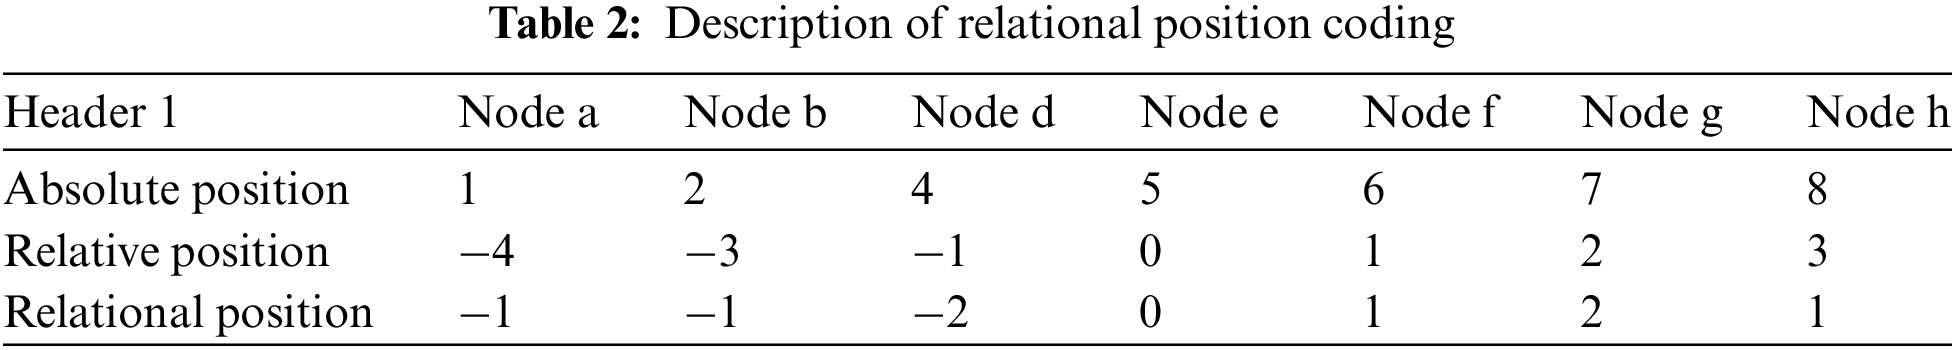
Finally, the generated relational positional coding is added to the edge weights as a scalar during the RGAT’s calculation of relationship attention weights, and incorporated into the process of updating node features.
3.3 Side-Channel Feature Embedding
We still choose to use side-channel information to assist in building traffic patterns, in order to fully utilize the effective information contained in bursts. In previous work [11,16,23], packet size sequences, packet direction sequences, packet time interval sequences, and message type sequences were selected as node features. Drawing on previous experience, we focus on integrating the length of each packet, which is a simple and intuitive feature with easy extraction and computation. It is usually associated with specific applications, protocols, or communication behaviors. Different applications and protocols exhibit distinct packet length distribution patterns. This attribute has been most widely used in previous work and has been proven to have sufficient discriminative power.
Integrating it with our traffic burst graph results in two attributes for each burst: size and length. The burst size is the number of packets in the same burst. The burst length is the sum of the lengths of all packets in the same burst. As attributes of traffic bursts, they can enhance the depiction of network behavior where multiple packets are transmitted in the burst for the same network event in a short time. Compared to a complete session, bursts can provide more granular network information. Compared to individual packets, bursts can also provide rich details at the level of network events.
3.4 RGAT Encoder and Classifier
Node feature update is the most critical process in the construction of traffic classification. As we have incorporated three distinct types of edges in the construction of the traffic burst graph, utilizing heterogeneous graphs over homogeneous ones yields more informative data on traffic interactions. The most classic methods of heterogeneous graph neural networks are RGCN (Relational graph convolutional network) and RGAT, which are designed with the intention of applying the relationships between nodes to the update of node features. RGCN builds upon GCN by separating different types of edges into distinct graphs, yet it retains a fixed weight matrix for each layer. Therefore, we employ the relational graph attention network, which enhances the expression capability of relationship features with the assistance of attention mechanisms. RGAT layer first calculates the similarity between the neighbor and the self-node vectors, then concatenates it with the relational positional coding to obtain the edge weight between the two nodes as Eq. (1).
In this section, we describe our experimental setup, encompassing the dataset, traffic preprocessing, and evaluation metrics. On this basis, we conducted an array of experiments, including ablation experiments, comparison experiments, GNN architecture variations study, and model efficiency comparisons. We conducted a comprehensive and specific evaluation of the performance of the TB-Graph.
Initially, we extracted encrypted malicious traffic samples from two dataset publication websites: Malware Capture Facility Project (MCFP) [27] and malware-traffic-analysis.net (MTA) [28].
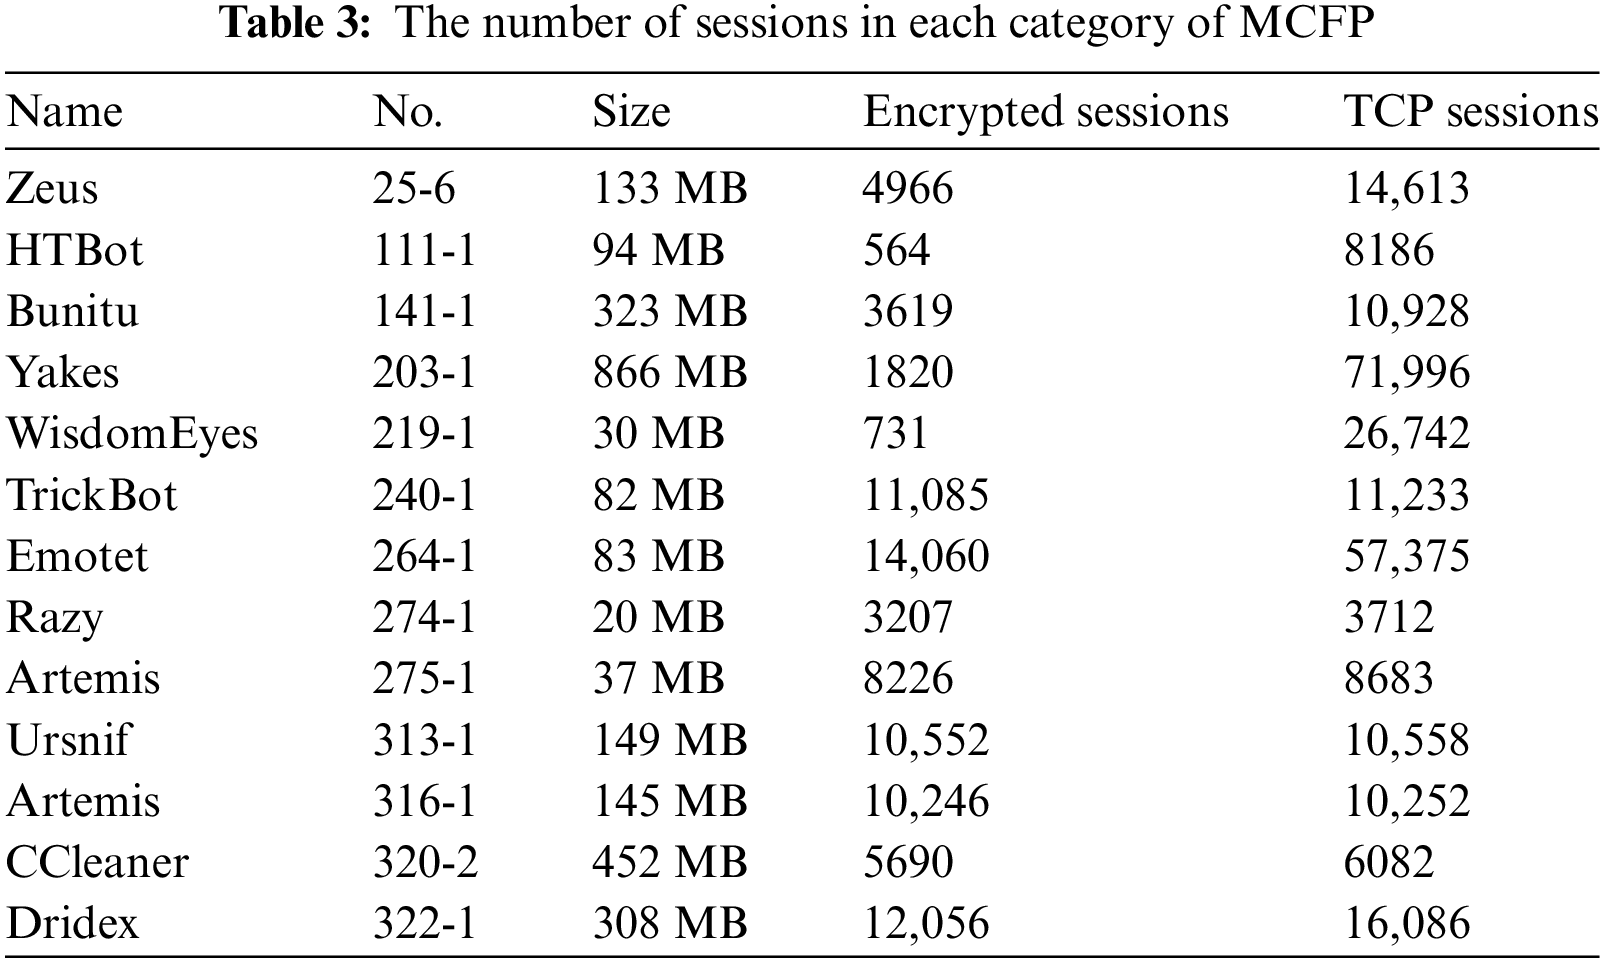
The MCFP [28] dataset has been collecting traffic generated by over three hundred different types of malware over an extended period. We select 13 different types of malware with a significant number of sessions, which include common categories such as trojans, worms, viruses, and ransomware. The information for the 13 PCAP files is provided in Table 3.
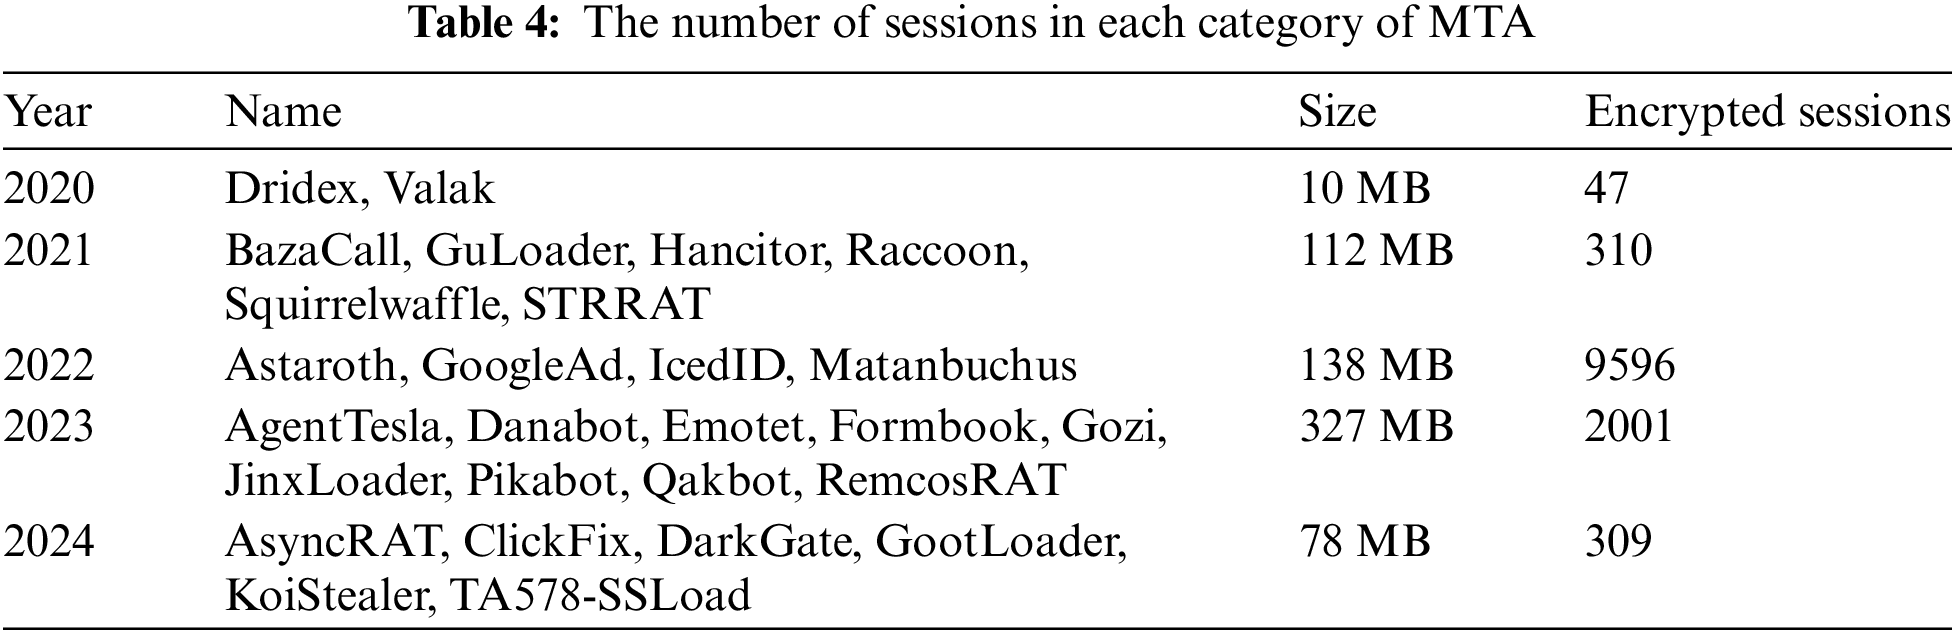
MTA [28] is another long-term updated blog focused on the study of malware traffic. It has accumulated an amount of traffic generated by malware and related analyses. Our experiments selected 27 samples released in recent years, totaling 952,052 packets and 12,000 encrypted sessions, which include various versions of encryption protocols. We show the detailed category information of MTA in Table 4.
For each dataset, we filtered out two types of useless traffic packets: (1) empty packets: packets with no payload, which contain almost no useful information for classification; (2) damaged or retransmitted packets, which introduce excessive noise into the samples.
4.2 Implementation Details and Baselines
We utilize the DGL library to construct the heterogeneous graph. Before training the traffic burst graph, we use a randomly generated method to assign different initial weights to each edge relationship. Considering the efficiency of the model, we build a two-layer RGAT module, with 8 attention heads, a hidden layer size of 128, and a batch size of 32. We use the Adam optimizer, with an initial learning rate set of 1E−4. Each experiment is run 10 times independently to take the average on two NVIDIA RTX 4080 GPUs.
To ensure a fair comparison, we use four metrics, namely Overall Accuracy (AC), Precision (PR), Recall (RC), and Macro F1 Score (F1), to evaluate the TB-Graph model against state-of-the-art baselines, including mainstream deep learning algorithms (i.e., AppScanner [29], CUMUL [30], FlowPrint [31], etc-PS [32], FS-Net [33], Deep Packet [34]) and graph neural network algorithms (i.e., GraphDApp [11], ECD-GNN [35], MAppGraph [22]). To ensure fair environment settings, when replicating these methods, we implement them on our server as configured in the original paper.
To validate the effectiveness of the burst-bt edges (BE), relational positional coding (RP) and side-channel feature embedding (SF) in this paper, this section conducts comparative ablation experiments.
4.3.1 Effectiveness Analysis of Burst-bt Edges
In this study’s packet relationship graph, we utilize burst-bt edges to connect non-adjacent nodes with the same direction of burst, aiming to preserve the transmission characteristics of unidirectional packets. To demonstrate the representational capacity of the traffic burst graph, we have designed four graph variants: (a) Retaining burst-in edge and burst-out edge, represented using homogeneous graphs. (b) Retaining burst-in edge and burst-out edge, represented using heterogeneous graphs. (c) Retaining all three types of edges, represented using homogeneous graphs. (d) Retaining all three types of edges, represented using heterogeneous graphs. We conduct experiments with different variants of the traffic burst graph on the MCFP dataset to assess the generalization performance of different edges. The results are shown in Fig. 4. It is evident that our TB-Graph design achieves the best representational performance. Variants of the TB-Graph structure have achieved results similar to other current graph methods. Confusion matrices can clearly represent the classification of each type of malicious sample by different models. The introduction of heterogeneous graphs has significantly improved the detection results. Compared to Fig. 4a, Fig. 4b shows an improvement in recognition accuracy for most categories, ranging from 1.0% to 7.5%. The misclassification situation on the dataset has significantly improved after the addition of burst-bt edges. Nearly half of the data types are fully recognized. This result demonstrates that introducing new edge types can enhance the feature expression capability of the original traffic graph.
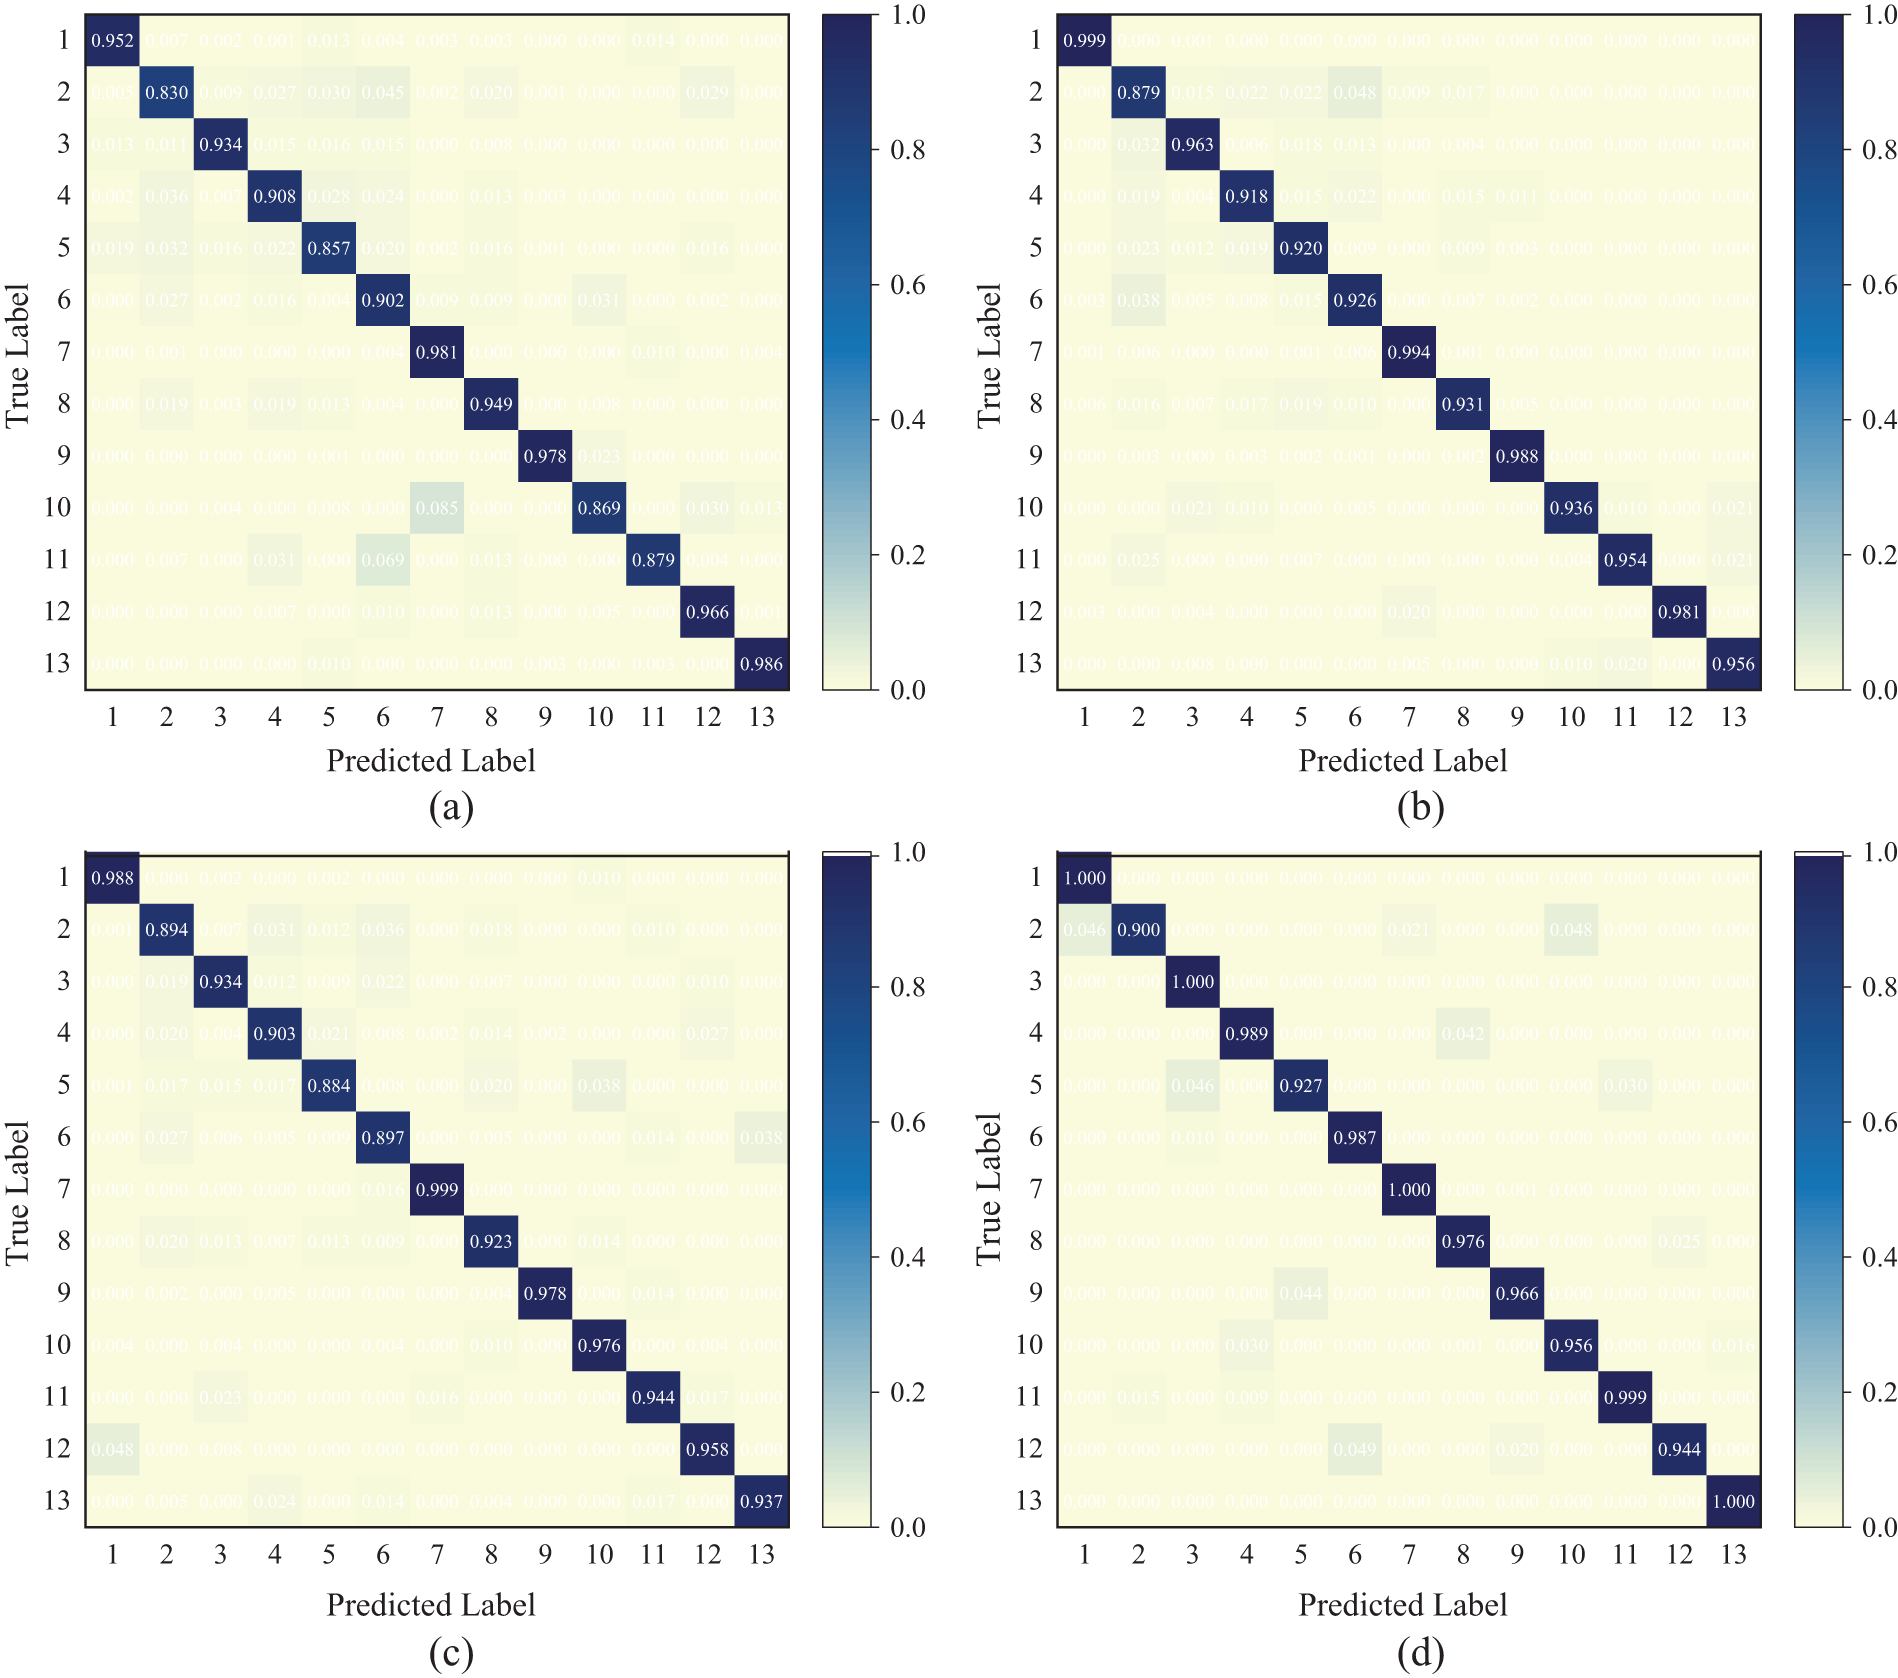
Figure 4: The confusion matrix of the experimental results for the four variants on the MCFP dataset
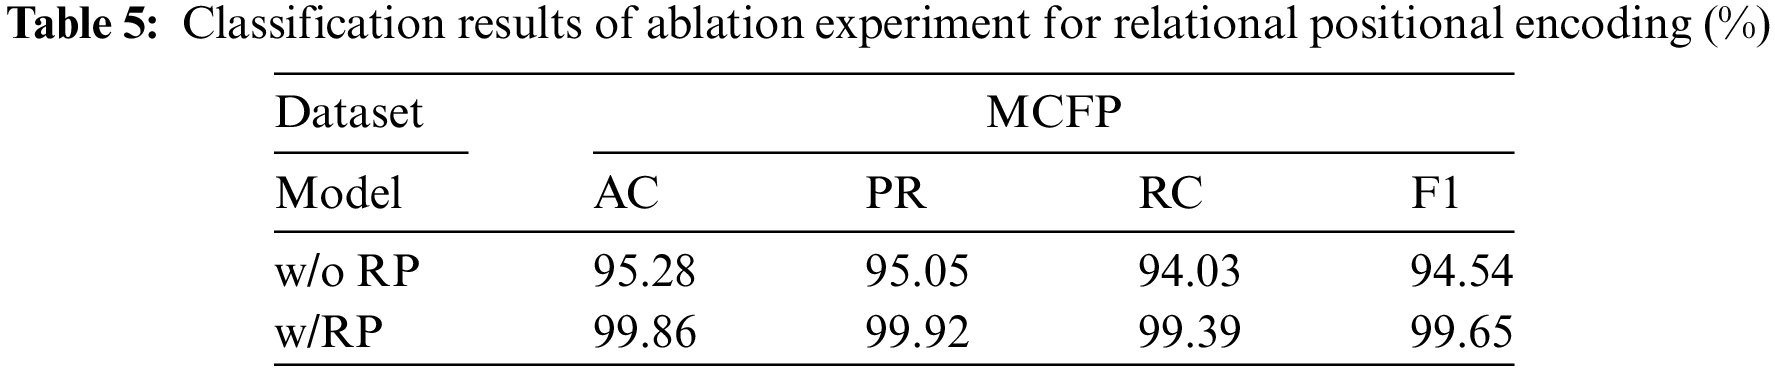
4.3.2 Analysis of the Effectiveness of Relational Positional Encoding
In Section 3.2, we design relational positional coding between different nodes to enhance the temporal information during packet transmission. Tests are conducted on both the MCFP dataset. Table 5 presents the ablation experiment where relational positional encoding is isolated to verify its actual effect. The experimental results indicate that the inclusion of relational positional encoding positively affects TB-Graph’s ability to extract the location attributes of packet bursts. The TB-Graph with RP integration outperformed the version without RP by 4.58%, 4.87%, 5.36%, and 5.11% in various metrics. This represents a significant impact on the model’s performance. This confirms that it can enhance the temporal performance of graph representations.
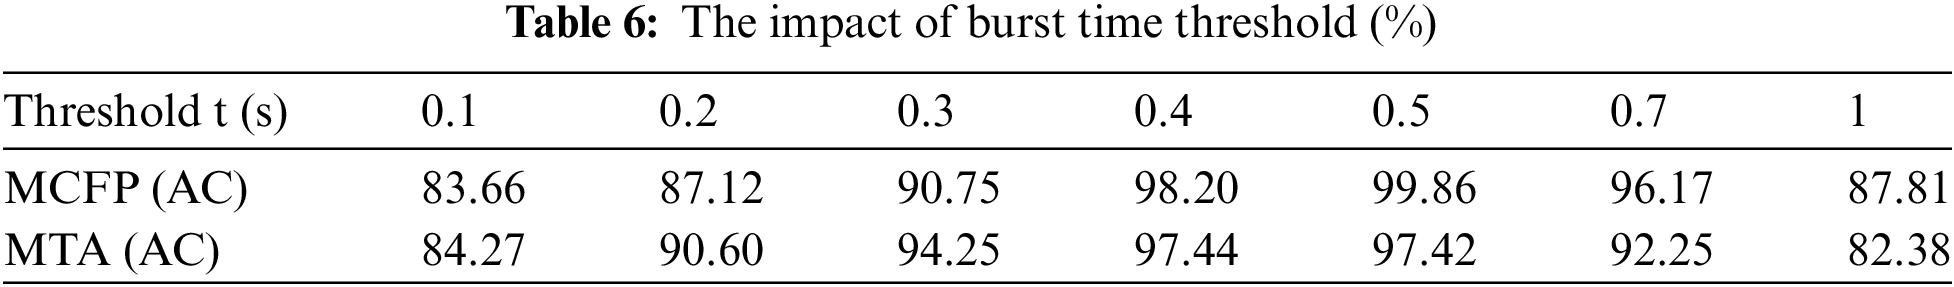
4.3.3 Analysis of the Time Interval Threshold
Traffic bursts can reflect the characteristics of network events to some degree, and a complete network communication process may be composed of several different network event bursts. To prevent two packets with a long arrival time interval during the same transmission from being classified as the same burst, we set an event interval threshold t and tested various values to select the appropriate threshold through experiments. The results, as shown in Table 6, demonstrate that the time interval threshold has a significant impact on the accurate identification of traffic bursts. The time threshold is ultimately set to 0.5 s.
4.3.4 Analysis of the Side-Channel Feature
Leveraging our experience, we have selected packet length as a node attribute to enhance the representational power of TB-Graph. Innovatively, we have introduced two new attributes: burst size and burst duration. In this section, we analyze the effectiveness of the proposed features through experiments. For three variants, we have used burst size (BZ), burst length (BL), and their combination as node features. score on two datasets. Fig. 5 shows the model’s accuracy and F1 score changes across two datasets. As depicted in Fig. 5: (1) When a single feature is selected as a graph node attribute, the model’s recognition performance declines. Using burst length alone, the model’s accuracy score decreased by 4.34% and 3.02%, respectively. The model’s F1 score decreased by 4.27% and 2.83%, respectively. This also confirms the validity of previous studies that used packet length alone for traffic analysis. This holds true even when the attribute is aggregated into bursts. (2) When using burst size alone, the TB-Graph’s accuracy suffered the most significant decline, with decreases of 9.58% and 9.42%, respectively. However, the results indicate that burst size still plays a positive role in identification. (3) It has been demonstrated that the characteristics of traffic bursts can, to some extent, reflect the behavioral characteristics of network packet transmission, with differences in network flow categories being reflected in the variations of traffic bursts.
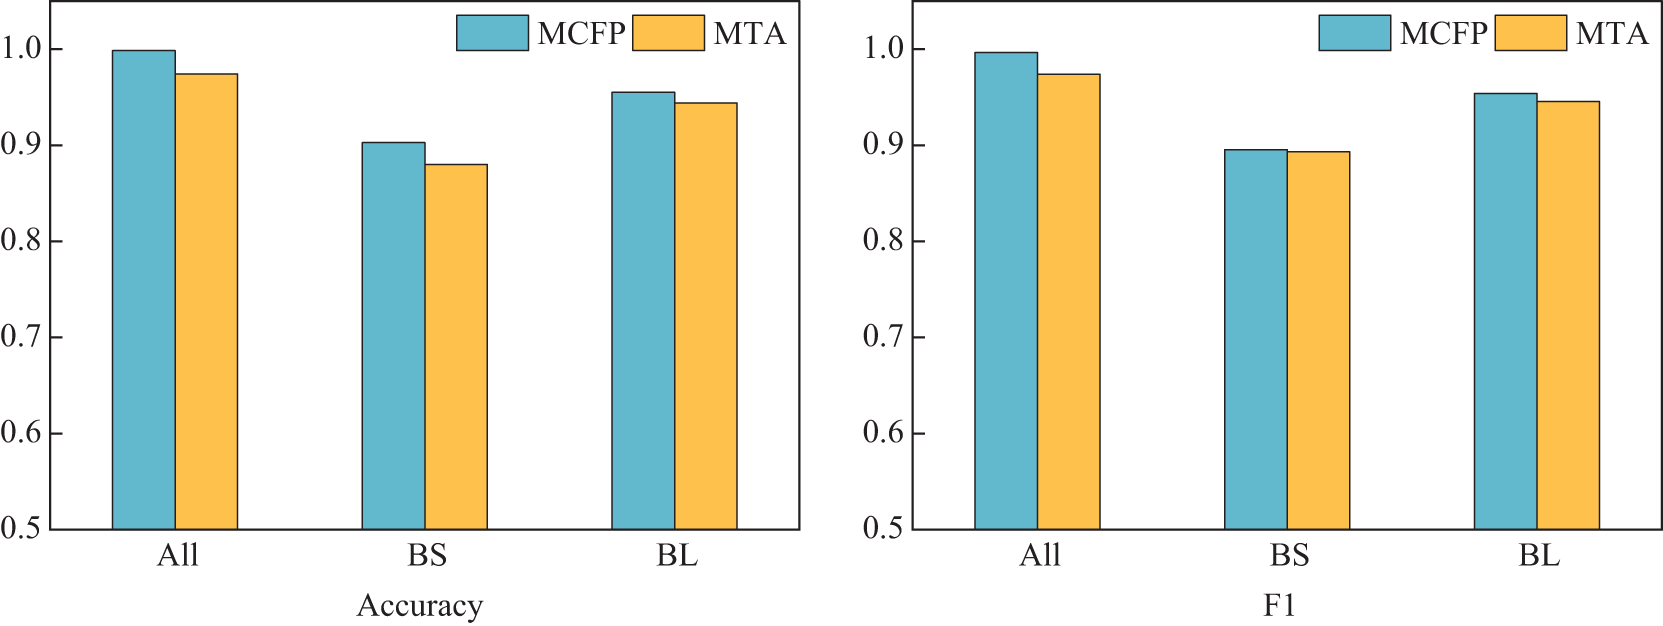
Figure 5: Classification results of ablation experiment for evaluating different side-channel features in TB-Graph
4.3.5 GNN Architecture Variants Study
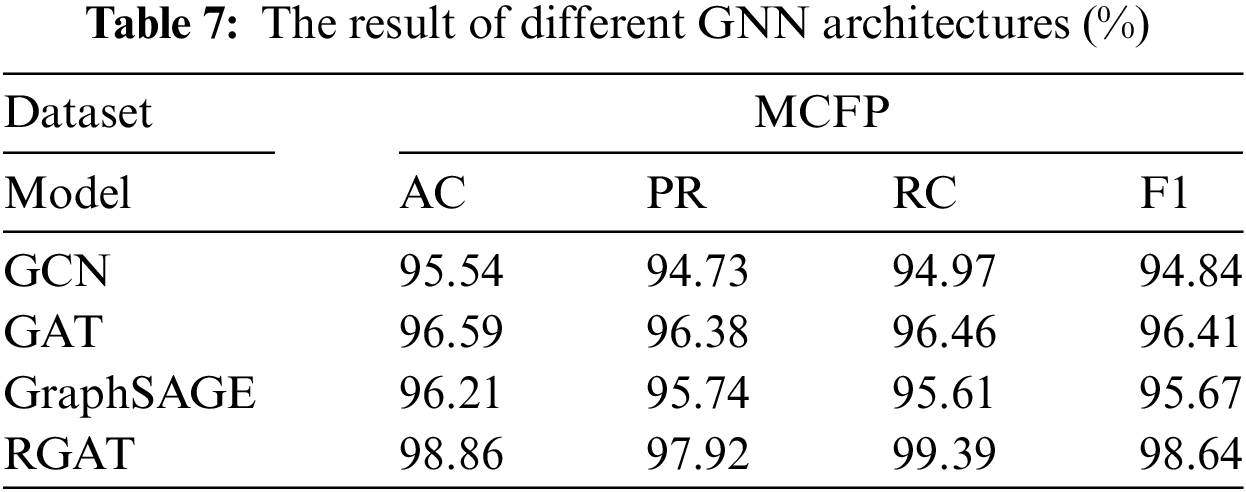
Currently, graph neural networks have evolved into various structural frameworks. To illustrate that RGAT provides more useful traffic interaction information, we selected classic GNN frameworks as variations (e.g., GCN, GAT, GraphSAGE) and conducted a comparison on the MCFP dataset. From Table 7, we can observe that RGAT achieved the best accuracy and F1 score. For other variations, performance degradation is evident, especially for GCN. It can only use fixed convolutional kernels for information transmission and node update, resulting in relatively weak global information expression capabilities. GAT can dynamically adjust the attention weights between adjacent nodes, which is why GCN may underperform GAT on specific tasks. With the addition of the relational attention mechanism, RGAT outperforms GAT. RGAT aggregates more node relationship features through the multi-head attention mechanism, better assigning different weights to neighbouring nodes.
The objective of this section is to compare the performance of TB-Graph with other baseline methods from a closed-world to, thereby demonstrating the generalizability and feasibility of our proposed approach.
We initially conducted experiments on the MCFP dataset, which was divided into training and testing sets in a 9:1 ratio. The experimental comparison results on the MCFP dataset are presented in Table 8 and Fig. 6a. The following conclusions can be drawn. (1) Compared to the other baselines, the performance of TB-Graph nearly achieved full marks, obtaining the highest results in four metrics, which comprehensively demonstrates that our model’s feature construction strategy can effectively represent the patterns of data packet transmission. (2) The GraphDApp and ECD-GNN methods also consider the process of traffic interaction, but their recall rates are still relatively low compared to TB-Graph, at 80.60% and 96.47% respectively. We argue the main reason is that their traffic interaction graph construction schemes limit the model’s expressive power and fail to uncover latent information in the transmission behavior. (3) The CUMUL and FS-Net methods only extract statistical features of packet length and its variants, lacking attention to the correlation between traffic flows. This makes it difficult to obtain sufficient information from encrypted malicious traffic to support the classifier in making effective classification. Neither accuracy nor F1 value is very satisfactory, with none exceeding 97.0%. (4) Although AppScanner uses 54 statistical features, it does not select the most valuable features for classification. The use of multiple-dimensional features without selection and cleaning may affect the final classification result due to contradictory expressions.
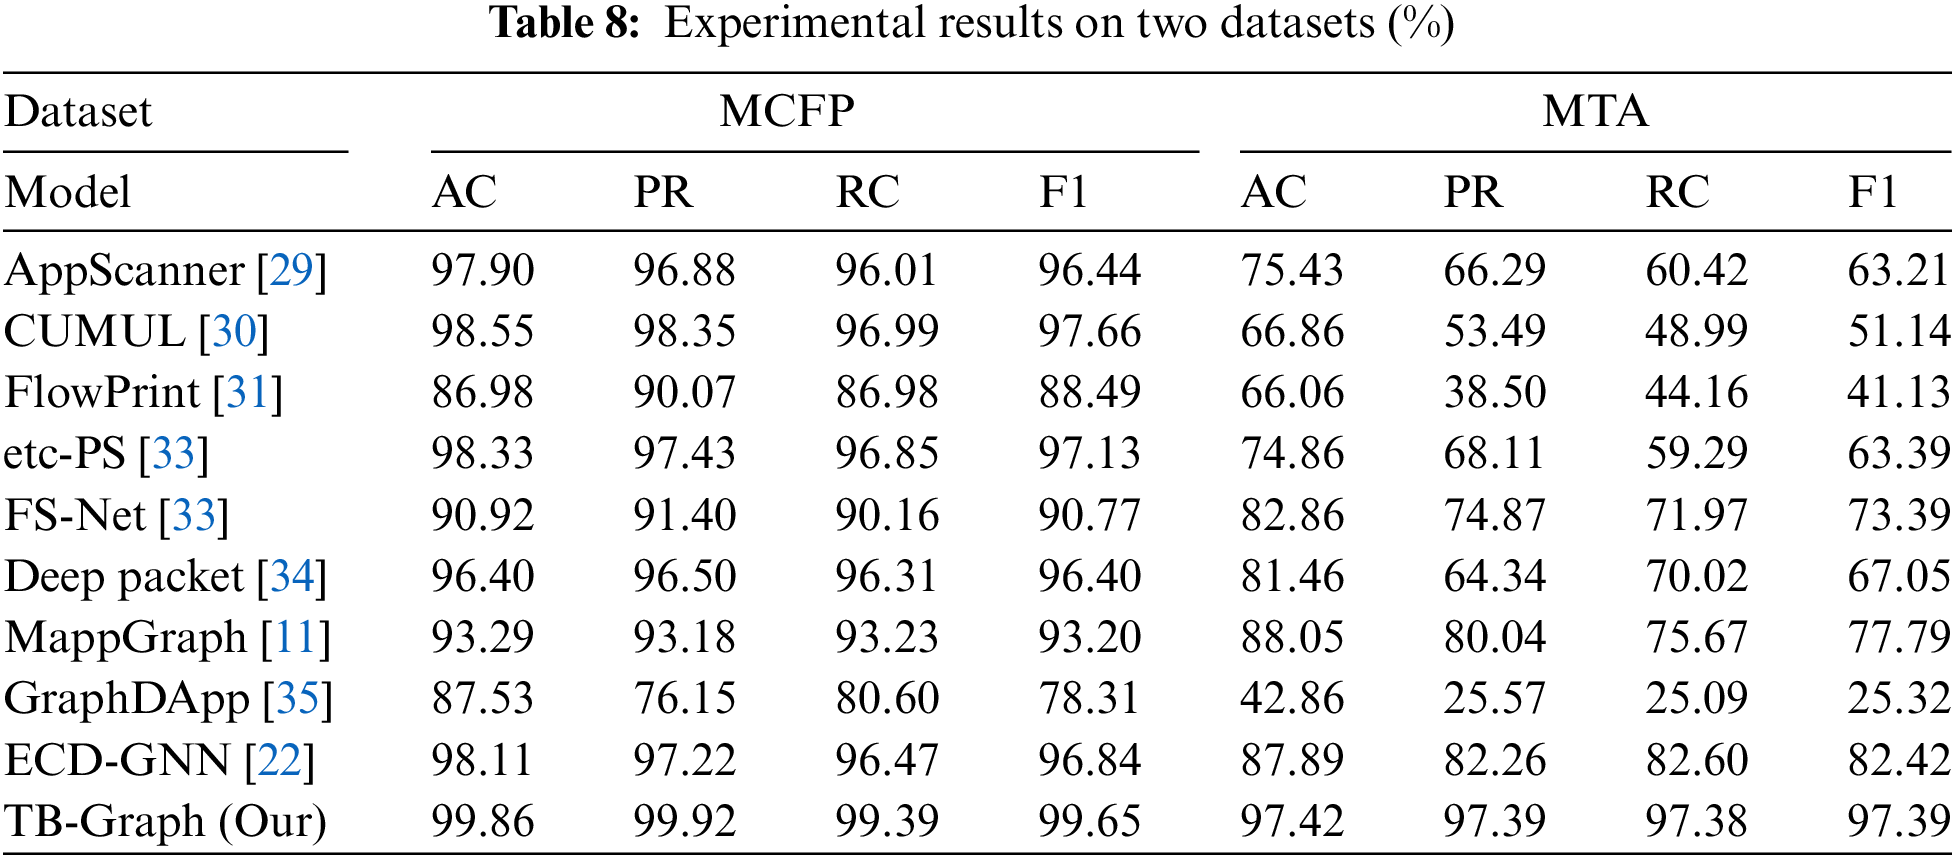
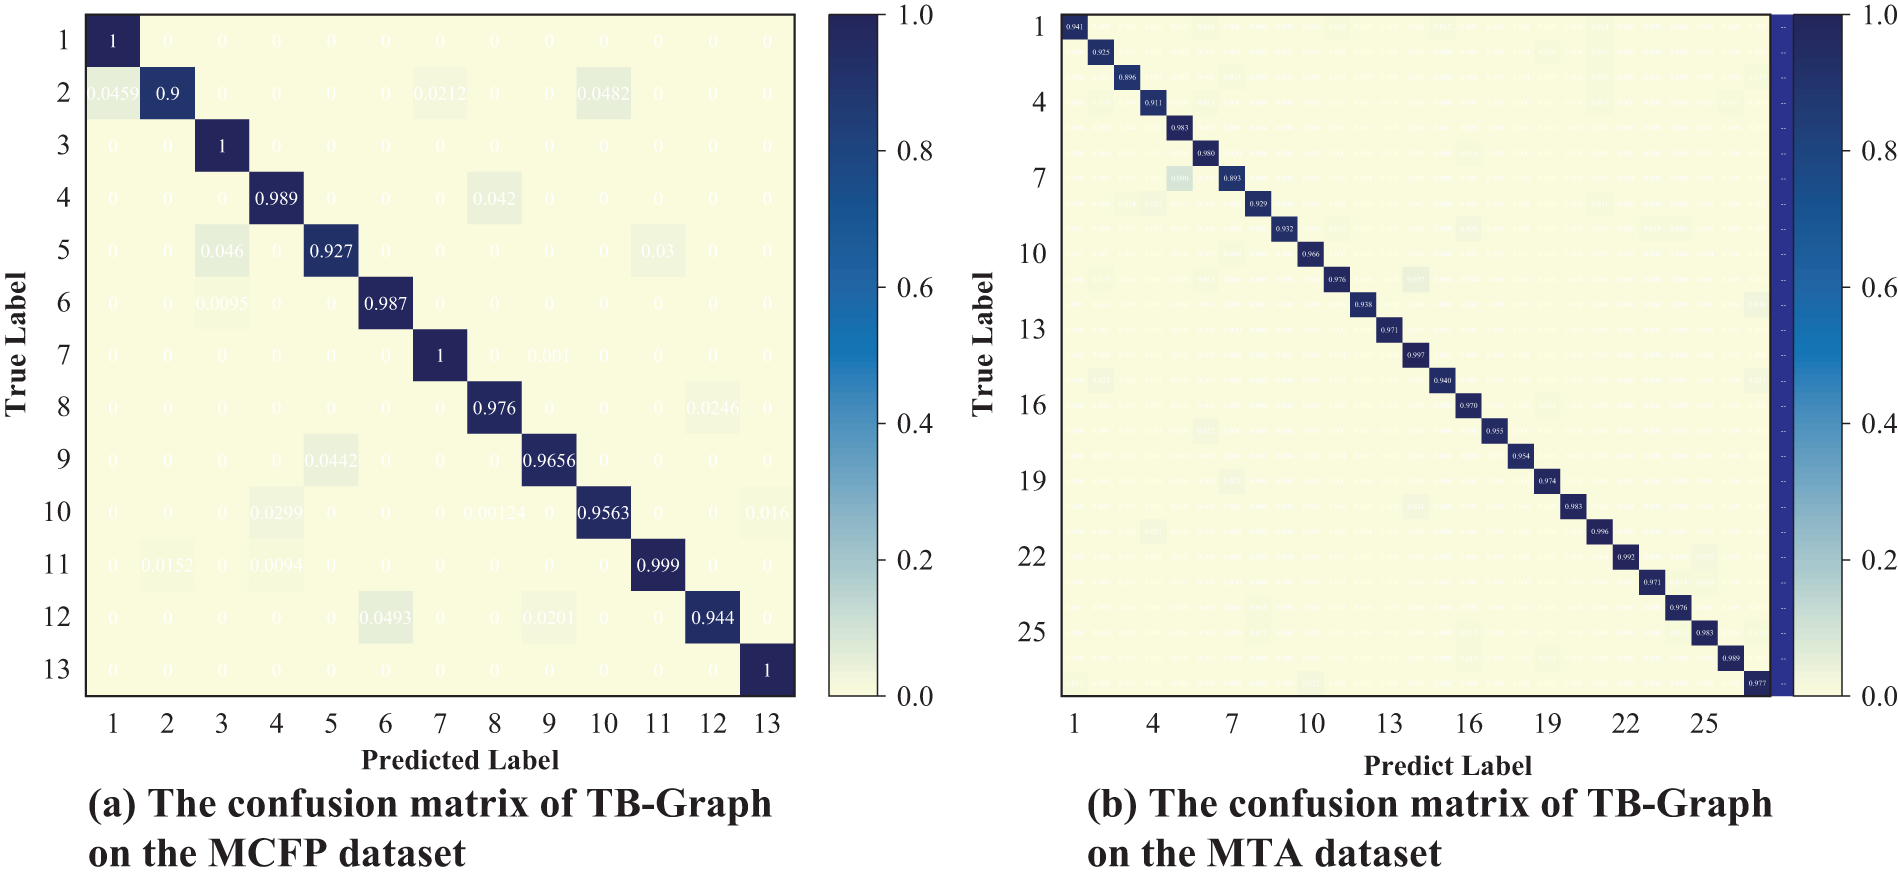
Figure 6: The confusion matrix of TB-Graph
Another part of Table 8 and Fig. 6b presents the results from the MTA dataset, from which we can infer the following insights: (1) almost all baseline models perform poorly on the MTA dataset due to its more complex composition. However, TB-Graph also achieves stable results on the MTA dataset, outperforming the best baseline models by over 9.37% and 14.78% in terms of detection accuracy and recall. This is attributed to TB-Graph’s strong capability to capture malicious traffic behaviors. (2) The performance of MappGraph and ECD-GNN algorithms is superior to the other deep learning methods. However, their average accuracy and F1 scores do not exceed 80.0%. This indicates that using the correlation between traffic flows can uncover deeper information. (3) The features of AppScanner and CUMUL are manually extracted and are not very applicable in the context of this paper. Consequently, their performance is the most significantly degraded. This may be due to the fact that some categories have a small amount of data, leading to fewer extractable features and potential misjudgments by the model.
This also reflects the challenge of dealing with complex encrypted malicious traffic, where from the perspectives of application data transmission behavior and packet features, utilizing the complementarity between different features can achieve high precision and low false positive rates in detection.
4.5 Model Efficiency Comparisons
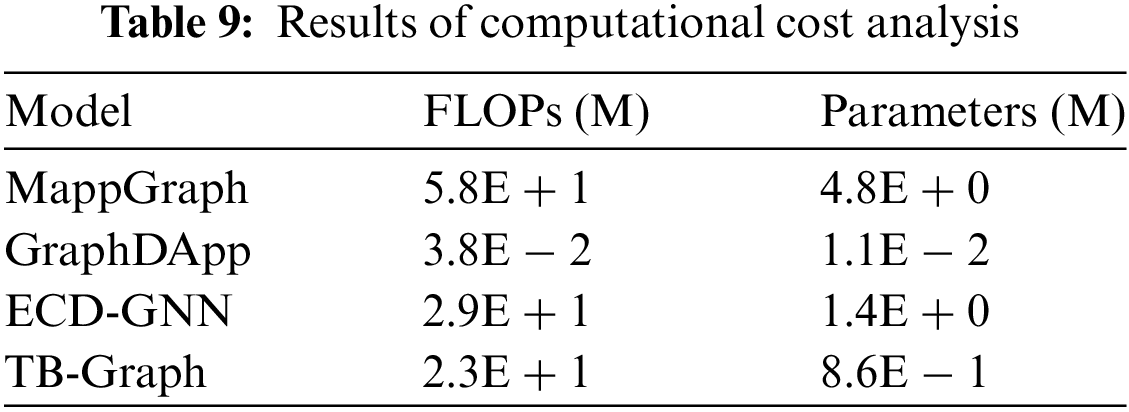
In Table 9, we present the floating point operations (FLOPs) and model size of several graph-based methods. It can be found that GraphDApp, with the fewest parameters. It employs only 3 layers of MLP (Multilayer Perceptron), 1 layer of fully connected layers, and simple node features. ECD-GNN and MappGraph, with their complex inputs and numerous GCN layers, result in plentiful processing time and resource consumption. In contrast, TB-Graph has the second-lowest number of parameters among the methods, thanks to our lightweight graph construction approach. It innovatively treats bursts as graph nodes, allowing for an efficient reduction in the size of the graph. The packet length as a node attribute is a simple and intuitive feature that is easy to extract and compute.
To effectively extract features from encrypted malicious traffic, our study develops a model named TB-Graph. The TB-Graph model transforms network traffic into a heterogeneous traffic burst graph, efficiently mining complex relationships during packet transmission between clients and servers while embedding side-channel information of network traffic as node features. During graph representation learning phase, the integration of relational positional coding with RGAT layers further enhances the spatial and temporal relationships between traffic burst nodes. To validate the effectiveness of the TB-Graph approach, we conducted detailed comparative experiments on two public datasets, which demonstrated the model’s robust capability in traffic representation. Moving forward, we intend to employ contrastive learning to address the issue of rare malicious samples, which is more aligned with real-world application scenarios.
Acknowledgement: Not applicable.
Funding Statement: This work was supported by the National Key Research and Development Program of China (2019QY1300) and Science & Technology Commission Foundation Strengthening Project (2019-JCJQ-ZD113).
Author Contributions: Ming Liu: conceptualization, methodology, formal analysis, writing—original draft, visualization; Qichao Yang: investigation, methodology, validation; Wenqing Wang: data collection, visualization, writing—review & editing; Shengli Liu: supervisor, conceptual, review, fund acquisition. All authors reviewed the results and approved the final version of the manuscript.
Availability of Data and Materials: To validate the model, we used the following public dataset: the MCFP dataset [27] is available from https://www.stratosphereips.org/datasets-malware (accessed on 10 June 2024); the MTA dataset [28] is available from https://www.malware-traffic-analysis.net (accessed on 10 June 2024).
Ethics Approval: Not applicable.
Conflicts of Interest: The authors declare no conflicts of interest to report regarding the present study.
References
1. G. Hu, X. Xiao, M. Shen, B. Zhang, X. Yan and Y. Liu, “TCGNN: Packet-grained network traffic classification via graph neural networks,” Eng. Appl. Artif. Intell., vol. 123, no. 2, 2023, Art. no. 106531. doi: 10.1016/j.engappai.2023.106531. [Google Scholar] [CrossRef]
2. X. Han et al., “DE-GNN: Dual embedding with graph neural network for fine-grained encrypted traffic classification,” Comput. Netw., vol. 245, no. 5, 2024, Art. no. 110372. doi: 10.1016/j.comnet.2024.110372. [Google Scholar] [CrossRef]
3. R. Dai, C. Gao, B. Lang, L. Yang, H. Liu and S. Chen, “SSL malicious traffic detection based on multi-view features,” in Proc. 2019 9th Int. Conf. Commun. Netw. Secur., 2019, pp. 40–46. doi: 10.1016/j.ins.2023.119229. [Google Scholar] [CrossRef]
4. R. Gu, J. Fei, H. Yu, Y. Zhu, K. Yang and F. Guo, “Meta-TFEN: A multi-modal deep learning approach for encrypted malicious traffic detection,” in 2023 33rd Int. Telecommun. Netw. Appl. Conf., IEEE, 2023, pp. 98–104. doi: 10.1109/ITNAC59571.2023.10368511. [Google Scholar] [CrossRef]
5. Z. R. Zeng, P. Xun, W. Peng, and B. Zhao, “Toward identifying malicious encrypted traffic with a causality detection system,” J. Inf. Secur. Appl., vol. 80, no. 1, 2024, Art. no. 103644. doi: 10.1016/j.jisa.2023.103644. [Google Scholar] [CrossRef]
6. S. Cai, H. Xu, M. Liu, Z. Chen, and G. Zhang, “A malicious network traffic detection model based on bidirectional temporal convolutional network with multi-head self-attention mechanism,” Comput. Secur., vol. 136, no. 1, 2024, Art. no. 103580. doi: 10.1016/j.cose.2023.103580. [Google Scholar] [CrossRef]
7. S. Cui, C. Dong, M. Shen, Y. Liu, B. Jiang and Z. Lu, “CBSeq: A channel-level behavior sequence for encrypted malware traffic detection,” IEEE Trans. Inf. Forensics Secur., vol. 18, pp. 5011–5025, 2023. doi: 10.1109/TIFS.2023.3300521. [Google Scholar] [CrossRef]
8. S. Zhu, X. Xu, H. Gao, and F. Xiao, “CMTSNN: A deep learning model for multiclassification of abnormal and encrypted traffic of Internet of Things,” IEEE Internet Things J., vol. 10, no. 13, pp. 11773–11791, 2023. doi: 10.1109/JIOT.2023.3244544. [Google Scholar] [CrossRef]
9. Y. Zhang et al., “ER-ERT: A method of ensemble representation learning of encrypted RAT traffic,” in 2023 IFIP Netw. Conf. (IFIP Netw.), IEEE, 2023, pp. 1–10. doi: 10.23919/IFIPNetworking57963.2023.10186391. [Google Scholar] [CrossRef]
10. J. Chen, L. Song, S. Cai, H. Xie, S. Yin and B. Ahmad, “TLS-MHSA: An efficient detection model for encrypted malicious traffic based on multi-head self-attention mechanism,” ACM Trans. Priv. Secur., vol. 26, no. 4, pp. 1–21, 2023. doi: 10.1145/3613960. [Google Scholar] [CrossRef]
11. M. Shen, J. Zhang, L. Zhu, K. Xu, and X. Du, “Accurate decentralized application identification via encrypted traffic analysis using graph neural networks,” IEEE Trans. Inf. Forensics Secur., vol. 16, pp. 2367–2380, 2021. doi: 10.1109/TIFS.2021.3050608. [Google Scholar] [CrossRef]
12. G. Ren, G. Cheng, and N. Fu, “Accurate encrypted malicious traffic identification via traffic interaction pattern using graph convolutional network,” Appl. Sci., vol. 13, no. 3, 2023, Art. no. 1483. doi: 10.3390/app13031483. [Google Scholar] [CrossRef]
13. A. H. Lashkari, G. D. Gil, M. S. I. Mamun, and A. Ghorbani, “Characterization of tor traffic using time based features,” in Int. Conf. Inf. Syst. Secur. Priv., SciTePress, 2017, vol. 2, pp. 253–262. doi: 10.5220/0006105602530262. [Google Scholar] [CrossRef]
14. Y. Hong, Q. Li, Y. Yang, and M. Shen, “Graph based encrypted malicious traffic detection with hybrid analysis of multi-view features,” Inf. Sci., vol. 644, no. 3, 2023, Art. no. 119229. doi: 10.1016/j.ins.2023.119229. [Google Scholar] [CrossRef]
15. Z. Fu et al., “Encrypted malware traffic detection via graph-based network analysis,” in Proc. 25th Int. Symp. Res. Attacks, Intrusions Defenses, 2022, pp. 495–509. doi: 10.1145/3545948.3545983. [Google Scholar] [CrossRef]
16. L. Wang et al., “TGPrint: Attack fingerprint classification on encrypted network traffic based graph convolution attention networks,” Comput. Secur., vol. 135, no. 3, 2023, Art. no. 103466. doi: 10.1016/j.cose.2023.103466. [Google Scholar] [CrossRef]
17. M. Jiang et al., “Accurate mobile-app fingerprinting using flow-level relationship with graph neural networks,” Comput. Netw., vol. 217, no. 1, 2022, Art. no. 109309. doi: 10.1016/j.comnet.2022.109309. [Google Scholar] [CrossRef]
18. Q. Guo, W. Yang, and B. Cui, “Graph-based detection of encrypted malicious traffic with spatio-temporal features,” in Advances in Internet, Data & Web Technologies, Cham: Springer Nature Switzerland, 2024, pp. 75–86. doi: 10.1007/978-3-031-53555-0_8. [Google Scholar] [CrossRef]
19. Y. Zhu et al., “DGNN: Accurate darknet application classification adopting attention graph neural network,” IEEE Trans. Netw. Serv. Manag., vol. 21, no. 2, pp. 1660–1671, 2023. doi: 10.1109/TNSM.2023.3344580. [Google Scholar] [CrossRef]
20. X. Deng, J. Zhu, X. Pei, L. Zhang, Z. Ling and K. Xue, “Flow topology-based graph convolutional network for intrusion detection in label-limited IoT networks,” IEEE Trans. Netw. Serv. Manag., vol. 20, no. 1, pp. 684–696, 2022. doi: 10.1109/TNSM.2022.3213807. [Google Scholar] [CrossRef]
21. R. Ge, Y. Zhang, C. Si, G. Zhou, and W. Zhou, “MateGraph: Toward mobile malware detection through traffic behavior graph,” in 2022 IEEE 24th Int. Conf. High Perform. Comput. Commun., 2022, pp. 801–809. doi: 10.1109/HPCC-DSS-SmartCity-DependSys57074.2022.00132. [Google Scholar] [CrossRef]
22. T. D. Pham, T. L. Ho, T. T. Huu, T. D. Cao, and H. L. Truong, “MAppGraph: Mobile-app classification on encrypted network traffic using deep graph convolution neural networks,” in Proc. 37th Ann. Comput. Secur. Appl. Conf., 2021, pp. 1025–1038. doi: 10.1145/3485832.3485925. [Google Scholar] [CrossRef]
23. Y. Li, X. Chen, W. Tang, Y. Zhu, Z. Han and Y. Yue, “Interaction matters: Encrypted traffic classification via status-based interactive behavior graph,” Appl. Soft Comput., vol. 155, no. 2, 2024, Art. no. 111423. doi: 10.1016/j.asoc.2024.111423. [Google Scholar] [CrossRef]
24. X. Wang et al., “Combine intra- and inter-flow: A multimodal encrypted traffic classification model driven by diverse features,” Comput. Netw., vol. 245, no. 4, pp. 1.1–1.12, 2024. doi: 10.1016/j.comnet.2024.110403. [Google Scholar] [CrossRef]
25. R. Schuster, V. Shmatikov, and E. Tromer, “Beauty and the burst: Remote identification of encrypted video streams,” in 26th USENIX Secur. Symp. (USENIX Secur. 17), 2017, pp. 1357–1374. doi: 10.5555/3241189.3241295. [Google Scholar] [CrossRef]
26. M. Jiang et al., “FA-Net: More accurate encrypted network traffic classification based on burst with self-attention,” in 2023 Int. Joint Conf. Neural Netw. (IJCNN), IEEE, 2023, pp. 1–10. doi: 10.1109/IJCNN54540.2023.10191615. [Google Scholar] [CrossRef]
27. M. J. De Lucia and C. Cotton, “Detection of encrypted malicious network traffic using machine learning,” in MILCOM 2019–2019 IEEE Mil. Commun. Conf. (MILCOM), IEEE, 2019, pp. 1–6. doi: 10.1109/MILCOM47813.2019. [Google Scholar] [CrossRef]
28. B. Duncan, “Malware traffic analysis,” 2024. Accessed: Jun. 10, 2024. [Online]. Available: https://malware-traffic-analysis.net/ [Google Scholar]
29. V. F. Taylor, R. Spolaor, M. Conti, and I. Martinovic, “AppScanner: Automatic fingerprinting of smartphone apps from encrypted network traffic,” in 2016 IEEE Eur. Symp. Secur. Priv. (EuroS&P), IEEE, 2016, pp. 439–454. doi: 10.1109/EuroSP.2016.40. [Google Scholar] [CrossRef]
30. A. Panchenko et al., “Website fingerprinting at internet scale,” in NDSS '16, San Diego, CA, USA, 2016. doi: 10.14722/ndss.2016.23477. [Google Scholar] [CrossRef]
31. T. Van Ede et al., “FlowPrint: Semi-supervised mobile-app fingerprinting on encrypted network traffic,” in Netw. Distrib. Syst. Secur. (NDSS) Symp. 2020, San Diego, CA, USA, 2020. doi: 10.14722/ndss.2020.24412. [Google Scholar] [CrossRef]
32. S. J. Xu, G. G. Geng, X. Jin, D. Liu, and J. Weng, “Seeing traffic paths: Encrypted traffic classification with path signature features,” IEEE Trans. Inf. Forensics Secur., vol. 17, pp. 2166–2181, 2022. doi: 10.1109/TIFS.2022.3179955. [Google Scholar] [CrossRef]
33. C. Liu, L. He, G. Xiong, and Z. Cao, “FS-Net: A flow sequence network for encrypted traffic classification,” in IEEE INFOCOM 2019-IEEE Conf. Comput. Commun., IEEE, 2019, pp. 1171–1179. doi: 10.1109/INFOCOM.2019.8737507. [Google Scholar] [CrossRef]
34. M. Lotfollahi, M. Siavoshani, R. Zade, and M. Saberian, “Deep packet: A novel approach for encrypted traffic classification using deep learning,” Soft Comput., vol. 24, no. 3, pp. 1999–2012, 2020. doi: 10.1007/s00500-019-04030-2. [Google Scholar] [CrossRef]
35. T. L. Huoh, Y. Luo, and T. Zhang, “Encrypted network traffic classification using a geometric learning model,” in 2021 IFIP/IEEE Int. Symp. Integr. Netw. Manag. (IM), IEEE, 2021, pp. 376–383. [Google Scholar]
Cite This Article
 Copyright © 2025 The Author(s). Published by Tech Science Press.
This work is licensed under a Creative Commons Attribution 4.0 International License , which permits unrestricted use, distribution, and reproduction in any medium, provided the original work is properly cited.
 Downloads
 Citation Tools