
 Submit a Paper
 Propose a Special lssue
 Open Access
ARTICLE

Integrating Image Processing Technology and Deep Learning to Identify Crops in UAV Orthoimages
1 Department of Civil Engineering, Republic of China Military Academy, Kaohsiung, 830, Taiwan
2 Department of Marine Science, Republic of China Naval Academy, Kaohsiung, 813, Taiwan
* Corresponding Author: Ching-Lung Fan. Email:
Computers, Materials & Continua 2025, 82(2), 1925-1945. https://doi.org/10.32604/cmc.2025.059245
Received 01 October 2024; Accepted 07 January 2025; Issue published 17 February 2025
 View Full Text
 Download PDF
Abstract
This study aims to enhance automated crop detection using high-resolution Unmanned Aerial Vehicle (UAV) imagery by integrating the Visible Atmospherically Resistant Index (VARI) with deep learning models. The primary challenge addressed is the detection of bananas interplanted with betel nuts, a scenario where traditional image processing techniques struggle due to color similarities and canopy overlap. The research explores the effectiveness of three deep learning models—Single Shot MultiBox Detector (SSD), You Only Look Once version 3 (YOLOv3), and Faster Region-Based Convolutional Neural Network (Faster RCNN)—using Red, Green, Blue (RGB) and VARI images for banana detection. Results show that VARI significantly improves detection accuracy, with YOLOv3 achieving the best performance, achieving a precision of 73.77%, recall of 100%, and reduced training time by 95 seconds. Additionally, the average Intersection over Union (IoU) increased by 4%–25% across models with VARI-enhanced images. This study confirms that incorporating VARI improves the performance of deep learning models, offering a promising solution for precise crop detection in complex agricultural environments.Keywords
Remote sensing is a technique to detect the electromagnetic radiation reflected from a target object in a non-contact manner, which can ensure its physical properties. Observing crop characteristics from a few meters to several hundred kilometers at different altitudes has proven efficient and cost-saving. Remote sensing images can mainly be obtained from various platforms such as satellites, aircraft, and Unmanned Aerial Vehicles (UAVs). These remote sensing image data can accurately understand the health status, growth stages, amounts, and ranges of crops, and it is helpful to monitor the crops’ production yield.
The advantages of satellite imagery are that weather conditions do not restrict it, and it can obtain a wide range of ground information. Through satellite imagery, it can draw yield maps [1], land cover and crop classification [2], and tree canopy detection [3]. Conversely, manned aerial photography from airplanes has higher resolution and is capable of long-term survey missions. Aerial imagery can be applied to land use and environmental planning [4]. Despite the continuous improvement of satellite and aircraft remote sensing technology, there are still limitations in spatial and temporal resolution, cost, and performance of small crop classification [5]. Most satellite and aerial imagery have lower spatial resolution and are constrained by cost and maneuverability, which make them unsuitable for analyzing small crops. UAVs have appropriate agility, which can quickly acquire a very fine spatial resolution imagery (<1 m) of small areas. In recent years, UAV imagery has been used to achieve the yield prediction of crops [6–8], pest and disease detection [9,10], and assessment of agriculture damage [11–13], which have obtained significant results due to the characteristic of easy data access with UAV, which is advantageous for collecting large amounts of crop images. This allows for fully capturing crops’ morphology and physical traits and assisting farmers in various activities, such as crop planning and analysis and farm monitoring to evaluate crop growth and health conditions. Furthermore, UAVs can perform better in detecting small crops than traditional satellites and human-crewed aircraft in crop detection.
Crop classification is the fundamental key of modern agriculture. Its purpose is to categorize crops and plant types into different categories while determining their spatial distribution. It can assist governments and farmers in obtaining helpful information about their crops and enhance their decision-making ability [14]. Although the spatial resolution of satellites and airplane remote sensing images has significantly improved in the past 20 years, higher-resolution images are needed to detect small crops. The insufficient resolution of the image caused the crop classification to be finely distinguished. Although it can take manual visual methods to categorize crops more precisely, it is an approach with significant cost. Thus, extracting relevant crop features through deep learning methods can perform the classification of crops automatically. However, deep learning methods usually need high spatial-resolution images to perform classification tasks effectively. In recent years, UAV images combined with deep learning methods have already been utilized for crop classification, and its achievements have become available solutions for numerous agriculture applications [15,16].
Deploying UAVs with image-based multi-sensor cameras provides an opportunity for more efficient and cost-effective computer vision inspections. RGB cameras are the most commonly used sensors in UAVs, with high spatial resolution, low price, and maneuverability. However, When an RGB camera is used to capture images, it is susceptible to interference from sunlight and shadows, which can affect the performance of classification models. Lu et al. [17] also pointed out that RGB images are susceptible to variation in on-site lighting conditions, posing challenges for image segmentation and object detection. Hence, integrating deep learning methods and image processing techniques (IPTs) can offer new solutions to overcome these models’ limitations and enhance crop detection performance. Among these, the Visible Atmospherically Resistant Index (VARI) is one of the vegetation indices based on image processing techniques. Processing and analyzing the visible spectral bands in remote sensing images can accurately calculate the index of reflecting vegetation greenness under atmospheric impact [18]. VARI is designed to compensate for the influence of atmospheric conditions on visible light reflecting rate, which can normalize the reflectance value of visible spectra. Therefore, using other vegetation indices that rely only on visible light could lead to inaccuracies. However, VARI can reduce the influence of atmospheric conditions and enhance the accuracy of indices. Thus, VARI has been widely applied in various fields such as agriculture, forestry, natural resources monitoring, and ecological research. It evaluates vegetation’s health condition and productivity in extensive areas. However, the spatial resolution of the satellite remote sensing is relatively low, and VARI is not available daily in this scenario [19]. That is why high-resolution UAV images offer VARI the opportunity to develop crop detection.
Taiwan is an island that often experiences typhoon impacts. To prevent banana trees from being knocked down by strong winds or typhoons, farmers interplant and layer two crops: bananas and betel nuts (Fig. 1). The taller betel nuts above obstruct the view of lower bananas, causing these two plants to overlap, making it challenging to observe the texture of bananas. Due to the variations in crop height, some crops are often grown in mixed-layer arrangements. This causes significant limitations in classifying the crops in the images. When different crops with similar phenology are planted or intercropped together, it leads to the wrong crop type classification [20]. Hence, high spatial, temporal, and spectral image resolution is needed to identify crop types under small-scale and intermixed planting situations. The remote sensing of UAVs can provide helpful information on the visible spectrum with the acquisition of higher resolution, which is not contaminated by elements out of vegetation [21]. Therefore, low-altitude flying UAV platforms can obtain more detailed information relative to crop type and conditions, which can also promote crop classification accuracy. By extracting contextual or semantic information, deep learning methods can effectively handle this ambient occlusion issue. However, when there are other green plants on the ground, the ability of deep learning to extract crops features could be reduced. The leaf colors of banana and betel nuts are green and similar in shape, so it could be challenging to use deep learning methods to detect bananas. Hence, the advantage of using VARI is that it can effectively distinguish areas with similar colors on the ground and classify these two kinds of crops. So far, there has been no work on classifying bananas and betel nuts using deep learning methods and VARI. Therefore, this study introduces a novel system that utilizes UAV remote sensing for banana detection. It integrates high-resolution orthoimages and VARI to enhance the banana-detecting ability of the deep learning model.
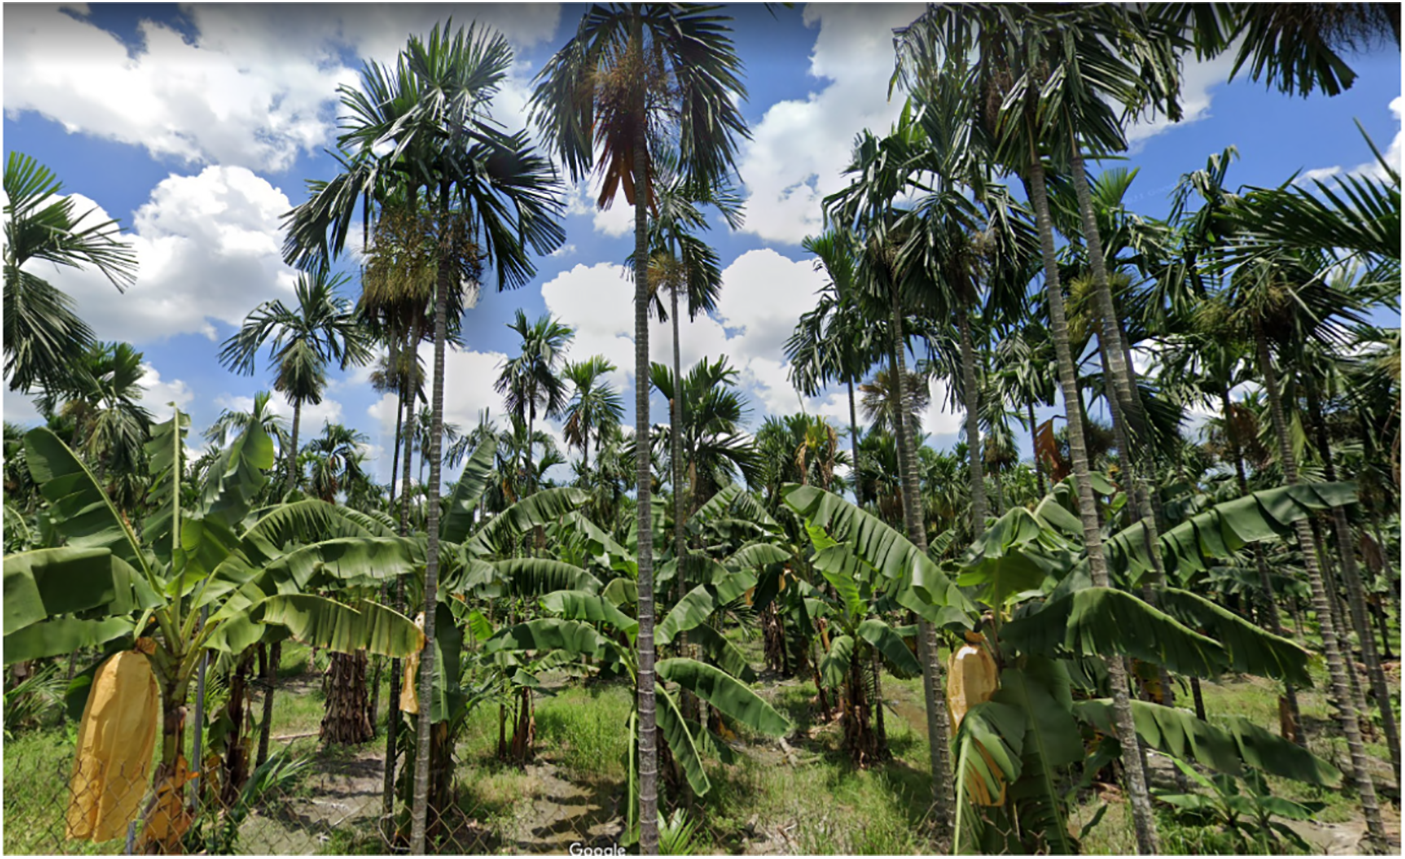
Figure 1: The mixed-layer cultivation of bananas and betel nuts within the research area
This study introduces a novel approach to crop detection in mixed-crop environments by combining the VARI with high-resolution UAV orthoimages and state-of-the-art deep learning models. Unlike previous methods that rely solely on RGB imagery, which can be affected by atmospheric conditions and lighting variability, this approach leverages VARI’s capacity to minimize atmospheric noise, enhancing vegetation differentiation. Additionally, this research is among the first to address the unique challenges of intercropped environments, specifically detecting bananas in fields with overlapping betel nut trees in Taiwan. Integrating VARI with models such as YOLOv3 improves detection accuracy and demonstrates significant robustness in handling occlusion issues common in complex agricultural landscapes. This work advances precision agriculture techniques by providing a practical, adaptable solution for small-scale, mixed-crop classification tasks, potentially benefiting crop monitoring and yield prediction in diverse farming systems.
Based on the UAV platform has become a valuable tool for collecting images and overcoming the limitations of difficult access to areas or close-range visits. In the past decade, UAV remote sensing combined with machine/deep learning can predict crop production and monitor crop health more effectively, demonstrating significant potential in various agriculture applications. For instance, Sumesh et al. [22] integrated the vegetation indices of UAV RGB images to estimate the sugarcane yield based on Object-Based Image Analysis (OBIA). Qiao et al. [23] combined UAV imagery with a deep learning model (ResNet50) to explore deep feature methods for vegetation indices, enhancing the accuracy of corn leaf area index estimation. Feng et al. [24] used a pre-trained deep learning model (ResNet18) to estimate cotton plants’ stand count and canopy size in each UAV image.
The progress of computer vision and the development of image processing techniques enable researchers to obtain revolutionary achievements in image identification. Using vegetation indices derived from RGB or multi-spectral images provides specific information on crop characteristics; it is key to enhancing the accuracy of the deep learning model. It has made significant progress in agriculture damage assessment, crop disease detection, and pest detection. For example, Yang et al. [25] adopted a Fully Convolutional Network-AlexNet and SegNet to establish a semantic segmentation model, using UAV images to calculate three vegetation indices (Excess Green Index, Excess Red Index, and Excess Green minus Excess Red Index) to identify rice lodging. Kerkech et al. [26] proposed a method based on convolutional neural networks (CNN) and color information to inspect the disease of grapes. It compared the combinations of different color spaces and vegetation indices. Wu et al. [27] used hyperspectral imaging to combine spectral characteristics, vegetation indices, and texture features to detect gray mold on strawberry leaves through three machine-learning methods.
In recent years, some studies have utilized images from different spectral bands and image processing techniques to improve the performance of crop classification. For instance, Hall et al. [28] combined the texture measurement, intensity, hue, and saturation (Hue, Intensity, and Saturation) conversion to enhance the accuracy of corn image classification up to above 94%. Sa et al. [29] performed image synthesis and preprocessing to generate RGB, color-infrared, and the Normalized Difference Vegetation Index (NDVI) separately and also used a deep neural network to classify crops and weeds. Hassanein et al. [30] converted rapeseed field RGB images from UAV to Hue Saturation Value (HSV) color spaces and then utilized the Hue channel for image segmentation. Bah et al. [31] used a convolutional neural network (CNN) and Hough transform to detect different types of crops in UAV images. Neethi et al. [32] proposed a two-step algorithm that utilizes color features (grayscale, HSV, and YCbCr) to classify mango fruit region pixels. These studies indicate that deep learning and image processing techniques can classify crops effectively, which helps acquire accurate crop information.
Deep learning methods automatically learn the features of objects at multiple levels of abstraction without relying on manually crafted features. Specifically, CNNs do not require initial feature extraction and can understand the existing important features of images automatically without manual supervision [33]. The leading architecture of CNN consists of one or more convolutional layers, pooling layers, and fully connected layers. It can generate predictive results for images or object categories through learning features. The primary role of convolutional and pooling layers is to identify patterns within input data, and then a fully connected layer is responsible for categorizing these features into relative classes. Therefore, CNN has significant advantages in advanced feature representation; it can effectively solve different computer vision problems.
One of the main tasks of computer vision applications is object detection through remote sensing techniques; it can assist farmers in achieving automated tasks of crop identification. The object detection algorithms implemented within the CNN framework have rapidly become a method to process images captured from UAVs. In recent years, to decrease manual processing and enhance the efficiency of algorithms, object detection algorithms based on CNN have emerged in deep learning methods, such as these studies: Faster RCNN [34], Mask Region-Based Convolutional Neural Network (Mask RCNN) [35], YOLO [36], SSD [37]. These object detection methods offer advantages over classical approaches in the large-scale processing ability and the automated extract feature, improving accuracy without performance overhead [38].
Object detection is automatically identifying and locating objects within an image, then annotating them with bounding boxes and categories. The process predicts bounding boxes around each object of interest in the input image based on object detection techniques. Object detection is a computer vision task that processes the target’s location and identification within images, extending into the agriculture application. For example, Xiong et al. [39] utilized the YOLOv2 model to rapidly detect mangoes in images captured by UAVs. Ampatzidis et al. [40] automatically used YOLOv2 to detect orange trees in multiple UAV images. Osco et al. [41] compared Faster RCNN and RetinaNet to estimate the numbers of citrus trees in high-density orchards from multiple spectral UAV images. Tian et al. [42] compared YOLOv3 and Faster RCNN to detect apples at different growth stages in the orchard. He et al. [43] adopted YOLOv4 to detect wheat spikes obtained from UAV platforms, which can be utilized in yield estimation. Li et al. [44] detected and located longan using the rapid and accuracy of YOLOv4 based on MobileNet. Quan et al. [45] provided an improved Faster RCNN model to detect and classify maize seedlings and weeds in complex backgrounds. Wu et al. [46] employed Faster RCNN for the detection of apple trees and growth monitoring. Kalantar et al. [47] proposed a deep learning system based on RetinaNet for individual detection and estimation of watermelons from UAV images. Therefore, to utilize resolution orthoimages to conduct crop detection, this study integrates VARI and deep learning models to automate the detection of bananas using UAV imagery.
Since various crops are planted together in some farmlands, it is not easy to utilize remote sensing techniques to conduct crop detection for farmlands in Taiwan. Especially bananas and betel nuts are often intercropped; the leaves of these two kinds of crops are similar in appearance and color, which makes them difficult to identify through images (Fig. 2). VARI considers the differences between various plants, which can be used to analysis the results of remote sensing, and to evaluate whether the observed target contains green vegetation. Unlike other plant indices, the VARI index is primarily determined by leaf area. Due to the variations in the leaves of banana and betel nut, VARI is suitable for distinguishing between these two crops. The other issue of this study is that bananas are often overshadowed by betel nuts, which require high spatial-resolution images to detect them. Hence, UAVs can collect high spatial resolution images from low altitudes, which have become the most effective tools for observing and detecting crops.
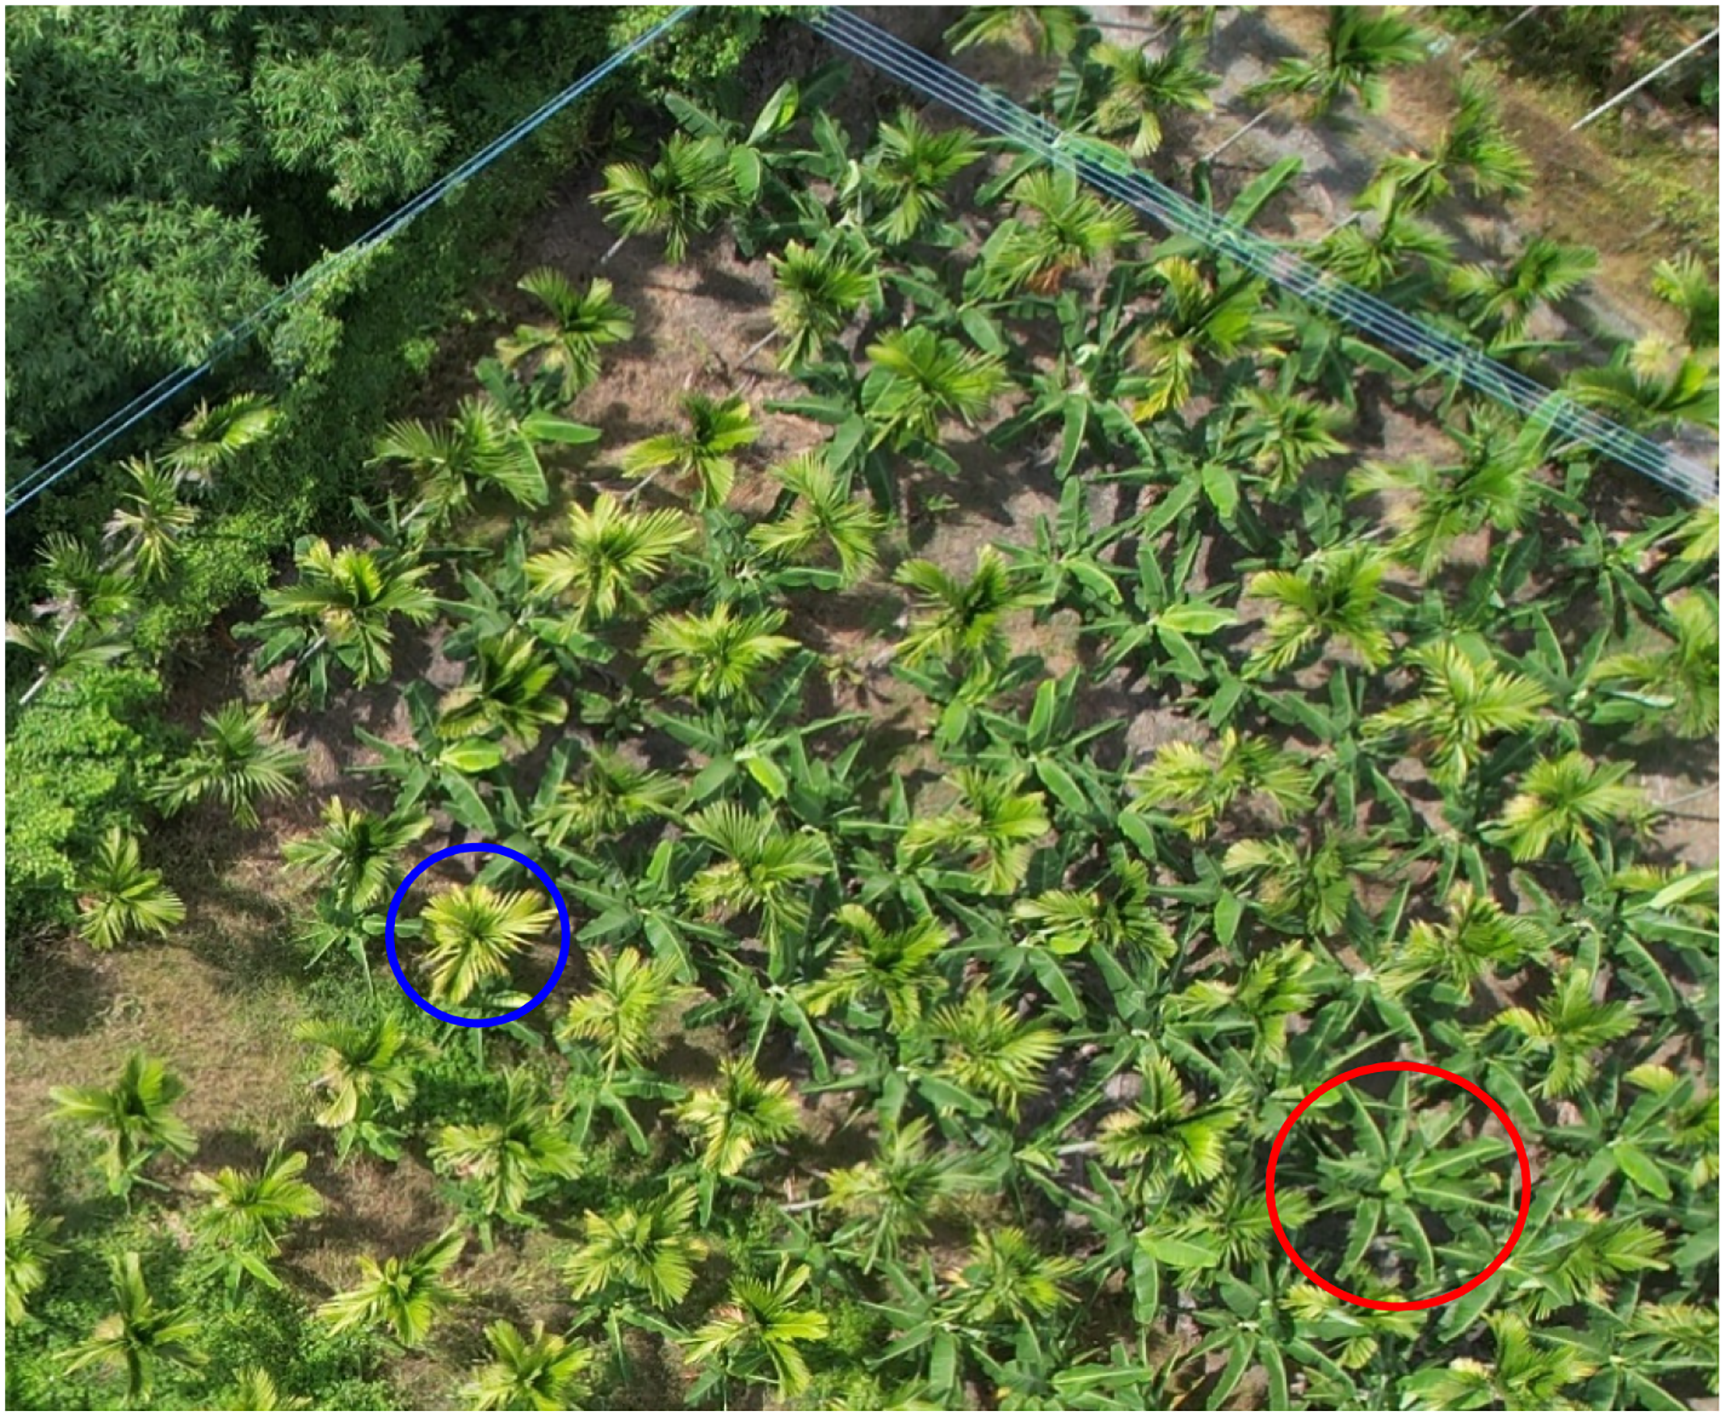
Figure 2: UAV image of a field with the red circle being a banana and the blue circle being a betel nut
3.1 Image Preprocessing of the Study Area
When selecting remote sensing data for object detection, resolution is an essential factor to consider. During aerial photography, the vehicle’s distance from the ground can affect the spatial resolution of images. Since low-altitude UAVs can acquire higher-resolution images than satellites and airplanes, this study utilizes a UAV (DJI-FC3411) to obtain RGB images; the camera has a resolution of 20 megapixels and a focal length of 8 mm. The research area has gentle terrain variations; keeping a consistent distance from the ground during UAV flights can ensure the consistency of spatial resolution.
The research area is located in Pingtung area, Taiwan, with a latitude ranging from 22°38′16″ N to 22°38′9.5″ N and a longitude ranging from 120°33′15″ E to 120°33′19″ E; the main crops of this area are bananas and betel nuts. The UAV images were captured on 16 July 2022, between 14:00 and 14:30 local time, under clear sky conditions. The images were taken in RGB spectral bands with 85% overlap and 80% side-lap setting. The automatic flight control system can keep the UAV at a consistent altitude of approximately 130 m above the ground. This makes the ground sample distance (GSD) reach 1.73 cm. GSD is the distance between the centers of pixels in measured images on the ground. It can be utilized to assess the quality of aerial images and orthoimages.
A total of 670 images were captured during this aerial mission; each image has dimensions of 5472 × 3648 pixels. The visible spectral ortho-rectified reflectance images of the aerial area can be processed through commercial software and generated ortho mosaic images with an area of approximately 32,675 square meters (Fig. 3). An ortho mosaic image is a type of raster image that results from the geometric correction and stitching of aerial photos, making the images have no distortion. The ortho mosaic image has been corrected for camera tilt and lens distortion, allowing us to accurately measure the actual distance and represent the crop distribution on the ground.
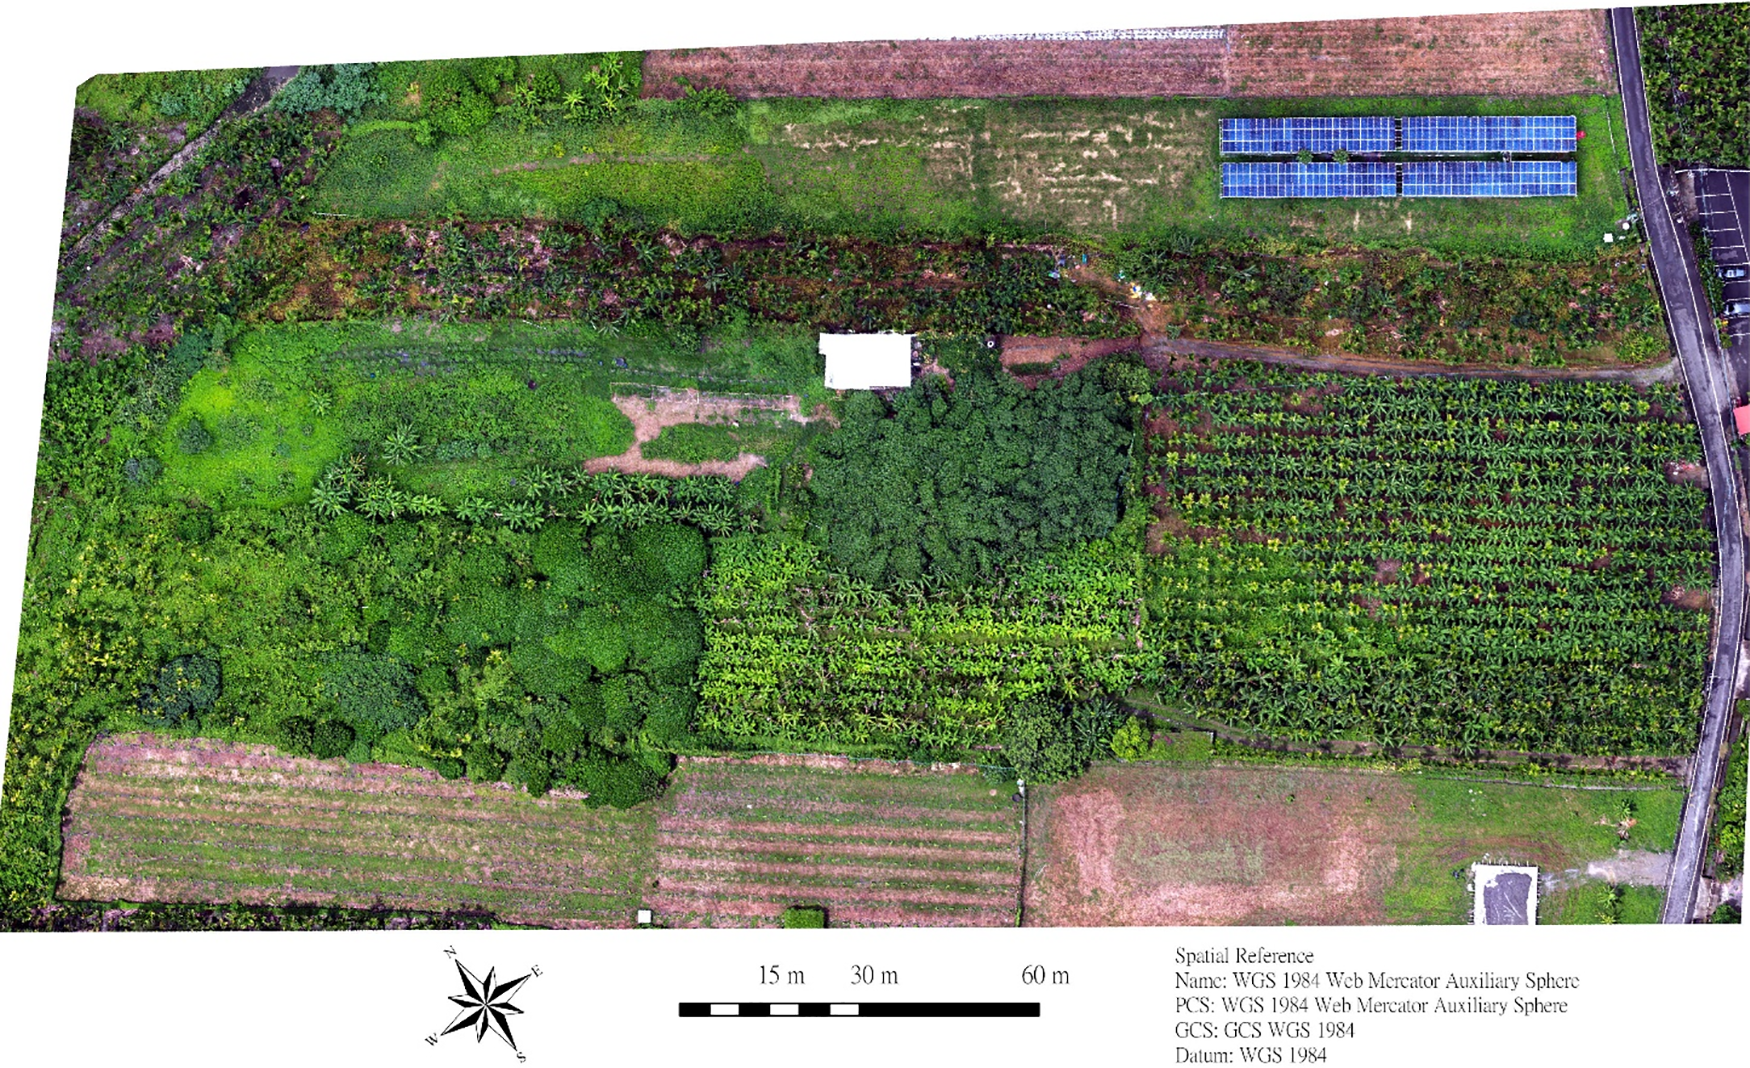
Figure 3: RGB ortho mosaic images of the research area
VARI is a method used for vegetation indices. It estimates crops’ leaf chlorophyll content and vegetation coverage by analyzing visible light bands, typically green and red. The principle of VARI is based on the spectral reflection of vegetation; in other words, the reflectance in the green and red bands is strongly correlated with vegetation coverage and leaf chlorophyll content. The VARI formula is as follows [18]:
In this formula, Green, Red, and Blue represent the reflectance in the green, red, and blue bands, respectively. A significant component of VARI is the subtraction of the blue band, which aims to reduce the influence of atmospheric effects on the indices. It seeks to enhance vegetation detection under atmospheric conditions and mitigate illumination variations. VARI assesses whether green and red bands have different values, thereby providing a reasonable estimation of multiple-leaf vegetation.
The subtraction of the blue band helps reduce the impact of atmospheric interference, particularly from elements like haze, which often affects RGB images. This enables more accurate vegetation analysis by enhancing the visibility of the green spectral band relative to the other colors. For example, consider a scenario where the green, red, and blue reflectance values for a crop pixel are 150, 100, and 50, respectively—substituting these values into the formula: VARI = (150 − 100)/(150 + 100 − 50) = 0.25. This VARI value indicates a healthy level of vegetation greenness, as the green reflectance dominates over red and blue. Such calculations provide meaningful indices that can be used to distinguish between healthy vegetation and background noise, enhancing model performance in crop detection tasks. Due to the vegetation reflecting more in visible green spectral bands than red and blue bands, VARI can still effectively distinguish between different vegetation types. Since different types of plants have different physiological and morphological characteristics, they also exhibit varying reflectance in the visible light spectrum. This results in different VARI values for other plants. Some plants might have higher chlorophyll content and thicker leaves, which can result in higher VARI values. Additionally, bananas typically have a higher green reflectance than betel nuts, making it easier to distinguish between the crops using VARI rather than RGB.
In recent years, object-detecting algorithms based on CNN represent the most advanced techniques of image processing and computer vision applications, and they have acquired significant achievements in the agricultural field. In object detection, localization refers to determining the position and size of an object in the image, while classification involves identifying the category of the designated object. Some popular deep learning object-detecting algorithms, including RCNN, Fast RCNN, Faster RCNN, SSD, and YOLO, have been proposed in various object-detecting methods over the past few years. These methods can be divided into two categories: single-stage detection and two-stage detection.
Single-stage detection usually involves conducting detection and classification directly on the images. This is done by predicting different positions in the images through windows or anchors to identify an object’s position and category. Representative algorithms for this approach are YOLO and SSD. These algorithms often achieve higher real-time detection speeds but can be more sensitive to object position and size variations. Additionally, they perform relatively weaker in some conditions, such as when objects are occluded or deformed.
On the other hand, two-stage detection first performs region proposal, where candidate object regions are extracted, then classifies and localizes the extracted region (classification prediction). This approach provides more accurate location and size information of the objects while obtaining object detection results in complex scenarios. Standard representative algorithms are RCNN, Fast RCNN, and Faster RCNN. These algorithms generally required multiple calculations, causing slower detection speeds. However, they often achieve higher object detection accuracy. In summary, single-stage detection primarily emphasizes speed and efficiency, which is suitable for scenarios with higher real-time requirements. Conversely, two-stage detection mainly seeks accuracy and stability, which is ideal for scenarios with higher standards for the accuracy of detection results.
SSD [37] is a type of single-stage detector that is more accurate than two-stage detectors with region proposals. SSD performed feature detection by running a single-pass convolutional network on the input and also utilized the concept of anchor boxes to learn the coordinates of bounding boxes. SSD added multiple feature layers to the end of the VGG16 backbone network to predict the offsets of default anchor boxes and their corresponding confidences. Besides, SSD referred to the pyramid concept of images to run feature maps of different sizes, which enabled the network to consider features of various scales and significantly improved the detection of small objects. YOLOv3 is another type of single-stage detector, which replaced the softmax function with logistic classifiers for multi-label classification and reduced computational complexity by using binary cross-entropy loss. YOLOv3 conducts three predictions for three different scales in each position, and it utilizes k-means clustering to determine anchor points. This highly efficient approach has enabled YOLOv3 to achieve better detection results in UAV imagery than its previous versions, with significant improvements in detecting small-scale objects.
Faster RCNN belongs to the two-stage detection model. It adopts a candidate region proposal network (RPN) to generate candidate boxes, enhancing detection speed and accuracy. Faster RCNN consists of two main parts: candidate region extraction and object classification. First, the RPN network conducts feature extraction of input images through a convolutional neural network. It generates candidate boxes on extracted feature figures, and it chooses an anchor from these candidate boxes. The anchor point is a predefined box; its parameters, such as dimension and aspect ratio, can be adjusted according to different data and adapted to objects of various scales and shapes. Then, the RPN network assigns scores to each candidate box to ensure whether it contains the object of interest. After that, the selected candidate boxes undergo feature extraction by a convolutional neural network, and a classifier classifies the objects in each candidate box while regressing and adjusting their position. Although Faster RCNN demonstrates excellent performance in object detection of large-scale datasets, it still faces challenges in small-scale object detection and localization [48].
This study employs YOLOv3, SSD, and Faster RCNN for crop detection despite the availability of newer YOLO versions (e.g., YOLOv5 and YOLOv6) and other advanced models. The selection of YOLOv3 was based on several factors. YOLOv3 effectively balances accuracy and computational efficiency, making it well-suited for real-time applications in agricultural settings using UAV-captured imagery. Higher YOLO versions, while potentially more accurate, generally require more excellent computational resources, which may limit their practicality for field deployment. Additionally, YOLOv3’s multi-scale prediction approach is beneficial for detecting small and intercropped plants, such as bananas and betel nuts, in layered fields. SSD and Faster RCNN were included to enable a comparative analysis of single-stage vs. two-stage detectors; SSD provides high-speed detection, while Faster RCNN offers high accuracy, albeit with increased processing time. By comparing these models, this study aims to identify the most suitable approach for detecting overlapping and occluded crop structures, offering valuable insights into model performance under varied agricultural conditions.
Fig. 4 illustrates the process used in this study for detecting banana crops from UAV images using deep learning methods and VARI, with the following steps: (1) Image Preparation: Initially, ultra-high-resolution images of the study area are captured using UAVs, and image stitching is performed to cover the entire study area. The captured images are then ortho-rectified to ensure geometric accuracy and eliminate distortions caused by flight height and angle variations. (2) Image Processing: During the image processing phase, the original RGB images are converted to VARI to highlight the green portions of different crops and reduce the impact of the background. This step enhances the detectability of banana crops in the images. (3) Model Training and Validation: The RGB and VARI image data are divided into training and validation sets for the training and testing of deep learning models. Three object detection models, namely SSD, YOLOv3, and Faster RCNN, are employed for training on the different image datasets. Each model is trained based on different image data and tested on the validation set to adjust its parameters, ensuring optimal performance. (4) Model Testing and Evaluation: Finally, various performance metrics (such as accuracy, recall, and F1 score) are used to evaluate the performance of the three algorithms in detecting banana crops using RGB and VARI images, comparing their strengths and weaknesses.
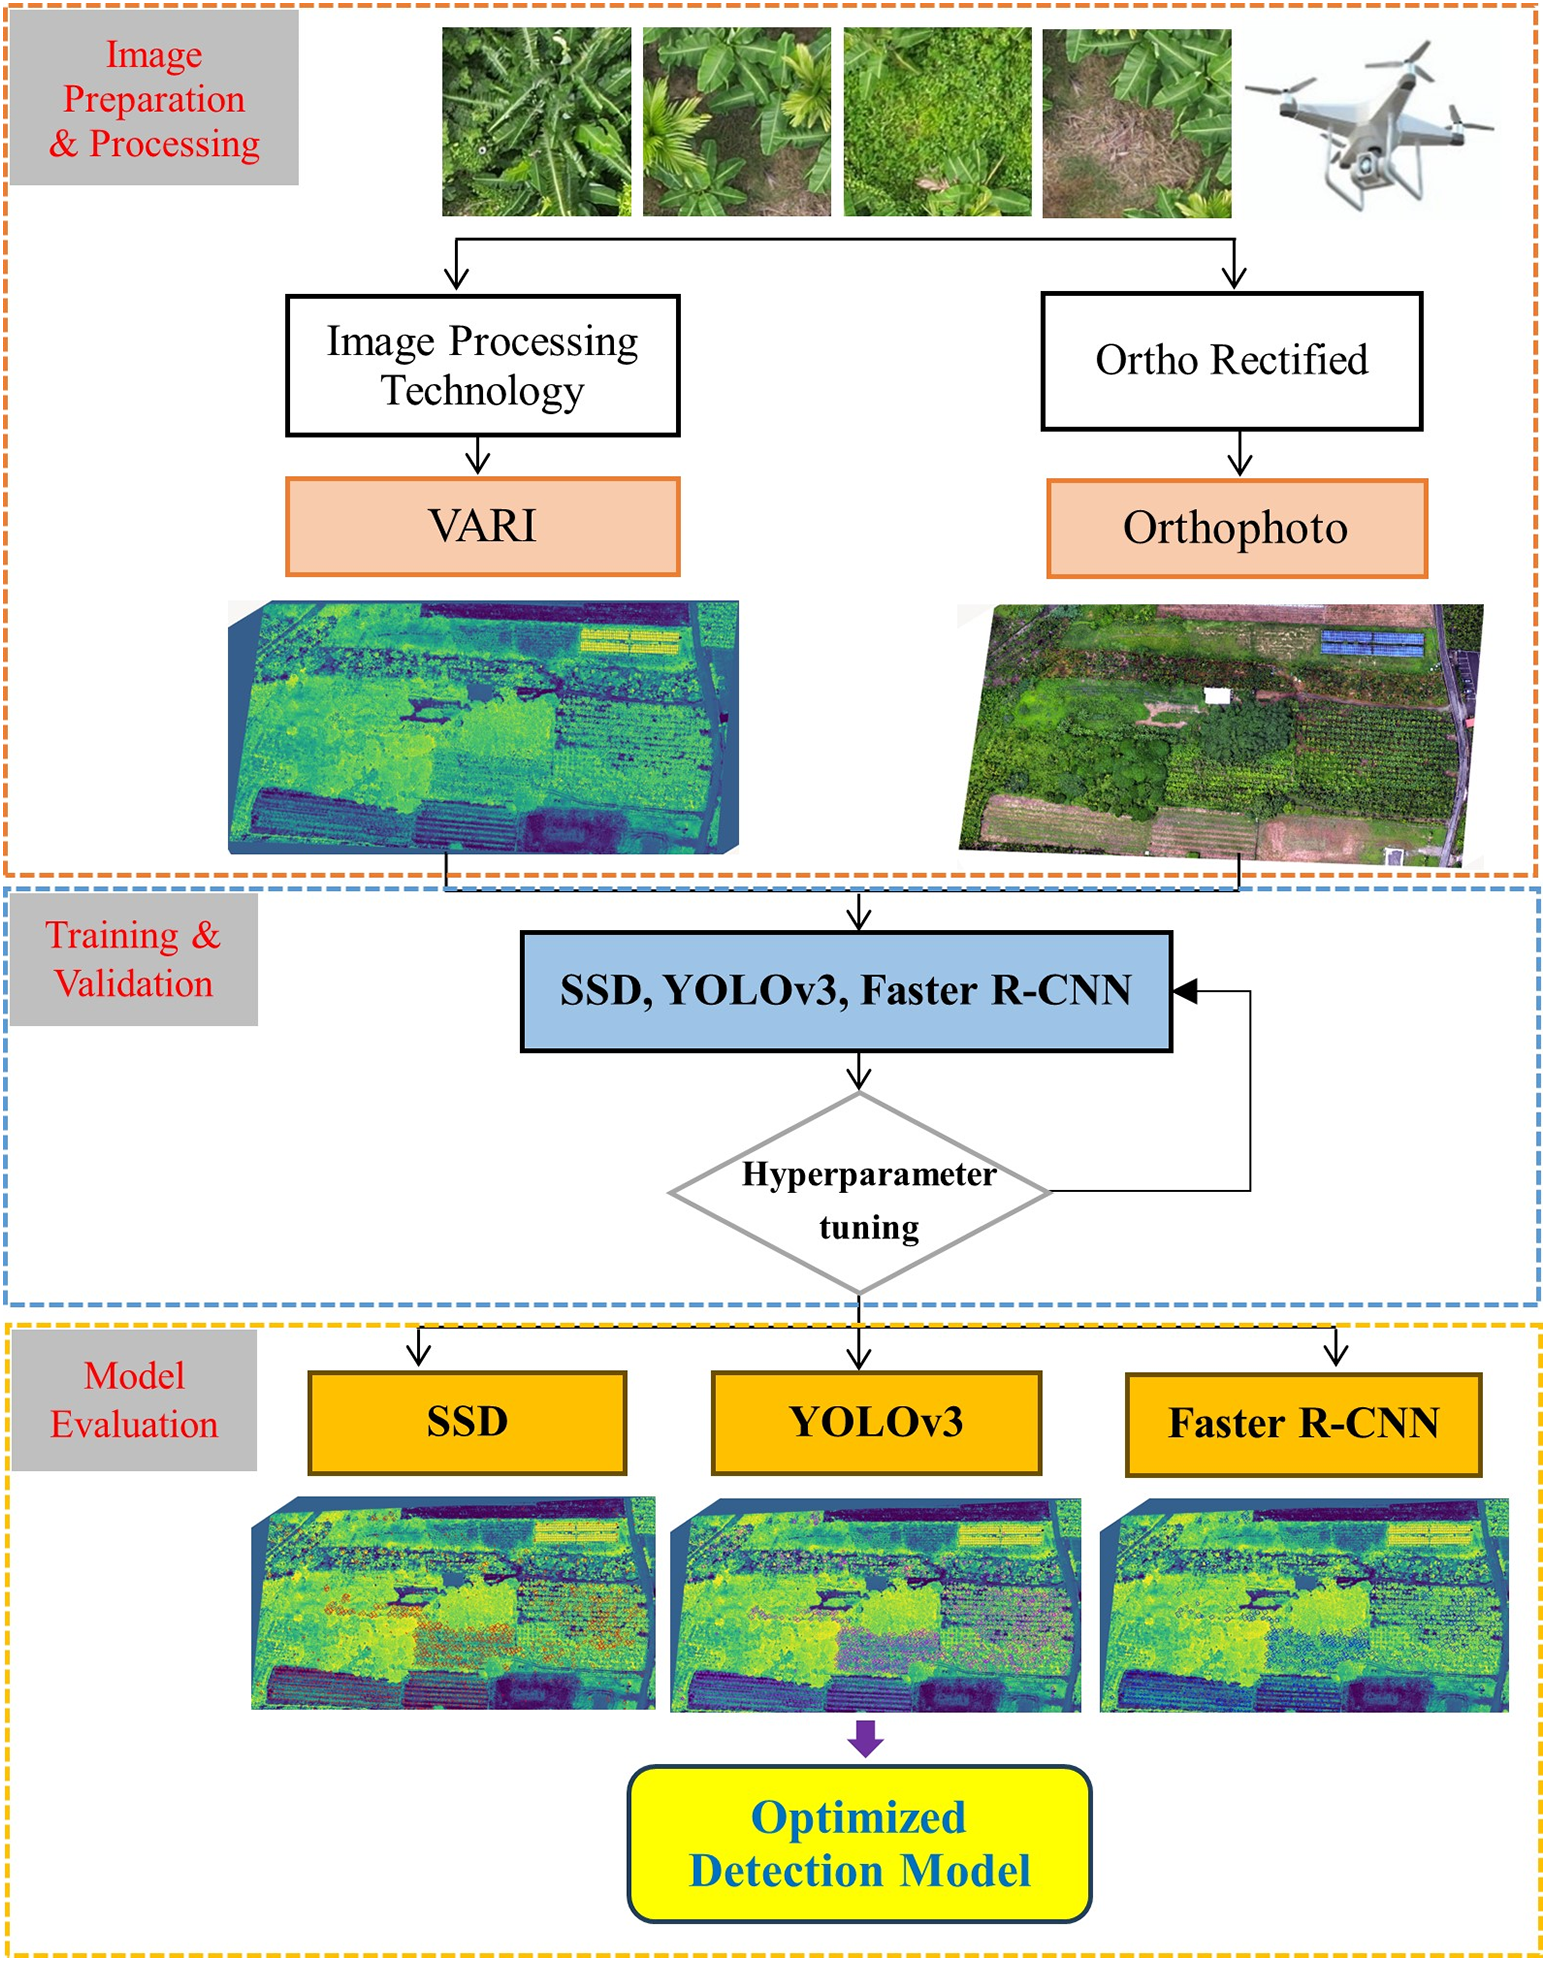
Figure 4: Main framework and workflow of this study
4 Detection Results and Analysis
4.1 Sensitivity Analysis and Algorithm Training
This study adopted three detection models: SSD, Faster RCNN, and YOLOv3. The backbone of the first two methods is ResNet34, while the last uses Darknet53. ResNet34 and Darknet53 exhibit strong performance, reasonable computational ability, and processing times. Larger data sets are commonly used for detection tasks to achieve better training results for the model. The model training images for this study are in RGB and VARI separately. The image data is randomly divided into training and testing sets; the ratio is 80% for training and 20% for testing. Data from two image types (RGB and VARI) will be used to undergo deep network training, extracting the features of different crops and estimating the ability of three models to detect banana plants.
For this study, the deep learning models SSD, YOLOv3, and Faster RCNN were configured with specific parameter values to detect banana crops in UAV images. To assess the impact of these parameters on model performance, we conducted a sensitivity analysis by varying key parameters such as learning rate, batch size, and anchor box scales for each model. Analysis indicates that learning rate, batch size, and anchor box size affect the models’ performance (Average Precision, AP) to varying degrees (Table 1). Specifically, the learning rate has the most substantial impact: reducing it from 0.01 to 0.001 significantly improves AP across models, with YOLOv3 showing a notable increase from 0.53 to 0.71 or 0.75 and Faster RCNN reaching AP values of 0.58 and 0.66 under similar conditions (Fig. 5). Batch size also plays an important role, especially for YOLOv3 and Faster RCNN; increasing batch size from 8 to 16 yields higher AP scores, with YOLOv3 achieving its highest AP of 0.75 when batch size is set to 16 alongside a learning rate of 0.001. In contrast, anchor box size has a less pronounced effect on AP. Generally, smaller 16 × 16 anchor boxes slightly outperform the 32 × 32 configuration, which benefits the detection of finer object details, though the impact is modest compared to learning rate and batch size adjustments. Learning rate has the most significant influence on model performance, followed by batch size, with anchor box size being relatively less impactful (Fig. 6).

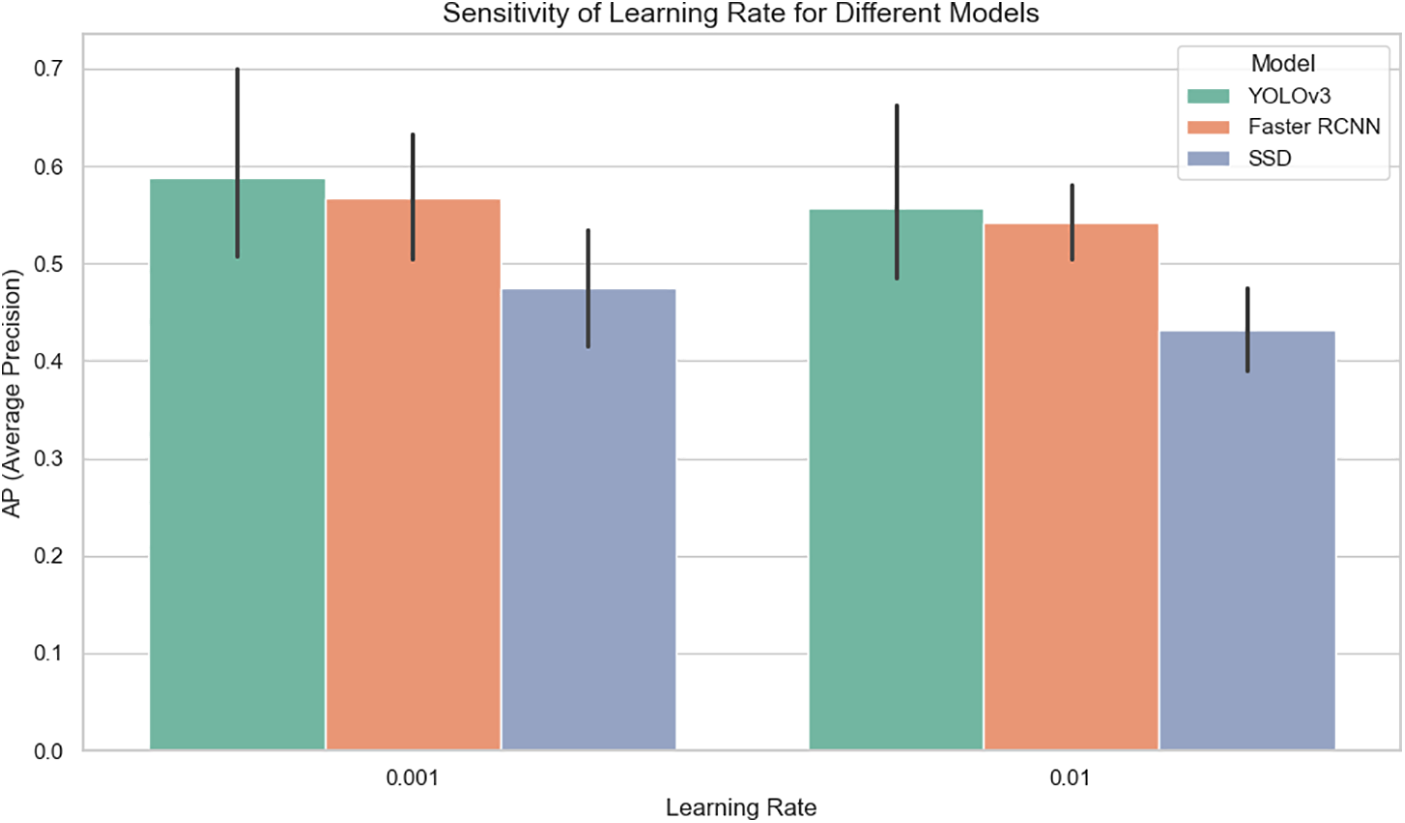
Figure 5: Sensitivity analysis results of detection models for learning rates

Figure 6: Sensitivity analysis of three detection models
This study employs three deep-learning models for banana detection: SSD, YOLOv3, and Faster RCNN. For SSD, key parameters include anchor boxes with varying aspect ratios and scales, a learning rate of 0.001 with exponential decay, a batch size of 8, and the Adam optimizer. Non-maximum suppression (NMS) is applied with an IoU threshold of 0.5. YOLOv3 uses anchor boxes predefined based on the distribution of object sizes, a learning rate of 0.001 with cosine annealing decay, a batch size of 16, and an input size of 256 × 256 pixels. NMS is applied with an IoU threshold of 0.5. For Faster RCNN, anchor box scales are adjusted to fit banana object sizes, with a learning rate of 0.001 and stepwise decay, a batch size of 16, and a RoI pooling of 7 × 7. NMS is also applied with an IoU threshold of 0.5.
The entire data set passed through a neural network forward and backward is called an epoch. Each epoch has a loss value, which indicates the error between the prediction of models and the actual categories. Once the predetermined number of epochs is reached, the weights in the network are updated using the gradient descent method. The final goal of the train set is to minimize the error. Fig. 7 indicates the relationship between loss and the batches processed in the model for this study. Despite using different numbers of training epochs, it was demonstrated that the training results were generally covered after around 1000 epochs, with the six training models taking approximately 11 to 24 min. The training and validation loss significantly decreases without any signs of overfitting, demonstrating that the network architecture proposed is qualified. Among these, the convergence trends of YOLOv3 and validation loss are the most consistent, followed by SSD, while Faster RCNN exhibits less convergence.

Figure 7: The convergence process of the loss for six models
4.2 Analysis of Detection Results
For this study, 2542 images were collected. The data were divided into a training set of 2034 images and a test set of 508. The average processing time is approximately 1009.2 s running on an NVIDIA Quadro RTX 6000 24 GB graphics processing unit (GPU). Fig. 8a,b displays the results of bananas detection on SSD separately from RGB and VARI images. Fig. 8c presents the overlay scenario of banana detection using two types of images. The VARI image performs better than the RGB image. SSD detected 329 bananas correctly in RGB and 698 in VARI images, respectively. Fig. 9 shows that YOLOv3 accurately detects the most bananas in VARI images, with a True Positive count of 1094. However, Faster RCNN accurately detects the fewest bananas in RGB images, with only 136 true positives, and the banana seedlings are almost undetectable (Fig. 10). The results of this study indicate that the three deep learning models have higher accuracy in VARI than RGB (Table 2).

Figure 8: The detection results of SSD on RGB and VARI

Figure 9: The detection results of YOLOv3 on RGB and VARI

Figure 10: The detection results of Faster RCNN on RGB and VARI

The Intersection over Union (IoU) measures object detection accuracy by calculating the intersection (overlap) area ratio to the union area of two bounding boxes. It assesses how well the predicted results align with the ground truth (GT). In typical prediction tasks, an IoU of 0.5 is commonly used. A single bounding box detection is considered successful when the bounding box calculated IoU > 0.5. In VARI images, the intersected area of YOLOv3 detecting bounding boxes and GT is 727 m2, the union area is 927 m2, and the average IoU is 78.39% (highest). In RGB images, the intersected area of Faster RCNN detecting bounding boxes and GT is 171 m2, the union area is 845 m2, and the average IoU is 20.3% (lowest). YOLOv3 demonstrates the lowest missed detection rate in VARI images, with the False Negative being 0. In contrast, Faster RCNN demonstrates the highest missed detection rate in RGB images; the False Negative is 913. SSD demonstrates the highest missed detection rate in RGB images; the False Positive is 642.
The YOLOv3 model performs better for banana detection than VARI; the Precision is 73.77%, the Recall is 100%, and the training time is 868 s. All three models exhibit better performance for banana detection in VARI than in RGB. Its results indicate that after the image processing of VARI, the improvement in the Precision of the model is 10%–22%, the Recall is 27%–35%, the F1 score is 22%–30%, and the training time decreased 95–371 s (Table 3).

Overall, YOLOv3 demonstrates the advantage of detecting banana crops on RGB and VARI images. The median Precision is 65.39%, the median Recall is 85.46%, the median F1 score is 74.0%, and the median IoU is 64.35% (Fig. 11). The medians of each evaluation metric for YOLOv3 are nearly higher than those for SSD and Faster RCNN. Although Faster RCNN has the highest median Precision at 66.24%, its median values of other metrics are all less than 40%, and there is significant variance among the four metrics. The median values of all evaluation metrics for SSD are all less than 50%, and the interquartile range (IQR) of the metrics is extensive, which indicates its inadequate ability to detect banana crops.

Figure 11: The evaluation metric values of banana crop detecting for three models
This study applied SSD, YOLOv3, and Faster RCNN to evaluate their effectiveness in detecting bananas in complex intercropped environments. Although SSD and YOLOv3 are well-known for their efficiency in object detection, their performance was comparatively lower in this specific application, which can be attributed to the nature of the crop arrangement and the field background conditions. As a single-stage detector, SSD operates with a high detection speed but can struggle with precision in detecting small or overlapping objects, especially in cluttered agricultural environments where crop features are intermixed. YOLOv3, while also a single-stage detector, performs three-scale predictions, which enhances its ability to detect small-scale objects in mixed settings. However, its reliance on RGB imagery can result in lower accuracy due to interference from shadows and similar colors between overlapping crops. The approach integrating the VARI with deep learning models demonstrated better accuracy. VARI enhances the contrast between vegetation and background noise, effectively mitigating the limitations posed by atmospheric and lighting conditions. This preprocessing step provided models like YOLOv3 with higher-quality input data, enabling more accurate feature extraction and detection, particularly in cases of overlapping and occluded banana plants. The results highlight that combining high-resolution UAV imagery and VARI processing enables deep learning models to perform more reliably in complex agricultural landscapes, where traditional RGB-based models may fall short.
4.3 Comparison with State-of-the-Art
Numerous studies have recently applied deep learning methods to detect crop pests, diseases, and fruits. Image data for crop leaf diseases and fruit detection are mostly captured using digital cameras, while UAV imagery is widely used for crop plant counting. To compare the performance of YOLOv3 with other deep learning-based object detection methods in crop detection within this study, nine research papers published between 2019 and 2024 related to crop detection were reviewed. The research topics or keywords focused on object detection, crops, and UAV imagery. Although all these studies used UAV images, there are significant variations in the specifications of UAV sensors and differences in UAV flight altitudes, weather conditions during image capture, and ground conditions. These factors influence crop detection effectiveness, making comparative analysis more complex. Additionally, different models perform differently across crop types, reflecting that each crop’s morphological characteristics may impact the model’s detection accuracy, necessitating caution in interpreting these results. Therefore, the analysis is limited to describing the performance of various models for crop detection.
Table 4 presents the effectiveness of different deep learning algorithms applied in various crop detection tasks, covering models such as Faster RCNN, RetinaNet, YOLO (v3, v4, v5), and Mask R-CNN, each detecting different crop characteristics, diseases, and conditions. Neupane et al. [49] achieved a precision of 1.000 using Faster RCNN for detecting banana plants, though the recall was lower, indicating the model’s effectiveness in exact scenarios. Similarly, Pan et al. [50] used Faster RCNN to detect sugarcane seedlings, achieving a mean Average Precision (mAP) of 0.849, highlighting the model’s suitability for fine recognition in complex backgrounds. Mora et al. [51] detected yellow leaf disease in bananas, achieving an F1 score of 0.744, indicating the potential of Faster RCNN in disease detection. Faster RCNN is widely used for object detection tasks due to its high precision, often accompanied by longer processing times.

For RetinaNet, Selvaraj et al. [52] applied it to banana disease detection, achieving a precision of 0.670 and a recall of 0.740, demonstrating the model’s effectiveness in detecting small objects in noisy backgrounds. Ghosal et al. [53] used RetinaNet for sorghum detection, achieving a mAP of 0.94, validating its adaptability to noise-prone crops. The YOLO series (YOLOv3, YOLOv4, YOLOv5) is the most widely used in real-time agricultural detection scenarios. Oh et al. [54] employed YOLOv3 to detect cotton seedlings, achieving an F1 score ranging from 0.42 to 0.79, showing its practicality for large-field monitoring environments. YOLOv4 demonstrated excellent accuracy in detecting wax apple trees, with a precision of 0.901 and a recall of 0.960 [55]. YOLOv5, however, was relatively weaker for detecting new leaves in maize, with a mAP of 0.540, a precision of 0.688, and a recall of 0.5 [56]. Finally, Machefer et al. used Mask R-CNN for potato plant detection, achieving an Average Precision (AP) of 0.781, with superior boundary segmentation compared to detection accuracy [57]. These studies illustrate that selecting the appropriate model is crucial for successful detection across various crops and application scenarios, and the results proposed by the authors support the diversity and suitability of algorithm choices based on different crop characteristics.
The approach is based on established principles of deep learning for object detection and localization. Yet, it differs significantly from traditional object detection tasks performed on publicly available datasets like ImageNet. Due to the limited availability of annotated agricultural imagery, specific crop data must be captured independently. Compared to other standard image datasets, many agricultural images (e.g., in the study area) exhibit higher levels of occlusion and background clutter, making it easier for objects of interest to be confused with background elements. Additionally, environmental variations (such as cloudy skies or windy weather) significantly affect crop images, further complicating processing. The image samples are also sensitive to imaging angles, field conditions, and plant morphology. Consequently, deep learning models for agricultural applications require high robustness. Given the complexity of data in the study area, the model integrates VARI, demonstrating robustness and applicability in detecting banana crops.
In the past, most crop monitoring and surveys used satellites and airplanes as platforms and classic machine learning as the processing technique. The low spatial/temporal resolution causes harmful effects on data quality, and different weather conditions can make data collection very challenging. These limitations could potentially reduce the performance of algorithms, thereby leading to incorrect crop classification. Utilizing new tools and techniques for automatically classifying crops is the most crucial factor in driving the transformation of smart agriculture. In recent years, UAVs have emerged as advantageous tools for obtaining images with extremely high spatial resolution, which can collect data in the target area. Therefore, utilizing the calibration of UAV aerial images and their orthorectified mosaic after stitching in agriculture survey applications offers more advantages than traditional satellite images.
UAVs have become a new, effective remote sensing platform that can provide valuable data through their carried sensors. However, in addition to the occlusion problem of crops layered planting, some similar crops are difficult to distinguish, which requires the integration of image processing techniques and deep learning for effective detection. Hence, this study utilizes high spatial images acquired from UAV aerial photography to compare the detection capabilities of three deep learning models on both RGB and VARI images in the mixed planting area of bananas and betel nuts in the Pingtung region of Taiwan. The results indicate that SSD, YOLOv3, and Faster RCNN perform better in VARI images than in RGB images for banana detection. Among these, the YOLOv3 model exhibits the best performance in VARI for banana detection. The results of this study indicate that after the image processing using the VARI, the model’s performance improves by an average of 10%~35%, highlighting the significance of VARI image processing techniques in enhancing the accuracy and speed of crop classification.
In the future, there will be a continued focus on developing image analysis and process systems through deep learning and enhancing the computational capabilities of spectral classification, distinct crop identification, and texture classification for UAN images. Furthermore, this will provide additional assistance to professionals in crop area estimation and crop yield prediction, which can effectively manage agriculture and crop detection.
Acknowledgement: This research was partially supported by the GPU (NVIDIA Quadro RTX 6000 24 GB) and UAV (DJI-FC3411) from the ROC Naval Academy.
Funding Statement: The authors received no specific funding for this Study.
Author Contributions: The authors confirm their contribution to the paper as follows: Yu-Jen Chung: Study design and supervision. Ching-Lung Fan: Drafted the manuscript, performed data analysis and interpretation, and revised the manuscript. All authors reviewed the results and approved the final version of the manuscript.
Availability of Data and Materials: The data that support the findings of this study are available from the corresponding author upon reasonable request.
Ethics Approval: Not applicable.
Conflicts of Interest: The authors declare no conflicts of interest to report regarding the present study.
References
1. Song XP, Li H, Potapov P, Hansen MC. Annual 30 m soybean yield mapping in Brazil using long-term satellite observations, climate data and machine learning. Agric for Meteorol. 2022;326(219):109186. doi:10.1016/j.agrformet.2022.109186. [Google Scholar] [CrossRef]
2. Kussul N, Lavreniuk M, Skakun S, Shelestov A. Deep learning classification of land cover and crop types using remote sensing data. IEEE Geosci Remote Sens Lett. 2017 May;14(5):778–82. doi:10.1109/LGRS.2017.2681128. [Google Scholar] [CrossRef]
3. Liu Y, Zhang H, Cui Z, Lei K, Zuo Y, Wang J, et al. Very high resolution images and superpixel-enhanced deep neural forest promote urban tree canopy detection. Remote Sens. 2023;15(2):519. doi:10.3390/rs15020519. [Google Scholar] [CrossRef]
4. Davies SN, Lai LW, Chua MH. Seen from above: the theoretical future of aerial photos in land use, environmental and planning study. Land Use Policy. 2018;78(1):19–28. doi:10.1016/j.landusepol.2018.06.036. [Google Scholar] [CrossRef]
5. Böhler JE, Schaepman ME, Kneubühler M. Crop classification in a heterogeneous arable landscape using uncalibrated UAV data. Remote Sens. 2018;10(8):1282. doi:10.3390/rs10081282. [Google Scholar] [CrossRef]
6. Avneri A, Aharon S, Brook A, Atsmon G, Smirnov E, Sadeh R, et al. UAS-based imaging for prediction of chickpea crop biophysical parameters and yield. Comput Electron Agric. 2023;205(1–2):107581. doi:10.1016/j.compag.2022.107581. [Google Scholar] [CrossRef]
7. López-García P, Ortega JF, Pérez-Álvarez EP, Moreno MA, Ramírez JM, Intrigliolo DS, et al. Yield estimations in a vineyard based on high-resolution spatial imagery acquired by a UAV. Biosyst Eng. 2022;224(6):227–45. doi:10.1016/j.biosystemseng.2022.10.015. [Google Scholar] [CrossRef]
8. Zhou X, Zheng HB, Xu XQ, He JY, Ge XK, Yao X, et al. Predicting grain yield in rice using multi-temporal vegetation indices from UAV-based multispectral and digital imagery. ISPRS J Photogramm Remote Sens. 2017;130(11):246–55. doi:10.1016/j.isprsjprs.2017.05.003. [Google Scholar] [CrossRef]
9. Bhandari M, Ibrahim AM, Xue Q, Jung J, Chang A, Rudd JC, et al. Assessing winter wheat foliage disease severity using aerial imagery acquired from small unmanned aerial vehicle (UAV). Comput Electron Agric. 2020;176(6):105665. doi:10.1016/j.compag.2020.105665. [Google Scholar] [CrossRef]
10. Su J, Liu C, Coombes M, Hu X, Wang C, Xu X, et al. Wheat yellow rust monitoring by learning from multispectral UAV aerial imagery. Comput Electron Agric. 2018;155(6):157–66. doi:10.1016/j.compag.2018.10.017. [Google Scholar] [CrossRef]
11. Liu T, Li R, Zhong X, Jiang M, Jin X, Zhou P, et al. Estimates of rice lodging using indices derived from UAV visible and thermal infrared images. Agric for Meteorol. 2018;252:144–54. doi:10.1016/j.agrformet.2018.01.021. [Google Scholar] [CrossRef]
12. Zhang D, Ding Y, Chen P, Zhang X, Pan Z, Liang D. Automatic extraction of wheat lodging area based on transfer learning method and Deeplabv3+ network. Comput Electron Agric. 2020;179:105845. doi:10.1016/j.compag.2020.105845. [Google Scholar] [CrossRef]
13. Shu M, Bai K, Meng L, Yang X, Li B, Ma Y. Assessing maize lodging severity using multitemporal UAV-based digital images. Eur J Agron. 2023;144(2):126754. doi:10.1016/j.eja.2023.126754. [Google Scholar] [CrossRef]
14. Bouguettaya A, Zarzour H, Kechida A, Taberkit AM. Deep learning techniques to classify agricultural crops through UAV imagery: a review. Neural Comput Appl. 2022;34(12):9511–36. doi:10.1007/s00521-022-07104-9. [Google Scholar] [PubMed] [CrossRef]
15. Zhong Y, Hu X, Luo C, Wang X, Zhao J, Zhang L. WHU-Hi: UAV-borne hyperspectral with high spatial resolution (H2) benchmark datasets and classifier for precise crop identification based on deep convolutional neural network with CRF. Remote Sens Environ. 2020;250:112012. [Google Scholar]
16. Csillik O, Cherbini J, Johnson R, Lyons A, Kelly M. Identification of citrus trees from unmanned aerial vehicle imagery using convolutional neural networks. Drones. 2018;2(4):39. doi:10.3390/drones2040039. [Google Scholar] [CrossRef]
17. Lu Y, Young S. A survey of public datasets for computer vision tasks in precision agriculture. Comput Electron Agric. 2020;178(11):105760. doi:10.1016/j.compag.2020.105760. [Google Scholar] [CrossRef]
18. Gitelson AA, Kaufman YJ, Stark R, Rundquist D. Novel algorithms for remote estimation of vegetation fraction. Remote Sens Environ. 2002;80(1):76–87. doi:10.1016/S0034-4257(01)00289-9. [Google Scholar] [CrossRef]
19. Ballesteros R, Moreno MA, Barroso F, González-Gómez L, Ortega JF. Assessment of maize growth and development with high-and medium-resolution remote sensing products. Agronomy. 2021;11(5):940. doi:10.3390/agronomy11050940. [Google Scholar] [CrossRef]
20. Lobell DB. The use of satellite data for crop yield gap analysis. Field Crop Res. 2013;143:56–64. doi:10.1016/j.fcr.2012.08.008. [Google Scholar] [CrossRef]
21. Ballesteros R, Ortega JF, Hernandez D, Campo A, Moreno MA. Combined use of agro-climatic and very high-resolution remote sensing information for crop monitoring. Int J Appl Earth Obs Geoinf. 2018;72(2):66–75. doi:10.1016/j.jag.2018.05.019. [Google Scholar] [CrossRef]
22. Sumesh KC, Ninsawat S, Som-ard J. Integration of RGB-based vegetation index, crop surface model and object-based image analysis approach for sugarcane yield estimation using unmanned aerial vehicle. Comput Electron Agric. 2021;180:105903. doi:10.1016/j.compag.2020.105903. [Google Scholar] [CrossRef]
23. Qiao L, Zhao R, Tang W, An L, Sun H, Li M, et al. Estimating maize LAI by exploring deep features of vegetation index map from UAV multispectral images. Field Crops Res. 2022;289:108739. doi:10.1016/j.fcr.2022.108739. [Google Scholar] [CrossRef]
24. Feng A, Zhou J, Vories E, Sudduth KA. Evaluation of cotton emergence using UAV-based imagery and deep learning. Comput Electron Agric. 2020;177:105711. doi:10.1016/j.compag.2020.105711. [Google Scholar] [CrossRef]
25. Yang MD, Tseng HH, Hsu YC, Tsai HP. Semantic segmentation using deep learning with vegetation indices for rice lodging identification in multi-date UAV visible images. Remote Sens. 2020;12(4):633. doi:10.3390/rs12040633. [Google Scholar] [CrossRef]
26. Kerkech M, Hafiane A, Canals R. Deep learning approach with colorimetric spaces and vegetation indices for vine diseases detection in UAV images. Comput Electron Agric. 2018;155:237–43. doi:10.1016/j.compag.2018.10.006. [Google Scholar] [CrossRef]
27. Wu G, Fang Y, Jiang Q, Cui M, Li N, Ou Y, et al. Early identification of strawberry leaves disease utilizing hyperspectral imaging combing with spectral features, multiple vegetation indices and textural features. Comput Electron Agric. 2023;204(2):107553. doi:10.1016/j.compag.2022.107553. [Google Scholar] [CrossRef]
28. Hall O, Dahlin S, Marstorp H, Archila Bustos MF, Öborn I, Jirström M. Classification of maize in complex smallholder farming systems using UAV imagery. Drones. 2018;2(3):22. doi:10.3390/drones2030022. [Google Scholar] [CrossRef]
29. Sa I, Popović M, Khanna R, Chen Z, Lottes P, Liebisch F, et al. WeedMap: a large-scale semantic weed mapping framework using aerial multispectral imaging and deep neural network for precision farming. Remote Sens. 2018;10(9):1423. doi:10.3390/rs10091423. [Google Scholar] [CrossRef]
30. Hassanein M, Khedr M, El-Sheimy N. Crop row detection procedure using low-cost UAV imagery system. ISPRS J Photogramm Remote Sens Spatial Inf Sci. 2019;42:349–56. doi:10.5194/isprs-archives-XLII-3-W6-349-2019. [Google Scholar] [CrossRef]
31. Bah MD, Hafiane A, Canals R. CRowNet: deep network for crop row detection in UAV images. IEEE Access. 2019;8:5189–200. doi:10.1109/ACCESS.2019.2960873. [Google Scholar] [CrossRef]
32. Neethi MV, Kiran AG, Tiwari H. Intelligent mango canopies yield estimation using machine vision. SN Comput Sci. 2023;4(2):171. doi:10.1007/s42979-022-01602-2. [Google Scholar] [CrossRef]
33. Alzubaidi L, Zhang J, Humaidi AJ, Al-Dujaili A, Duan Y, Al-Shamma O, et al. Review of deep learning: concepts, CNN architectures, challenges, applications, future directions. J Big Data. 2021;8(1):53. doi:10.1186/s40537-021-00444-8. [Google Scholar] [PubMed] [CrossRef]
34. Ren S, He K, Girshick R, Sun J. Faster R-CNN: towards real-time object detection with region proposal networks. Adv Neural Inf Process Syst. 2015;28:91–9. doi:10.48550/arXiv.1506.01497. [Google Scholar] [CrossRef]
35. He K, Gkioxari G, Dollár P, Girshick R. Mask R-CNN. In: Proceedings of IEEE International Conference on Computer Vision; New Jersey, NY, USA: IEEE; 2017. p. 2961–9. doi:10.1109/ICCV.2017.322 [Google Scholar] [CrossRef]
36. Redmon J, Divvala S, Girshick R, Farhadi A. You only look once: unified, real-time object detection. In: Proceedings of IEEE Conference on Computer Vision and Pattern Recognition; New Jersey, NY, USA: IEEE; 2016. p. 779–88. doi:10.1109/CVPR.2016.91 [Google Scholar] [CrossRef]
37. Liu W, Anguelov D, Erhan D, Szegedy C, Reed S, Fu CY, et al. SSD: single shot multibox detector. Proc Eur Conf Comput Vis. 2016;9905:21–37. doi:10.1007/978-3-319-46448-0_2. [Google Scholar] [CrossRef]
38. Mittal P, Singh R, Sharma A. Deep learning-based object detection in low-altitude UAV datasets: a survey. Image Vis Comput. 2020;104(3):104046. doi:10.1016/j.imavis.2020.104046. [Google Scholar] [CrossRef]
39. Xiong J, Liu Z, Chen S, Liu B, Zheng Z, Zhong Z, et al. Visual detection of green mangoes by an unmanned aerial vehicle in orchards based on a deep learning method. Biosyst Eng. 2020;194(4):261–72. doi:10.1016/j.biosystemseng.2020.04.006. [Google Scholar] [CrossRef]
40. Ampatzidis Y, Partel V. UAV-based high throughput phenotyping in citrus utilizing multispectral imaging and artificial intelligence. Remote Sens. 2019;11(4):410. doi:10.3390/rs11040410. [Google Scholar] [CrossRef]
41. Osco LP, De Arruda MDS, Junior JM, Da Silva NB, Ramos APM, Moryia ÉAS, et al. A convolutional neural network approach for counting and geolocating citrus-trees in UAV multispectral imagery. ISPRS J Photogramm Remote Sens. 2020;160(4):97–106. doi:10.1016/j.isprsjprs.2019.12.010. [Google Scholar] [CrossRef]
42. Tian Y, Yang G, Wang Z, Wang H, Li E, Liang Z. Apple detection during different growth stages in orchards using the improved YOLO-V3 model. Comput Electron Agric. 2019;157:417–26. doi:10.1016/j.compag.2019.01.012. [Google Scholar] [CrossRef]
43. He MX, Hao P, Xin YZ. A robust method for wheatear detection using UAV in natural scenes. IEEE Access. 2020;8:189043–53. doi:10.1109/ACCESS.2020.3031896. [Google Scholar] [CrossRef]
44. Li D, Sun X, Elkhouchlaa H, Jia Y, Yao Z, Lin P, et al. Fast detection and location of longan fruits using UAV images. Comput Electron Agric. 2021;190(3&4):106465. doi:10.1016/j.compag.2021.106465. [Google Scholar] [CrossRef]
45. Quan L, Feng H, Lv Y, Wang Q, Zhang C, Liu J, et al. Maize seedling detection under different growth stages and complex field environments based on an improved Faster R-CNN. Biosyst Eng. 2019;184(1):1–23. doi:10.1016/j.biosystemseng.2019.05.002. [Google Scholar] [CrossRef]
46. Wu J, Yang G, Yang H, Zhu Y, Li Z, Lei L, et al. Extracting apple tree crown information from remote imagery using deep learning. Comput Electron Agric. 2020;174(4):105504. doi:10.1016/j.compag.2020.105504. [Google Scholar] [CrossRef]
47. Kalantar A, Edan Y, Gur A, Klapp I. A deep learning system for single and overall weight estimation of melons using unmanned aerial vehicle images. Comput Electron Agric. 2020;178(5):105748. doi:10.1016/j.compag.2020.105748. [Google Scholar] [CrossRef]
48. Zhao ZQ, Zheng P, Xu ST, Wu X. Object detection with deep learning: a review. IEEE Trans Neural Netw Learn Syst. 2019;30(11):3212–32. doi:10.1109/TNNLS.2018.2876865. [Google Scholar] [PubMed] [CrossRef]
49. Neupane B, Horanont T, Hung ND. Deep learning-based banana plant detection and counting using high-resolution red-green-blue (RGB) images collected from unmanned aerial vehicle (UAV). PLoS One. 2019;14(10):e0223906. doi:10.1371/journal.pone.0223906. [Google Scholar] [PubMed] [CrossRef]
50. Pan Y, Zhu N, Ding L, Li X, Goh HH, Han C, et al. Identification and counting of sugarcane seedlings in the field using improved faster R-CNN. Remote Sens. 2022;14(22):5846. doi:10.3390/rs14225846. [Google Scholar] [CrossRef]
51. Mora JJ, Selvaraj MG, Alvarez CI, Safari N, Blomme G. From pixels to plant health: accurate detection of banana Xanthomonas wilt in complex African landscapes using high-resolution UAV images and deep learning. Discov Appl Sci. 2024;6(7):377. doi:10.1007/s42452-024-06073-z. [Google Scholar] [CrossRef]
52. Selvaraj MG, Vergara A, Montenegro F, Ruiz HA, Safari N, Raymaekers D, et al. Detection of banana plants and their major diseases through aerial images and machine learning methods: a case study in DR Congo and Republic of Benin. ISPRS J Photogramm Remote Sens. 2020;169:110–24. doi:10.1016/j.isprsjprs.2020.08.025. [Google Scholar] [CrossRef]
53. Ghosal S, Zheng B, Chapman SC, Potgieter AB, Jordan DR, Wang X, et al. A weakly supervised deep learning framework for sorghum head detection and counting. Plant Phenomics. 2019;2019(3):817. doi:10.34133/2019/1525874. [Google Scholar] [PubMed] [CrossRef]
54. Oh S, Chang A, Ashapure A, Jung J, Dube N, Maeda M, et al. Plant counting of cotton from UAS imagery using deep learning-based object detection framework. Remote Sens. 2020;12(18):2981. doi:10.3390/rs12182981. [Google Scholar] [CrossRef]
55. Chen Y, Xu H, Zhang X, Gao P, Xu Z, Huang X. An object detection method for bayberry trees based on an improved YOLO algorithm. Int J Digital Earth. 2023;16(1):781–805. doi:10.1080/17538947.2023.2173318. [Google Scholar] [CrossRef]
56. Xu X, Wang L, Shu M, Liang X, Ghafoor AZ, Liu Y, et al. Detection and counting of maize leaves based on two-stage deep learning with UAV-based RGB image. Remote Sens. 2022;14(21):5388. doi:10.3390/rs14215388. [Google Scholar] [CrossRef]
57. Machefer M, Lemarchand F, Bonnefond V, Hitchins A, Sidiropoulos P. Mask R-CNN refitting strategy for plant counting and sizing in UAV imagery. Remote Sens. 2020;12(18):3015. doi:10.3390/rs12183015. [Google Scholar] [CrossRef]
Cite This Article
 Copyright © 2025 The Author(s). Published by Tech Science Press.
This work is licensed under a Creative Commons Attribution 4.0 International License , which permits unrestricted use, distribution, and reproduction in any medium, provided the original work is properly cited.
 Downloads
 Citation Tools