
 Submit a Paper
 Propose a Special lssue
 Open Access
ARTICLE

Vector Extraction from Design Drawings for Intelligent 3D Modeling of Transmission Towers
1 State Grid Jiangsu Electric Power Co., Ltd. Construction Branch, Nanjing, 210011, China
2 School of Automation, Southeast University, Nanjing, 210096, China
* Corresponding Author: Chenxing Wang. Email:
Computers, Materials & Continua 2025, 82(2), 2813-2829. https://doi.org/10.32604/cmc.2024.059094
Received 27 September 2024; Accepted 28 November 2024; Issue published 17 February 2025
 View Full Text
 Download PDF
Abstract
Accurate vector extraction from design drawings is required first to automatically create 3D models from pixel-level engineering design drawings. However, this task faces the challenges of complicated design shapes as well as cumbersome and cluttered annotations on drawings, which interfere with the vector extraction heavily. In this article, the transmission tower containing the most complex structure is taken as the research object, and a semantic segmentation network is constructed to first segment the shape masks from the pixel-level drawings. Preprocessing and postprocessing are also proposed to ensure the stability and accuracy of the shape mask segmentation. Then, based on the obtained shape masks, a vector extraction network guided by heatmaps is designed to extract structural vectors by fusing the features from node heatmap and skeleton heatmap, respectively. Compared with the state-of-the-art methods, experiment results illustrate that the proposed semantic segmentation method can effectively eliminate the interference of many elements on drawings to segment the shape masks effectively, meanwhile, the model trained by the proposed vector extraction network can accurately extract the vectors such as nodes and line connections, avoiding redundant vector detection. The proposed method lays a solid foundation for automatic 3D model reconstruction and contributes to technological advancements in relevant fields.Keywords
With the rapid development of digital power grids, numerous intelligent applications require digital 3D models as technical support, such as intelligent acceptance of transmission lines, which requires standard 3D design models as acceptance comparison standards [1]. However, construction units usually have only 2D drawings in PDF, JPG, etc. (we call it pixel-level). In addition, some existing project designs are only preserved in papery 2D drawings. In such cases, the only way to get a 3D model is to rely on manual modeling by professional designers. Therefore, intelligently transforming 2D design drawings into 3D models is a worthwhile research topic, among this, the recognition and analysis of 2D design drawings are crucial. Transmission lines are designed with various transmission towers depending on the voltage level. A single transmission tower is typically divided into dozens of sections, corresponding to dozens or even hundreds of drawings. Each design drawing usually contains a variety of geometric structures and a large amount of complex textual, symbolic, and tabular annotations. Thus, the automatic perception and analysis of design drawings face significant challenges, additionally, for the design drawings represented as document files, the precise extraction of vector information, such as the coordinates of nodes and line connections, is most important for the intelligent transformation of 2D design drawings into 3D models.
As early as the late 1970s, industrially developed countries, including Japan, the United States, and Canada, began to explore the recognition and understanding of CAD (Computer Aided Design) drawings, and many research projects were undertaken, such as CAD Overlay, Raserrex, GTX (GeForce GTX), VPStudio, RxAutoImage Pro2000, and Crucoble, each dedicated to various aspects of drawing processing. Starting from the mid-1980s, some systems have been developed to recognize and understand CAD drawings, such as the EDIS software from Huazhong University of Science and Technology and the ANNO system from Tsinghua University in China. Many research works have emerged to process the different contents of CAD drawings. Feng et al. [2] focused on the recognition technology of center lines, surface roughness symbols, and geometric tolerance symbols, proposing a recognition algorithm based on key graphic features. Yu et al. [3] achieved segmentation of engineering drawings by improving the fruit fly optimization algorithm. Jiang et al. [4] successfully designed a character recognition system for automated quality inspection in producing and testing mechanical parts. These methods have made some progress for specific drawings. However, for complex drawings, there are still issues of low precision, slow processing speed, low level of intelligence, and poor adaptability in semantic segmentation and vector extraction.
In recent years, some progress has been made in image semantic segmentation and vector extraction due to the rapid development and widespread application of deep learning in computer vision. Common image semantic segmentation tasks classify each pixel in a drawing into corresponding instances, typically categorized into countable and uncountable types. Kirillov et al. [5] incorporated the recognition of these two types of cases into semantic segmentation tasks by assigning semantic labels to each pixel, then they detected each object instance using bounding boxes and segmentation masks. Rezvanifar et al. [6] proposed a deep-learning-based method that improves YOLOv2 to achieve recognition and detection of countable instance symbols, however, this method is limited to countable instances. Chen et al. [7] introduced BANet (Bidirectional aggregation network), which integrates semantic segmentation and instance segmentation methods to enhance model performance. Wu et al. [8] proposed BGRNet (Bidirectional graph reasoning network), which models the relationships between modules using graph structures to achieve semantic segmentation. Although these methods have shown remarkable results in the semantic segmentation of scenes with rich textures and colors, they cannot be directly used for CAD drawings with complex lines and monotonous colors. For semantic segmentation of CAD drawings, Fan et al. [9,10] combined convolutional neural networks (CNNs) and graph convolutional networks (GCNs) to achieve high-precision semantic segmentation of all lines in the drawings. Then, they introduced attention mechanisms and Transformers, further improving the recognition results [10]. These efforts have promoted the recognition and understanding of CAD drawings to a new level. However, they rely on vector graphics to classify instances in the drawings, requiring many finely annotated vector graphics for model training and testing. As a result, these methods cannot be used for pixel-level understanding and analysis tasks of design drawings. Thus, the exact semantic segmentation aiming to extract the mask of the designed shape on a drawing still needs further study.
The masks obtained from the semantic segmentation of drawings can succinctly describe the shapes of geometric objects. However, further vectorization is required to express the topological structure and parameterization of object instances accurately. Traditionally, vector extraction is often achieved using skeleton extraction algorithms to describe the topological connections of geometric cases. However, traditional methods lack precision, depend on selecting empirical parameters, and are prone to incorrectly decoupling the topological connections between nodes. In recent years, skeleton extraction methods based on deep learning networks have become mainstream. Simo-Srra et al. [11,12] divided the input image into blocks and independently estimated vectors for each block using a feedforward neural network, followed by merging and smoothing the results. However, this merging and smoothing process is challenging to stabilize. Zeng et al. [13] designed a deep multitask neural network that extracts vectors and predicts their semantic types by establishing a boundary-guided attention mechanism in a spatial context module for segmented regions. However, this method is not suitable for vector extraction of skeletal structures. Zhou et al. [14] proposed a line segment node extraction network that predicts the node heatmaps of a graph using a node proposal module and then connects the nodes to form straight lines. Although this method yields good prediction results, it overlooks the connection relationships of real graphical topological lines, leading to issues such as incorrect connections and missing connections.
With the issues analyzed above, a novel two-stage strategy for vector extraction from design drawings of transmission towers is proposed in this paper. In the first stage, we propose a semantic segmentation network with an encoder-decoder structure, which takes pixel-level design drawings of transmission towers as input and outputs binarized mask images. During this process, preprocessing and postprocessing algorithms are also designed to adapt to the high resolution of tower design drawings and to unify the orientation of each local component for later 3D modeling. In the second stage, we propose a vector extraction network guided by heatmaps, which takes the binarized mask images from the first stage as input and outputs precise nodes and line connections. Then, accurate vector information can be extracted with the designed algorithms. Corresponding training and testing datasets were constructed during the process. The final experiments demonstrate that the proposed method can obtain high-quality structural vector information from pixel-level CAD drawings efficiently and robustly.
2 Vector Extraction of Design Drawings for Transmission Towers
2.1 Semantic Segmentation of Design Drawings
2.1.1 The Constructed Semantic Segmentation Network
The framework of the designed end-to-end semantic segmentation network is shown in Fig. 1. It adopts the widely used encoder-decoder model [15], adapted to inputting a drawing image and outputting the same-size binary mask image. During the forward propagation of the model, data in each layer is a three-dimensional array with dimensions H × W × D, where H and W represent the spatial dimensions, and D represents the dimension of feature channels. The first layer is the image, which has pixel dimensions of H × W and D color channels. After being uniformly downscaled to 256 × 256, the design drawings are then input into the network. The encoder extracts high-dimensional feature maps at a low resolution (56 × 56), which are subsequently upsampled by the decoder to the original image resolution. The network is built on the principle of translation invariance. The basic components (convolution, pooling, and activation functions) operate on local input regions and rely only on relative spatial coordinates. Assuming xij represents the data vector at position (i, j) in a specific layer, and yij represents the data vector in the next layer, a convolution operation calculates the output yij as follows:
where k represents the kernel size, s is the stride, and fks determines the layer type, i.e., for convolution or average pooling, it is a matrix multiplication; for max pooling, it searches for the maximum value in the spatial domain; and for activation functions, it is an element-wise nonlinear function. The encoder consists of a 7 × 7 convolutional block and two ResNet modules that extract deeper features [16], while the decoder comprises two upsampling modules and a 7 × 7 transposed convolutional block, as in Fig. 1.
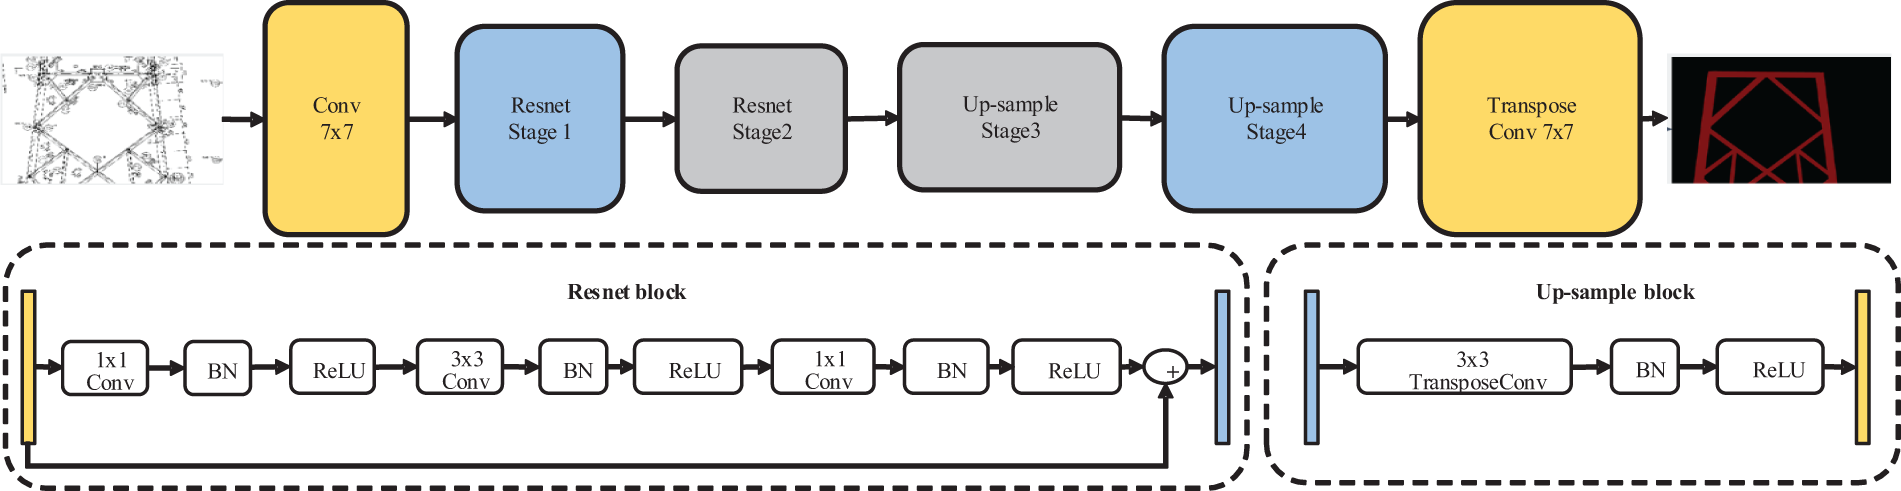
Figure 1: The framework of the semantic segmentation network
The ResNet modules in the encoding stage extract high-dimensional features from 2D images. Each ResNet module includes six residual blocks, with each block sequentially applying 1 × 1, 3 × 3, and 1 × 1 convolutions to extract image features, as shown in the Resnet block part in Fig. 1. After each convolution operation, a BatchNorm layer and a ReLU (Rectified Linear Unit) activation function is added to enhance model convergence. Additionally, by adding the skip layer connection, the input features and the features extracted by convolutions are added as the final output results to solve the vanishing gradient problem when the network depth increases. The calculation process of the residual block can be expressed as follows:
where x and y represent the input and output of each layer, respectively, and the function F(x, {Wi}) represents the learnable residual mapping, which is expressed as:
where W1, W2, W3 represent the convolutions parameter matrices with size 1 × 1, 3 × 3, and 1 × 1, respectively. BN(
In the decoding stage, it is necessary to predict high-resolution semantic masks from low-resolution high-dimensional features, accomplished through upsampling algorithms. Here, a transposed convolution is used, which involves reversing the forward and backward propagation processes of a standard convolution. Specifically, each upsampling module, as shown in the upsampling block part in Fig. 1, uses a transposed convolution to upsample the input feature map to twice the resolution, ultimately outputting a feature map with the same resolution as the original image, with the depth of the feature map corresponding to the number of classification categories. The upsampling process can be expressed as:
where x and y represent the input and output of each upsampling module, respectively, and W4 denotes the parameter matrix of the transposed convolution.
In the backpropagation process, the cross-entropy loss function is selected as the objective function for optimization, which can be expressed as:
where M denotes the number of categories, yc is a one-hot vector with elements of either 0 or 1, indicating whether the category c matches the sample’s category (1 if it matches, otherwise 0), and it represents the predicted probability of the sample belonging to category c. Since the 3D modeling primarily focuses on the shape, c is set only to include two categories: background and tower components.
Finally, after inputting the 2D design drawings of a transmission tower, the network will filter out other background interference and output only the pixel-level mask images of the tower components.
2.1.2 Preprocessing and Postprocessing
Our semantic segmentation network takes pixel-level drawings as input. To meet the requirements of printing precision, the original design drawings have extremely high resolutions, typically around 7000 × 10,000 pixels. However, common semantic segmentation models usually process the input image with a resolution of 256 × 256 or 515 × 512 pixels. Thus, if a very high-resolution image is input, it needs to be downscaled by several orders of magnitude before being fed into the network. However, this will result in a loss of details in feature representations extracted by the network. Based on practical experience, the design drawings should be uniformly cut into smaller sections before being input into the network, as illustrated in Fig. 2. To ensure efficiency, parallel computing is recommended to process these cut sections.
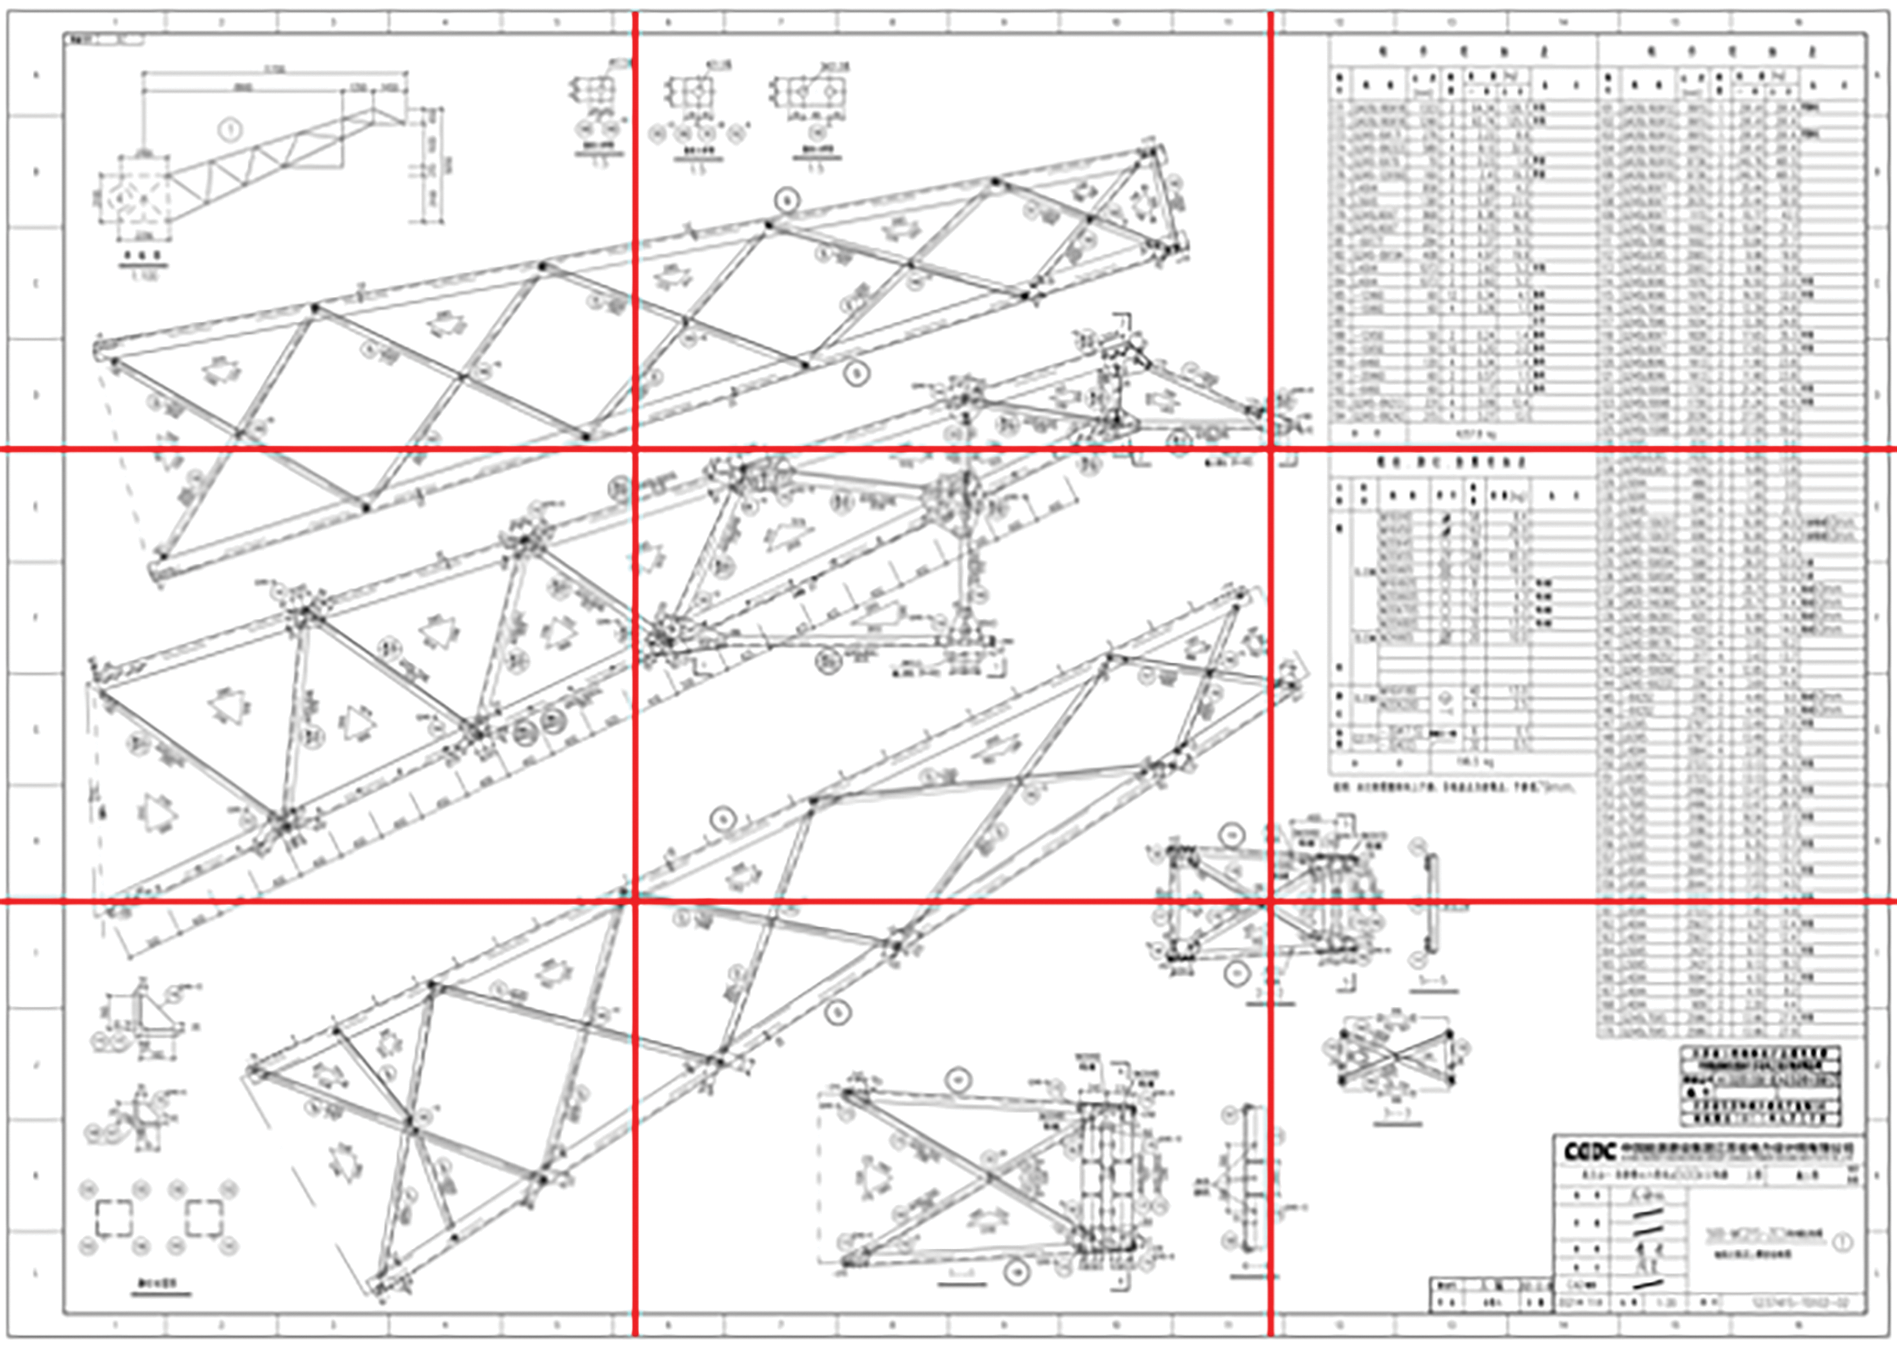
Figure 2: The diagram of cutting a design drawing
In the postprocessing stage, the binary mask image output from the segmentation network is first separated into several same-size images, and there is the mask of an independent component on each image at the same position corresponding to the original drawing. This is to keep the mask of every component on a different image in the same coordinate system, facilitating the following automatic reconstruction of the 3D model. However, sometimes, some local component is rotated unreasonably to keep the components on an original drawing being laid out compactly, such as the one in the red box marked in Fig. 3. Therefore, such a component should be rotated to adjust the pose back to keep it ortho-projection in the 2D coordinate. As the flowchart in Fig. 3, the separation of local components is primarily based on the connected domain method. We first count the areas of each connected component on the semantic segmentation masks and filter out the noise points and other interference, then each local component is separated according to the connected component labels. Notably, each segmented image keeps the same size as the input image to ensure that all local components are unified in the same coordinate space.
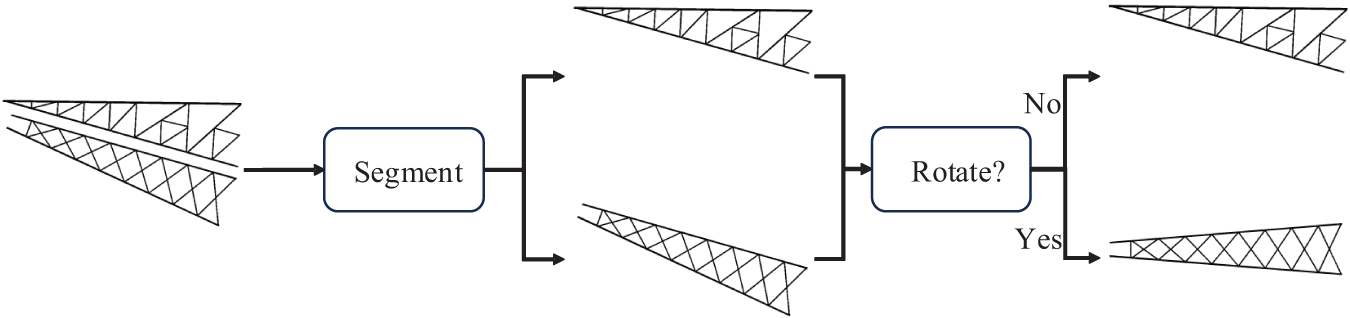
Figure 3: The flowchart of the postprocessing
The posture adjustment for a local component is based on the processing of their bounding boxes. As shown in Fig. 4, there is a mask image output from the semantic segmentation network and the local components have been marked with different colors using the connected domain method, as shown in Fig. 4a. Each independent local component mask is separated in a separate image, as shown in Fig. 4b. We perform connected component analysis to find the largest outer contour and derive the minimum enclosing rectangle for the mask shape. The center and horizontal axis of this rectangle are calculated, and then the rotation angle around the horizontal direction is determined, as illustrated in Fig. 4c. Finally, the local mask image is rotated according to the rotation angle to achieve the standard pose in the unified coordinate system, as shown in Fig. 4d.
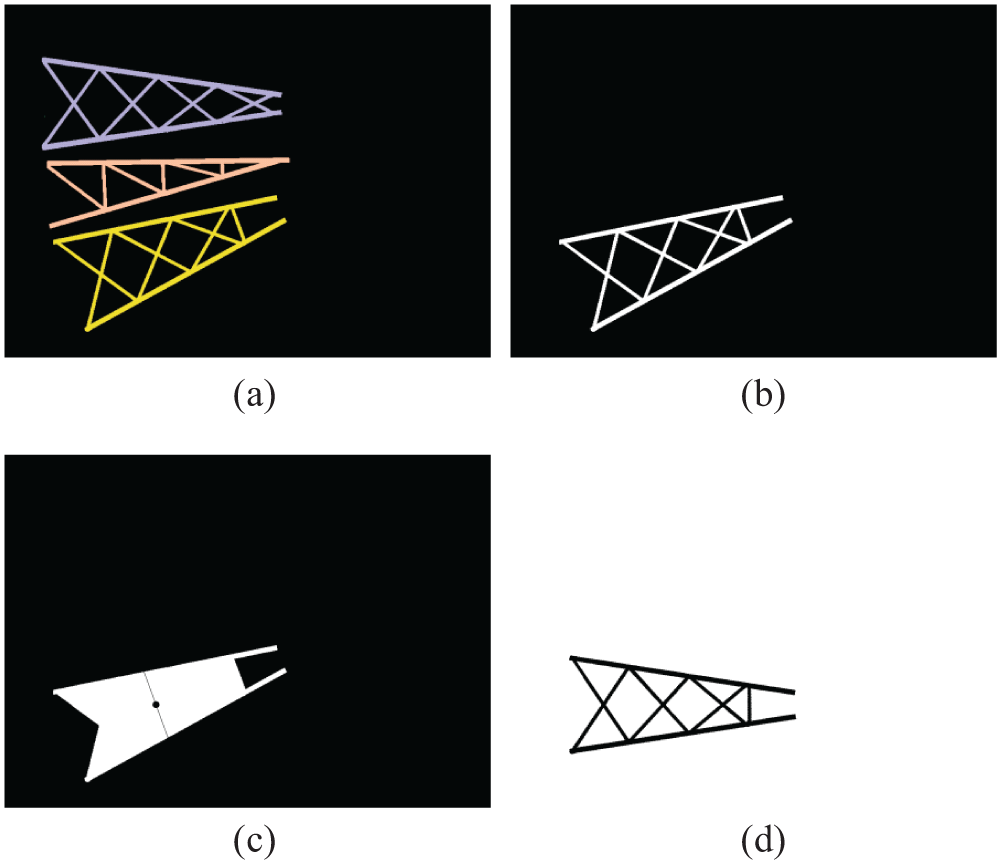
Figure 4: The diagram of pose adjustment for a local component
2.2 The Proposed Vector Extraction Network
The above method can segment a design drawing into multiple mask images that can be processed to obtain the main shape of a transmission tower. However, to achieve a standard 3D model with precise real-world size, it is necessary to assign the real size to each component. To accomplish this, the mask images from the drawings must be vectorized to convert pixel-level images into vector images, to obtain the node and line vectors to facilitate the parameterization. For this purpose, we propose a vector extraction network guided by heatmaps that describe the probability of some targets appearing at certain locations. Our network takes a pixel-level mask image as input, and outputs nodes and line connections from the mask images. The lines and nodes are ultimately integrated to get the vector information of a mask shape.
Traditional vector extraction algorithms often lack precision and robustness, resulting in redundant nodes and fragmented vector segments. L-CNN is an end-to-end node extraction network [14] that uses a node suggestion module to extract all nodes from the line drawings and then connects these nodes to obtain line segments. While L-CNN achieves high accuracy in node extraction, the connection of nodes to form complete line segments often encounters issues such as incorrect or missing connections, making it unsuitable for complex structures like those of transmission towers. Inspired by L-CNN, we design a novel vector extraction network that employs the same encoder as L-CNN during the encoding phase, which encodes the input mask into a high-dimensional feature map. In decoding, a skeleton heatmap constraint decodes the feature map into a skeleton line heatmap. Then a merging module is designed to fuse the skeleton lines and nodes to refine the output vectors further.
Fig. 5 illustrates the frame of the proposed vectorization method. The first half of Fig. 5 shows the main modules of our network. The encoder is composed of a stack of hourglass modules with Pyramid Residual Modules (PRM), to predict the joints of human bodies originally [17]. Still, here it is to extract deep features of nodes in design drawings. The encoder performs feature encoding on the input mask shapes and generates feature maps with dimensions W × H × C. Two decoders then process these feature maps, each composed of a fully convolutional neural network. The decoder estimates binary values for each point on the grid generated by the decoder (1 for points on the central skeleton line, and 0 otherwise), thus outputting a skeleton line heatmap and a node heatmap separately, with resolution H × W. These heatmaps show the probability of each pixel belonging to a skeleton line or a node, with varying probabilities across different pixels. The coordinates of the skeleton line or a node are determined by selecting the position of the pixels with the highest probability.
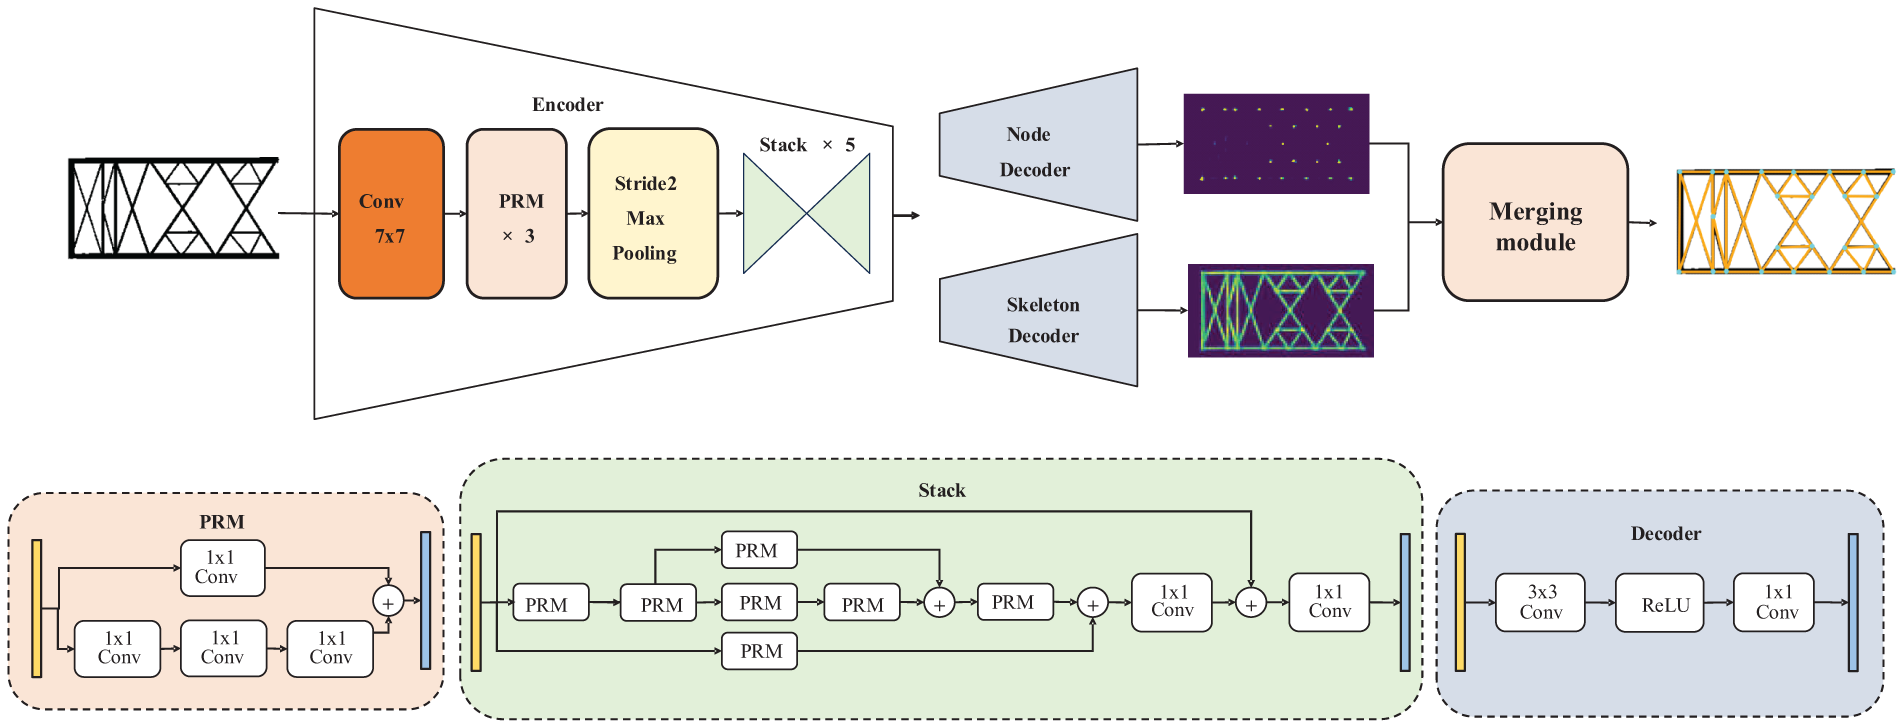
Figure 5: The framework of the vector extraction network
The prediction of the skeleton lines or nodes can be viewed as a classification problem, so average binary cross-entropy is used as the loss function:
where yi is the binary label (0 or 1), p(yi) is the probability of the output belonging to label yi, and N represents the total number of samples.
After the heatmaps are predicted, a merging module shown in Fig. 5 fuses the information of node heatmaps and skeleton heatmaps. The design idea of this merging module is as follows: firstly, all predicted nodes are connected to construct a list, this list is uniformly sampled and a candidate line list is generated; then, with the features of the skeleton heatmap are aligned to the candidate line list, that is, the lines of the candidate line list is grided onto the skeleton heatmap; finally, the heatmap values are used as the confidence level for filtering to determine the pixel being the right grid line. Here, the confidence level of each candidate line is defined as the average pixel density along the candidate line. The correct skeleton line and nodes can be obtained by setting a simple threshold. Benefiting from the feature fusion of skeleton heatmaps, the predicted nodes can be filtered effectively, and the correctness of the line connections between the predicted nodes is ensured largely.
3 Experimental Results and Analysis
3.1 Parameter Settings for Experiments
A large amount of sample data is required to train deep-learning models for related tasks. To produce the labeled binary masks, the open-source Python annotation tool LabelMe was used to annotate all components of the towers with pixel-level precision by labeling polygons. The masks were then annotated to identify all structural nodes, with the lines connecting these nodes representing the skeleton lines, thereby generating a vector extraction dataset.
The semantic segmentation dataset comprises 392 design drawings of 9 transmission towers (with resolutions of 6989 × 9897 or 9865 × 7021) and their corresponding binary mask images. This dataset was split into training and testing sets at a ratio of 9:1. The common data augmentation for image processing networks was performed on the training set using the following steps: (1) uniform cropping, (2) random flipping, and (3) random rotation, resulting in 20,000 augmented samples for training the network.
For the vectorization network training, more types of towers are added. Then the dataset consists of 1280 design drawings of 20 towers, with corresponding images containing vector nodes and line segments, also split at a ratio of 9:1.
The experiments were conducted on a computer with an Intel Z270 motherboard, 16 GB of memory, and a GeForce GTX 1080 Ti GPU. After adjusting the resolution of each sample to 256 × 256, the data were input into the network. Both networks were trained using the SGD (Stochastic Gradient Descent) optimizer with a learning rate of 10−5, for 20 iterations, and a batch size of 14.
3.2 Test of Semantic Segmentation for Design Drawings of Transmission Tower
The algorithm was tested and analyzed on the constructed dataset. First, the impact of the input image resolution on semantic segmentation was analyzed. The design drawings were respectively input into the network in the form of original drawings, 2 × 2 cuts, and 3 × 3 cuts, and then the output sub-images were spliced to obtain the results shown in Fig. 6. It can be observed that as the cut number increased, the semantic segmentation results also improved. To evaluate the performance, we calculated the metric, Intersection over Union (IoU), and the average processing time (seconds per frame, spf), as listed in Table 1. Cutting an image into sub-images is beneficial for improving the IoU index, and the efficiency can be maintained by parallel computing like only one complete drawing is input. Overall, the performance shows well for practical use.
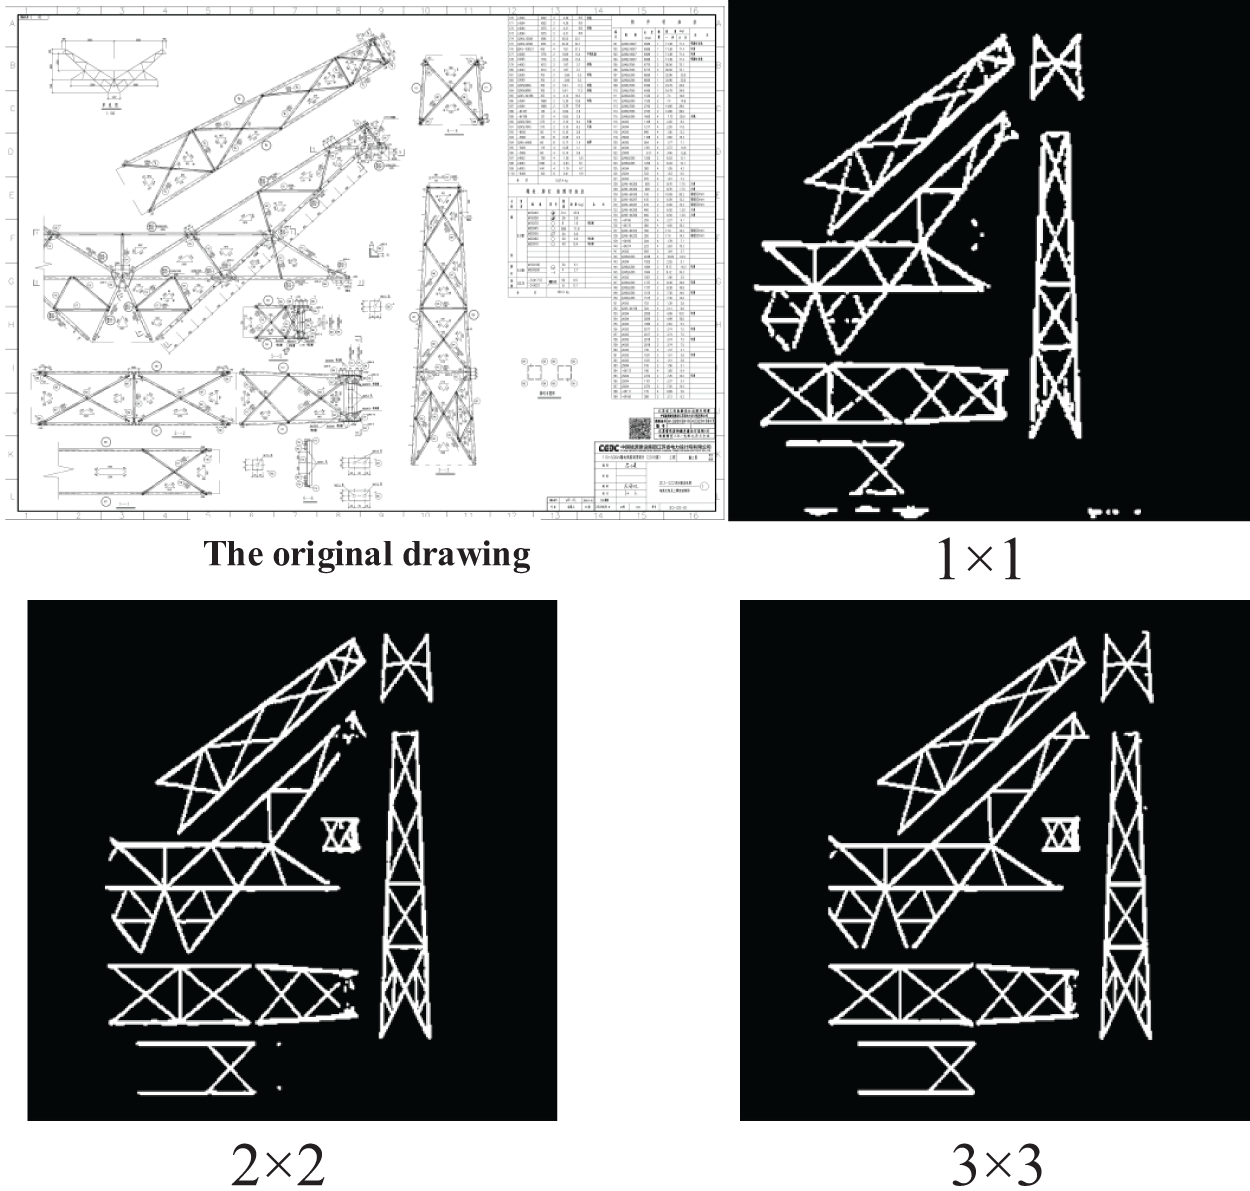
Figure 6: The impact of input image resolution on network results
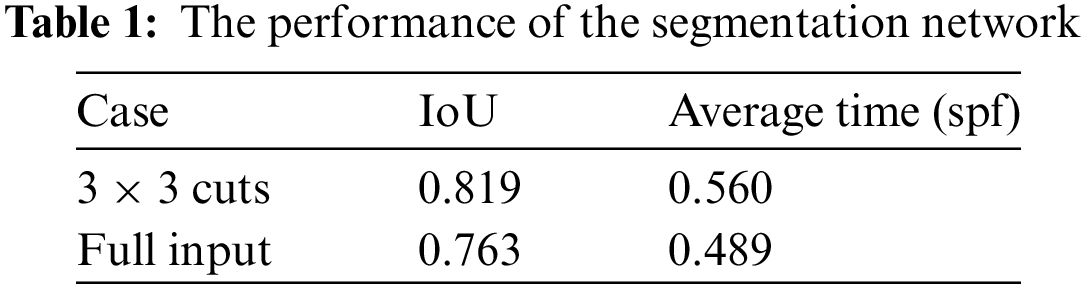
Fig. 7 also presents a processed result, demonstrating that the binary mask extracted by the semantic segmentation network is highly accurate. The local components, after post-processing, become sub-images with a unified coordinate system and correct posture.
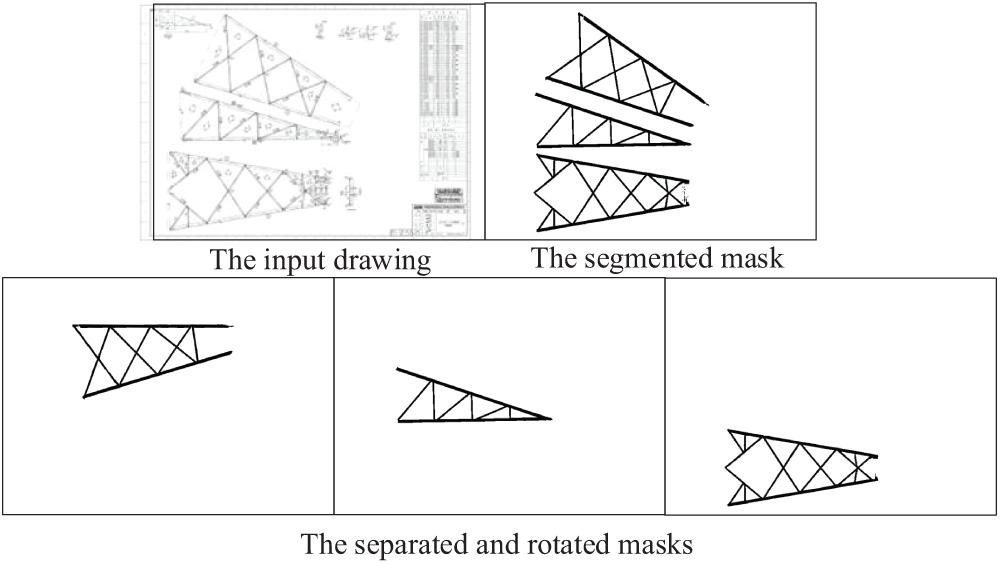
Figure 7: The result of the proposed semantic segmentation network after postprocessing
3.3 The Results of the Vectorization Network
To demonstrate the accuracy of the proposed vector extraction method, comparisons were made with state-of-the-art methods: Skeletonize [18]+line segment detector (LSD) [19], L-CNN [14], Holistically-Attracted Wireframe Parsing (HAWP) [20], and DeepLSD [21]. LSD is a traditional method that is very classical and effective in detecting line segments, like the task in this paper, and we added a preprocessing of skeletonizing for better effect. HAWP and DeepLSD are also both improvements of L-CNN, which are relatively relevant to our method, aiming to extract the nodes and line connections.
The commonly used structural average precision (sAP) metric was applied for quantitative evaluation. This metric calculates the ratio of correctly predicted line segments to ground truth line segments and assesses the situation when the ratio conforms to a certain threshold precision. The measure to identify whether the predicted line connection is correct is calculated as
where
We trained the comparison methods on our dataset and tested them on the same data to obtain quantitative results by calculating the sAP under different thresholds, as listed in Table 2. For the traditional Skeletonize+LSD method, mask segmentation is necessary, while the other deep learning methods are all trained using pixel-level images with and without mask segmentation separately. All the methods perform better with the original drawings being processed as mask images. As the threshold of sAP is larger, all methods show higher index values, while Skeletonize+LSD shows a severe limitation even if for sAP15. L-CNN results are better than those of HAWP and DeepLSD since the latter methods produce more redundant line connections that increase incorrect detection rates. However, L-CNN, HAWP, and DeepLSD all follow a process that predicts nodes first and then verifies the correct connections using refinement methods, which is inevitable to retain invalid connections or miss someone. Our method shows better robustly, benefiting from the fusion of features of nodes and connections.
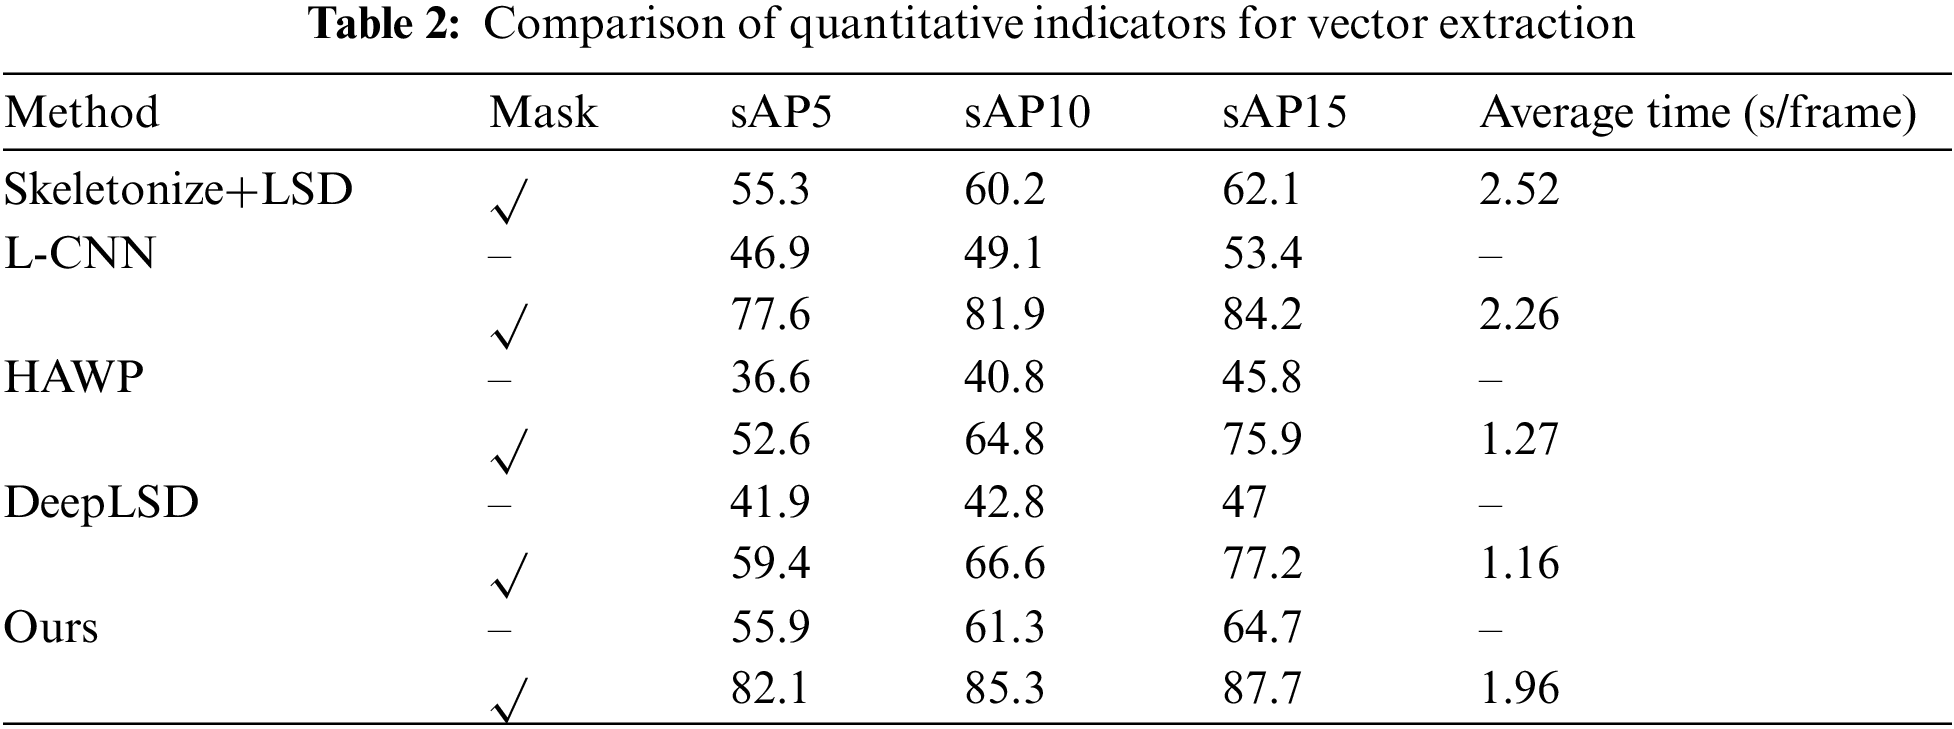
We also tested the average runtime for these methods to process a complete drawing. All methods can complete the inference of vector extraction in around 2 s. The traditional method is relatively slower. HAWP and DeepLSD are both faster due to their efficiency optimization. Our method maintains a similar level to L-CNN without efficiency optimization. Generally, all methods show satisfactory efficiency.
The outcomes were visualized to illustrate the results further. First, the intermediate results from the proposed skeleton extraction module are shown in Fig. 8. Compared to the input mask image, the skeleton heatmap accurately predicts the locations of the skeleton lines, which thus can provide useful information for the prediction of correct line connections for our method.
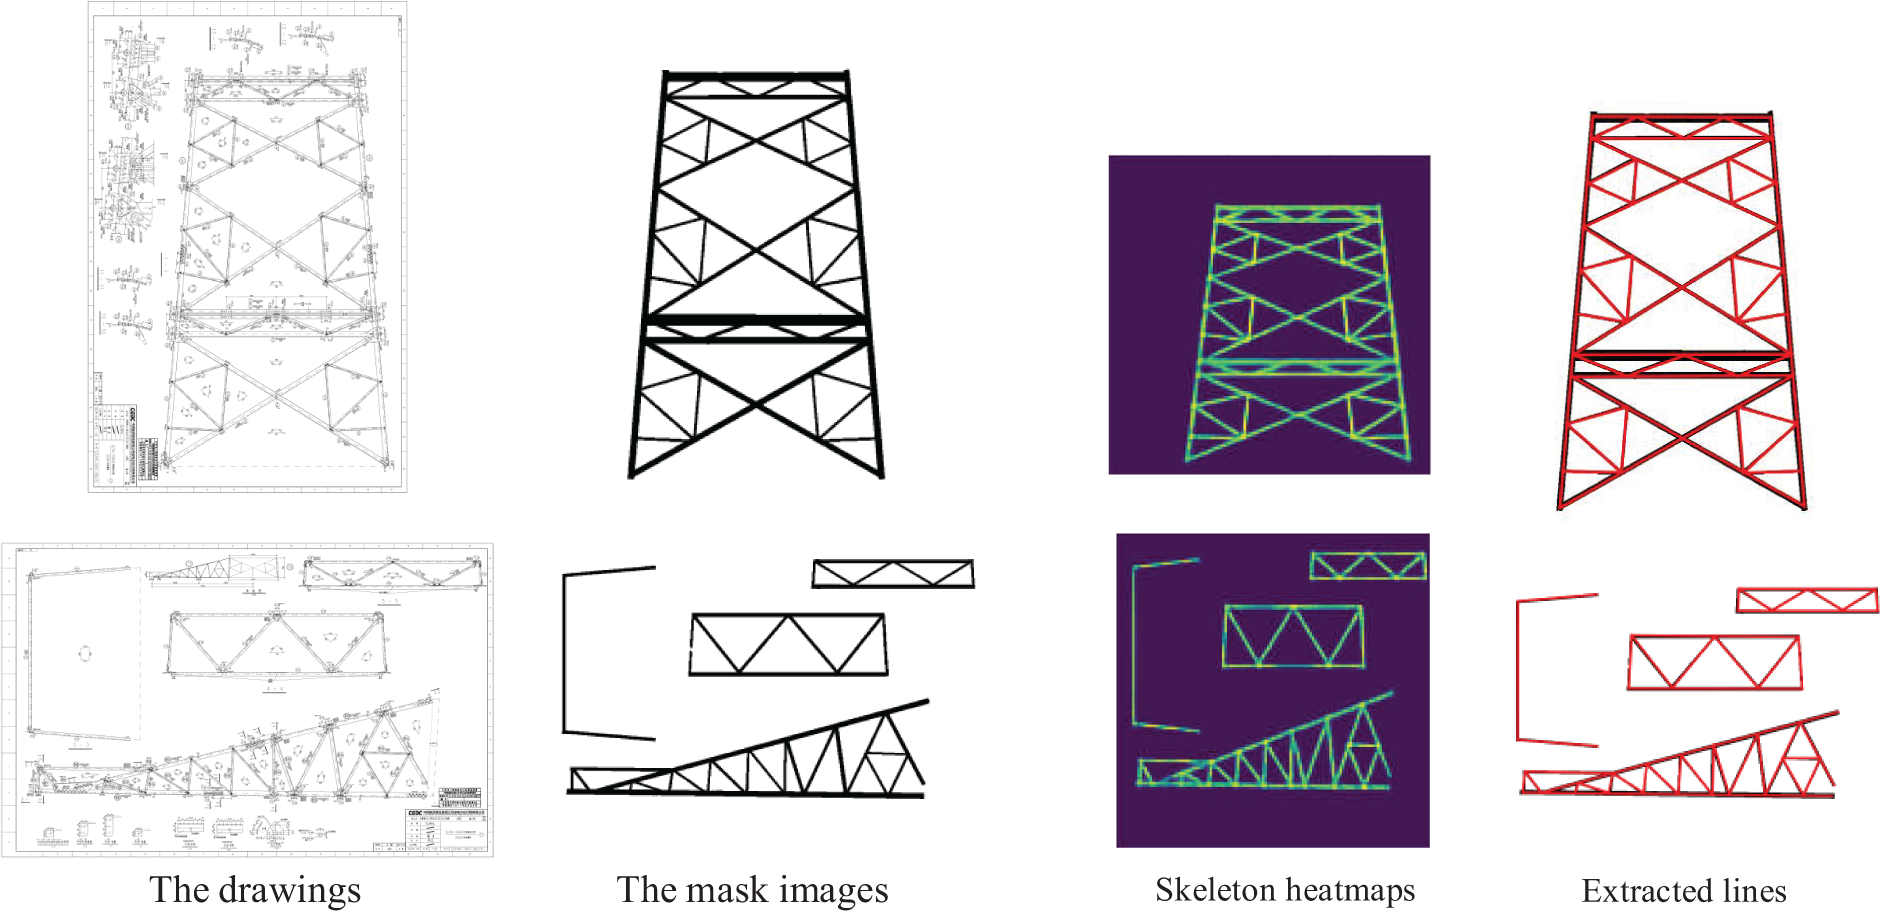
Figure 8: The result of the proposed skeletal line extraction method
Fig. 9 further visually compares the final vector extraction results, where all nodes are displayed in blue and vector segments are marked in orange. The figure shows that many vector segments are broken in the results obtained using Skeletonize+LSD, leading to numerous redundant nodes, as indicated by the red circles. This occurs because the LSD method primarily relies on pixel gradients to identify line segments, making it highly sensitive to pixel variations. The results from the L-CNN method are relatively better but still focus solely on node extraction, overlooking the relationships between segments. As a result, for complex cross-network structures like transmission towers, redundant nodes, and incorrect connections often occur. HAWP has a node prediction module like L-CNN, and the obtained nodes are treated as ‘basins’ in a holistic 4-dimensional attraction field to compute line segment proposals. Still, it inevitably leaves many redundant line connections even if there are verification modules. DeepLSD shows clean nodes and line connections, but it predicts the edge lines for both sides of each line in a mask image, while the ground truth is just a skeleton line. Overall, our method performs the best for this task due to the fusion of node heatmap and skeleton heatmap, which effectively avoids the creation of redundant nodes and vector segments, thereby enhancing the precision and efficiency of the vectorization process.
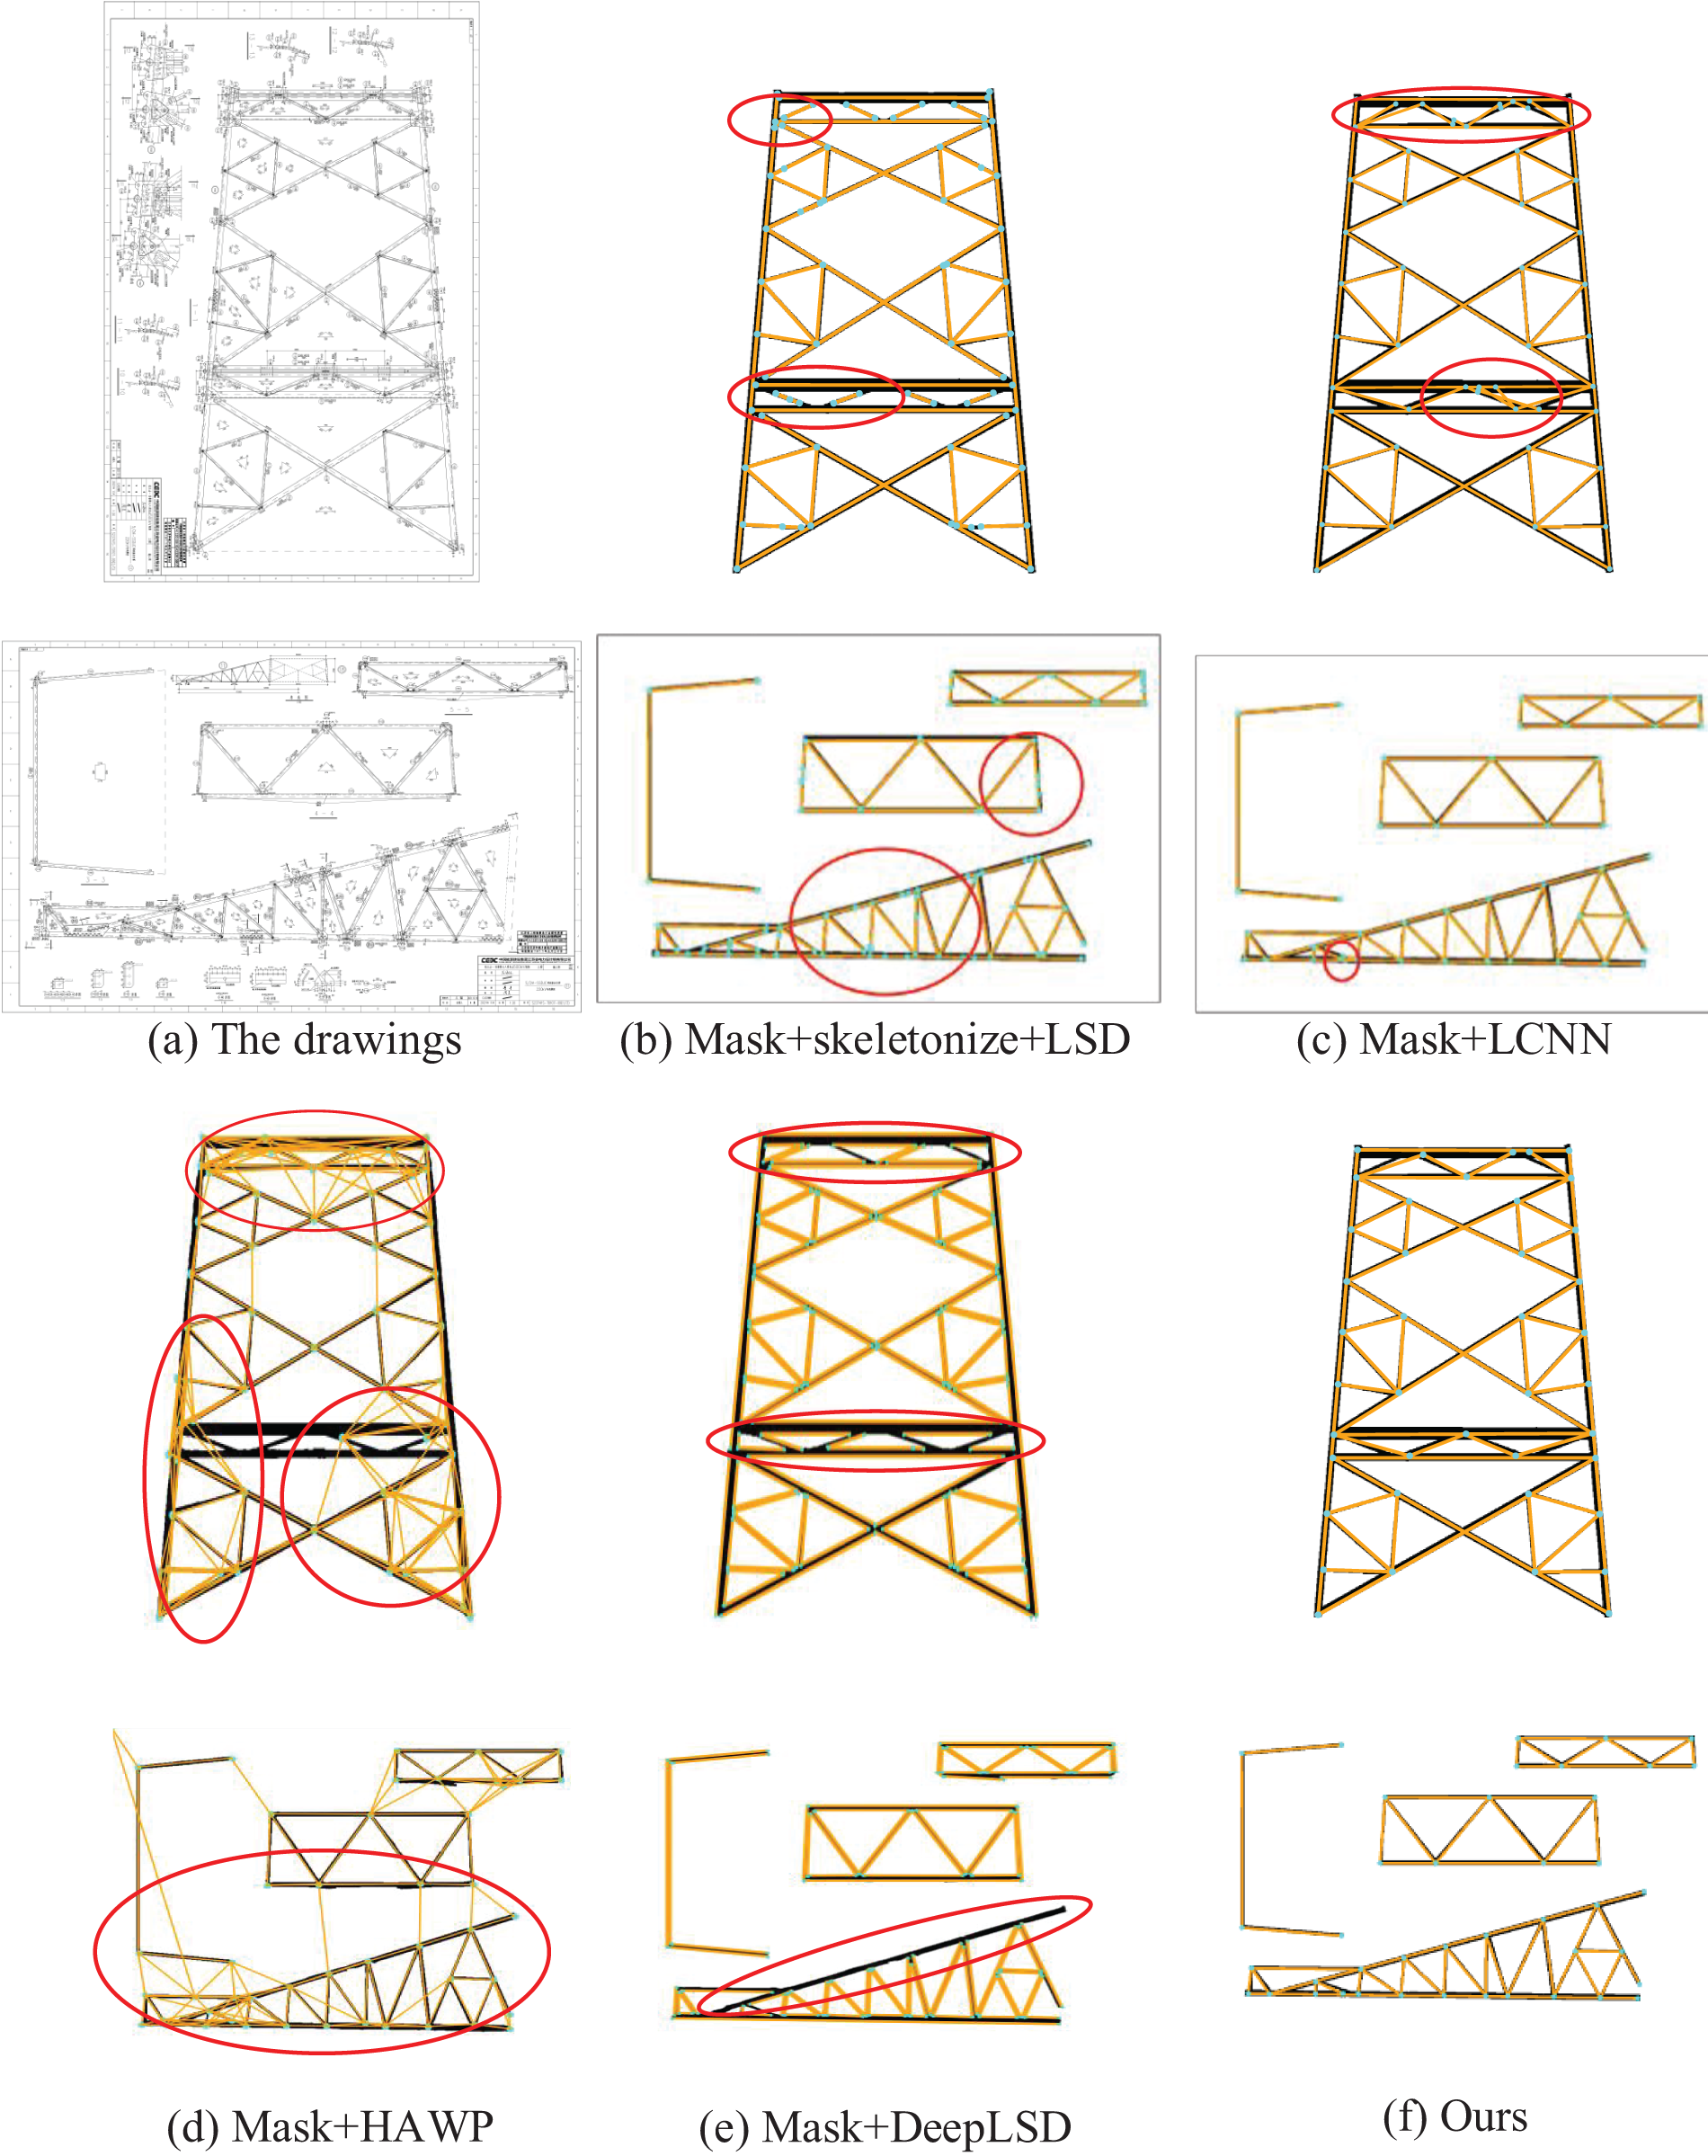
Figure 9: The comparison of vectorization for design drawings of transmission towers
As with all deep learning methods, our networks also face the challenge of generalization. Our training data are all obtained from different projects in the real world, which are designed by different designers or different design units, while the data look the similar types due to certain design standards in the field of transmission line design. Therefore, for ordinary design drawings of transmission towers, the trained network models should perform well, as proved above. However, if the used data is distinct from the training data, the result will be unsatisfactory.
Fig. 10 illustrates a failure case for the mask segmentation, where the resulting mask shapes at the right regions show satisfactory but the left ones are incomplete. Corresponding to the input drawing of Fig. 10a, the left components display very complicated annotation styles and some small components are difficult to be illegible from the dense annotations. This style is not common and has not been included in the training dataset. Then, the result shows bad when the trained model tests whether it is cut into 3 × 3 sub-images (Fig. 10b) or more sub-images (Fig. 10c). For the vector extraction, if the input mask image is bad, the final vectorization result is surely bad. To solve this problem, we recommend increasing the variety of samples to ensure the training data includes similar styles for practical data use. In addition, the input image can be cut into a suitable number of sections to ensure the input resolution of network training. With some simple experiments, we recommend that the cutting number be adjusted with a law that the sub-image is not larger than a size of about 3000 × 3000 pixels.
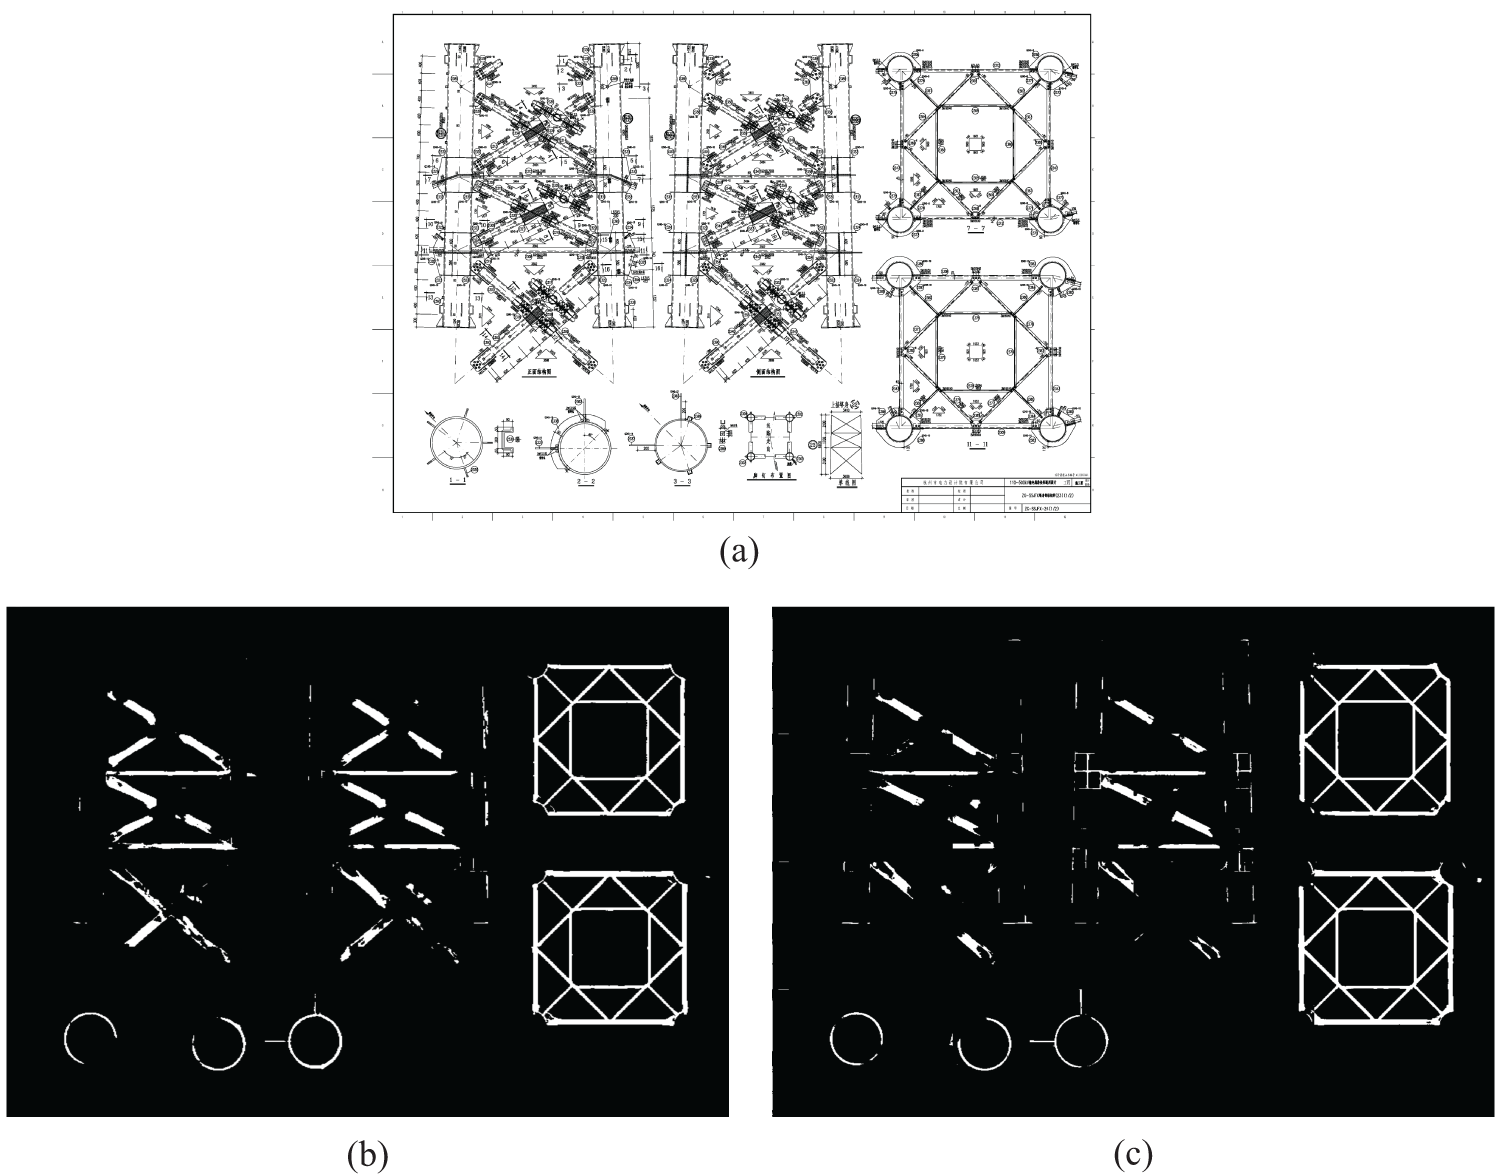
Figure 10: (a) An original drawing; The results with input being cut into (b) 3 × 3 sections (c) 4 × 4 sections
Automatic 3D modeling of transmission towers necessitates a thorough understanding and analysis of their design drawings, among which the vectorization of the structural shapes is a critical issue. To address this task, we propose a two-stage solution: first, a semantic segmentation network with an encoder-decoder structure is designed to extract binary mask images of structural components from pixel-level design drawings. Then, a heatmap-based vector extraction method is introduced, taking mask images as input to accurately detect skeleton lines and integrate node information, ultimately achieving precise vectorization. Experimental results demonstrate that the proposed method exhibits high accuracy and robustness on complex tower design drawings. However, we still have some issues that need to be solved:
1) As discussed in Section 3.4, the network model will fail if practical data has distinct styles from the training data. Except for adjusting the dataset, the recent techniques such as domain generalization [22,23] and large model [24] all worth further studying.
2) The vector information obtained by our method lays a solid foundation for subsequent automatic 3D model reconstruction. In future work, the mask images obtained using our semantic network can be taken as the orthographic projection of a component from different views, and so a 3D model can be constructed based on the wire-frame models in graphics. In addition, each of the line segments of the mask has been vectorized, so we can allocate the real size to the vectors and finally obtain a 3D model with the same size in the real world.
Acknowledgement: We thank Chen Yuxin and Ma Miao for their help in creating the training datasets.
Funding Statement: This research was funded by the Chinese State Grid Jiangsu Electric Power Co., Ltd. Science and Technology Project Funding, Grant Number J2023031.
Author Contributions: The authors confirm their contribution to the paper as follows: study conception and design: Ziqiang Tang, Yuhang Chen, Chenxing Wang; data collection: Zhou Fan, Yuntian Huang; analysis and interpretation of results: Chao Han, Hongwu Li, Ke Sun; draft manuscript preparation: Yuhang Chen, Chenxing Wang. All authors reviewed the results and approved the final version of the manuscript.
Availability of Data and Materials: The data that support the findings of this study are available from the corresponding author, Chenxing Wang, upon reasonable request.
Ethics Approval: Not applicable.
Conflicts of Interest: The authors declare no conflicts of interest to report regarding the present study.
References
1. M. Ma et al., “Intelligent acceptance check for towers of overhead transmission line based on point clouds,” IET Gene., Trans. Distri., vol. 17, no. 22, pp. 5074–5089, Oct. 2023. doi: 10.1049/gtd2.13021. [Google Scholar] [CrossRef]
2. H. Feng, “Research on recognition of dash-dotted line, roughness degree symbols, and tolerance symbols in shape and relative position in engineering drawings,” M.S. thesis, School of Mech. Eng., Northwest. Polytech. Univ., China, 2006. [Google Scholar]
3. H. Yu, J. Yang, and X. Wang, “Research on engineering drawing segmentation method based on improved fruit fly optimization algorithm,” Comput. Tech. Develop., vol. 28, no. 10, pp. 124–128, Oct. 2018. doi: 10.3969/j.issn.1673-629X.2018.10.026. [Google Scholar] [CrossRef]
4. M. Jiang, “Research on character detection and recognition method in engineering drawing,” M.S. thesis, School of Infor. Commu. Eng., Univ. of Electro. Sci. and Tech., Chengdu, China, 2019. [Google Scholar]
5. A. Kirillov, K. He, R. Girshick, C. Rother, and P. Dollár, “Panoptic segmentation,” in Proc. IEEE Conf. Comput. Vision Patt. Recog., Long Beach, CA, USA, 2019, pp. 9396–9405. doi: 10.1109/CVPR.2019.00963. [Google Scholar] [CrossRef]
6. A. Rezvanifar, M. Cote, and A. B. Albu, “Symbol spotting on digital architectural floor plans using a deep learning-based framework,” in Proc. IEEE Conf. Comput. Vision Patt. Recog. Workshops, Seattle, WA, USA, 2020, pp. 568–569. [Google Scholar]
7. Y. Chen, G. Lin, S. Li, O. Bourahla, Y. Wu and F. Wang, “BANet: Bidirectional aggregation network with occlusion handling for panoptic segmentation,” in Proc. IEEE Conf. Comput. Vision Patt. Recog, Seattle, WA, USA, 2020, pp. 3792–3801. [Google Scholar]
8. Y. Wu et al., “Bidirectional graph reasoning network for panoptic segmentation,” in Proc. IEEE Conf. Comput. Vision Patt. Recog., Seattle, WA, USA, 2020, pp. 9080–9089. [Google Scholar]
9. Z. Fan, T. Chen, P. Wang, and Z. Wang, “Cadtransformer: Panoptic symbol spotting transformer for cad drawings,” in Proc. IEEE Conf. Comput. Vision Patt. Recog, New Orleans, LA, USA, 2022, pp. 10976–10986. [Google Scholar]
10. Z. Fan, L. Zhu, H. Li, X. Chen, S. Zhu and P. Tan, “FloorPlanCAD: A large-scale CAD drawing dataset for panoptic symbol spotting,” in Proc. IEEE Conf. Comput. Vision Patt. Recog, Montreal, QC, Canada, 2021, pp. 10108–10117. [Google Scholar]
11. M. Bessmeltsev and J. Solomon, “Vectorization of line drawings via polyvector fields,” ACM Trans. Graph., vol. 38, no. 1, pp. 1–12, Jan. 2019. doi: 10.1145/3202661. [Google Scholar] [CrossRef]
12. E. Simo-Srra, S. Iizuka, and H. Ishikawa, “Real-time data-driven interactive rough sketch inking,” ACM Trans. Graph., vol. 37, no. 4, pp. 1–14, Jul. 2018. doi: 10.1145/3197517.3201370. [Google Scholar] [CrossRef]
13. Z. Zeng, X. Li, Y. K. Yu, and C. Fu, “Deep floor plan recognition using a multi-task network with room-boundary-guided attention,” in Proc. Int. Conf. Comp Vis., Seoul, Republic of Korea, 2019, pp. 9096–9014. doi: 10.1109/ICCV.2019.00919. [Google Scholar] [CrossRef]
14. Y. Zhou, H. Qi, and Y. Ma, “End-to-end wireframe parsing,” in Proc. Int. Conf. Comp Vis., Seoul, Republic of Korea, 2019, pp. 962–971. [Google Scholar]
15. J. Lyu, Z. Wang, and F. Xu, “Portrait eyeglasses and shadow removal by leveraging 3D synthetic data,” in Proc. IEEE Conf. Comput. Vision Patt. Recog., New Orleans, LA, USA, 2022, pp. 3429–3439. doi: 10.1109/CVPR52688.2022.00342. [Google Scholar] [CrossRef]
16. K. He, X. Zhang, S. Ren et al., “Deep residual learning for image recognition,” in Proc. IEEE Conf. Comput. Vision Patt. Recog, Las Vegas, NV, USA, 2016, pp. 770–778. [Google Scholar]
17. A. Newell, K. Yang, and J. Deng, “Stacked hourglass networks for human pose estimation,” in Proc. Euro. Conf. Comput. Vision, Amsterdam, Netherlands, 2016, pp. 483–499. doi: 10.1007/978-3-319-46484-8_29. [Google Scholar] [CrossRef]
18. T. C. Lee, R. L. Kashyap, and C. N. Chu, “Building skeleton models via 3-D medial surface axis thinning algorithms,” CVGIP: Graph. Model. Imag. Process., vol. 56, no. 6, pp. 462–478, 1994. doi: 10.1006/cgip.1994.1042. [Google Scholar] [CrossRef]
19. R. G. Von Gioi, J. Jakubowicz, J. M. Morel, and G. Randall, “LSD: A line segment detector,” Imag. Process. Line, vol. 2, pp. 35–55, 2012. doi: 10.5201/ipol.2012.gjmr-lsd. [Google Scholar] [CrossRef]
20. N. Xue, T. Wu, S. Bai, F. Wang, G. Xia and L. Zhang, “Holistically-attracted wireframe parsing,” in Proc. IEEE Conf. Comput. Vision Patt. Recog., WA, USA, 2020, pp. 2785–2794. doi: 10.1109/CVPR42600.2020.00286. [Google Scholar] [CrossRef]
21. R. Pautrat, D. Barath, V. Larsson, M.R. Oswald, and M. Pollefeys, “DeepLSD: Line Segment Detection and Refinement with Deep Image Gradients,” in Proc. IEEE Conf. Comput. Vision Patt. Recog., Vancouver, BC, Canada, 2023, pp. 17327–17336. [Google Scholar]
22. K. Zhou, Z. Liu, Y. Qiao, T. Xiang, and C. C. Loy, “Domain generalization: A survey,” IEEE Trans. Patt. Analy. Mach. Intell., vol. 45, no. 4, pp. 4396–4415, 2023. doi: 10.1109/TPAMI.2022.3195549. [Google Scholar] [PubMed] [CrossRef]
23. Q. Peng, C. Zheng, and C. Chen, “A dual-augmentor framework for domain generalization in 3D human pose estimation,” in Proc. IEEE Conf. Comput. Vision Patt. Recog. (CVPR), Seattle, WA, USA, 2024, pp. 2240–2249. doi: 10.1109/CVPR52733.2024.00218. [Google Scholar] [CrossRef]
24. A. Kirillov et al., “Segment anything,” in Proc. Int. Conf. Comput. Vision. (ICCV), Paris, France, 2023, pp. 3992–4003. doi: 10.1109/ICCV51070.2023.00371. [Google Scholar] [CrossRef]
Cite This Article
 Copyright © 2025 The Author(s). Published by Tech Science Press.
This work is licensed under a Creative Commons Attribution 4.0 International License , which permits unrestricted use, distribution, and reproduction in any medium, provided the original work is properly cited.
 Downloads
 Citation Tools