
 Submit a Paper
 Propose a Special lssue
 Open Access
ARTICLE

Multi-Head Attention Enhanced Parallel Dilated Convolution and Residual Learning for Network Traffic Anomaly Detection
1 College of Computer Engineering, Jimei University, Xiamen, 361021, China
2 Xiamen Jikuai Technology Co., Ltd., Xiamen, 361000, China
* Corresponding Author: Jian Mao. Email:
Computers, Materials & Continua 2025, 82(2), 2159-2176. https://doi.org/10.32604/cmc.2024.058396
Received 11 September 2024; Accepted 08 November 2024; Issue published 17 February 2025
 View Full Text
 Download PDF
Abstract
Abnormal network traffic, as a frequent security risk, requires a series of techniques to categorize and detect it. Existing network traffic anomaly detection still faces challenges: the inability to fully extract local and global features, as well as the lack of effective mechanisms to capture complex interactions between features; Additionally, when increasing the receptive field to obtain deeper feature representations, the reliance on increasing network depth leads to a significant increase in computational resource consumption, affecting the efficiency and performance of detection. Based on these issues, firstly, this paper proposes a network traffic anomaly detection model based on parallel dilated convolution and residual learning (Res-PDC). To better explore the interactive relationships between features, the traffic samples are converted into two-dimensional matrix. A module combining parallel dilated convolutions and residual learning (res-pdc) was designed to extract local and global features of traffic at different scales. By utilizing res-pdc modules with different dilation rates, we can effectively capture spatial features at different scales and explore feature dependencies spanning wider regions without increasing computational resources. Secondly, to focus and integrate the information in different feature subspaces, further enhance and extract the interactions among the features, multi-head attention is added to Res-PDC, resulting in the final model: multi-head attention enhanced parallel dilated convolution and residual learning (MHA-Res-PDC) for network traffic anomaly detection. Finally, comparisons with other machine learning and deep learning algorithms are conducted on the NSL-KDD and CIC-IDS-2018 datasets. The experimental results demonstrate that the proposed method in this paper can effectively improve the detection performance.Keywords
With the popularization of the Internet of Things (IoT), many advanced technologies are gradually changing people’s lifestyles; however, the increase in the number of IoT devices also means an expansion of the attack surface. Hackers can exploit these vulnerabilities to launch attacks, such as injecting malicious code or conducting man-in-the-middle attacks, that generate abnormal traffic [1]. Network abnormal traffic has triggered various security problems, including distributed denial-of-service attacks, bandwidth abuse, abnormal software propagation, phishing and fraud, botnet activities, cross-site scripting attacks, etc. [2]. These can lead to severe consequences, including information leakage, fraudulent charges, malicious advertisement insertion, and even potential server takeovers by hackers, further resulting in data breaches, tampering, and service disruptions [3,4]. These issues seriously damage users’ legitimate rights and interests, disrupt the order of cyberspace, and hinder the healthy development of the digital economy.
In this context, network traffic anomaly detection becomes particularly important. By continuously monitoring network activities, it can quickly identify abnormal behavior, classify anomalous traffic, and provide detailed analysis reports, thus giving administrators the basis for immediate response measures. The effectiveness of network traffic anomaly detection directly affects the security level of IoT. If the detection accuracy is not high, it can lead to false positives or negatives. Such situations allow malicious activities to infiltrate the undetected system, posing potential threats to the entire network. Therefore, improving the accuracy of network traffic anomaly detection is crucial for strengthening IoT security defense systems. By continuously optimizing anomaly detection algorithms and technical approaches, it is possible to more effectively defend against various cyber-attacks targeting IoT systems, thereby protecting this expanding technological domain from harm.
Qayyum et al. [5] proposed a statistical analysis-based network anomaly traffic detection technique, which focuses on establishing a normal traffic model and setting a normal baseline. When performing anomaly traffic detection, any deviation from the baseline is considered abnormal traffic. However, with the development of IoT, attack methods and abnormal traffic have become increasingly complex and variable. Traditional network traffic anomaly detection methods are no longer able to adapt to such rapid changes. Machine learning has been applied to network traffic anomaly detection, with algorithms such as K-Nearest Neighbor (KNN) [6], Linear Discriminant Analysis (LDA) [7], Support Vector Machine (SVM) [8], Naive Bayes (NB) [9], Decision Tree (DT) [10], and Random Forest (RF) [11] being used to address security issues caused by abnormal network traffic. Deep learning models, with their superior learning capabilities, can efficiently extract complex and deep feature representations from large amounts of information, promptly capturing new attack techniques or abnormal traffic patterns, thus providing more accurate and timely anomaly detection services to respond to security issues caused by abnormal traffic.
Although deep learning techniques provide effective methods for the research of network traffic anomaly detection, with the increasing complexity and variability of emerging network anomalous traffic, existing methods still have the following shortcomings: 1) Due to the complex relationships between network traffic features, existing methods often learn only from local, fixed-scale features, failing to extract the interactive relationships between features at multiple scales. This approach ignores the global associations and interactions between features. 2) In order to increase the receptive field of the model and obtain deeper and more complex features, typically, the network depth is increased, which leads to increased consumption of computational resources.
Based on the aforementioned issues, the main contributions of this paper are as follows:
a) In order to deeply explore the interactions between these features and the dependency relationships spanning wider areas, one-dimensional network traffic is converted into a two-dimensional matrix. In this two-dimensional matrix, the contact surface between each feature and other features increases significantly, not only enhancing the analysis of interactions between features but also enabling the discovery of correlations spanning wider areas. This helps uncover crucial information that may have been overlooked in one-dimensional analysis.
b) A parallel dilated convolutional (pdc) structure with varying convolution kernel sizes is proposed to extract local and global traffic features at multiple scales. By incorporating residual modules into the pdc module, the input’s detailed features are preserved, and the training process is accelerated, making the network converge more easily. This ultimately results in the formation of a res-pdc module. By utilizing res-pdc modules with different dilation rates, it is possible to extract local and global features at multiple scales, capturing multi-scale feature interactions under different receptive fields, while also minimizing the increase in computational resource costs.
c) To independently focus and aggregate information from different feature subspaces, enabling each head to concentrate on different traffic characteristics and help the model better capture the feature dependency relationships in traffic, multi-head attention is incorporated into the Res-PDC model, ultimately forming multi-head attention enhanced parallel dilated convolution and residual learning (MHA-Res-PDC) for network traffic anomaly detection.
d) Experimental results on the NSL-KDD and CIC-IDS-2018 datasets, compared with other machine learning and deep learning algorithms, demonstrate that the proposed method in this paper can effectively capture the spatial features of traffic and the interactive relationships between features, thus improving detection performance.
The main framework of this paper is as follows:
Section 1 provides an overview of the research background, significance, and some fundamental studies related to network traffic anomaly detection. Section 2 summarizes the existing methods for network traffic anomaly detection and their shortcomings. Section 3 mainly introduces the model proposed in this paper. Section 4 presents the experimental results and discussions, comparing and analyzing the proposed algorithm with machine learning algorithms and deep learning algorithms. Section 5 summarizes the improvements of the proposed algorithm in the aspect of network traffic anomaly detection.
As a critical security measure, network traffic anomaly detection aims to sensitively and accurately identify various anomalous phenomena hidden in network data streams, thus effectively ensuring the security and stability of network systems. Deep learning, with its exceptional automatic feature learning capabilities, can capture extremely complex feature structures and efficiently handle large-scale data challenges, demonstrating significant application value in many fields, including network traffic anomaly detection.
Wang et al. [12] proposed an anomaly detection model based on a one-dimensional convolutional neural network and verified through experiments that the model exhibits high accuracy in abnormal traffic classification tasks. Subsequently, to explore the interaction between features, they proposed a network traffic anomaly detection method based on Convolutional Neural Networks (CNN) [13]. This method converts traffic into images, then utilizes these images as input to train the CNN, and finally classifies abnormal traffic. Apart from CNN models, Long Short-Term Memory (LSTM) can also be used for time-series modeling and processing of network traffic. Staudemeyer [14] proposed an LSTM-based network traffic anomaly detection model, which was able to classify abnormal traffic more accurately compared to CNN on the KDD-cup99 dataset. Kim et al. [15] proposed an LSTM-based network traffic anomaly detection method utilizing language modeling. They conducted experiments on the KDD-cup99 [16] dataset and achieved an accuracy rate of 0.998 in binary classification experiments.
Besides CNN and LSTM models that can detect abnormal traffic, these two models can also be fused. Yao et al. [17] constructed a hybrid model combining CNN and LSTM for network traffic anomaly detection. This model cleverly utilizes CNN to capture spatial feature patterns in traffic data, while leveraging the LSTM module to deeply explore its inherent temporal dynamic characteristics. These two types of features are effectively integrated within the model, forming a multi-dimensional and comprehensive feature representation, which enhances the ability to finely characterize network traffic features and significantly improves the accuracy of anomaly detection.
Gao et al. [18] first applied Deep Belief Network (DBN) to the field of network traffic detection and proposed a network traffic anomaly detection method based on DBN. This method exhibits better robustness and generalization capabilities compared to CNN and LSTM. Zhang et al. [19] proposed a network traffic detection model based on DBN and SVM, combining neural networks with machine learning algorithms. Experiments were conducted using the CIC-IDS2017 [20] dataset, and the results showed that compared to traditional machine learning algorithms, this model can automatically extract features and improve the detection of low-frequency traffic. Tang et al. [21] proposed a network traffic detection model based on DBN, a Stacked Autoencoder, and an attention mechanism. This model first automatically extracts features through the Stacked Autoencoder, and then captures important features of the traffic using the attention mechanism. After that, a deep neural network is used to train the model. Experimental results show that the model achieves good accuracy in detecting some low-frequency attack traffic.
Wang et al. [22] innovatively proposed a traffic anomaly detection method that integrates an attention mechanism. This method first utilizes stacked sparse autoencoder technology to extract deep features from network traffic data. Then, an attention mechanism is introduced to focus on the most important features, thereby enhancing the model’s sensitivity to abnormal traffic. Finally, a Bidirectional Gated Recurrent Unit (Bi-GRU) is employed to classify and detect the attention-weighted traffic features. Jun et al. [23] proposed an RNN-based traffic detection model that utilizes Gated Recurrent Units (GRU) to extract temporal features of traffic and a memory module to extract overall features of traffic. This model addresses the issue of low detection accuracy for time-series traffic data in traditional network traffic detection models. Xiong et al. [24] proposed a network traffic detection method based on a weighted extreme learning machine. This method uses an improved slime mold optimization algorithm to optimize the parameters of the weighted extreme learning machine, aiming to achieve optimal classification results. Experiments show that this method can improve the detection rate of small samples. Yun et al. [25] proposed a network traffic detection model based on cost-sensitive constraints. For the difficulty of classifying imbalanced traffic data, this model utilizes a cost-sensitive algorithm to assign costs to features of different categories, thereby obtaining optimal features. Experimental results show that this method effectively addresses the impact of imbalanced data on model training, thus improving the detection accuracy of minority classes.
Gan et al. [26] proposed a CNN-based network traffic detection model. This model first performs oversampling on minority samples and introduces a loss function based on a gradient coordination mechanism, which pays more attention to samples that are difficult to classify. Experiments show that this model effectively addresses the issue of model bias caused by imbalanced data and improves detection performance. Mu et al. [27] constructed a composite model that integrates CNN, LSTM, and an attention mechanism for network traffic anomaly detection. This model demonstrated outstanding performance on the CIRA-CIC-DoHBrW-2020 dataset, achieving a detection accuracy rate of up to 99.41%. Subsequently, Yang et al. [28] proposed a traffic detection method that combines a double-layer bidirectional LSTM with a hierarchical attention mechanism. Evaluation results on public datasets show that this method outperforms many traditional machine learning methods in terms of accuracy, recall, F1-Score, and other evaluation metrics.
As shown in Fig. 1, the overall design process of the whole network model begins with the collection and preprocessing of datasets, which include NSL-KDD and CIC-IDS-2018. The data preprocessing steps involve handling missing values, encoding categorical features, normalization, and generating a two-dimensional matrix. Next, the processed data is fed into the network model for training and prediction, ultimately yielding the final classification results.
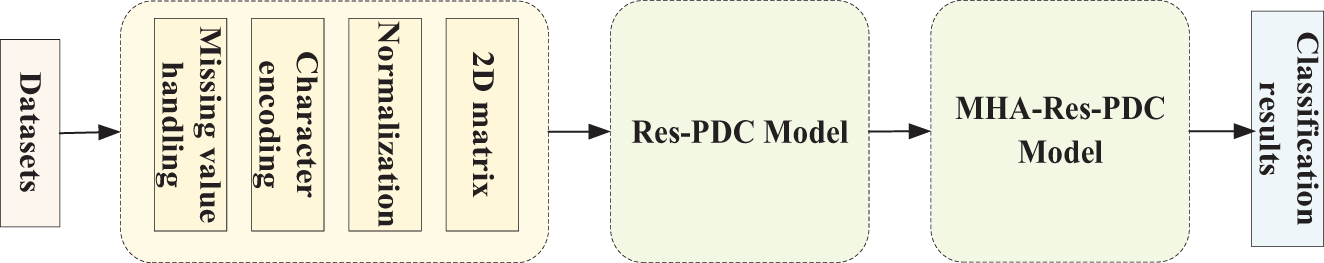
Figure 1: The overall design process of the whole model
The process of data preprocessing is illustrated in Fig. 2.

Figure 2: The process of data preprocessing
Firstly, for network traffic data, during transmission, packets may be lost or damaged due to various reasons such as network failures or hardware issues, resulting in incomplete data at the destination. In the CIC-IDS-2018 dataset, some types of data may have missing values. However, the number of samples with missing values is not significant, and deleting these samples with missing values will not significantly impact the performance of the model.
Secondly, since some features of network traffic are categorical, it is necessary to perform one-hot encoding on these categorical features. This ensures the uniqueness of the feature vectors after encoding. In the NSL-KDD dataset, categorical features such as protocol type, flag, and service are encoded. For example, the one-hot encodings for the tcp, udp, and icmp features of protocol type can be represented as (1,0,0), (0,1,0), and (0,0,1), respectively. The attribute values of flag and service can be represented as 70-dimensional and 11-dimensional binary encodings, respectively. In the CIC-IDS-2018 dataset, there are no categorical features, so there is no need to convert categorical features into numerical values or perform one-hot encoding. Therefore, only the temporal features need to be transformed into numerical form to adapt to the model training.
Then, since each type of feature in network traffic has a different scale, it is necessary to normalize the One-Hot encoded features to eliminate the scale differences. This prevents the model from being overly sensitive to a single feature and avoids an imbalance in feature weights due to different scales.
where
Finally, generation of the two-dimensional matrix. The normalized features are filtered using a variance-based feature selection method to eliminate those features that contribute little to the model.
where
3.1.2 The Design of the Res-PDC Model
In network traffic anomaly detection, the size of the receptive field can affect feature extraction capability of the model, and a larger receptive field can extract features that contain more global information. Firstly, the parallel dilated convolution module (pdc) utilizes convolution kernels of 1 × 1, 3 × 3, and 5 × 5. Through a parallel structure, it captures features at different scales, resulting in a richer feature representation.
Secondly, before the 3 × 3 and 5 × 5 convolutions, 1 × 1 convolutions were added, which can significantly reduce the number of computational parameters while maintaining performance and without reducing the size of the feature map, making the network more efficient. Then, average pooling was incorporated into the fourth layer of the module. By undersampling the average value within a local region, it reduces information redundancy and allows the network to focus more on global features, preserving global information in the traffic flow. This helps prevent overfitting of the model. After average pooling, a 1 × 1 convolution is added, which can maintain consistency in the number of output channels without changing the size of the output feature map. A pdc module is formed.
Finally, a 1 × 1 convolution was added as a residual to the pdc module, enabling the network to retain detailed features from the input and prevent the loss of some less important features. This accelerates the training process and facilitates network convergence. A module res-pdc was formed, as shown in Fig. 3, which depicts a schematic diagram of the res-pdc module.

Figure 3: The structure design of res-pdc module
The dilation rates in the res-pdc module were set to 1 and 2, resulting in two res-pdc modules with different dilation rates. Firstly, the convolutions in the first res-pdc module used a dilation rate of 1, which is equivalent to regular convolutions. By utilizing different-sized convolution kernels, it extracts features of various dimensions and captures local features of the traffic flow, forming a mechanism for multi-scale feature fusion. Secondly, after the first res-pdc module, average pooling was added. By reducing the size of the feature map, it can decrease the computational cost for subsequent layers and prevent overfitting. The average pooling operation also helps to retain more detailed features of the input. Then, a res-pdc module with a dilation rate of 2 is concatenated after the average pooling. This increases the receptive field of the network, enabling it to better capture contextual information of the traffic flow and learn more comprehensive features without adding additional computational burden. Finally, a max pooling layer is serially connected after the res-pdc module with a dilation rate of 2. By finding the maximum value within each pooling window and using it as the output, it helps the network focus on more salient features. This completes the construction of the Res-PDC model.
The final Res-PDC model was constructed as shown in Fig. 4. The entire model first includes the construction of the pdc module, which is then combined with residuals to form a res-pdc module. Subsequently, the model passed through a res-pdc module with a dilation rate of 1, followed by average pooling. Then, it goes through another res-pdc module with a dilation rate of 2, with the addition of max pooling. Finally, after flatten and fully connected layers, the classification detection is completed.
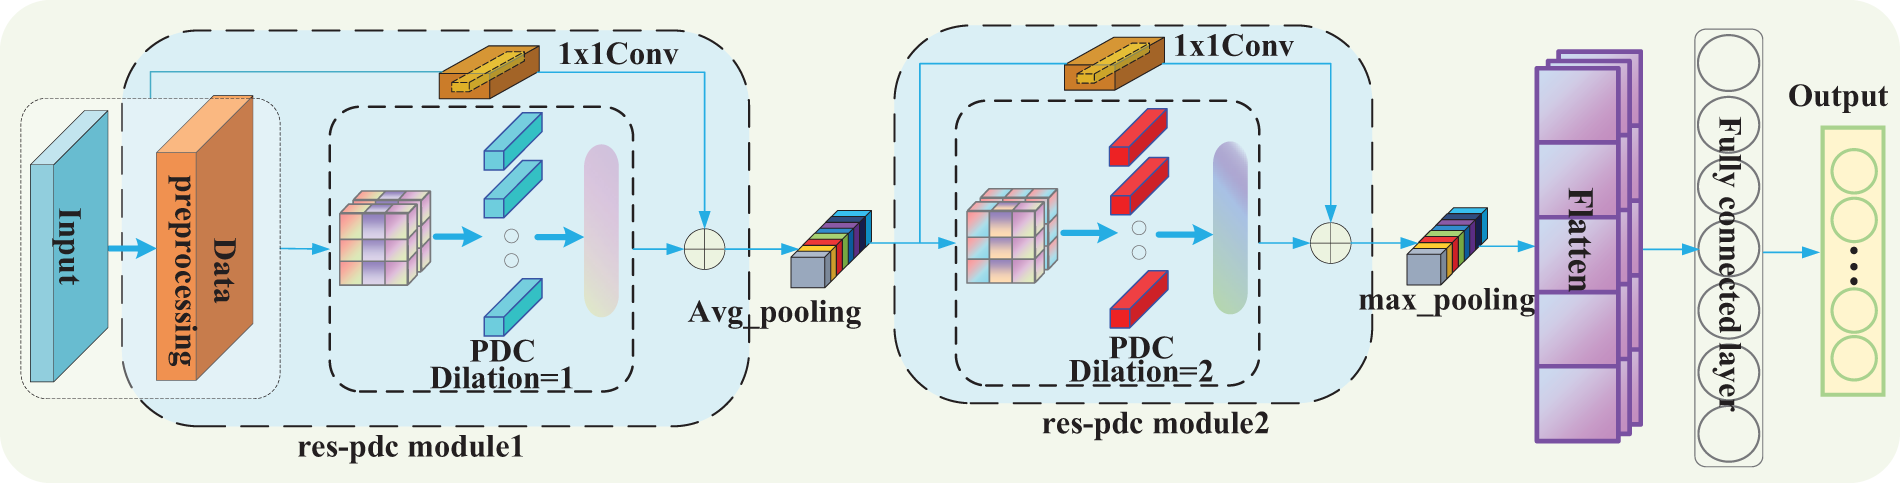
Figure 4: The model structure of Res-PDC
Firstly, the multi-head attention is able to capture the relationships between features from different attention distributions. It allows the model to focus on and integrate information in different subspaces, thereby generating richer and more comprehensive feature representations. Secondly, parallel dilated convolutions excel at capturing multi-scale features. Incorporating the multi-head attention into the Res-PDC model can further enhance the interaction between features based on this foundation. Through multi-head attention, the model can weight and combine features at different scales, leading to a more nuanced understanding and distinction between normal and abnormal traffic flows. The steps to calculate the weighted average of multi-head attention are as follows.
Step 1: Initialize three vectors, namely
Step 2: Calculate the
Step 3: Finally, multiply each
By performing multiple linear transformations on the original
Finally, by incorporating the multi-head attention into the Res-PDC model, a network traffic detection architecture named MHA-Res-PDC is formed, which combines the advantages of spatial multi-scale perception and attention mechanism. The final model structure is shown in Fig. 5.
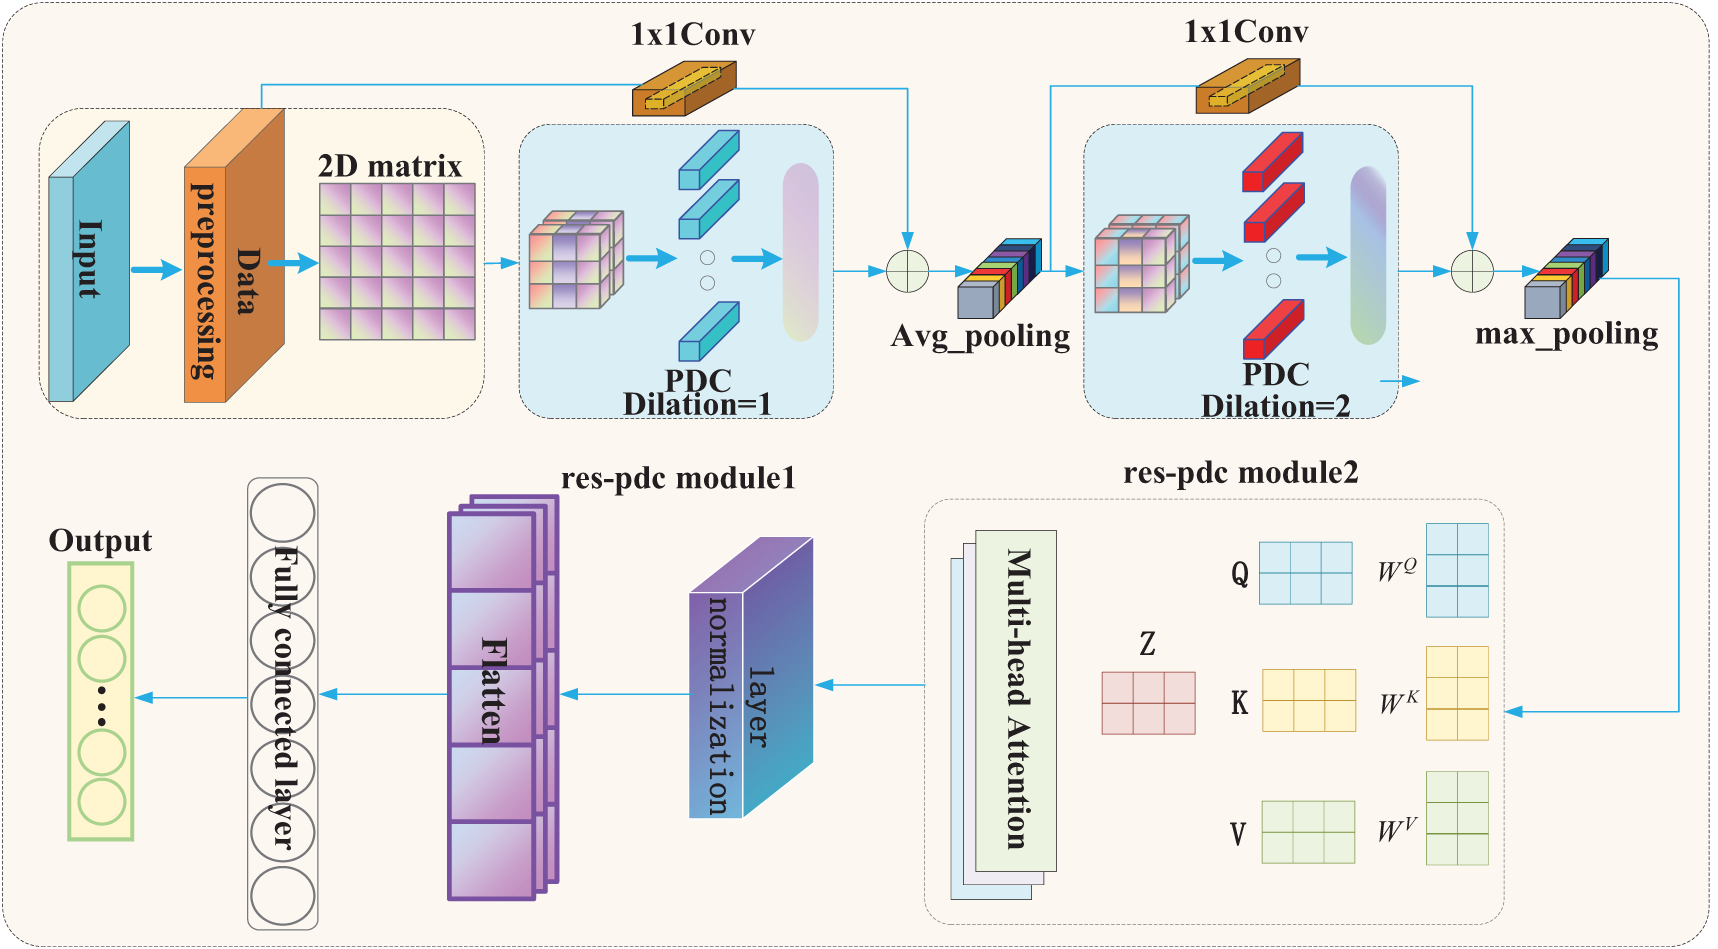
Figure 5: The model structure of MHA-Res-PDC
4 Experiments Results and Discussions
This paper selects the NSL-KDD and CIC-IDS-2018 datasets. The NSL-KDD dataset categorizes network traffic into five major classes: Normal, DoS, R2L, U2R, and Probe. In the NSL-KDD dataset, using all the training sets will make the model difficult to train and take a long time. To improve model training and enhance the model’s generalization ability, this experiment selects KDDTrain+ as the training set and KDDTest+ as the test set. Table 1 summarizes the number of samples in the training and test datasets in NSL-KDD.

The CIC-IDS-2018 dataset includes benign traffic and attack traffic, where the attack traffic comprises eight categories: Brute Force FTP (File Transfer Protocol), Brute Force SSH (Secure Shell), DoS, Heartbleed, Web Attack, Infiltration, Botnet, and DDos. These eight types of malicious traffic are further divided into 14 specific malicious attack traffic types. Each data entry contains 6 basic features, 77 functional features, and 2 label features, totaling 85 features. Table 2 summarizes the number of samples in the training and test datasets in CIC-IDS-2018.

In machine learning and deep learning, evaluation metrics are used to assess the predictive effectiveness of models. In this experimental study, several commonly used metrics are adopted as evaluation indicators, including Accuracy, Precision, Recall, F1-Score, and the Receiver Operating Characteristic (ROC) Curve.
where
The ROC curve displays the performance of a model for different classes by plotting the True Positive Rate (TPR) on the vertical axis and the False Positive Rate (FPR) on the horizontal axis. The closer the curve is to the upper left corner (i.e., high TPR and low FPR), the better the classification performance is.
To more accurately analyze the threats posed by abnormal traffic, it is necessary to precisely detect the specific types of abnormal traffic. Therefore, this paper conducted a multiclass classification experiment for network traffic anomaly detection. Compared to binary classification models that only distinguish between “normal” and “abnormal”, this approach is better suited to adapting to the dynamic changes in network security threats. To validate the effectiveness of the proposed method, two datasets were selected: NSL-KDD and CIC-IDS-2018.
Firstly, the Res-PDC model was compared with classical machine learning algorithms. Tables 3 and 4 show the experimental results comparing the Res-PDC model with DT, NB, and RF machine learning algorithms on the NSL-KDD and CIC-IDS-2018 datasets.

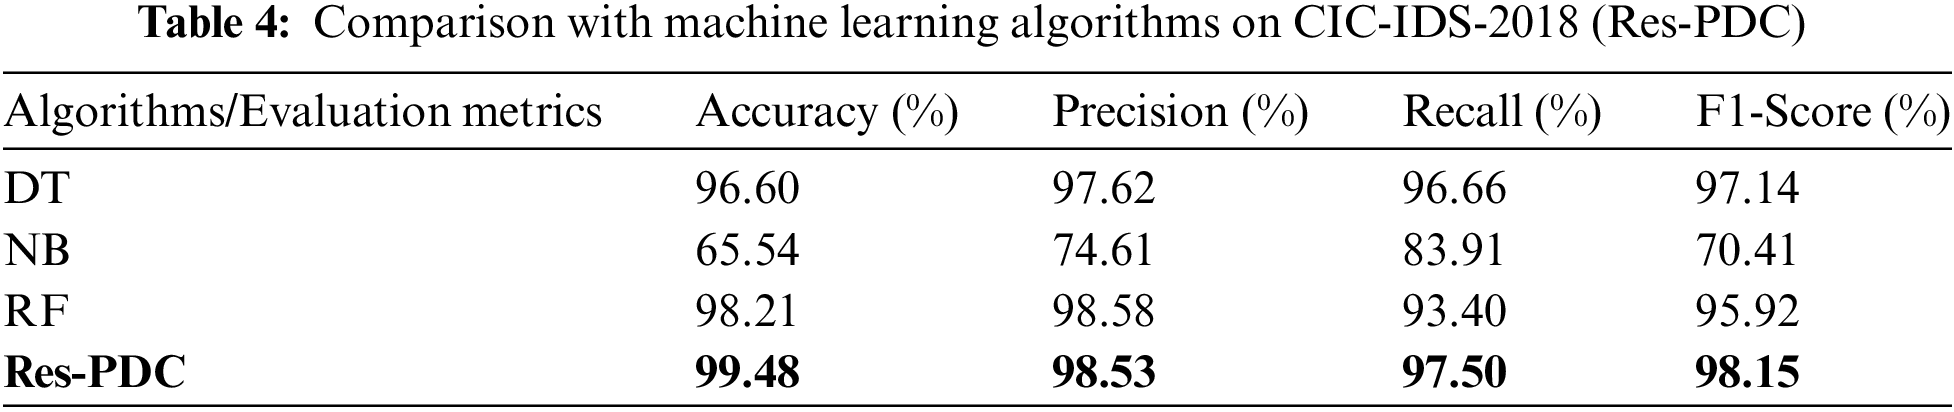
According to Table 3, it can be concluded that on the NSL-KDD dataset, the Res-PDC algorithm achieved favorable results in all four-evaluation metrics compared to the DT, NB, and RF machine learning algorithms. Specifically, compared to the DT algorithm, the Res-PDC algorithm improved the Accuracy, Precision, Recall, and F1-Score by 4.13%, 7.87%, 3.42%, and 5.48%, respectively. According to Table 4, on the CIC-IDS-2018 dataset, compared to the RF algorithm, the Res-PDC model improved the Accuracy, Recall, and F1-Score by 1.27%, 4.1%, and 2.23%, respectively. The analysis shows that machine learning algorithms like DT, NB, and RF cannot effectively extract features or capture the complex relationships between features when dealing with high-dimensional network traffic data. However, the Res-PDC model is able to effectively capture both local and global features, resulting in excellent classification performance.
Secondly, the Res-PDC model was also compared with deep learning algorithms. Tables 5 and 6 show the experimental results comparing the Res-PDC model with CNN [29], GRU, Bi-GRU [30], and Transformer deep learning algorithms on the NSL-KDD and CIC-IDS-2018 datasets.


According to Table 5, on the NSL-KDD dataset, the Res-PDC model achieved favorable results in all four evaluation metrics compared to the CNN [29], GRU, Bi-GRU [30] and Transformer algorithms. The Res-PDC model exhibits better detection performance compared to other algorithms. According to Table 6, on the CIC-IDS-2018 dataset, compared to the Transformer algorithm, the Res-PDC model improved the Precision, Recall, and F1-Score by 1.32%, 5.09% and 4.00%, respectively.
Analysis shows that while CNN [29] can extract local features, it does not fully represent the spatial characteristics of network traffic. Although GRU and Bi-GRU [30] capture long-term dependencies between traffic flows, they are clearly insufficient in extracting spatial features. Transformer may encounter performance bottlenecks when handling long sequences, unable to capture sufficient feature information. However, the proposed Res-PDC model, by utilizing PDC modules with different dilation rates and employing multi-scale dilated convolution operations, extracts local and global features at different scales, obtaining features with varying receptive fields and resulting in a comprehensive spatial feature representation.
Finally, multi-head attention is added to the Res-PDC model, resulting in the final MHA-Res-PDC model. Here, we first conducted ablation studies on the final model MHA-Res-PDC, and then compared it with other algorithms. The ablation studies are shown in Table 7, indicating that the combination of PDC + Residual + Multi-head Attention yields the best performance.

To validate the effectiveness of the final model MHA-Res-PDC, comparisons were made with more recent algorithms on the NSL-KDD and CIC-IDS-2018 datasets.
According to Tables 8 and 9, firstly it can be concluded that the introduction of the multi-head attention into the Res-PDC model, resulting in the MHA-Res-PDC model, led to significant improvements in all four-evaluation metrics compared to Res-PDC. This demonstrates the effectiveness of adding the multi-head attention, which allows the model to focus to and integrate information across different feature subspaces.

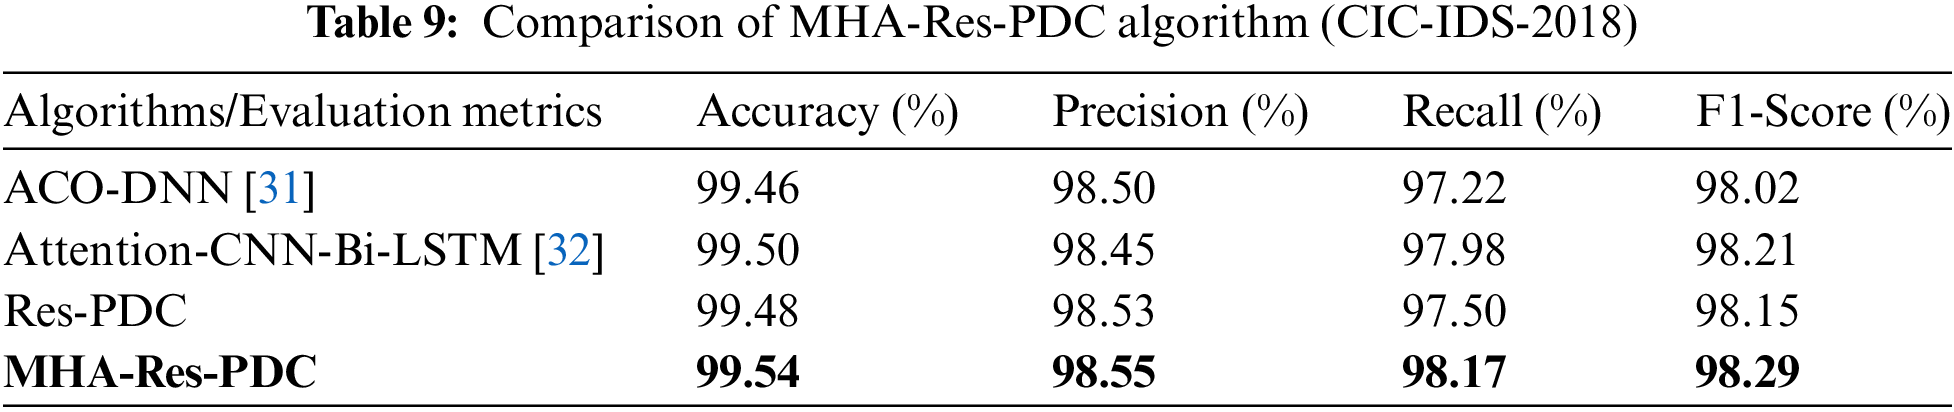
Furthermore, the final model MHA-Res-PDC was compared with Res-PDC, ACO-DNN [31], and Attention-CNN-Bi-LSTM [32], the experimental results show that MHA-Res-PDC significantly outperforms Res-PDC, but Res-PDC did not perform as well as Attention-CNN-Bi-LSTM [32] overall. The reason for this is that Attention-CNN-Bi-LSTM [32] combines attention mechanisms, one-dimensional convolutional neural networks, and bidirectional long short-term memory networks to extract spatial and temporal features, while utilizing the attention mechanism to help the model focus on important parts of the input data. Although Res-PDC has the ability to extract multi-scale features, it lacks the capability to capture critical features that are important for network traffic classification.
Finally, this paper calculated the model parameter counts of our proposed model and the contrastive models. The parameter counts for Res-PDC and MHA-Res-PDC were found to be 77,449 and 99,822, respectively. Additionally, the parameter counts were calculated for models CNN [29], GRU, Bi-GRU [30], Transformer, ACO-DNN [31], and Attention-CNN-Bi-LSTM [32], which were 555,217, 456,345, 2,930,193, 850,543, 894,523, and 1,112,023, respectively. Through experiments, it was found that the final proposed model, MHA-Res-PDC, has the least number of model parameters, indicating that this model possesses efficient detection capabilities.
As shown in Fig. 6, the ROC curve diagram compares the performance of MHA-Res-PDC with ACO-DNN [31], Attention-CNN-Bi-LSTM [32], and Res-PDC on the NSL-KDD dataset. Similarly, Fig. 7 depicts the ROC curve diagram comparing the performance of MHA-Res-PDC with ACO-DNN [31], Attention-CNN-Bi-LSTM [32], and Res-PDC on the CIC-IDS-2018 dataset.
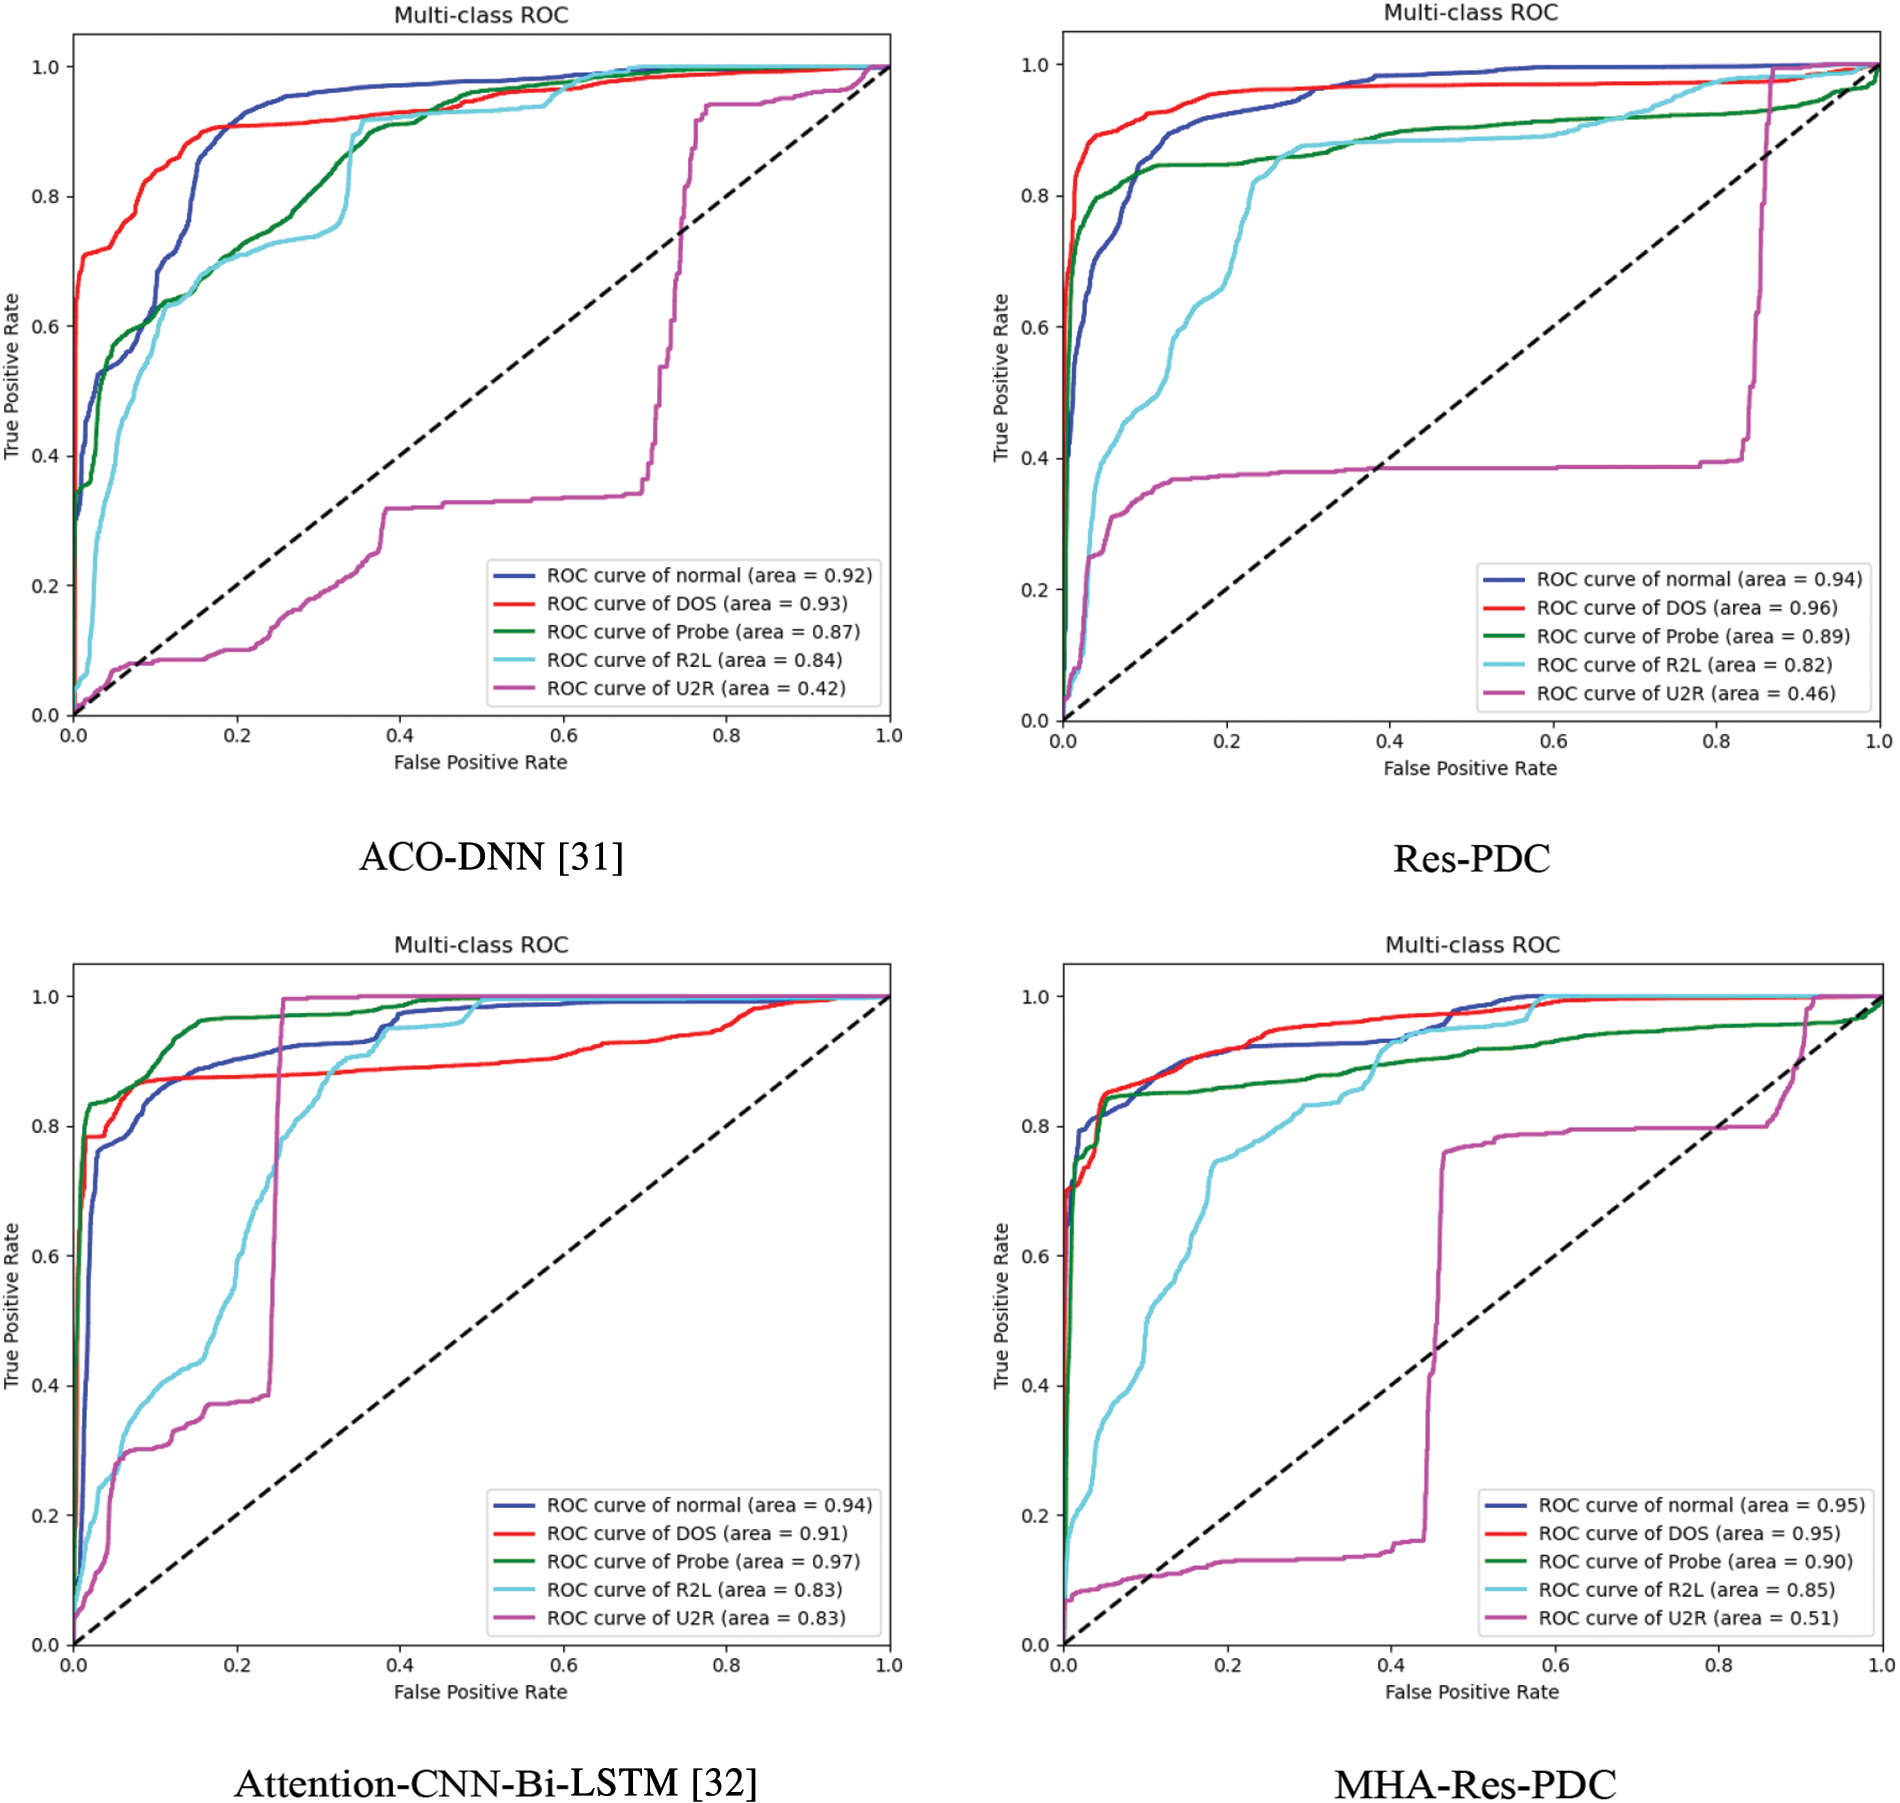
Figure 6: ROC curve diagram of four models (NSL-KDD)
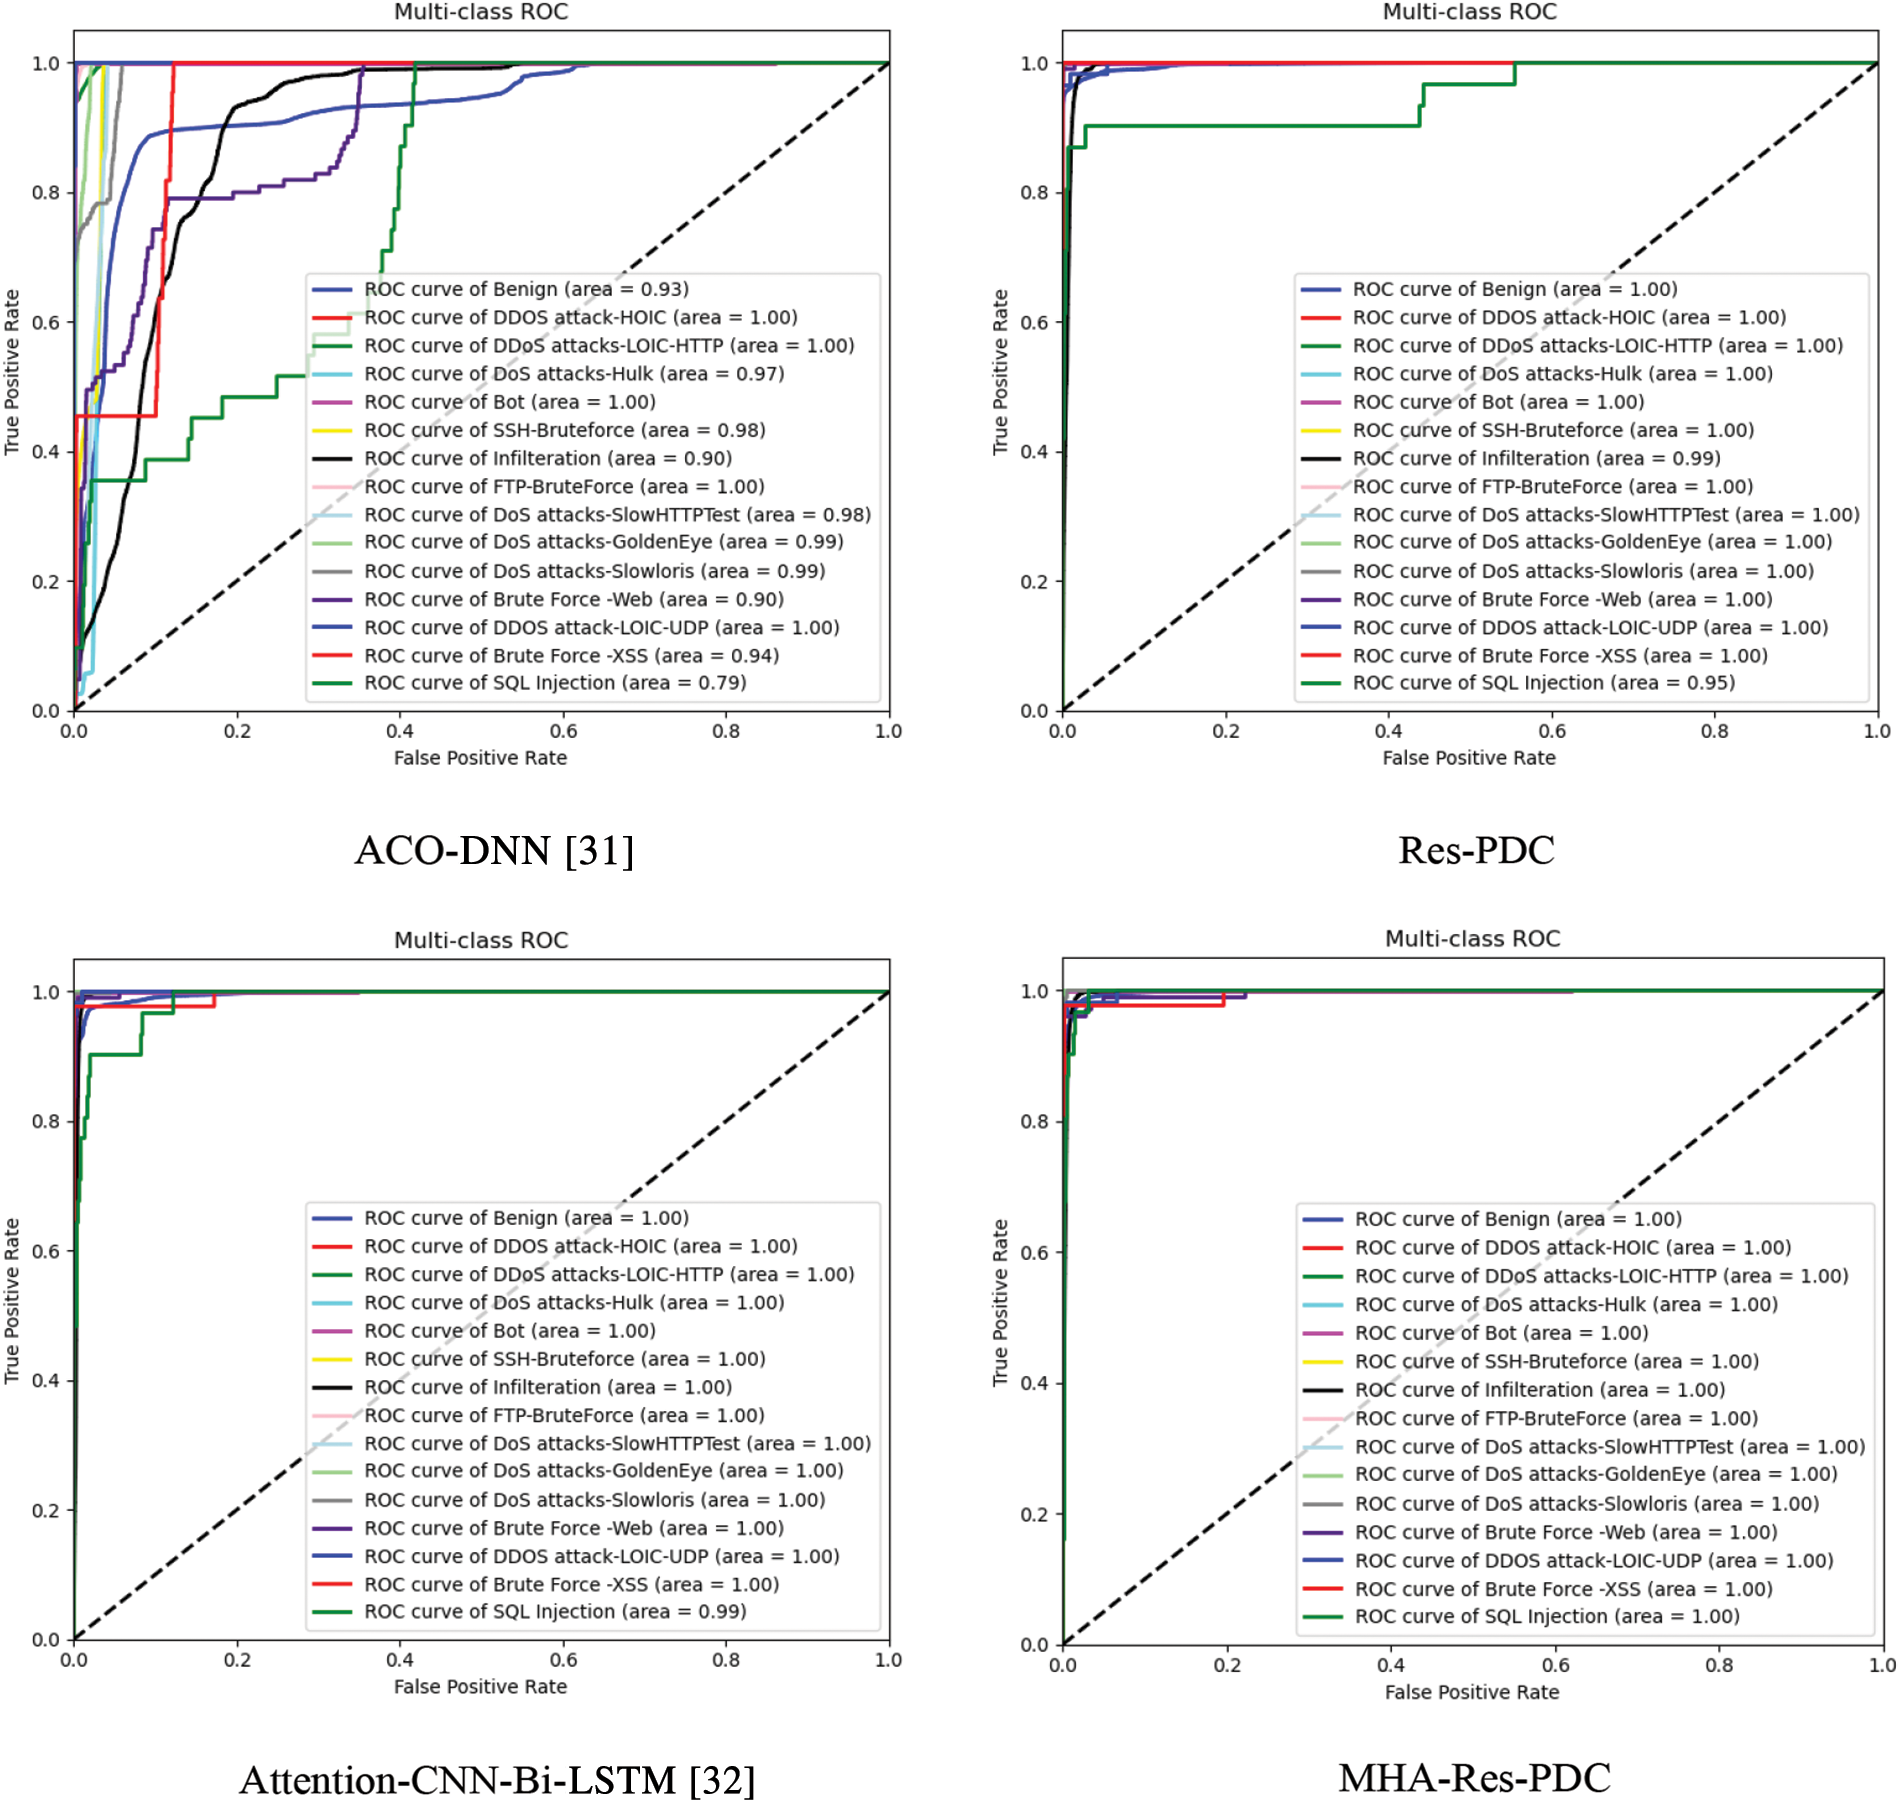
Figure 7: ROC curve diagram of four models (CIC-IDS-2018)
From Fig. 6, for the categories of Normal, DoS, and R2L, the ROC curve of the MHA-Res-PDC model is closer to the upper left corner compared to the other three algorithms, indicating good classification performance. Meanwhile, the closer the Area Under the Curve (AUC) is to 1, the better the classification performance. For the categories of Normal, DoS, and R2L, the AUC values of the Res-PDC model are 0.95, 0.95, and 0.90, respectively, demonstrating excellent classification performance. However, for the rare categories of R2L and U2R, since some classes in the test set do not exist in the training set, some hidden features may not be well learned. For these rare categories, the AUC values of the MHA-Res-PDC model are 0.85 and 0.51, indicating relatively low detection rates. Nevertheless, compared to the AUC values of the other three algorithms, MHA-Res-PDC still achieves the highest AUC in these categories. In summary, the Res-PDC model exhibits good classification performance, particularly for the majority of categories. While the detection rates for the rare categories are not as high, the MHA-Res-PDC model still manages to achieve the best AUC values among the compared algorithms.
From Fig. 7, it can be observed that in most categories such as Benign, DDOS attack-HOIC, and DDoS attacks-LOIC-HTTP, the ROC curve of the MHA-Res-PDC model is closer to the upper left corner compared to the other three algorithms, indicating good classification performance. Furthermore, the AUC values of the MHA-Res-PDC are nearly 1.00, which signifies excellent classification results. However, in the rare category of SQL Injection, the AUC value of the MHA-Res-PDC model is nearly 1.00, which is also the largest among the AUC values of the other three models.
In summary, the MHA-Res-PDC model demonstrates good classification performance in both majority and minority categories.
The paper proposes a network traffic anomaly detection method based on parallel dilated convolutions and residual learning. The designed parallel dilated convolution module is used to extract more comprehensive spatial features, and its incorporation into the residual structure allows the network to retain input details, accelerate the training process, and facilitate convergence. By utilizing parallel dilated convolutions with different dilation rates and residual learning modules, the method explores the interaction between features, extracts multi-scale features under different receptive fields, and reduces the cost of computational resources. Furthermore, the addition of multi-head attention enables the model to focus more on important features in feature subspaces, learning more diverse feature correlations. Ultimately, a network traffic detection model with multi-scale feature fusion and attention mechanism using minimal computational resources is formed. Effective validation on the NSL-KDD and CIC-IDS-2018 datasets shows that the proposed method outperforms the compared algorithms. However, while the proposed method achieves the best performance on the NSL-KDD dataset, there are 16 types of malicious traffic in the test set that do not exist in the training set, representing new malicious attack traffic. Additionally, the extreme imbalance in the dataset’s categories leads to low detection rates for minority class samples, requiring further improvement in overall performance. Real-world network traffic samples are extremely unbalanced. Therefore, future research will focus on effectively addressing sample imbalance to solve the issue of model bias during training and improve detection accuracy.
Acknowledgement: The authors thank everyone who helped during the research and preparation of the article.
Funding Statement: This work was supported by the Xiamen Science and Technology Subsidy Project (No. 2023CXY0318).
Author Contributions: Conceptualization, Kai Huang; Methodology, Jian Mao; Formal analysis, Guorong Qi; Resources, Jinliang Lin; Writing—original draft, Guorong Qi; Writing—review & editing, Zhengxian You. All authors reviewed the results and approved the final version of the manuscript.
Availability of Data and Materials: The datasets are publicly available. The NSL-KDD dataset from https://www.unb.ca/cic/datasets/nsl.html and CIC-IDS-2018 dataset from https://www.unb.ca/cic/datasets/ids-2018.html (accessed on 10 August 2024).
Ethics Approval: Not applicable.
Conflicts of Interest: The authors declare no conflicts of interest to report regarding the present study.
References
1. K. Huang, M. Siegel, and S. Madnick, “Systematically understanding the cyber attack business: A survey,” ACM Comput. Surv., vol. 51, no. 4, pp. 1–36, Jul. 2018. doi: 10.1145/3199674. [Google Scholar] [CrossRef]
2. N. Neshenko, E. Bou-Harb, J. Crichigno, G. Kaddoum, and N. Ghani, “Demystifying IoT security: An exhaustive survey on IoT vulnerabilities and a first empirical look on Internet-scale IoT exploitations,” IEEE Commun. Surv. Tutorials, vol. 21, no. 3, pp. 2702–2733, Apr. 2019. doi: 10.1109/COMST.2019.2910750. [Google Scholar] [CrossRef]
3. B. Zhao, J. Yuan, X. Liu, Y. Wu, H. H. Pang and R. H. Deng, “SOCI: A toolkit for secure outsourced computation on integers,” IEEE Trans. Inf. Forensics Secur., vol. 17, pp. 3637–3648, Oct. 2022. doi: 10.1109/TIFS.2022.3211707. [Google Scholar] [CrossRef]
4. A. Kumari, S. Tanwar, S. Tyagi, and N. Kumar, “Verification and validation techniques for streaming big data analytics in internet of things environment,” IET Netw., vol. 8, no. 3, pp. 155–163, Nov. 2019. doi: 10.1049/iet-net.2018.5187. [Google Scholar] [CrossRef]
5. A. Qayyum, M. H. Islam, and M. Jamil, “Taxonomy of statistical based anomaly detection techniques for intrusion detection,” in Proc. IEEE Symp. Emerg. Technol., Sep. 2005, pp. 270–276. doi: 10.1109/ICET.2005.1558893. [Google Scholar] [CrossRef]
6. J. Tian, M. H. Azarian, and M. Pecht, “Anomaly detection using self-organizing maps-based k-nearest neighbor algorithm,” PHM Soc. Eur. Conf., vol. 2, no. 1, pp. 1–9, Jul. 2014. doi: 10.36001/phme.2014.v2i1.1554. [Google Scholar] [CrossRef]
7. F. Iglesias and T. Zseby, “Analysis of network traffic features for anomaly detection,” Mach. Learn., vol. 101, no. 1, pp. 59–84, Dec. 2015. doi: 10.1007/s10994-014-5473-9. [Google Scholar] [CrossRef]
8. T. Shon and J. Moon, “A hybrid machine learning approach to network anomaly detection,” Inf. Sci., vol. 177, no. 18, pp. 3799–3821, Sep. 2007. doi: 10.1016/j.ins.2007.03.025. [Google Scholar] [CrossRef]
9. S. Mukherjee and N. Sharma, “Intrusion detection using naive Bayes classifier with feature reduction,” Procedia Technol., vol. 4, no. 7–8, pp. 119–128, 2012. doi: 10.1016/j.protcy.2012.05.017. [Google Scholar] [CrossRef]
10. K. Rai, M. S. Devi, and A. Guleria, “Decision tree based algorithm for intrusion detection,” Int. J. Adv. Netw. Appl., vol. 7, no. 4, pp. 2828–2834, 2016. [Google Scholar]
11. R. Primartha and B. A. Tama, “Anomaly detection using random forest: A performance revisited,” in 2017 Int. Conf. Data Softw. Eng. (ICoDSE), 2017, pp. 1–6. doi: 10.1109/ICODSE. [Google Scholar] [CrossRef]
12. W. Wang, M. Zhu, J. Wang, X. Zeng, and Z. Yang, “End-to-end encrypted traffic classification with one-dimensional convolution neural networks,” in 2017 EEE Int. Conf. Intell. Secur. Inform. (ISI), Aug. 2017, pp. 43–48. doi: 10.1109/ISI.2017.8004872. [Google Scholar] [CrossRef]
13. W. Wang, M. Zhu, X. Zeng, X. Ye, and Y. Sheng, “Malware traffic classification using convolutional neural network for representation learning,” in Int. Conf. Inf. Netw. (ICOIN), Apr. 2017, pp. 712–717. doi: 10.1109/ICOIN.2017.7899588. [Google Scholar] [CrossRef]
14. R. C. Staudemeyer, “Applying long short-term memory recurrent neural networks to intrusion detection,” Comput. J., vol. 56, no. 1, pp. 136–154, Jul. 2015. doi: 10.18489/SACJ.V56I1.248. [Google Scholar] [CrossRef]
15. J. Kim, J. Kim, T. Thu H.L., and H. Kim, “Long short term memory recurrent neural network classifier for intrusion detection,” in Int. Conf. Platform Technol. Service (PlatCon), Apr. 2016, pp. 1–5. doi: 10.1109/PlatCon.2016.7456805. [Google Scholar] [CrossRef]
16. R. Bala and R. Nagpal, “A review on DKDD-cup99 and NSL_KDD dataset,” Int. J.Adv. Res. Comput. Sci., vol. 10, no. 2, pp. 64–67, Apr. 2019. doi: 10.26483/ijarcs.v10i2.6395. [Google Scholar] [CrossRef]
17. R. Yao, N. Wang, Z. Liu, P. Chen, and X. Sheng, “Intrusion detection system in the advanced metering infrastructure: A cross-layer feature-fusion CNN-LSTM-based approach,” Sensors, vol. 21, no. 2, Jan. 2021, Art. no. 626. doi: 10.3390/s21020626. [Google Scholar] [PubMed] [CrossRef]
18. N. Gao, L. Gao, Q. Gao, and H. Wang, “An intrusion detection model based on deep belief networks,” in 2014 Second Int. Conf. Adv. Cloud Big Data, 2014, pp. 247–252. doi: 10.1109/CBD.2014.41. [Google Scholar] [CrossRef]
19. H. Zhang, Y. Li, Z. Lv, A. K. Sangaiah, and T. Huan, “A real-time and ubiquitous network attack detection based on deep belief network and support vector machine,” IEEE/CAA J. Automatica Sinica, vol. 7, no. 3, pp. 790–799, Mar. 2020. doi: 10.1109/JAS.2020.1003099. [Google Scholar] [CrossRef]
20. A. Rosay, F. Carlier, E. Cheval, and P. Leroux, “From CIC-IDS2017 to LYCOS-IDS2017: A corrected dataset for better performance,” in IEEE/WIC/ACM Int. Conf. Web Intell. Intell. Agent Technol., 2021, pp. 570–575. [Google Scholar]
21. C. Tang, N. Luktarhan, and Y. Zhao, “SAAE-DNN: Deep learning method on intrusion detection,” Symmetry, vol. 12, no. 10, Oct. 2020, Art. no. 1695. doi: 10.3390/sym12101695. [Google Scholar] [CrossRef]
22. J. Wang, N. Chen, J. Yu, Y. Jin, and Y. Li, “An efficient intrusion detection model combined bidirectional gated recurrent units with attention mechanism,” in 2020 7th Int. Conf. Behav. Soc. Comput. (BESC), Nov. 2020, pp. 1–6. doi: 10.1109/BESC51023.2020.9348310. [Google Scholar] [CrossRef]
23. L. Jun, Z. X. Song, Y. L. Hai, Z. L. Shou, and G. S. Jian, “Network intrusion detection method based on GRU-RNN,” (in ChineseJ. Harbin Eng. Univ., vol. 42, no. 6, pp. 879–884, 2021. [Google Scholar]
24. X. Tang, L. Ge, G. F. Zhang, and D. H. Qin, “A intrusion detection algorithm based on improved slime mould algorithm and weighted extreme learning machine,” in 2021 4th Int. Conf. Artif. Intell. Big Data (ICAIBD), Jun. 2021, pp. 157–161. doi: 10.1109/ICAIBD51990.2021.9458967. [Google Scholar] [CrossRef]
25. L. Yun, F. Z. Wen, and Z. Yi, “Research on optimization of intrusion detection feature extraction using cost-constrained algorithm,” Comput. Eng. Sci., vol. 44, no. 3, pp. 447–453, 2022. [Google Scholar]
26. B. Gan, Y. Chen, Q. Dong, J. Guo, and R. Wang, “A convolutional neural network intrusion detection method based on data imbalance,” J. Supercomput., vol. 78, no. 18, pp. 19401–19434, Jun. 2022. doi: 10.1007/s11227-022-04633-x. [Google Scholar] [CrossRef]
27. J. Mu, H. He, L. Li, S. Pang, and C. Liu, “A hybrid network intrusion detection model based on CNN-LSTM and attention mechanism,” in Int. Conf. Front. Cyber Secu., Singapore, Springer Singapore, Dec. 2021, pp. 214–229. doi: 10.1007/978-981-19-0523-0. [Google Scholar] [CrossRef]
28. Y. Yang, S. Tu, R. H. Ali, H. Alasmary, M. Waqas and M. N. Amjad, “Intrusion detection based on bidirectional long short-term memory with attention mechanism,” Comput. Mater. Contin., vol. 74, no. 1, pp. 801–815, 2023. doi: 10.32604/cmc.2023.031907. [Google Scholar] [CrossRef]
29. K. Wu, Z. Chen, and W. Li, “A novel intrusion detection model for a massive network using convolutional neural networks,” IEEE Access, vol. 6, pp. 50850–50859, Sep. 2018. doi: 10.1109/ACCESS.2018.2868993. [Google Scholar] [CrossRef]
30. Y. Lin, J. Wang, Y. Tu, L. Chen, and Z. Dou, “Time-related network intrusion detection model: A deep learning method,” in 2019 IEEE Global Commun. Conf. (GLOBECOM), Waikoloa, HI, USA, Dec. 2019, pp. 1–6. doi: 10.1109/GLOBECOM38437.2019.9013302. [Google Scholar] [CrossRef]
31. J. K. Samriya, R. Tiwari, X. C. Cheng, R. K. Singh, A. Shankar and M. Kumar, “Network intrusion detection using ACO-DNN model with DVFS based energy optimization in cloud framework, Sustainable Computing,” Inform. Syst., vol. 35, no. 4, Sep. 2022, Art. no. 100746. doi: 10.1016/j.suscom.2022.100746. [Google Scholar] [CrossRef]
32. Z. N. Yin, H. L. Ma, and T. Hu, “A traffic anomaly detection method based on the joint model of attention mechanism and one-dimensional convolutional neural network-bidirectional long short term memory,” J. Electron. Inf. Technol., vol. 45, no. 10, pp. 3719–3728, 2023. doi: 10.11999/JEIT220959. [Google Scholar] [CrossRef]
Cite This Article
 Copyright © 2025 The Author(s). Published by Tech Science Press.
This work is licensed under a Creative Commons Attribution 4.0 International License , which permits unrestricted use, distribution, and reproduction in any medium, provided the original work is properly cited.
 Downloads
 Citation Tools