
 Submit a Paper
 Propose a Special lssue
 Open Access
ARTICLE

Multi-Scale Feature Fusion Network Model for Wireless Capsule Endoscopic Intestinal Lesion Detection
School of Computer and Artificial Intelligence, Changzhou University, Changzhou, 213164, China
* Corresponding Author: Hui Wang. Email:
(This article belongs to the Special Issue: Medical Imaging Based Disease Diagnosis Using AI)
Computers, Materials & Continua 2025, 82(2), 2415-2429. https://doi.org/10.32604/cmc.2024.058250
Received 08 September 2024; Accepted 19 November 2024; Issue published 17 February 2025
 View Full Text
 Download PDF
Abstract
WCE (Wireless Capsule Endoscopy) is a new technology that combines computer vision and medicine, allowing doctors to visualize the conditions inside the intestines, achieving good diagnostic results. However, due to the complex intestinal environment and limited pixel resolution of WCE videos, lesions are not easily detectable, and it takes an experienced doctor 1–2 h to analyze a complete WCE video. The use of computer-aided diagnostic methods, assisting or even replacing manual WCE diagnosis, has significant application value. In response to the issue of intestinal lesion detection in WCE videos, this paper proposes a multi-scale feature fusion network model TSD-YOLO based on the YOLO (You Only Look Once) architecture: (I) a Tiny Detection Layer to avoid the loss of shallow feature information for tiny-scale targets; (II) integrating a simple, parameter-free attention module (SimAM) at the neck to better extract local lesion features and fuse features; (III) incorporating a new loss function DIoU (Distance Intersection over Union) to better achieve boundary box regression for target detection. This model was validated using the WCE dataset from Kyushu University Hospital. For the dataset containing 18,000 images, the evaluation metrics of our model for 12 types of lesions, outperformed existing reported results from advanced models on this dataset, and the mAP (mean Average Precision) and precision evaluation metrics improved by 3.7% and 0.9% over the benchmark model.Keywords
WCE (Wireless Capsule Endoscopy) [1] is a tiny capsule-shaped medical device that can be swallowed by patients. Equipped with a camera and sensors, it captures images of the digestive tract and transmits the data to external devices via radiofrequency technology for doctors to analyze. WCE is useful for diagnosing complex gastrointestinal conditions such as IBD (Inflammatory Bowel Diseases), GIST (Gastrointestinal Stromal Tumor), and CRC (Colorectal cancers) [2]. Patients with IBD are at an increased risk for colorectal tumors due to chronic colon inflammation. Colorectal cancer is the second leading cause of cancer-related deaths. However, early treatment can eradicate over 90% of cancer cells within five years [3]. Thus, early detection and treatment of gastrointestinal issues are essential. While traditional methods may be invasive and struggle to access the small intestine, other non-invasive imaging techniques, such as ultrasound and CT (Computed Tomography) scans, often have lower resolution, which can result in misdiagnoses [4].
WCE provides a non-invasive, painless, and comprehensive method for examining the digestive tract, gaining popularity in hospitals with promising results [5,6]. However, WCE videos typically last 8–12 h and produce 50,000–80,000 images, with numerous interfering elements such as intestinal fluids, blood, bile, and dark-field images [7]. This creates a heavy burden on doctors conducting manual analysis, which is both time-intensive and prone to missed diagnoses. Implementing AI (artificial intelligence) for automatic monitoring of capsule endoscopy footage, to assist in accurate lesion detection, has substantial clinical value [8,9].
Traditional target detection requires manual feature extraction methods, which have difficulty obtaining features, limiting their effectiveness in medical applications [10]. With advancements in deep learning, target detection techniques based on convolutional neural networks have rapidly advanced and are now widely applied in medical imaging [11]. The two-stage method represented by the R-CNN (Region convolutional neural network) series [12] and the single-stage detector represented by the YOLO (You Only Look Once) [13] and SSD (Single Shot Multibox Detector) [14] series are currently the two mainstream frameworks for convolutional neural network-based target detection. Recent advancements in target detection include architectures like RetinaNet [15] and transformer-based models such as DETR (Detection Transformer) [16] and RT-DETR (Real-Time Detection Transformer) [17].
The YOLO series algorithms [18–20] are widely used for object recognition, but improvements tailored to WCE image characteristics are lacking. This paper proposes TSD-YOLO, a multi-scale feature fusion network based on YOLO. Our contributions are summarized as follows:
1. Adding a prediction head for detecting tiny targets to prevent the loss of shallow features;
2. Integrating the simple, parameter-free attention module (SimAM) module [21] for better feature extraction and fusion in order to obtain better aspect-specific context representation;
3. Introducing the DIoU (Distance Intersection over Union) loss function [22] for improved bounding box regression in target detection, enhancing model performance.
We studied WCE data of 12 types of lesions from 523 cases at Kyushu University Hospital in a large-scale WCE dataset [23,24]. The collection of data from the Hospital for verification has been ap-proved by Kyushu University Hospital. The typical images of the 12 lesions in our dataset are shown in Fig. 1, and the experiments show our model outperforms existing methods.

Figure 1: Typical cases of twelve lsions in wireless capsule endoscopy from our dataset
There are two dominant methods for automatic target detection of WCE intestinal lesions: traditional machine learning methods [25–27] and deep learning methods [11]. Machine learning relies on manual feature extraction and the application of classifiers such as SVM (Support Vector Machines), k-NN (K-nearest Neighbor) and MLP (Multilayer Perceptron), focusing on color and texture features. Conversely, with the development and application of image detection techniques, advancements in image detection have prompted many researchers to investigate deep learning algorithms for the automatic recognition of WCE images.
Souaidi et al. [28] presented a CNN (Convolutional Neural Network) system based on the SSD for the automatic detection of intestinal erosion and intestinal ulcer lesions in WCE images. A total of 5800 images of intestinal ulcers and small intestinal erosion were used, achieving an accuracy of 90.8%. However, there are also problems in which the detection sensitivity is affected by bubbles, food debris and bile.
Patel et al. [29] employed a DCNN (Deep Convolutional Neural Network) to classify colorectal polyps, comparing its performance with six different convolutional network models. Their model consistently outperformed others in both frame-level and polyp-level assessments across two datasets. He et al. [30] integrated two CNN networks to extract and classify hookworms, creating a novel deep learning tool for hookworm detection in WCE images and validating its efficacy on a dataset of 440,000 images that included 4000 hookworms. However, the above methods by Patel et al. and He et al. are primarily target specific gastrointestinal diseases.
Sekuboyinade et al. [31] proposed an automated method for anomaly detection in WCE images. Their technique segments images into multiple chunks, using a CNN to extract features from each segment. This approach mitigates the limitations of manual feature extraction and effectively identifies anomalies such as fistulas, celiac cysts, lymphangiomas, stenosis and ulcers, although it has limited sensitivity to bleeding.
Based on the existing studies mentioned above, researchers have applied various methods to enhance model detection in lesion detection studies of endoscopic images. To improve the accuracy of localization and enhance the precision of lesion detection and classification, we propose a new solution.
2.2 YOLOv8 Network Architecture
YOLOv8 is based on the YOLO series of algorithms [18–20] and integrates four key components: image input, feature extraction, feature fusion and detection head.
In the input stage, data preprocessing is consistent with the YOLOv5 method with Mosaic, Mixup, random perspective and HSV (Hue, Saturation, Value) augmentation, and feeds into the CNN module. Inspired by the E-ELAN (Enhanced Efficient Layer Attention Network) module in YOLOv7, it introduces the C2f (Cross Stage Partial Networks Bottleneck with 2 Convolutions) module, which combines the CBS (Conv, Batch Normalization, SiLU) and SPPF (Spatial Pyramid Pooling Fast) modules. The feature fusion stage utilizes PAFPN (Path Aggregation Feature Pyramid Network) to construct a feature pyramid Network, ensuring the comprehensive fusion of both shallow and deep features. Its detection head is borrowed from YOLOX and adopts a disentangled structure to separate the classification and localization tasks. In addition, the important C2f, SPPF, Conv Module and Darknet Bottleneck in YOLOv8, which are also structures for reference in our model, are detailed at the bottom of Fig. 2.

Figure 2: The network structure of TSD-YOLO. The w (width) and r (ratio) are parameters used to represent the size of the feature map. The size of the model can be controlled by setting the values of w and r to meet the needs of different application scenarios. The Ncls + 5 indicates the output values for each anchor box, where Ncls is the number of object classes, and 5 consists of 4 bounding box coordinates and 1 confidence score. The conv2d modules consists of the darknet bottleneck modules. The n + 2 in the C2f module represent the number of main convolutional layers used for feature extraction and the two additional convolutional layers. The c_out represents the number of channels output by the module
The preprocessed image is segmented into S × S grids in the CNN module and each grid is responsible for detecting the targets whose centers fall within that grid. If the center of an object is located at the edge of a grid cell, almost half of the pixels required for recognition may fall outside that cell. If the grid cells overlap with adjacent cells near the edges, the pixels also belong to the adjacent segments. YOLOv8 addresses the issue of object centers located at the edges of grid segments by employing PAFPN, overlapping grids, and diverse predefined anchor boxes, thereby enhancing detection accuracy and robustness. Additionally, through image boundary extension and data augmentation techniques, the model is better equipped to adapt to real-world scenarios and reduce missed detections. The core of CNN consists of multiple conv layers, activation functions and fully connected layers. Convolutional layers are used to perform operations on the input image to extract features. The activation function introduces non-linearities, enabling the network to learn and recognize more complex features. Fully connected layers are employed to link the convolutional layers to the output layer of YOLO, allowing for the final recognition of the target object. YOLOv8 was proposed by Ultralytics in 2023, this paper presents its application for the first time in training a model on a large-scale capsule endoscopy detection dataset.
The architecture of the TSD-YOLO model proposed in this paper is shown in Fig. 2. The input medical images are preprocessed to ensure compatibility with the TSD-YOLO model. Then, the images are passed through a neural network for feature extraction and target detection. Specifically, TSD-YOLO divides the input images into grids and assigns bounding boxes to each grid cell, predicting target classes and detection confidence scores. The backbone network first performs feature extraction and channel information fusion, and new SimAM attention modules are added at the end of the neck network to enhance the weight of the region of interest. Notably, the use of multiple feature maps of four different sizes helps the model accurately spot and classify targets of various sizes. Additionally, by switching to the DIoU loss function, TSD-YOLO improves its ability to precisely locate targets in endoscopic images.
Down-sampling the convolutional layer of the baseline model leads to the loss of tiny features, resulting in missed and false detections. The prediction of the baseline model has three detection layers, which detect small, medium and large targets. Along with the P2 layer, an extra detection layer is introduced in the neck and head of the baseline model for processing the shallow feature maps from the P2 layer of the backbone network, and by integrating it into the architecture, it is able to perform the detection in denser grid cells, thus allowing for the detection of tinier targets. The architecture of the tiny target detection layer is shown in the red dashed box in Fig. 2: The P2 detection layer up-samples the deep feature maps, which contain strong semantic features. These are then fused with the shallow feature maps output from the P2 layer of the backbone network to enhance the semantic representation of the shallow features. After feature extraction by the C2F module, the obtained features are passed to the extra detection head. The larger the size of the final output tessellation-like feature map of Fig. 2c, the smaller the area represented by each position on the feature map. This allows for the capture of more contextual information and feature details, which is very advantageous for detecting tiny targets. This method integrates shallowly extracted feature information into the model, enhancing its ability to localize objects at different scales.
Taking an input image size of 640 × 640 as an example, the original model contains three different scales. The P3 layer outputs feature maps with a size of 80 × 80, detecting small-sized targets larger than 8 × 8. The P4 layer outputs feature maps with a size of 40 × 40, detecting medium-sized targets larger than 16 × 16. The P5 layer outputs feature maps with a size of 20 × 20, detecting large-sized targets larger than 32 × 32. The added P2 tiny detection layer outputs feature maps of size 160 × 160, detecting tiny targets larger than 4 × 4. The final improved model contains four different detection scales: (160 × 160), (80 × 80), (40 × 40), and (20 × 20). Compared to the existing detector model, this modification increases computational effort, but it is worthwhile for detecting tiny specks in WCE images.
Current attention modules mostly refine features along channel or spatial dimensions, which greatly limits the flexibility of attention weight learning and is too complex in structure [32]. The SimAM [21] computes 3D (Three-Dimensional) attention weights by optimizing the energy function of each neuron in a 3D feature map without introducing additional model training parameters, thus ensuring lighter weights and higher efficiency. Fig. 3 illustrates the 3D weights of SimAM compared to the 1D (One-Dimensional) and 2D (Two-Dimensional) Weights.

Figure 3: Comparison of SimAM attention using Full 3D (Three-Dimensional) Weights based on Feature
The attention mechanism is designed to discover important neurons by measuring the linear separability between neurons and assigning higher priority to those neurons. We embed SimAM into the TSD-YOLO framework to improve the performance of target detection. To determine which neurons matter most and capture their attention, we use an energy function to assess how linearly separable neuron
Eq. (2) is a further extension of Eq. (1), which includes a regularization term to prevent overfitting:
where
where
where
where
From Eq. (5), we see that the smaller the energy function value, the greater neuron
The effectiveness of endoscopic target detection is influenced by the choice of loss function. While GIoU (Generalized Intersection over Union), CIoU (Complete Intersection over Union), ICIoU (Improved Complete Intersection over Union) and other loss functions solely consider the distance between predicted and real bounding boxes, they fail to account for the directional mismatch between them, leading to slow convergence and reduced efficiency. The DIoU loss function [22], proposed by Zheng et al. in 2019, was introduced as a remedy for this limitation. The DIoU is defined as:
where
The DIoU loss is more in line with the bounding box regression mechanism than other loss functions. It considers the distance between the target and the anchor, the overlap rate and the scale, provides a directional adjustment for the bounding box when it does not overlap with the target box, effectively minimizing the distance between them. It enables rapid regression in both horizontal and vertical directions, making the bounding boxes regression more stable, avoiding problems such as divergence during training like IoU and GIoU. DIoU also adds a penalty term based on IoU, replacing the traditional IoU evaluation strategy, making the results for endoscopic image detection more reasonable and effective.
We conduct experiments on the SEE-AI Project Dataset™ [23,24], which is a collection of WCE images obtained from the PillCam SB 3 (Medtronic, Minneapolis, MN, USA). It comprises 18,481 images extracted from 523 capsule endoscopy videos, including 123,320 annotated images with 23,033 disease lesions and 6161 normal mucosa images. It includes 12 lesion signature labels: angiodysplasia, erosion, stenosis, lymphangiectasia, lymph follicle, SMT (Sub Mucosal Tumor), polyp-like, bleeding, diverticulum, erythema, foreign body and vein. The details are shown in Fig. 4. In this experiment, the dataset was divided into training, testing, and validation sets according to a ratio of 8:1:1.

Figure 4: Manual labeling information in the SEE-AI dataset sample histogram for each type of training set
The experiments consist of hardware and software configurations. The distributed training hardware is an Intel Xeon E5-2650 v4 CPU and an NVIDIA GTX 2060 graphics card, with the Ubuntu 14.04 Linux operating system. The software is Python 3.7.0, PyTorch 1.10.0, and CUDA 10.2.89 to carry out multi-processing tasks and to fully utilize the GPUs (Graphic Processing Unit). The hyperparameters used in the training are a learning rate of 0.01 and a weight decay rate of 0.0005. The batch size for training is set to 16, and the number of epochs is set to 300 during the learning phase.
The evaluation metrics have several components: precision, recall, mAP (mean Average Precision), and F1-score. Precision is the ratio of the number of correctly predicted positive samples to the total number of correctly or incorrectly predicted positive samples considered by the network. Recall is the ratio of correctly predicted positive samples to the total number of actual positive samples. F1-score is the harmonic mean of Precision and Recall. The PR (Precision-Recall) curve is typically generated by adjusting the classification score threshold. AP (Average Precision) is the area under the PR curve. The mAP is a key indicator in the COCO (Common Objects in Context) [33] benchmark evaluation, which is used to assess the performance of object detection models. Once the AP for all classes is calculated, the mAP is obtained by averaging these AP values. The mAP is calculated as:
where
In the same experimental environment, TSD-YOLO was evaluated alongside other classical models in the field of target detection, and the results are reported in Table 1.
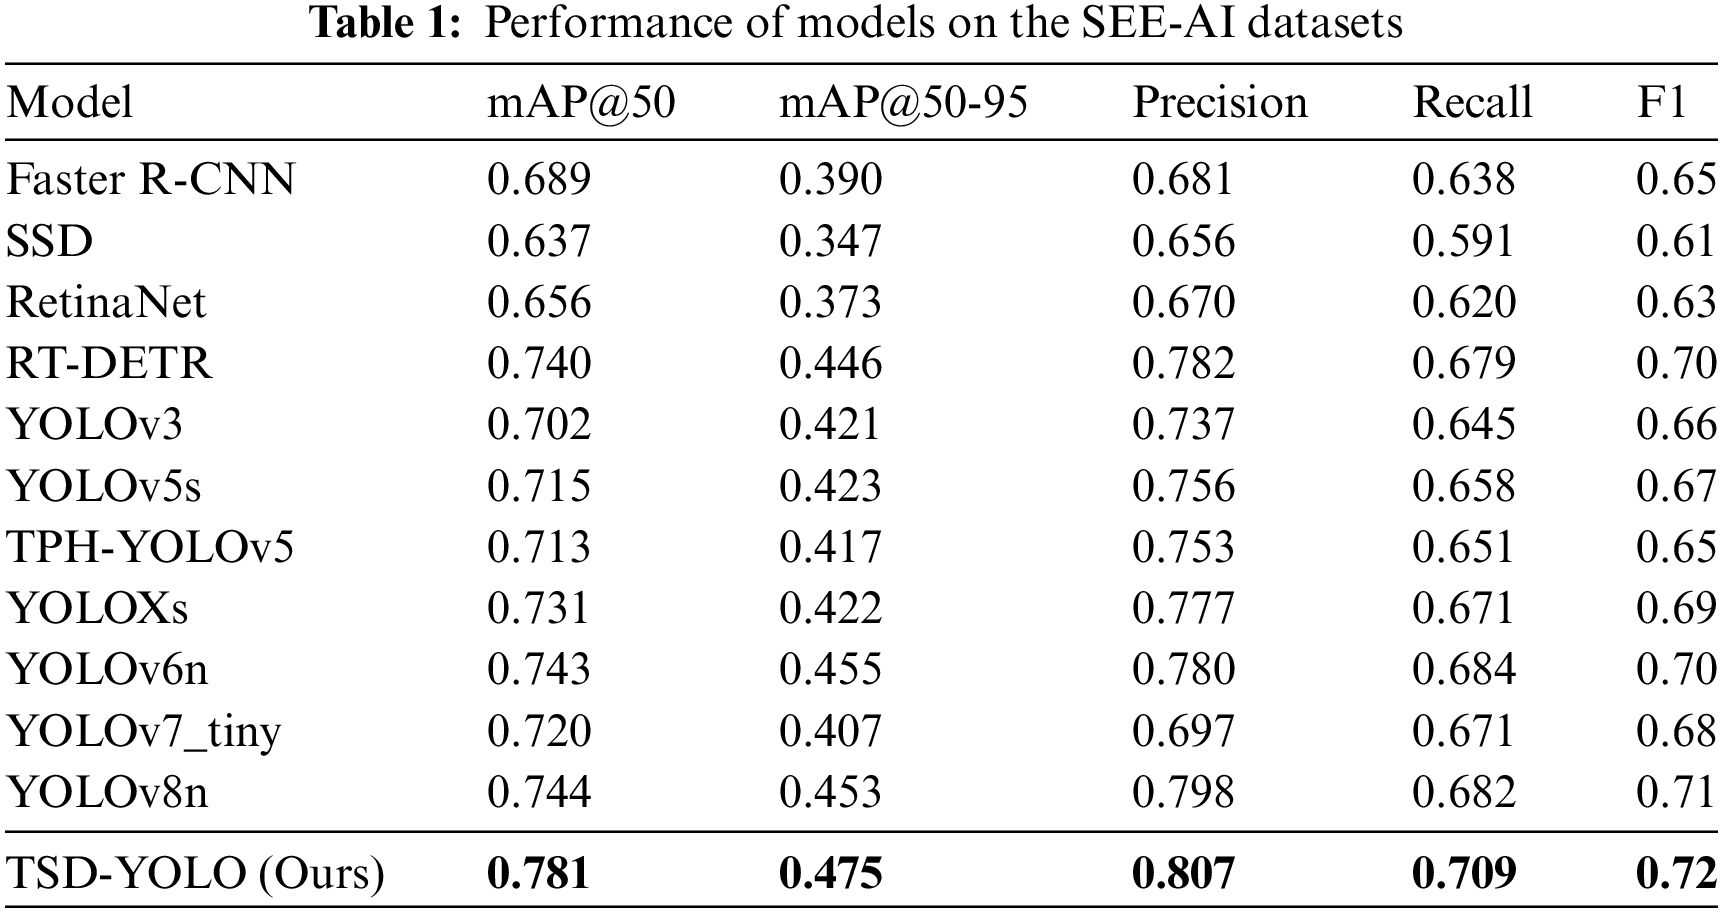
As shown in Table 1, for the WCE dataset, compared with other advanced models, the YOLO series models is improved greatly, and the evaluation indexes in YOLOv3, YOLOv5s, TPH-YOLOv5 and YOLOXs are improved substantially, while for YOLOv6n and YOLOv8n, the improvements tend to stabilize, with a slight decrease observed in the mAP@50-95 and Recall metrics. This suggests that further improvements to the existing advanced models are challenging. However, our TSD-YOLO outperforms the benchmark model YOLOv8n, with a 3.8% higher mAP@50, a 2.2% higher mAP@50-95, a 0.9% increase in precision, a 1% increase in F1-score, and a 1.7% increase in recall rate. Moreover, the TSD-YOLO is visualized and compared with the benchmark model YOLOv8n. The results are shown in Fig. 5.

Figure 5: Comparison with Benchmark Model. The train/box_loss represents the bounding box loss during training, while the train/cls_loss refers to the classification loss during training, and the train/obj_loss represents the objectness loss during training. The val/box_loss, val/cls_loss and val/obj_loss are analogous to the training losses but are computed during evaluation on the validation set. The metrics/mAP, metrics/mAP50, metrics/mAP50-95 and metrics/recall represent the mAP, mAP@50, mAP@50-95 and recall of the model on the validation set
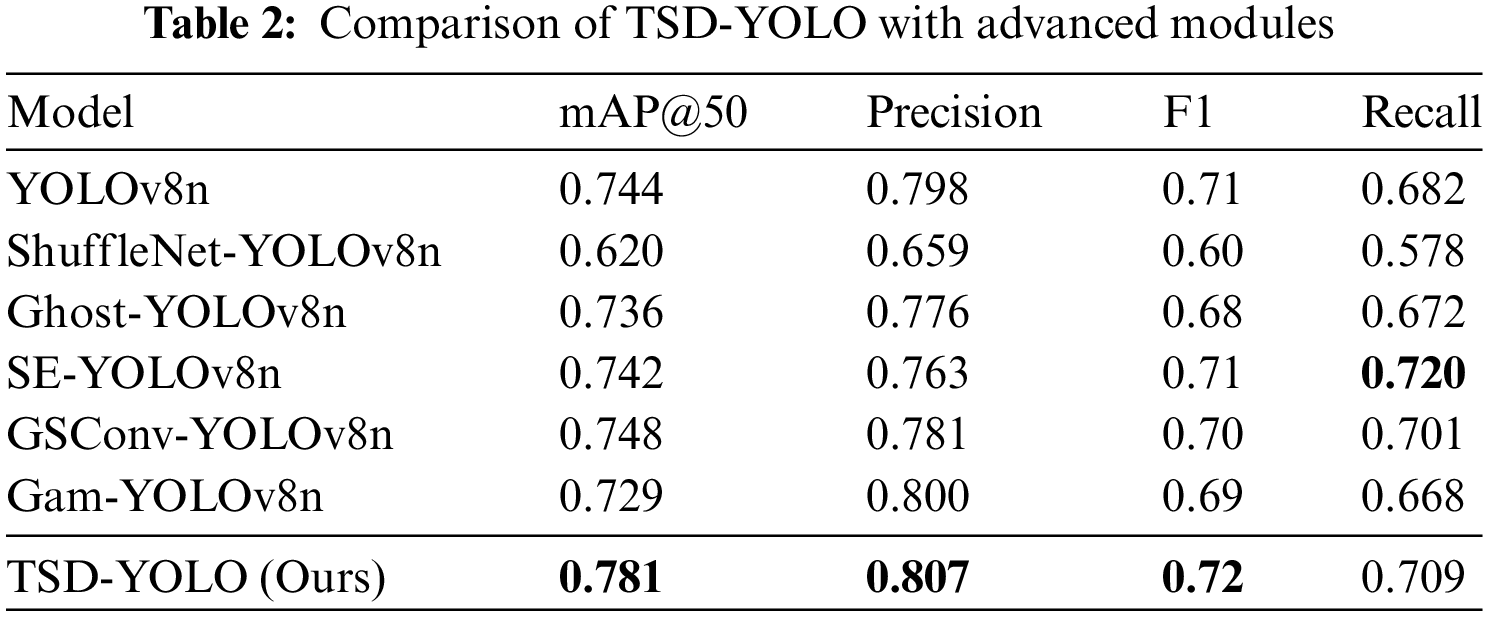
Combined with the visualization results in Fig. 5. TSD-YOLO basically outperforms the benchmark model in all metrics, indicating that our model can accurately locate and classify target objects in detection tasks. This demonstrates its ability to improve the accuracy of model detection in the WCE detection field. To further verify the performance of our model, we also compared it with other common attention mechanism modules and convolutional modules. As shown in Table 2, TSD-YOLO greatly improves the detection accuracy and performance of the network compared to other studied attention mechanisms and convolutional modules. Although the recall rate is slightly lower than that of the SE (Squeeze and Extraction)-YOLOv8 model, it is still competitive, and other evaluation metrics of our model outperform those of SE-YOLOv8. Moreover, the recall of our model increases by 2.7% compared to the benchmark model.
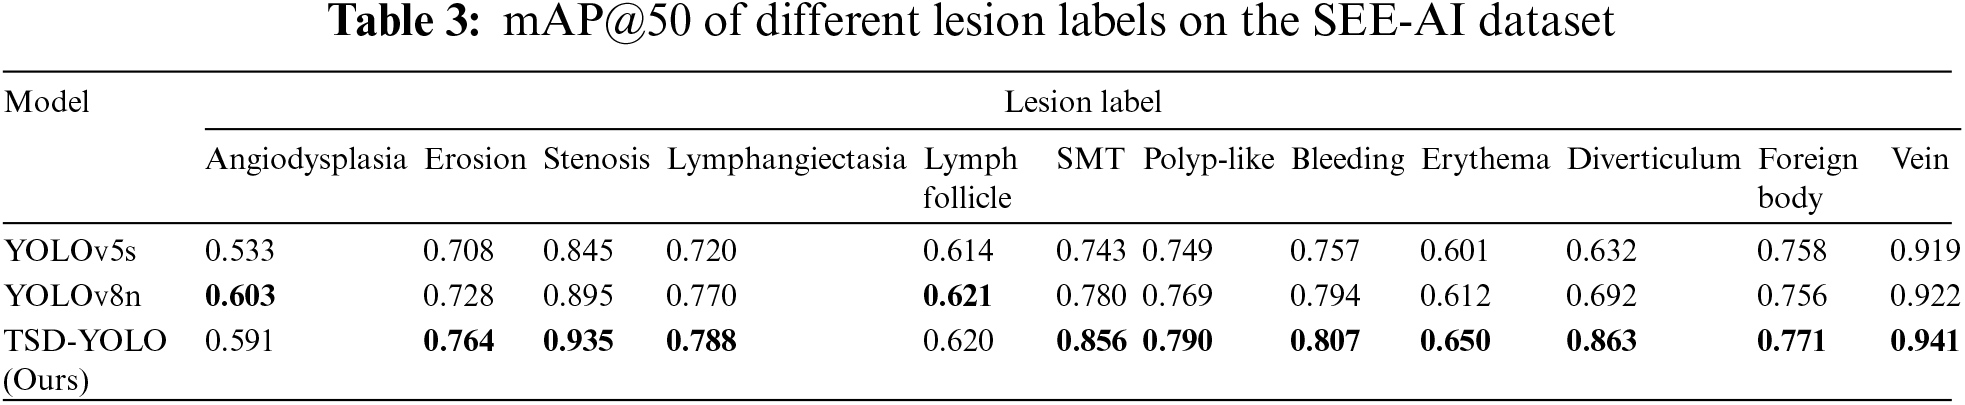
4.5 Comparative Analysis of Lesion Labels
The SEE-AI dataset contains twelve lesion labels. To reduce variability and evaluate the proposed model in detail, we specifically compare and analyze the mAP@50 of each lesion label and conduct a comparative experiment with the benchmark model. The results are shown in Table 3. As seen in Table 3, except for the two lesion features of angiodysplasia and lymphoid follicle, our model demonstrates better accuracy on the other ten lesion labels compared to the benchmark model YOLOv8n.
The effectiveness of each module is validated through extensive ablation studies, and the summarized results are presented in Table 4. We progressively incorporate modules from each layer into the baseline to showcase their contribution to enhancing model performance. The first row represents the performance of the baseline model. From the first row to the last, there is a gradual increase in mAP@50/mAP@50-95/Precision values from 0.744/0.453/0.798 to 0.781/0.475/0.807.
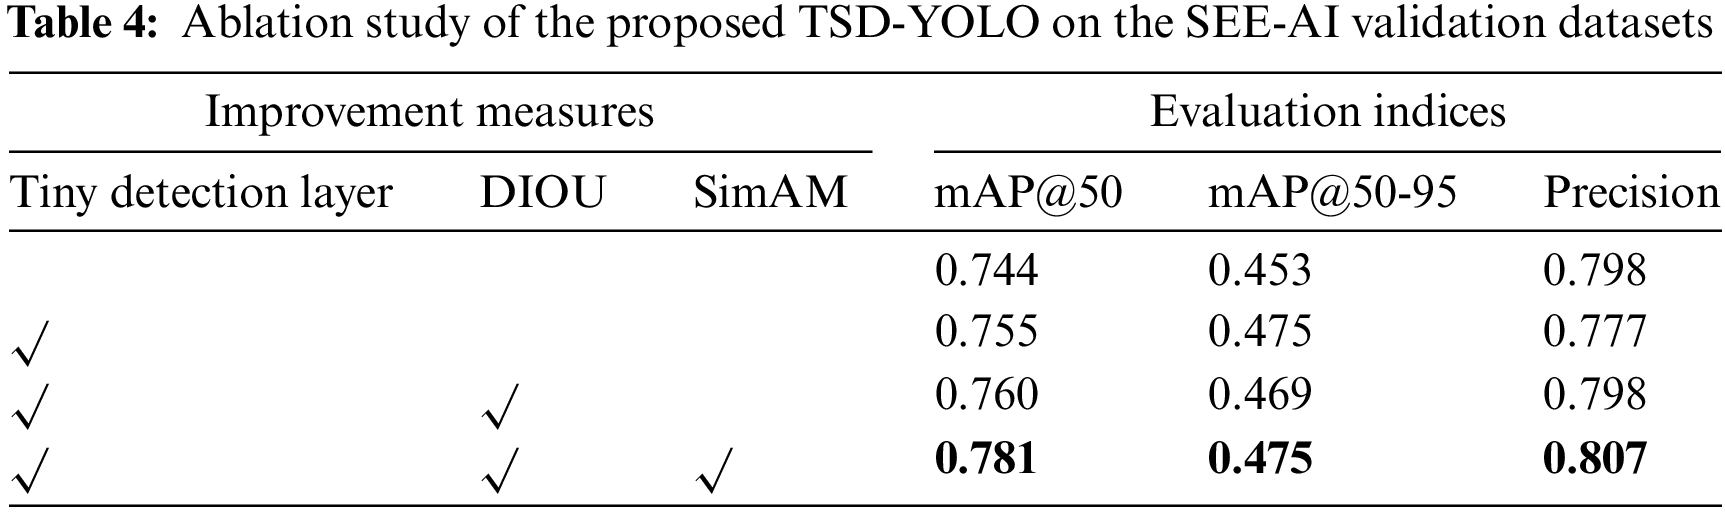
Compared with other improved methods, it can be observed from Table 4 that adding a tiny detection layer leads to an overall increase in mAP@50 by 1.1%, indicating its ability to discern tinier targets more effectively. Subsequently changing the loss function to DIoU results in a relative improvement of the model with an increased mAP@50 by 0.5%. Finally, incorporating SimAM attention mechanism significantly enhances the original YOLOv8 model’s feature extraction capability and recognition performance for intestinal diseases, leading to a 2.1% increase in mAP@50. By simultaneously integrating all three modules, there is a substantial boost in mAP@50 by 3.8%, and precision increases by 0.9%, aligning better with the actual requirements of computer-aided medical machines.
In addition, we separately performed ablation studies of each TSD-YOLO module on the SEE-AI validation dataset, and as shown in Table 5.
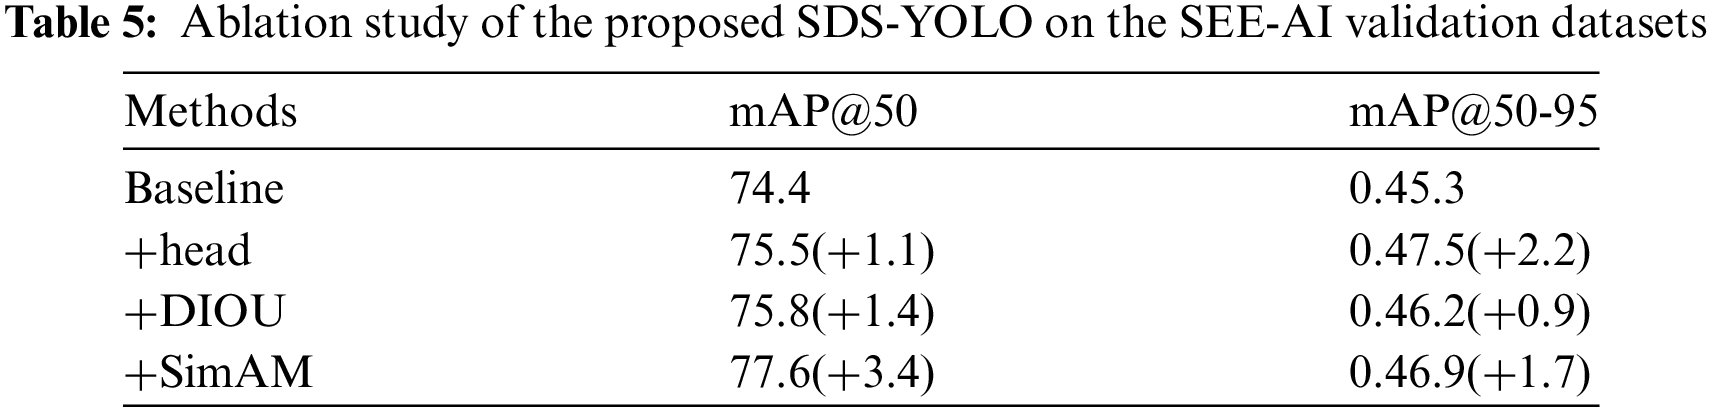
It can be seen from Table 5 that even when each module is added separately, each has a positive effect on improving the baseline model. This also demonstrates the effectiveness and practicality of each module.
The output image detection box in Fig. 6 shows the label class and the confidence level, representing the degree of similarity between the lesion in the diagram and the lesions that the algorithm can identify. This indicates the level of confidence that the model has in the results of this detection. From the above analysis of the SEE-AI dataset and Fig. 6 can be seen that the dataset contains numerous tiny objects and multiple types of lesions, which are densely and unevenly distributed.
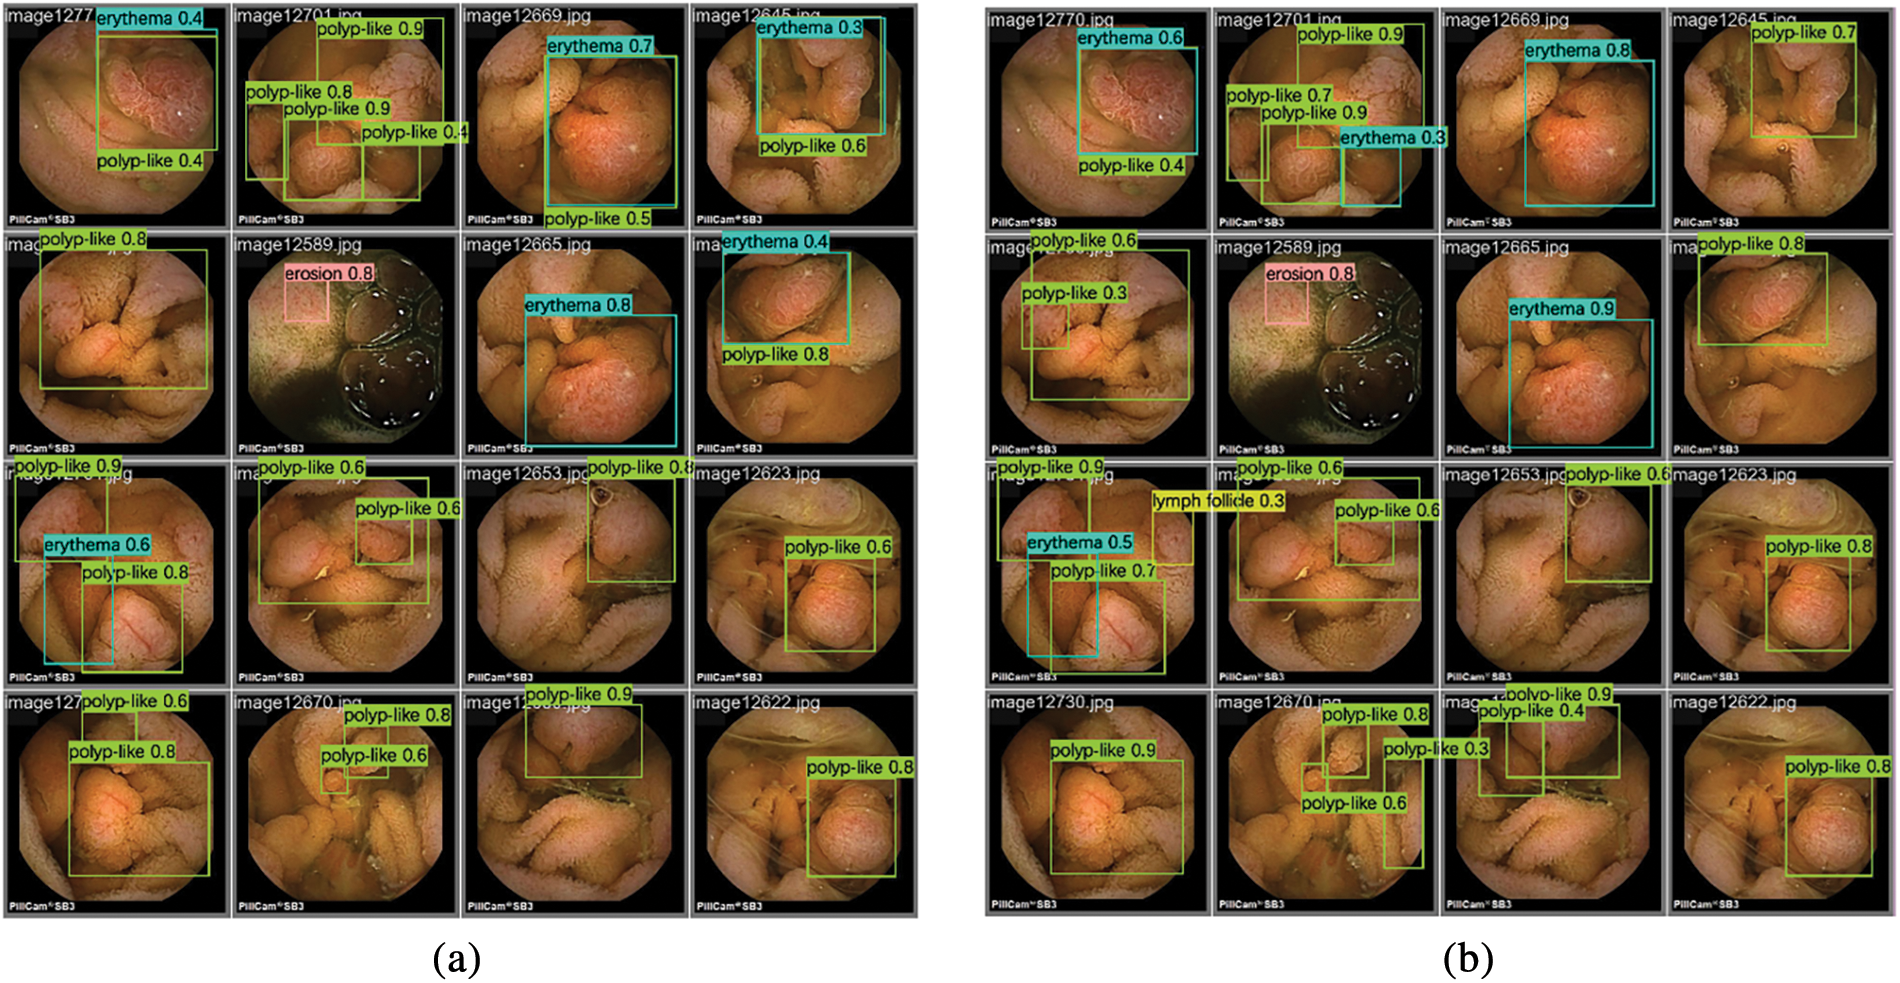
Figure 6: Inference results of two different models on the SEE-AI dataset: (a) Inference results of YOLOv8n model on the SEE-AI datasets; (b) Inference results of TSD-YOLO model on the SEE-AI datasets
Unlike typical datasets used for traditional computer vision tasks, the SEE-AI dataset is a large WCE dataset that involves multiple scales and scenes, making it more challenging than general computer vision tasks. Some rare conditions in this dataset, such as diverticula and veins, have fewer data points compared to common abnormalities. Additionally, due to the limited pixel resolution in WCE videos, certain abnormalities, like polyps, may appear blurry. Comparing the results shown in Fig. 6, our proposed model outperforms the baseline model in detecting these features. Specifically, compared to the experimental detection results of the baseline model Fig. 6a, the number of detected frames and the accuracy in Fig. 6b are significantly better, indicating that our model reduces the leakage rate and enhances overall detection performance.
WCE is a promising technology that combines computer vision and medicine, achieving impressive diagnostic results. The use of computer-aided diagnostic tools to assist or even replace manual WCE diagnosis holds significant application value. To address the challenges of WCE video, such as tiny targets, large interference, and blurred fields of view, this paper presents a reliable method based on deep learning for the detection of WCE images, specifically proposing the TSD-YOLO model. The model was validated using a large-scale WCE dataset, and the evaluation metrics for 12 types of lesions demonstrate its superiority, outperforming existing advanced models on this dataset. In the future, it is hoped that this study will provide valuable insights to developers and researchers working on WCE image analysis.
Acknowledgement: We express our gratitude to the members of our research group, for their invaluable support and assistance in this research. We also extend our thanks to our university for providing the essential facilities and environment. Thanks are also extended to the editors and reviewers.
Funding Statement: The authors received no specific funding for this study.
Author Contributions: The authors confirm contribution to the paper as follows: study conception and design: Shiren Ye, Qi Meng; data collection: Qi Meng, Shuo Zhang; analysis and interpretation of results: Shiren Ye, Hui Wang; draft manuscript preparation: Shiren Ye, Qi Meng. All authors reviewed the results and approved the final version of the manuscript.
Availability of Data and Materials: The collection of data from the Hospital for verification has been approved by Kyushu University Hospital. The data that support the findings of this study are openly available at: https://kaggle.com/datasets/capsuleyolo/kyucapsule (accessed on 17 September 2023).
Ethics Approval: Not applicable.
Conflicts of Interest: The authors declare no conflicts of interest to report regarding the present study.
References
1. B. Sushma and P. Aparna, “Recent developments in wireless capsule endoscopy imaging: Compression and summarization techniques,” Comput. Biol. Med., vol. 149, no. 6, Oct. 2022, Art. no. 106087. doi: 10.1016/j.compbiomed.2022.106087. [Google Scholar] [PubMed] [CrossRef]
2. S. Soffer et al., “Deep learning for wireless capsule endoscopy: A systematic review and meta-analysis,” Gastrointest Endosc., vol. 92, no. 4, pp. 831–839, Oct. 2020. doi: 10.1016/j.gie.2020.04.039. [Google Scholar] [PubMed] [CrossRef]
3. T. Rahim, M. A. Usman, and S. Y. Shin, “A survey on contemporary computer-aided tumor, polyp, and ulcer detection methods in wireless capsule endoscopy imaging,” Comput. Med. Imaging Graph, vol. 85, Oct. 2020, Art. no. 101767. doi: 10.1016/j.compmedimag.2020.101767. [Google Scholar] [PubMed] [CrossRef]
4. G. Ciuti et al., “Frontiers of robotic endoscopic capsules: A review,” J. Micro-Bio Robot, vol. 11, no. 1, pp. 1–18, May 2016. doi: 10.1007/s12213-016-0087-x. [Google Scholar] [PubMed] [CrossRef]
5. N. Hosoe, K. J. Limpias Kamiya, Y. Hayashi, T. Sujino, H. Ogata and T. J. D. E. Kanai, “Current status of colon capsule endoscopy,” Dig. Endosc., vol. 33, no. 4, pp. 529–537, Sep. 2021. doi: 10.1111/den.13769. [Google Scholar] [PubMed] [CrossRef]
6. P. Muruganantham and S. M. Balakrishnan, “A survey on deep learning models for wireless capsule endoscopy image analysis,” Int. J. Cogn.Comput. Eng., vol. 2, no. 2, pp. 83–92, Jun. 2021. doi: 10.1016/j.ijcce.2021.04.002. [Google Scholar] [CrossRef]
7. A. Sahafi et al., “Edge artificial intelligence wireless video capsule endoscopy,” Sci. Rep., vol. 12, Aug. 2022, Art. no. 13723. doi: 10.1038/s41598-022-17502-7. [Google Scholar] [PubMed] [CrossRef]
8. Y. J. Yang, “The future of capsule endoscopy: The role of artificial intelligence and other technical advancements,” Clin. Endosc., vol. 53, no. 4, pp. 387–394, Jul. 2020. doi: 10.5946/ce.2020.133. [Google Scholar] [PubMed] [CrossRef]
9. J. Afonso et al., “Automated detection of ulcers and erosions in capsule endoscopy images using a convolutional neural network,” Med. Biol. Eng. Comput., vol. 60, no. 3, pp. 719–725, Jan. 2022. doi: 10.1007/s11517-021-02486-9. [Google Scholar] [PubMed] [CrossRef]
10. E. S. Nadimi et al., “Application of deep learning for autonomous detection and localization of colorectal polyps in wireless colon capsule endoscopy,” Comput. Electr. Eng., vol. 81, Jan. 2020, Art. no. 106531. doi: 10.1016/j.compeleceng.2019.106531. [Google Scholar] [CrossRef]
11. R. Trasolini and M. F. Byrne, “Artificial intelligence and deep learning for small bowel capsule endoscopy,” Dig. Endosc., vol. 33, no. 2, pp. 290–297, 2021. doi: 10.1111/den.13896. [Google Scholar] [PubMed] [CrossRef]
12. S. Ren, K. He, R. Girshick, and J. Sun, “Faster R-CNN: Towards real-time object detection with region proposal networks,” IEEE Trans. Pattern Anal. Mach. Intell., vol. 39, no. 6, pp. 1137–1149, Jun. 2017. doi: 10.1109/TPAMI.2016.2577031. [Google Scholar] [PubMed] [CrossRef]
13. J. Redmon, S. Divvala, R. Girshick, and A. Farhadi, “You only look once: Unified, real-time object detection,” in 2016 IEEE Conf. Comput. Vis. Pattern Recogn. (CVPR), Las Vegas, NV, USA, 2016, pp. 779–788. [Google Scholar]
14. W. Liu, D. Anguelov, and D. Erhan, “SSD: Single shot multibox detector,” in Proc ECCV, Eur. Conf., Amsterdam, The Netherlands, Oct. 2016, pp. 11–14. [Google Scholar]
15. T. Lin, P. Goyal, R. Girshick, K. He, and P. Dollar, “Focal loss for dense object detection,” in 2017 IEEE Int. Conf. Comput. Vis. (ICCV), Oct. 2017, pp. 2999–3007. doi: 10.1109/ICCV.2017.324. [Google Scholar] [CrossRef]
16. N. Carion, F. Massa, G. Synnaeve, N. Usunier, A. Kirillov and S. Zagoruyko, “End-to-end object detection with transformers,” in Comput. Vis.—ECCV 2020, 2020, pp. 213–229. [Google Scholar]
17. Y. Zhao et al., “Detrs beat yolos on real-time object detection,” in Proc. IEEE/CVF Conf. Comput. Vis. Pattern Recognit., 2024, pp. 16965–16974. [Google Scholar]
18. J. Redmon and A. Farhadi, “YOLOv3: An incremental improvement,” in Proc. IEEE Conf. Comput. Vis. Pattern Recognit. (CVPR), Salt Lake City, UT, USA, 2018, pp. 89–95. [Google Scholar]
19. Z. Ge, S. Liu, F. Wang, Z. Li, and J. Sun, “YOLOX: Exceeding YOLO series in 2021,” 2021, arXiv:2107.08430. [Google Scholar]
20. C. -Y. Wang, A. Bochkovskiy, and H. -Y. M. Liao, “YOLOv7: Trainable bag-of-freebies sets new state-of-the-art for real-time object detectors,” in 2023 IEEE/CVF Conf. Comput. Vis. Pattern Recognit., Vancouver, BC, Canada, Jun. 2023, pp. 7464–7475. [Google Scholar]
21. L. Yang, R. -Y. Zhang, L. Li, and X. Xie, “SimAM: A simple, parameter-free attention module for convolutional neural networks,” in Proc. 38th Int. Conf. Mach. Learn., 2021, pp. 11863–11874. [Google Scholar]
22. Z. Zheng, P. Wang, W. Liu, J. Li, R. Ye and D. Ren, “Distance-IoU loss: Faster and better learning for bounding box regression,” Proc. AAAI Conf. Artif. Intell., vol. 34, no. 7, pp. 12993–13000, Apr. 2020. doi: 10.1609/aaai.v34i07.6999. [Google Scholar] [CrossRef]
23. A. Yokote et al., “The SEE-AI Project Dataset,” Accessed: Sep. 17, 2023. [Online]. Available: https://www.kaggle.com/datasets/capsuleyolo/kyucapsule [Google Scholar]
24. A. Yokote et al., “Small bowel capsule endoscopy examination and open access database with artificial intelligence: The SEE-artificial intelligence project,” DEN Open, vol. 4, Jun. 2024, Art. no. e258. doi: 10.1002/deo2.258. [Google Scholar] [PubMed] [CrossRef]
25. K. D. Curry, M. G. Nute, and T. J. Treangen, “It takes guts to learn: Machine learning techniques for disease detection from the gut microbiome,” Emerg. Top. Life Sci., vol. 5, no. 6, pp. 815–827, Nov. 2021. doi: 10.1042/ETLS20210213. [Google Scholar] [PubMed] [CrossRef]
26. M. M. Buijs et al., “Assessment of bowel cleansing quality in colon capsule endoscopy using machine learning: A pilot study,” Endosc. Int. Open., vol. 6, no. 08, pp. E1044–E1050, Aug. 2018. doi: 10.1055/a-0627-7136. [Google Scholar] [PubMed] [CrossRef]
27. U. Hany, N. M. Hye, and L. J. I. A. Akter, “Path loss based wireless capsule endoscope localization using machine learning regression,” lEEE Access, vol. 11, pp. 124643–124659, 2023. doi: 10.1109/ACCESS.2023.3329812. [Google Scholar] [CrossRef]
28. M. Souaidi and M. E. Ansari, “A new automated polyp detection network MP-FSSD in WCE and colonoscopy images based fusion single shot multibox detector and transfer learning,” lEEE Access, vol. 10, pp. 47124–47140, 2022. doi: 10.1109/ACCESS.2022.3171238. [Google Scholar] [CrossRef]
29. K. Patel et al., “A comparative study on polyp classification using convolutional neural networks,” PLoS One, vol. 15, no. 7, 2020, Art. no. e0236452. doi: 10.1371/journal.pone.0236452. [Google Scholar] [PubMed] [CrossRef]
30. J. -Y. He, X. Wu, Y. -G. Jiang, Q. Peng, and R. Jain, “Hookworm detection in wireless capsule endoscopy images with deep learning,” IEEE Trans. Image Process., vol. 27, no. 5, pp. 2379–2392, May 2018. doi: 10.1109/TIP.2018.2801119. [Google Scholar] [PubMed] [CrossRef]
31. A. K. Sekuboyina, S. T. Devarakonda, and C. S. Seelamantula, “A convolutional neural network approach for abnormality detection in wireless capsule endoscopy,” in 2017 IEEE 14th Int. Symp. Biomed, Imaging (ISBI 2017), Apr. 2017, pp. 1057–1060. [Google Scholar]
32. Z. Niu, G. Zhong, and H. J. N. Yu, “A review on the attention mechanism of deep learning,” Neurocomputing, vol. 452, pp. 48–62, Sep. 2021. doi: 10.1016/j.neucom.2021.03.091. [Google Scholar] [CrossRef]
33. T. -Y. Lin et al., “Microsoft COCO: Common objects in context,” in Comput. Vis.—ECCV 2014, 2014, pp. 740–755. [Google Scholar]
Cite This Article
 Copyright © 2025 The Author(s). Published by Tech Science Press.
This work is licensed under a Creative Commons Attribution 4.0 International License , which permits unrestricted use, distribution, and reproduction in any medium, provided the original work is properly cited.
 Downloads
 Citation Tools