 Open Access
ARTICLE
Industrial Control Anomaly Detection Based on Distributed Linear Deep Learning
1 School of Computer Science and Information Security, Guilin University of Electronic Technology, Guilin, 541004, China
2 School of Electronic Engineering and Automation, Guilin University of Electronic Technology, Guilin, 541004, China
3 Guangxi Engineering Research Center of Industrial Internet Security and Blockchain, Guilin University of Electronic Technology, Guilin, 541004, China
4 Institute of Cyberspace Technology, HKCT Institute for Higher Education, Hong Kong, 999077, China
5 School of Mathematics & Computing Science, Guilin University of Electronic Technology, Guilin, 541004, China
* Corresponding Author: Yong Ding. Email:
(This article belongs to the Special Issue: Security and Privacy for Blockchain-empowered Internet of Things)
Computers, Materials & Continua 2025, 82(1), 1129-1150. https://doi.org/10.32604/cmc.2024.059143
Received 28 September 2024; Accepted 28 October 2024; Issue published 03 January 2025
Abstract
As more and more devices in Cyber-Physical Systems (CPS) are connected to the Internet, physical components such as programmable logic controller (PLC), sensors, and actuators are facing greater risks of network attacks, and fast and accurate attack detection techniques are crucial. The key problem in distinguishing between normal and abnormal sequences is to model sequential changes in a large and diverse field of time series. To address this issue, we propose an anomaly detection method based on distributed deep learning. Our method uses a bilateral filtering algorithm for sequential sequences to remove noise in the time series, which can maintain the edge of discrete features. We use a distributed linear deep learning model to establish a sequential prediction model and adjust the threshold for anomaly detection based on the prediction error of the validation set. Our method can not only detect abnormal attacks but also locate the sensors that cause anomalies. We conducted experiments on the Secure Water Treatment (SWAT) and Water Distribution (WADI) public datasets. The experimental results show that our method is superior to the baseline method in identifying the types of attacks and detecting efficiency.Keywords
Cyber-Physical Systems (CPS) are the integrations of computation and physical processes [1], which have been widely used in industrial control systems and have become the core foundation of key national infrastructure such as manufacturing, petrochemicals, power, and communication. However, the security issues of CPS are becoming increasingly prominent, with threats such as physical security, cyber-attacks, and data privacy constantly increasing, and global industrial control security incidents emerging one after another. For example, in 2015, the Ukrainian power grid was hacked, causing widespread power outages [2]. In 2021, a water treatment plant in Florida became a victim of attempted urban water poisoning, as attackers attempted to alter the concentration of sodium hydroxide in drinking water [3].
With the networking of devices in Cyber-Physical Systems, physical components such as programmable logic controllers (PLCs), human machine interface (HMI), sensors, and actuators have become the main targets of cyber-attacks.
The attack point in CPS is often the physical component itself, or it may be the entry point of the communication network that connects sensors or actuators to the controller and the supervisory control and data acquisition (SCADA) system. The programmable area of the controller is one of the targets that attackers are concerned about. To gain control over physical processes, attackers may forge or tamper with the control logic of PLCs. Control logic has strict sequential requirements, and incorrect sequential logic attacks may cause process validation interruptions or device damage [4]. The most famous attack of this type is the Stuxnet attack [5]. The implanted virus modified the PLC control code through the internal network, issued incorrect instructions to the centrifuge, and caused physical damage. A common attack against terminal devices is the sensor numerical replacement attack. The attacker intercepted real sensor data and injected false sensor data into the PLC, causing the PLC to enable inappropriate control operations based on false measurement data. Attacks on the physical component of CPS are very different from network attacks on traditional IT systems, as they may not only cause economic losses but also potential casualties.
Industrial control data consists of network traffic data and physical attribute data. Compared with the former, physical attribute data changes slowly and has good stability, which is conducive to establishing stable prediction models through learning from normal data. Moreover, such data usually has clear physical meaning and interpretability. Therefore, we focus on anomaly detection of the latter type, which originates from physical components that record the detection and operation status of controllers, various sensors, and actuators in chronological order. In this article, we refer to these data as industrial control sequential data, which have the following characteristics:
(1) Data are multidimensional. An industrial control system contains many physical components, and the data collected by each component is often regarded as one-dimensional data.
(2) The volume of data is large. On the one hand, during the process of equipment automation, the controller generates a large amount of data. On the other hand, the cost of obtaining real-time data is no longer high. As a result, with the improvement of sensor technology and data transmission capabilities, the devices in the system collect data at a high frame rate during each collection process [6,7], which also generates a large amount of data.
(3) Data are multidimensionally correlated. The most important feature of industrial control sequential data is the process correlation between multiple variables, which is determined by the combination relationship of physical components in industrial control systems. A change in the working state of a component may affect the state of other components or the entire system after a certain delay.
(4) Data are usually periodic. Industrial control system (ICS) exhibits more cyclical behavior than information technology systems because, in industrial production processes, the operation of systems and industrial control components have a certain degree of periodicity [8].
(5) Data is usually noisy. Noise may be caused by errors in the component itself, measurement methods, transmission, or processing.
(6) Data is real-time. We hope the latency of data processing is low so that we can respond promptly to any anomalies or changes during the process.
In the past few decades, deep learning has stood out in anomaly detection methods for industrial control sequential data due to its outstanding performance and widespread applications. Among them, LSTM is considered a typical way to capture short-term and long-term information and process time series data [9]. While Transformer is a highly successful sequence modeling framework that can more effectively capture long-range dependencies and process time series in parallel. In recent years, multi-layer perceptrons (MLPs) [10,11], a type of feedforward neural network consisting of an input layer, one or more hidden layers, and an output layer, have achieved performance comparable to Transformer models in some cases, and they are simple and fast, which is very attractive.
Although deep learning has made significant achievements in anomaly detection, challenges still exist:
(1) The data of industrial control time series is often susceptible to various noises due to equipment, environmental changes, data transmission, and other factors. For sequence data with high noise, it may not be possible to achieve good detection results. How to eliminate noise in order for the model to learn the characteristics between data more effectively is an urgent problem that needs to be solved.
(2) How to model sequential changes in a large and diverse field of time series is a key problem that needs to be solved to distinguish between normal and abnormal time series, which is also the most challenging problem.
In response to the above issues, this article proposes a fast and practical industrial control anomaly detection method to process physical component data and constructs a distributed industrial control anomaly detection system based on linear models. The overall architecture is shown in Fig. 1. The main contributions of this article are as follows:
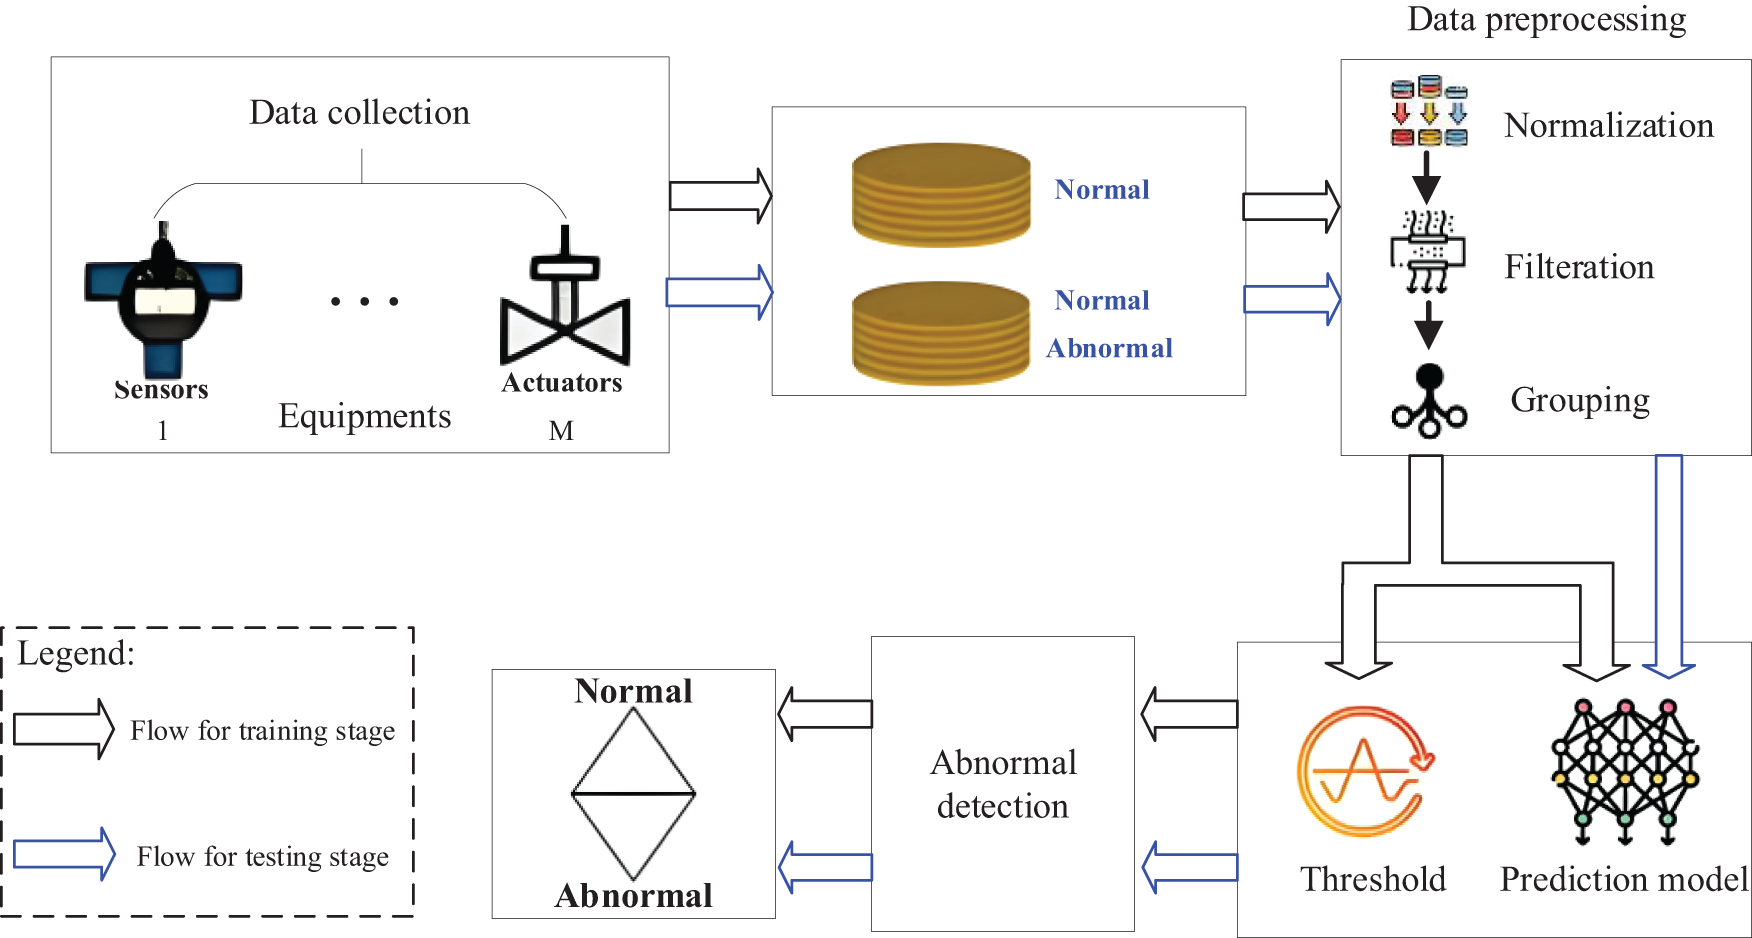
Figure 1: Overall system architecture diagram
(1) Considering that bilateral filtering of images can maintain the marginalization of discrete features, we propose a bilateral filtering algorithm suitable for temporal sequences, and use this algorithm to process temporal sequence data, achieving good denoising effects;
(2) To solve the problem of large and high-dimensional data collection in industrial control, and the difficulty of a single model effectively solving complex problems, we adopt a distributed method to split large problems into multiple small problems and allocate data, tasks, etc., to multiple machines for parallel execution. We use a distributed deep learning model to independently train and detect anomalies, effectively improving the identification of attack types and shortening detection time;
(3) Considering that the multilayer perceptron model has the characteristics of lightweight and fast speed, and can accurately approximate any continuous function, it is very suitable for anomaly detection in information physics systems. Therefore, we designed a wide MLP model for the prediction model to learn nonlinear relationships between multivariate time series. To prevent overfitting caused by wide deep learning networks, we used masking techniques to remove redundancy and achieved the expected results.
The rest of this paper is organized as follows: Relevant work is introduced in Section 2, the proposed model design method is detailed in Section 3, and experimental research and data analysis are conducted in Section 4. Finally, the conclusion is presented in Section 5.
2.1 Methods Based on Linear Models
Deep learning has achieved significant results in the field of anomaly detection, such as LSTM, GRU, and Transformer models, but these complex models often lead to increased computational burden during training and inference stages. To address this issue, some scholars have attempted to construct anomaly detection models using simple linear models, in order to reduce computational complexity and resource consumption while maintaining a certain level of performance. Zeng et al. [12] introduced a very simple single-layer linear model (LTSF-Line) and conducted comparative experiments on nine real datasets. The results indicate that in all cases, LTSF-Line surprisingly outperforms existing transformer-based complex LTSF (the long-term time series forecasting) models. Since the publication of their paper, there has been an increasing number of applications based on linear models, with training and detection costs comparable to state-of-the-art models. Yin et al. [10] used information gain, random forest, and recursive feature elimination to filter important features, obtaining a simplified subset of features. They then used this subset to train the MLP model and achieved good results. Ekambaram et al. [13] proposed a lightweight neural architecture consisting entirely of multi-layer perceptron modules, designed specifically for repairing multivariate prediction and representation learning in time series. This architecture enhances various coordination heads and gates attention to channel independent backbones, which greatly enhances the learning ability of simple MLP structures. Li et al. [14] proposed a lightweight but effective anomaly detection model using only multi-layer perceptrons, which applies a multi-scale sampling strategy to MLP networks to better extract and integrate temporal and variable dimensional information.
Masking is commonly used in deep learning. One mainstream application of masking is to construct self-supervised models by designing masked autoencoders, which attempt to reconstruct the content of the masked part through learning from the unmasked part, with losses only calculated in the masked part. This method can reduce the cost of data annotation. He et al. [15] used a self-supervised approach to randomly block some information from the input image and reconstruct missing pixels. They found that blocking a large proportion of the input image (e.g., 75%) would result in a non-trivial and meaningful self-supervised task. Fu et al. [16] believed that industrial control time series are usually continuous, so discrete mask tokens are not used. Instead, all mask samples are replaced with random values within the input range, and these mask values are predicted based on the mask sequence. Another application of masks is to remove data redundancy. In recommendation systems, Zhao et al. [17] believed that redundant interactions hinder the model from capturing user intentions, and using masks can discard most of the historical interactions. In time series prediction, Tang et al. [18] argued that local information in multivariate time series data (MTSD) may appear to have heavy spatial redundancy, but the multivariate information at each time point has high specificity. Missing information can be easily learned from information at adjacent time points without requiring high-level understanding. The author used the idea of a Vision Transformer (ViT) to patch MTSD and blocked more random patches than the original MAE. This simple strategy effectively reduces redundancy and further improves the overall understanding of low-level information in the model.
In this article, an industrial control anomaly detection model based on distributed linear deep learning model is proposed. After data preprocessing, the prediction subnet predicts the future time series
Due to the fact that on-site data collected from industrial control systems may come from multiple sensors and actuators, there are differences in units and numerical values between different features of the data. Therefore, before training the model, it is necessary to normalize the features to eliminate the differences between different features. Maximum minimum normalization is a commonly used method that can scale training data to a range of 0–1. The calculation formula is shown in (1).
where
Noise may cause serious problems. Therefore, before inputting data into the anomaly detection model, it is necessary to perform feature denoising. Bilateral Filter is a nonlinear filtering method that combines image spatial proximity and pixel value similarity, which can effectively filter out random noise in images. It can smooth data while maintaining its edges, but it is not suitable for time series because the data in the time series is not closely related to its adjacent data like the data in the image. It is only related to the data before and after. Therefore, we employ a bilateral filter suitable for time series instead, with weighted averaging only performed in each dimension.
To ensure that the number of samples in the filtered data remains unchanged, we will make
The spatial domain kernel calculates weights based on the distance between each sample in the filtering window and the value to be updated. The farther the distance, the smaller the assigned weight. The weight formula is shown as (2) and (3):
where
The value domain kernel assigns weights based on the numerical difference between each sample in the filtering window and the value to be updated. The larger the difference, the smaller the assigned weights. The formulas are shown in (4) and (5), respectively:
where
The data formula for sequential bilateral filtering can be expressed as shown in (6) and (7):
The sampling frequency of the dataset used in this article is once per second. The data changes slowly. Therefore, in this article, data is taken every 5 s. There is no significant change in the data pattern before and after sampling. As shown in Fig. 2.
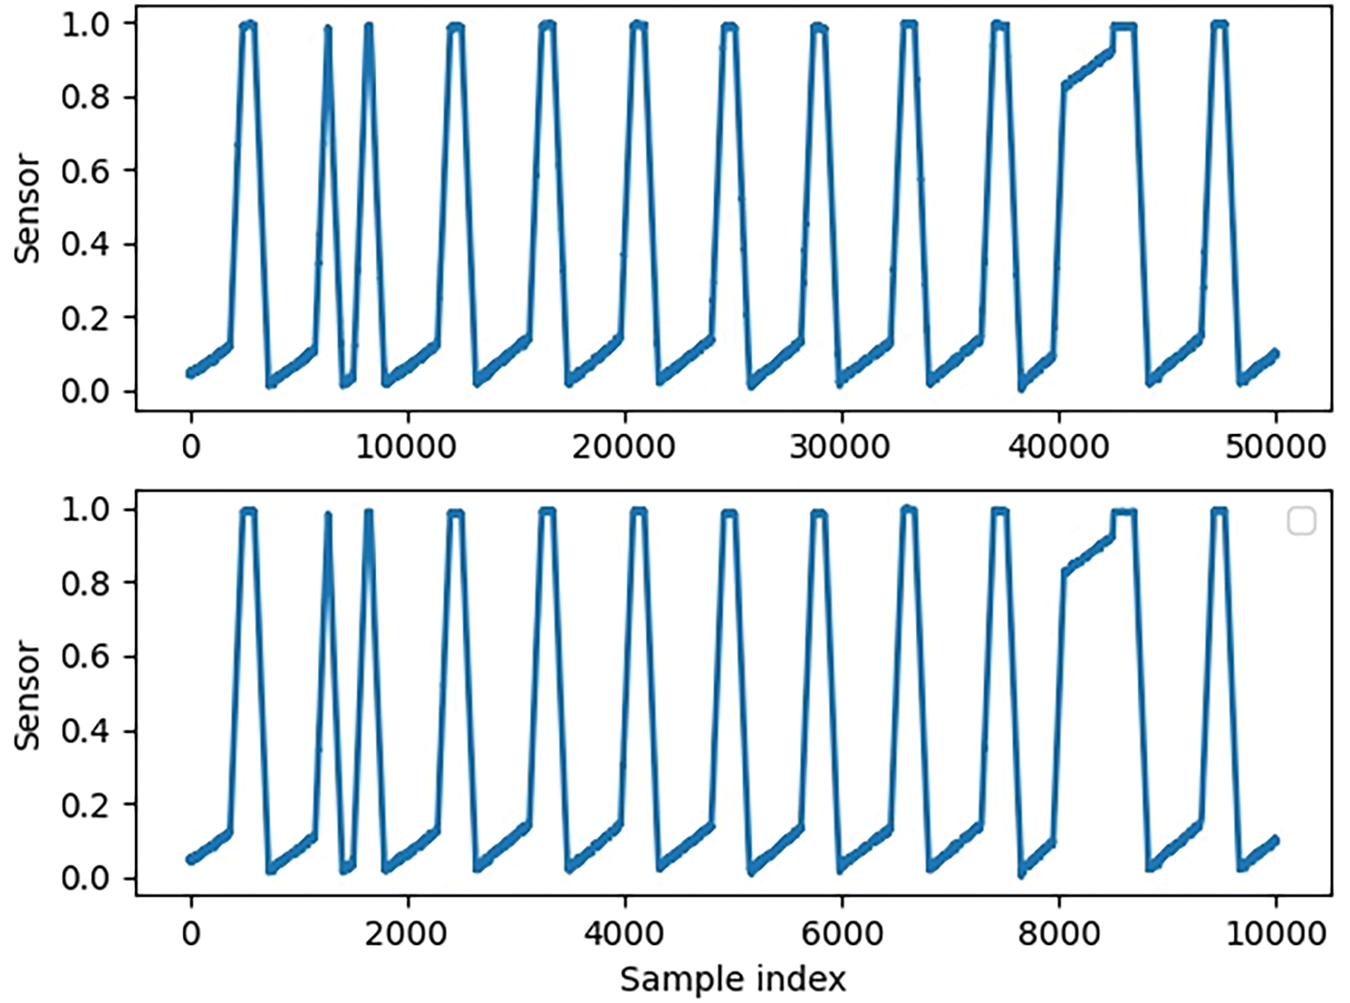
Figure 2: Comparison of the first dimensional data of the Secure Water Treatment (SWAT) dataset before and after sampling
The prediction network is a lightweight deep learning network composed only of multi-layer perceptrons (MLPs), and its framework is shown in Fig. 3.
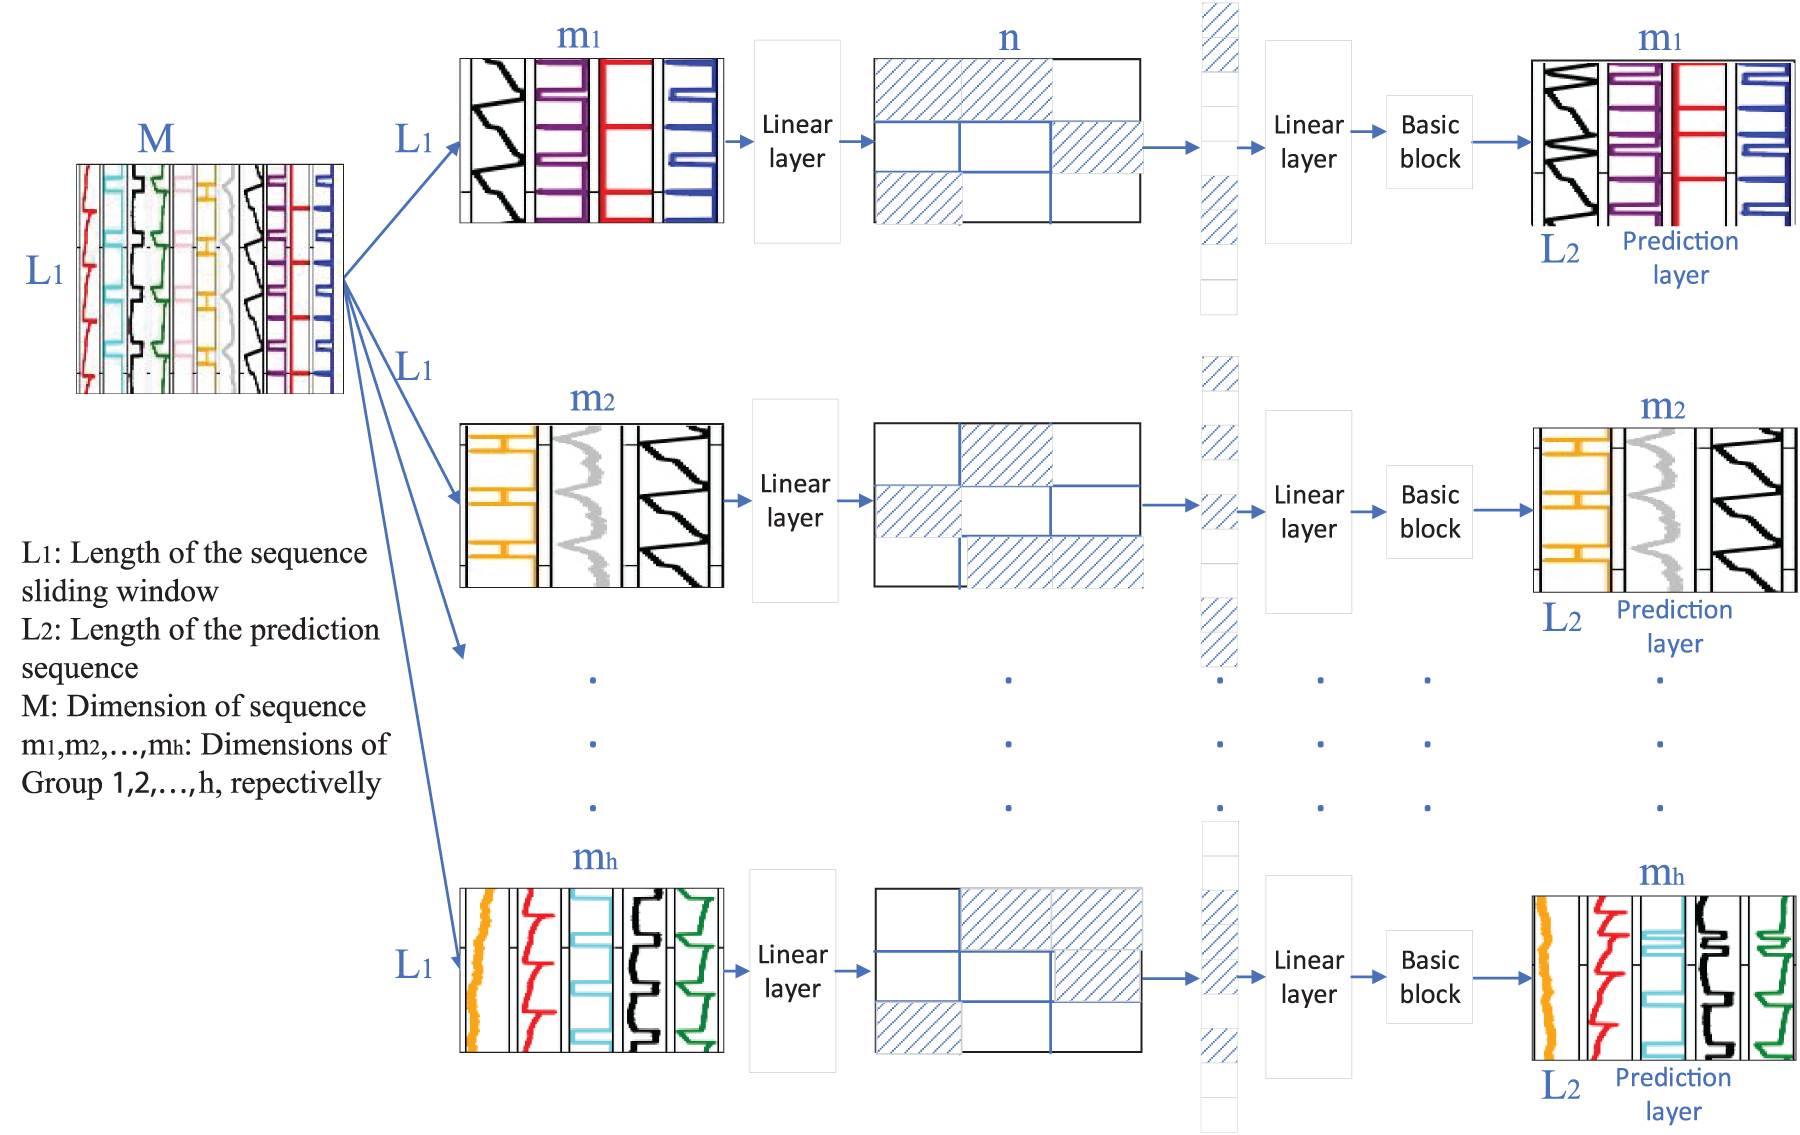
Figure 3: Prediction network based on multi-layer perceptron
Distributed algorithms can break down large problems into multiple small ones and achieve parallel computing on multiple machines, but how to break them down is a key issue. In industrial control datasets, physical attribute data is collected from industrial control equipment. These devices are distributed in various production stages of the industrial control system, and changes in data from the previous stage often affect the data from the next stage. Therefore, we group the dataset based on the connectivity of different stages and independently train predictive sub-models, with the main principle of grouping directly related data before and after each stage. We train predictive sub-models independently for each set of data. The goal of each sub-model is to reduce the error between predicted and actual values, and the loss function is shown in Formula (8).
3.3.2 A Prediction Module Based on Random Masks
Industrial control sequential data comes from industrial production processes, with certain periodicity and seasonality, and is a type of redundant data information. By using masks, we can hide or select specific information, so that redundancy can be reduced to a certain extent. In this article, we use the method of patch random masking to process data. On the one hand, it can significantly reduce redundancy, allowing the model to be effectively trained on smaller sub-blocks. On the other hand, points in the time series without adjacent point information are meaningless [19], so the block masking method can retain more correlation information between data compared to channel independence.
We divide the sequential data within the sliding window into non-overlapping sequential sub-blocks and use a random mask to hide the sequential sub-blocks. The masked part is replaced with parameters of equal size with all zeros. In the learning model, these parameters are learnable.
The prediction module adopts a multi-layer perceptron network. After passing through a random mask, the dimensions of the sub-blocks are first expanded through a linear layer, and then the input and output mapping relationship is established using MLP basic blocks. The basic structure of MLP is shown in Fig. 4. Finally, the prediction output is given through linear transformation.

Figure 4: Basic structure of MLP
We determine whether there is an anomaly based on the prediction error between the actual value and the predicted value. If the prediction error is greater than a certain threshold, the state is considered abnormal, otherwise it is considered normal. When using a prediction model trained on normal data, the prediction error obtained from making predictions on normal data is relatively small. When predicting abnormal data, the prediction error is relatively large, especially in multi-step predictions, the larger the number of prediction steps, the greater the prediction error. Therefore, we use the data from the last time step of the prediction to calculate the prediction error, as shown in the Formula (9).
where
The prediction error sequence is easily affected by random fluctuations and noise, resulting in many false alarms. We use an exponential weighted average method to smooth the data and absorb instantaneous bursts of data. Its formulas are shown in (10) and (11).
where
In industrial control attacks, only some sensors or actuators may be affected, but even a small number of abnormal instances can trigger catastrophic attacks. Therefore, we choose different thresholds for each dimension of data in each group. The threshold is calculated by Formula (12).
where
The predicted labels are:
As long as the value of
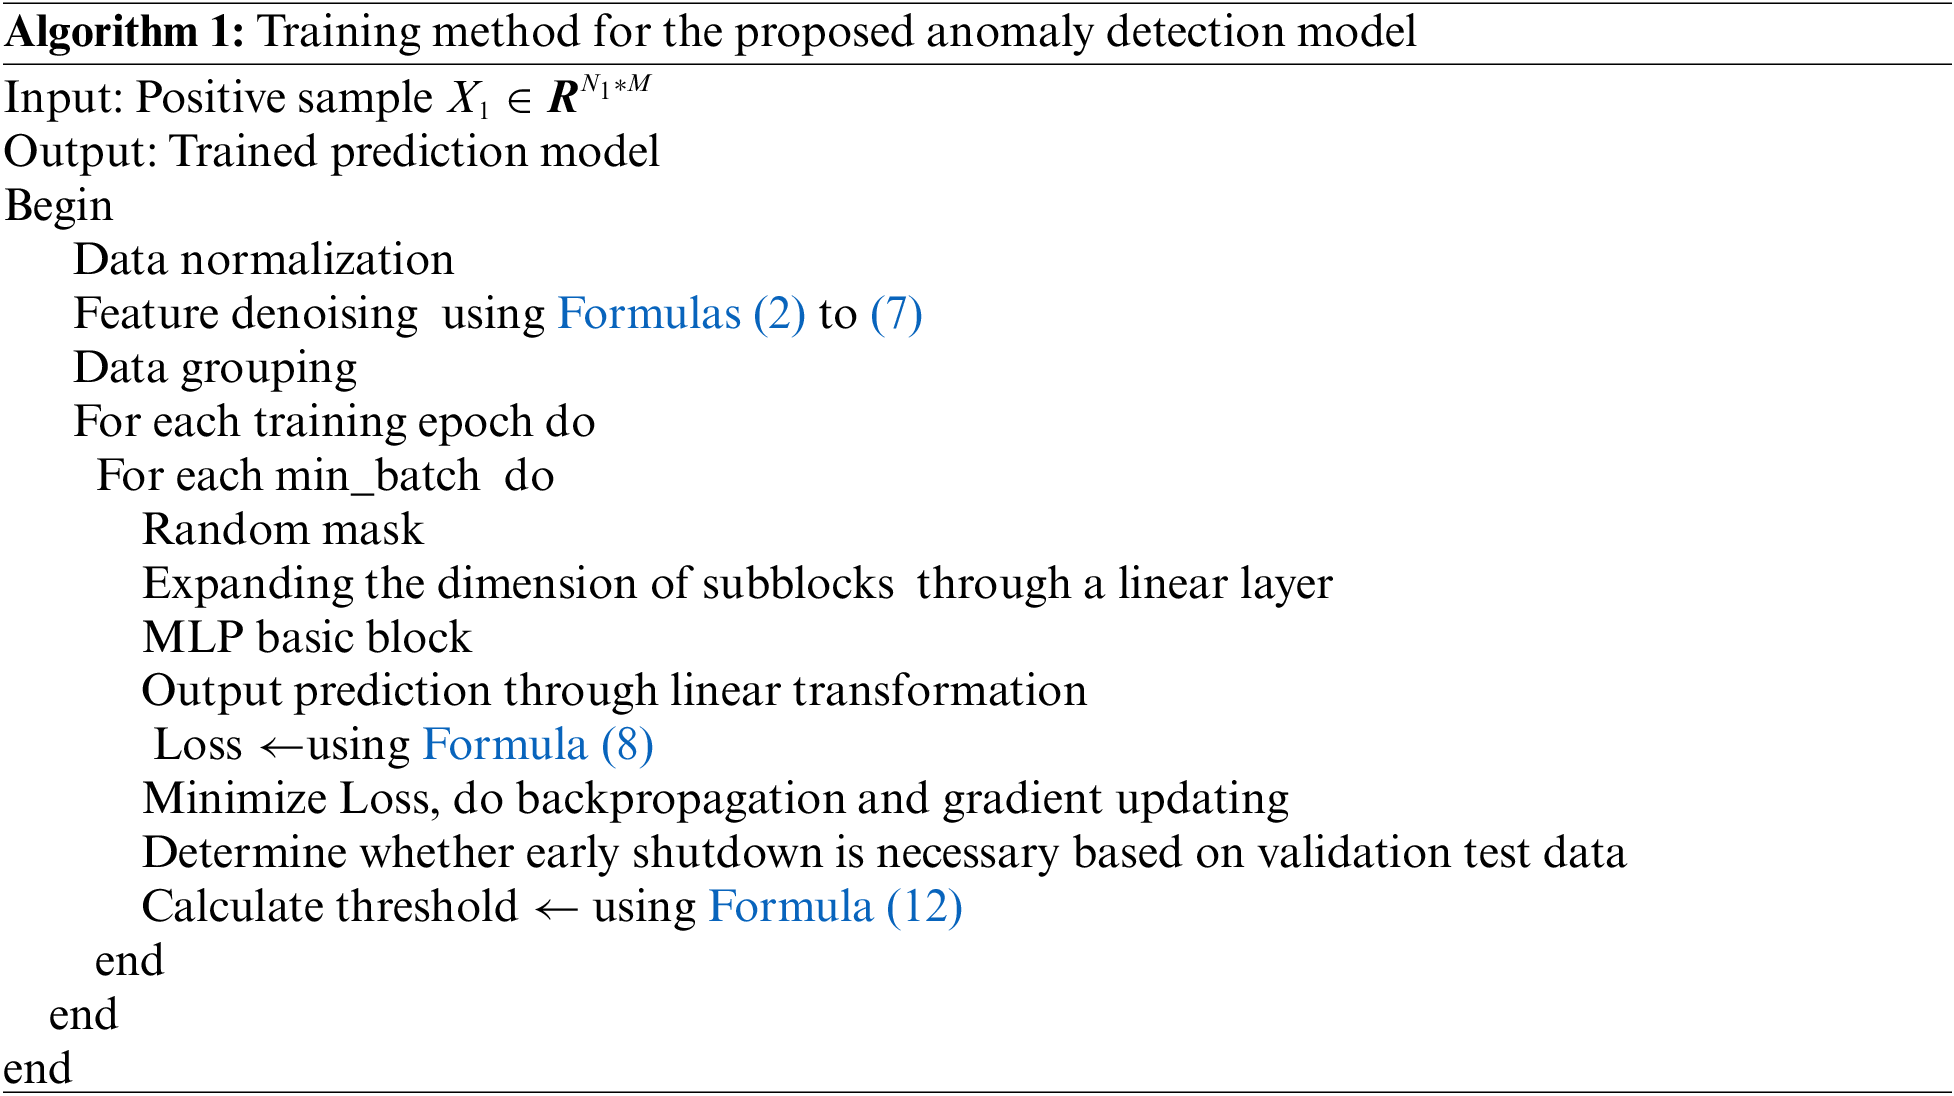
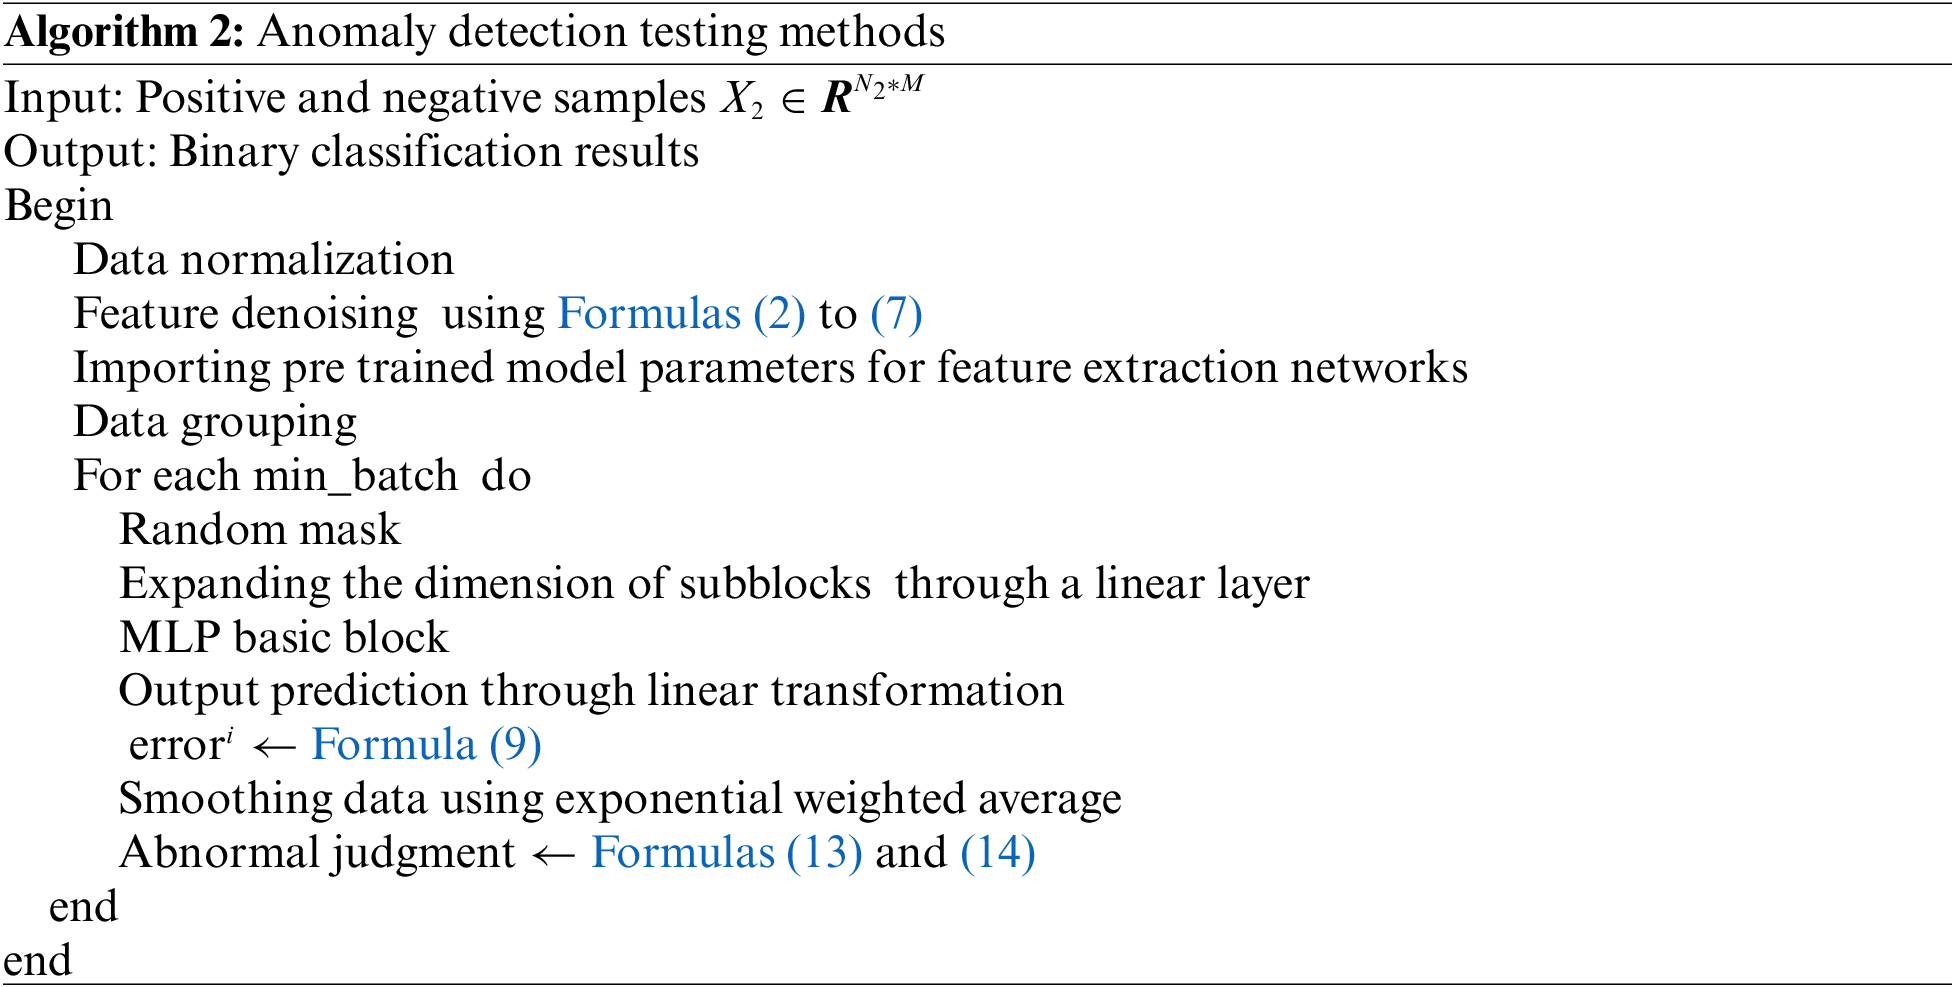
The training and testing algorithms for industrial control anomaly detection proposed in this article are shown in Algorithms 1 and 2:
To evaluate our proposed method, we used two popular industrial control datasets, SWAT and WADI. These two datasets are from the Centre for Research in Cyber Security, Singapore University of Technology and Design (iTrust).
The SWAT dataset [20] was collected from the Secure Water Treatment (SWAT) testbed. The process of water treatment is divided into six production stages: raw water supply (P1), pretreatment (P2), filtration (P3), dichlorination (P4), reverse osmosis (P5), and storage (P6). Meanwhile, we referred to the feature selection methods mentioned in the literature [21] and removed features with different data distributions in the training and testing sets (P-201), as well as features with excessively high K-S statistical scores (AIT-501, AIT-201). In addition, we also removed features with excessive oscillations in the predicted sequence (FIT-101). There are a total of 41 attacks in the SWAT dataset, among which attacks numbered 5, 9, 12, 15 and 18 were not subjected to physical impact attacks, so there were no changes to the sensors and actuators. These attack detections are not our focus, and we only tested the remaining 36 attacks.
The WADI dataset [22] was collected from the Water Distribution (WADI) testbed. The water distribution process of WADI is divided into three different control processes: primary grid (P1), secondary grid (P2), and return water grid (P3). At the same time, features with severe oscillations in the predicted sequence (2B-AIT-002-PV, 3-AIT-001-PV) and features with unchanged values were removed.
Both datasets have two sub-datasets: the first one is collected without any attacks, with 80% used as training data and 20% used as validation data; Due to the time required for transition from an empty state to a stable state during the data collection process, the first 30,000 data records were deleted; The other one is composed of data collected in the presence of attacks, which we use as test data. The main characteristics of these two datasets are shown in Table 1.

We compared the proposed method with two public popular anomaly detection methods. These two methods also grouped the data in the dataset and trained multiple models to detect anomalies. These two baseline methods include:
Reference [8]: This paper proposes an anomaly detection method for industrial control systems using sequence-to-sequence neural networks with attention. The authors grouped the data according to the production stage and learned the normal dataset in an unsupervised manner. In the detection phase, the model predicts future values based on previously observed values and detects anomalies using the difference between predicted and measured values.
Reference [23]: This method starts from a predefined range of network hyperparameters and data obtained from the operation of a non-attack system, and autonomously selects an appropriate CNN architecture and threshold for online intrusion detection. The authors chose to use univariate regression to generate separate models for each transmitted signal. In feature selection, they only used sensor data and did not use actuator data.
In this article, the SWAT and WADI datasets were tested. The optimal settings for the main parameters of the model are shown in Table 2.

The grouping of data is shown in Table 3.

In this section, we first demonstrate the effectiveness of our proposed method and analyze the missed and false alarms. Then, we compare the detection results of our proposed method with several other anomaly detection methods.
4.4.1 Test Results of Our Method
In Figs. 5 and 6, the green line represents the actual value, the red line represents the predicted value, and the black curve represents the classification label curve. A value of 1 indicates the presence of an attack, while a value of 0 indicates normal. From the normal data prediction curve shown in Fig. 5, we can observe that when the actual value slowly changes, the predicted value basically overlaps with the actual value; When the actual value has a large jump, the prediction effect is worse, but it can also reflect the jump of the actual value. In Fig. 6, it can be observed that when there is an attack, the prediction error is relatively large, as shown by the blue circle. There are also attacks outside the blue area, but since the attacks do not target all sensors, the four randomly selected sensors in this article are not affected by the attacks, so the data is still normal and the prediction error is small. The anomaly detection method we proposed is based on the prediction error of the prediction model, and experiments have shown that our method can identify attacks based on the prediction error.
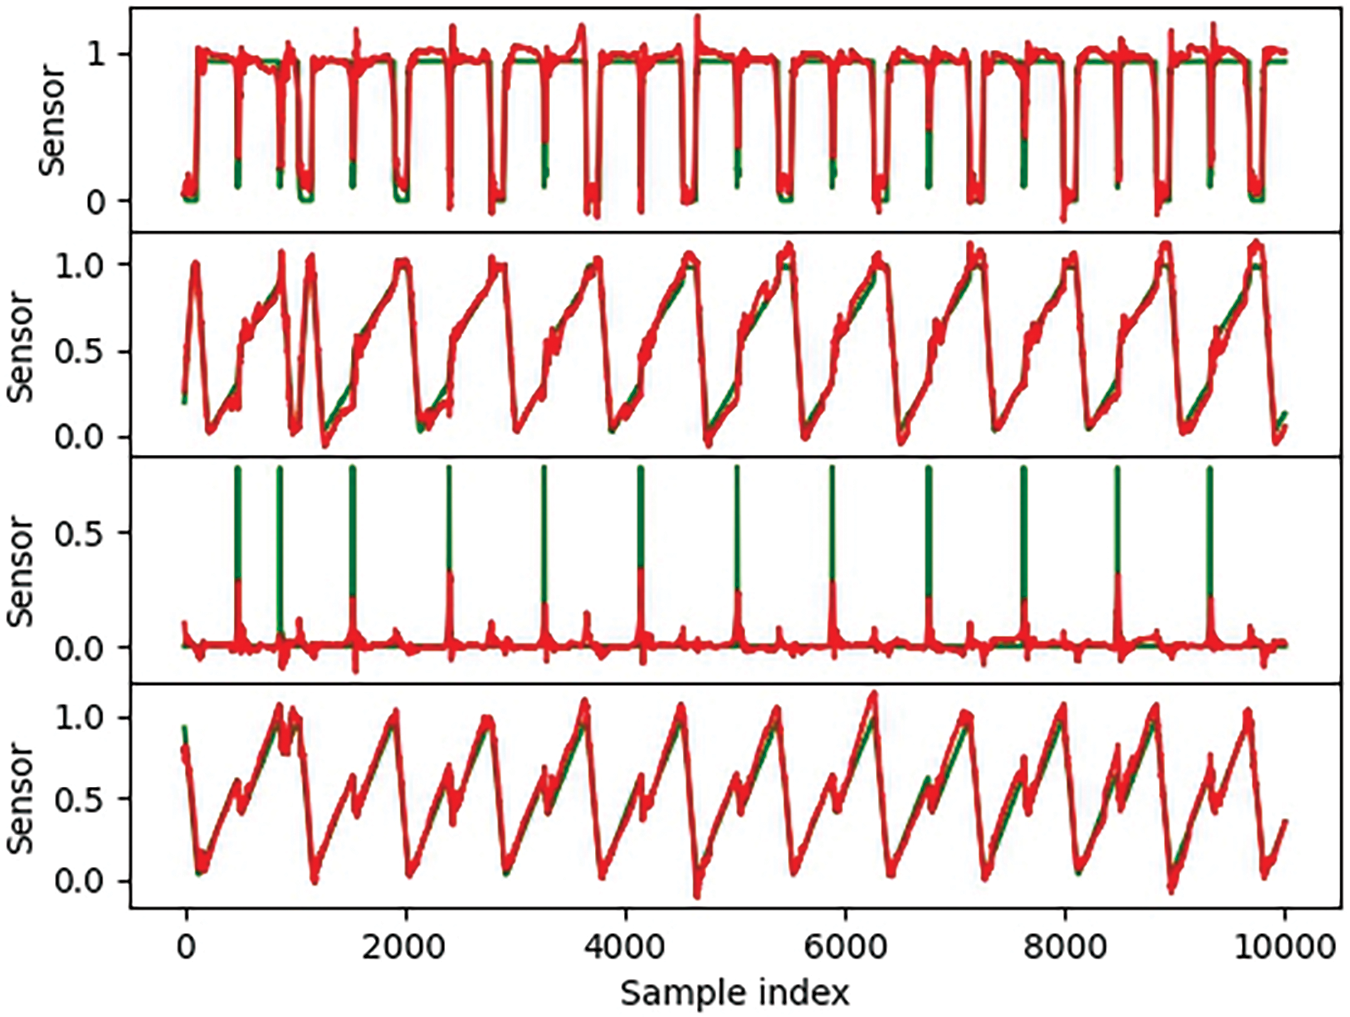
Figure 5: Results of normal data prediction in SWAT
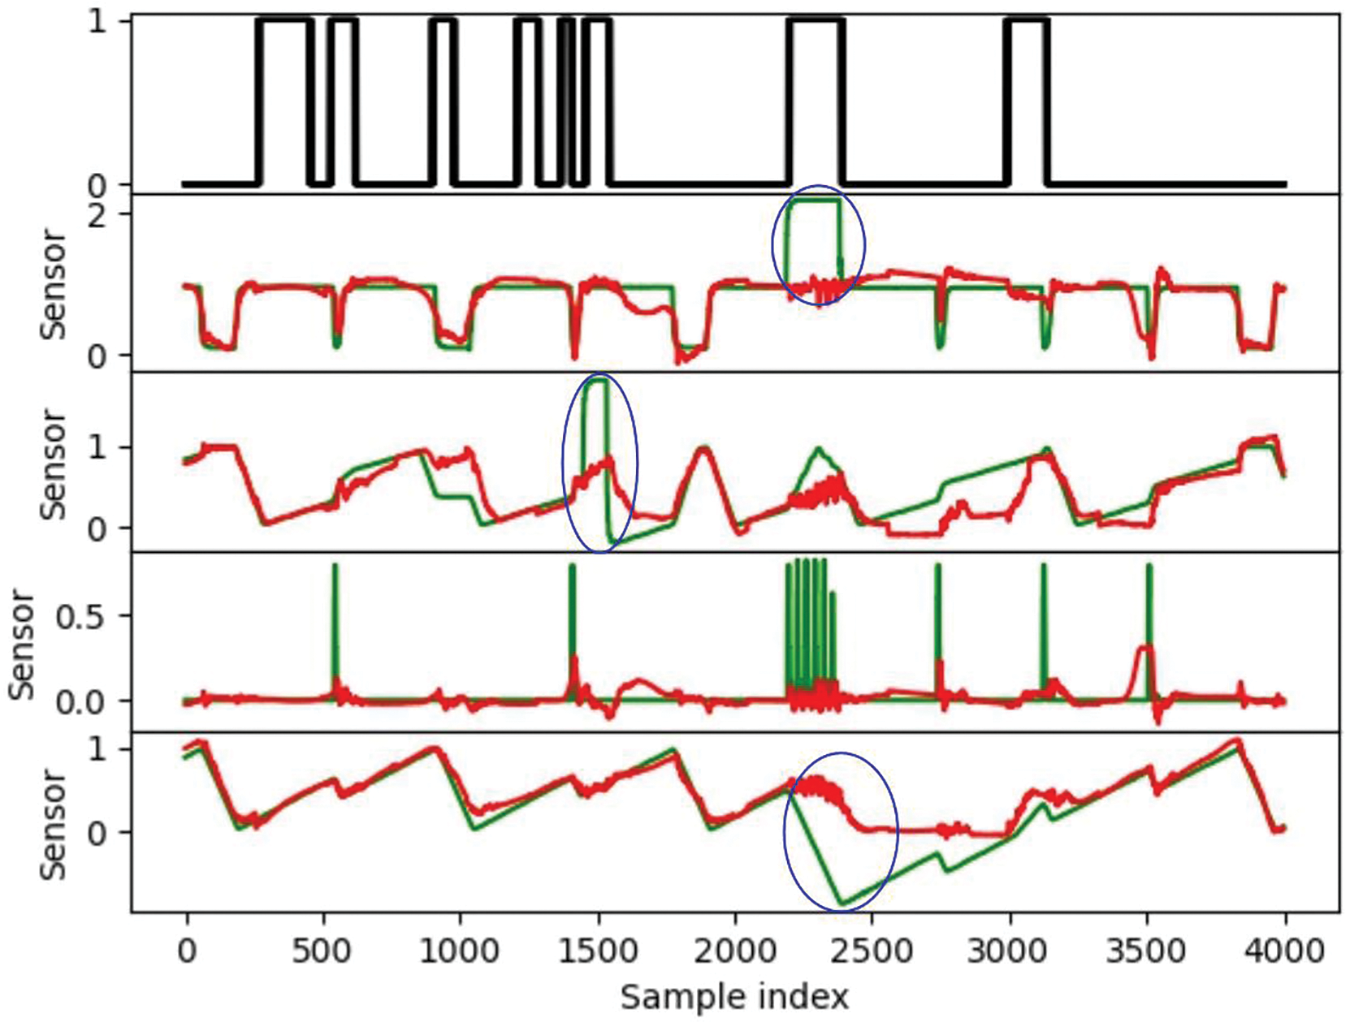
Figure 6: Results of abnormal data prediction in SWAT
The selection of a threshold is crucial in determining whether there are anomalies. We set a threshold based on the maximum prediction error of the validation set. When there is an attack, the prediction error should be much greater than the maximum value of the validation set prediction error. Therefore, the threshold calculation formula is shown in Formula (12). We detected a total of 32 attacks out of 36, but missed out on four attacks with attack numbers 4, 13, 14, and 29. In the following text, we refer to them as attack 4, attack 13, attack 14, and attack 29. Misreported false alarms 5 times, with the longest false alarm consisting of 176 samples and the shortest consisting of 13 samples. The receiver operating characteristic curve (ROC) diagram is shown in Fig. 7. The area of the ROC curve is not large, partly due to 5 false alarms, and partly because it may take some time for the data of physical components to recover to normal values after each attack. These patterns have not been seen during training and learning, and the detection model will determine them as abnormal, while the label has been set to normal values.
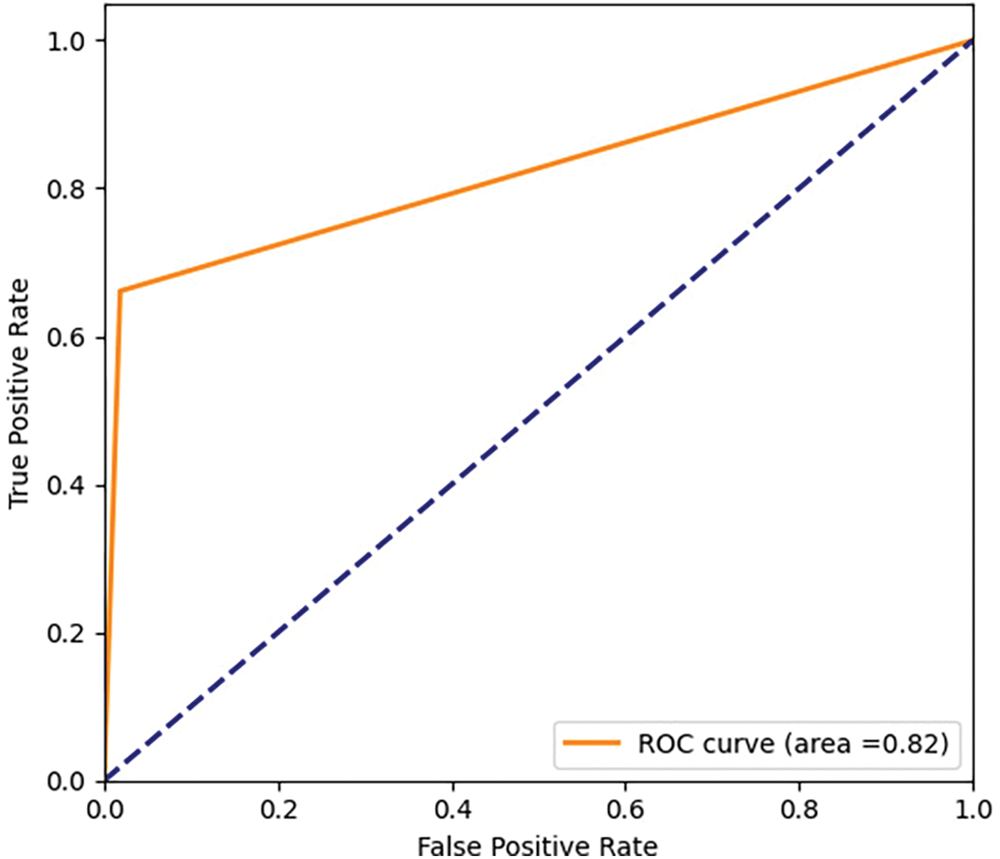
Figure 7: ROC diagram based on SWAT
(1) Misreporting analysis
From the official attack list provided by the SWAT administrator, it can be seen that attack 4 targets the actuator MV-504. It changes the MV-504 state from closed to open, while the MV-504 actuator is not present in the SWAT dataset. Its expected impact is to halt the Reverse Osmosis (RO) system shutdown sequence and reduce the lifespan of RO, but the actual result is “unexpected Outcome: No impact”. Attack 13 attempted to transition MV-304 from an open state to a closed state, but due to the late closure of MV-304, the state of MV-304 remained unchanged until the end of the attack. In the description of attack 14, it is mentioned that the attack failed because the water tank 301 was already full and the sequence did not start. The purpose of attack 29 was to cause chemical waste, but due to mechanical interlocking, the three dosing pumps did not start because of some mechanical interlock, resulting in the failure of the attack. This indicates that these four types of attacks did not have an impact on physical components or had a weak impact, therefore, these four types of attacks were not detected.
(2) False alarm analysis
False alarm 1 and false alarm 2 are triggered by LIT-301 and P-302, respectively. Attacks 10 and 11 are targeted at the fourth stage, so they have little impact on the third stage. On the other hand, attack 8 targets DPIT-301, causing the backwash process to start over and over again, resulting in changes in the water tank 301. Its attack on the P3 tank caused the liquid level to be too low, and the system needed about 6 h to fill the tank. This type of attack has a strong dynamic impact on the system and results in the system needing more time to recover to a stable state. From Fig. 8a, it can be seen that after being attacked by attack 8, the liquid level value of LIT-301 deviated significantly from the predicted value of the P-302 feed pump for a long period of time. We speculate that it is possible that these sensors or actuators are still in the recovery period, which is inconsistent with the learned normal mode, causing the anomaly detection model to classify them as abnormal. False alarm 3, false alarm 5, and false alarm 6 are also attacks against the P3 tank liquid level, and the misjudgment situations are similar.
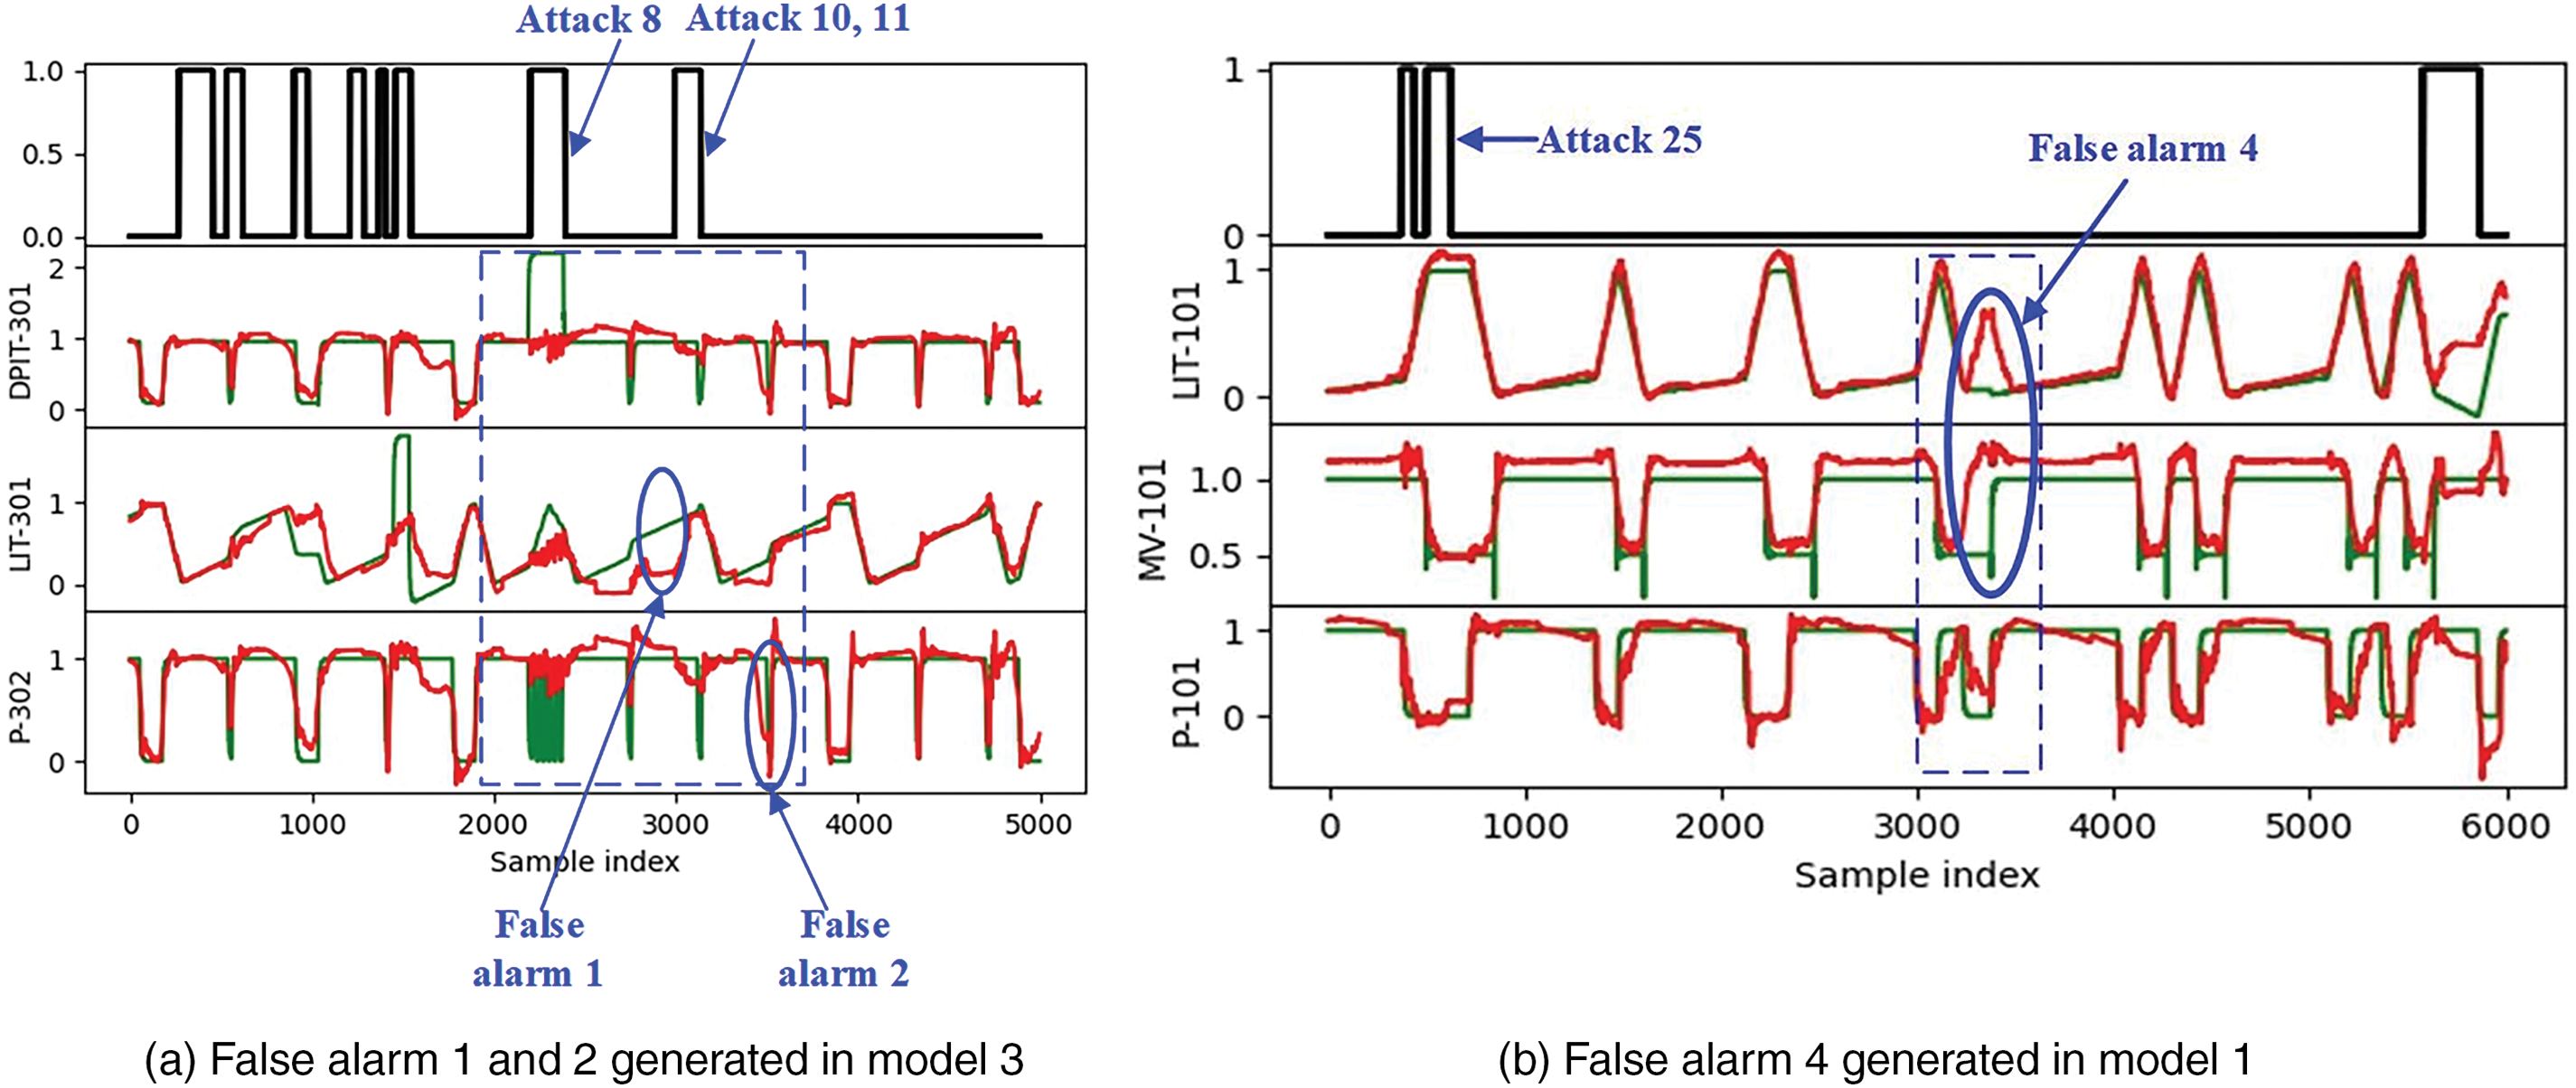
Figure 8: False alarms generated in the model
False alarm 4 is triggered by LIT-101 and MV-101. From the timing sequence in the blue dashed box of Fig. 8b, it can be seen that the electric valve MV-101 that controls the water flow into the raw water tank is in the open state, and the pump P-101 that sends the raw water tank to the second stage is in the closed state, indicating that the water tank only has water inlet but no water outlet, causing the liquid level to rapidly rise. When MV-101 closes and P-101 opens, the liquid level drops rapidly again. After both P-101 and MV-101 are closed, the value of LIT-101 should remain unchanged. However, the prediction model mistakenly predicted the state of MV-101, prematurely assuming that it was reopened, thus predicting that the water level of LIT-101 would rise again. This is inconsistent with the actual situation, which causes significant prediction errors and triggers an alarm. In addition, false alarm 5 may also be caused by LIT-101 and MV-101, in addition to being generated in the P3 stage. At this point, the timing waveform of the system is similar to Fig. 8b.
In order to understand the usefulness of distributed, sequential bilateral filters, and random masks, we conducted three ablation experiments. Experiment 1 does not use a distributed model; Experiment 2 uses a variant model without random masks; Experiment 3 uses a model with removed sequential bilateral filters. The experimental results are shown in Fig. 9, Tables 4, and 5. We can see that distributed variants have a lower missed detection rate. The false alarm rate is higher for models without masks, indicating that models with masks can reduce redundancy to a certain extent and reduce overfitting of linear models. In SWAT, when filtering is removed, noisy data is not effectively removed from the data, and the noisy data is also learned as normal data, weakening the correlation and periodicity of the original data and mistaking attacks for normal data. In a distributed environment, the model using a sequential bilateral filter and a random mask result in the least missed and false detections.
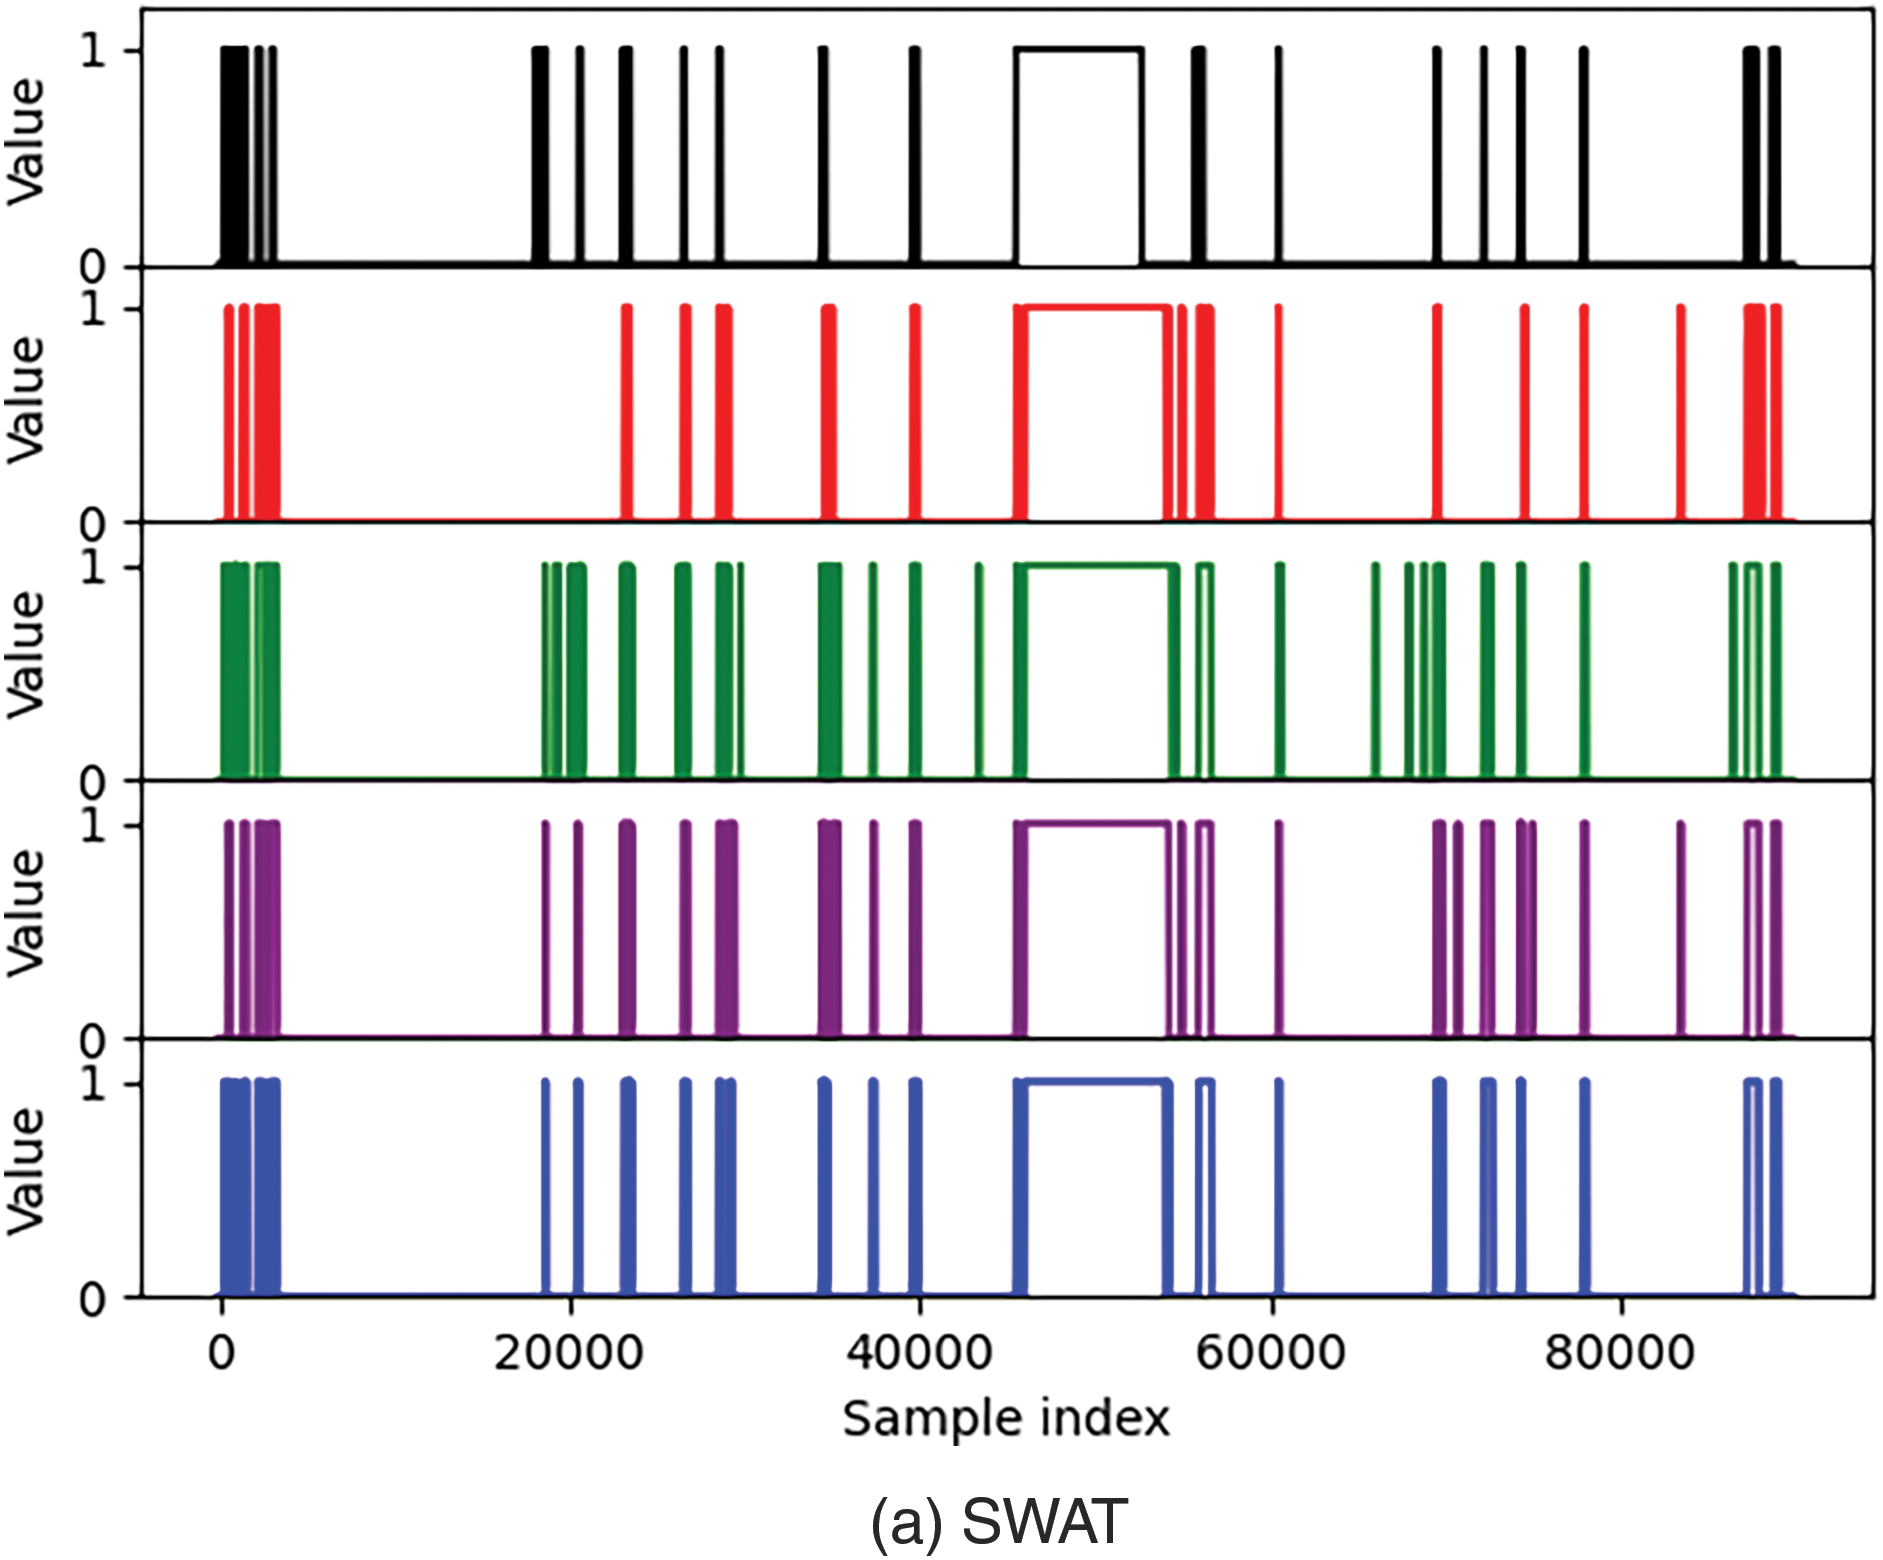
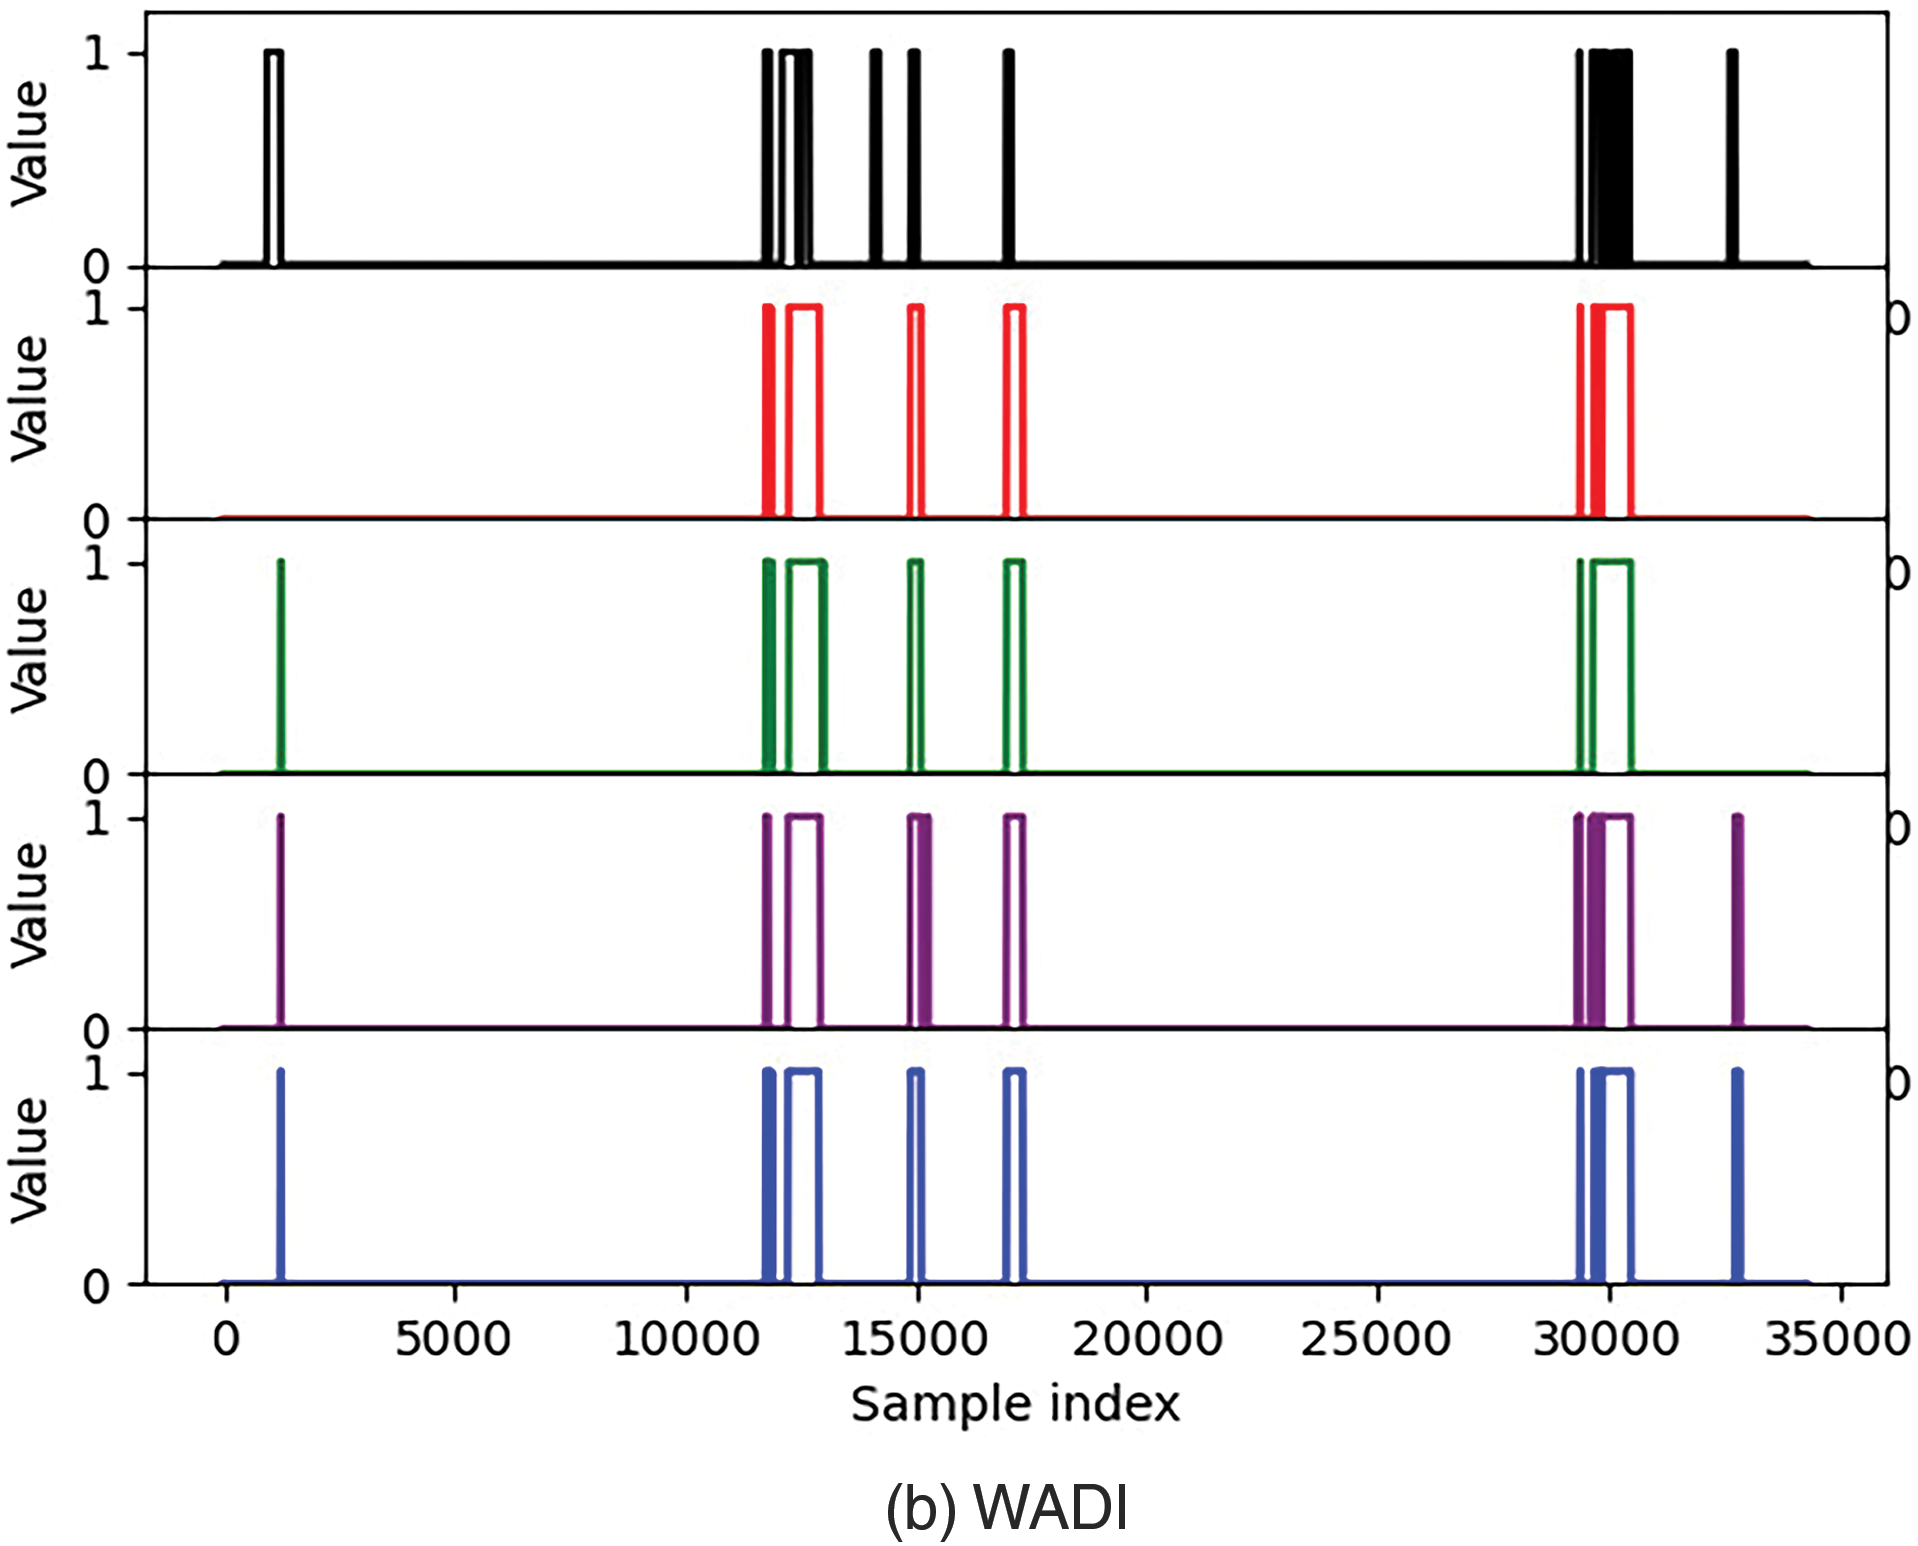
Figure 9: Comparison of predicted labels for three ablation experiments


4.4.3 Comparison Results with Other Baseline Methods
In this section, we compared the proposed method with two public popular anomaly detection methods on the types of attacks identified and detection time. To ensure the fairness of comparison, we have specified a uniform standard when realizing the baseline methods: the total amount of data input to the model is the same; downsampling is adopted in all methods; and when judging anomalies, only when the predicted label is consistent with the actual label, it is considered an abnormal signal. When realizing Reference [23], it was found that in order to ensure that the training set and validation set have the same data distribution, the original text was shuffled after generating ordered pairs. However such a measure will result in the leakage of information from the training data to the validation set. Therefore, when conducting FIR+CNN simulation experiments, we first partition the dataset, then generate ordered pairs, and finally shuffle the ordered pairs. However, such processing cannot guarantee the consistency of data distribution, making it difficult to meet the original model training termination conditions in the paper. Therefore, in FIR+CNN, we set early stopping based on the loss value of the validation set. The following data is the average of the data obtained from 5 experiments.
From the results in Table 6, it can be seen that our method performs very competitively in identifying attack events. In terms of missed detection rate, our method outperforms other baseline methods, as only four attacks cannot be identified on the SWAT dataset. From the analysis of false positives, it can be seen that these four attacks have no or weak impact on physical components. Therefore, it is difficult to detect these four attacks. On the WADI dataset, attack 6 is the malicious activation of 2-MCV-101 and 2-MCV-201. However, in reality, these two actuators remained inactive and did not have a substantial impact on the physical components. Therefore, our model has successfully detected the actual executed attacks.

Fast and accurate early warning is crucial in anomaly detection. This helps to detect attacks on industrial control systems as early as possible, avoiding physical harm, so we calculated the first warning time for discovering anomalies. The warning time for SWAT is shown in Table 7. As for attack 1, our method issues an initial alert 99 s after the start of the attack. For attack 2, our method issues an initial alert 1 s before the attack. Attack 2 started at 10:51:08, causing P-102 to change from off to on. Through analysis of the original data, it was found that the state of P-102 had changed at 10:50:47, indicating that the actual attack had already begun from this moment. The same situation applies to attacks 6, 10, 20, 22, and 26 in the dataset. The attacks were already implemented before the dataset was labeled as attacks, indicating that our method is reasonable in detecting attacks in advance. The target of attack 17 is to force MV-303 to remain closed. Due to the lack of changes in MV-303 for over 60 min prior to attack 17, it is difficult to determine the true time of the attack. Therefore, it is possible to detect anomalies more than 6 min in advance.

We represent the minimum warning time in bold in Tables 7 and 8. In Table 7, the method proposed in Reference [8] achieved the optimal values on 5 types of attacks, the FIR+CNN method achieved the optimal values on 15 types of attacks, and our method achieved the optimal values on 17 types of attacks. In Table 8, our method achieved optimal values on 8 types of attacks, outperforming the other two methods. Overall, our method can detect attacks earlier.

In this article, we propose a distributed industrial control anomaly detection system based on a linear model, which uses a bilateral filtering algorithm of time series to remove noise in the time series. Based on different stages of the industrial control process, distributed linear deep learning is used to establish an anomaly detection model. Experiments were conducted on public datasets. Compared with the baseline methods, our method divides tasks based on the connectivity of industrial control processes, which is more effective in identifying the types of attacks. When building a practical anomaly detection system, our method obtains the threshold of each physical component through test data, which not only effectively identifies abnormal situations, but also locates the sensors that cause anomalies.
Although the method proposed in this article has achieved good anomaly detection results, there are still some points that can be improved. For example, the area of the ROC curve is not large, which may be attributed to the fact that some attacks require a certain amount of time for the system state to recover to normal values, which can easily lead to misjudgments. In the future, the interpretability of the internal structure of deep neural networks can be increased, further improving the performance of the system. Besides, the lack of consideration for obscure connections between processes when grouping data is also a problem that needs to be addressed in subsequent work.
Acknowledgement: We would like to thank iTrust, Centre for Research in Cyber Security, Singapore University of Technology and Design for providing SWAT and WADI datasets.
Funding Statement: This article is supported in part by the Guangxi Science and Technology Major Program under grant AA22068067, the Guangxi Natural Science Foundation under grant 2023GXNSFAA026236 and 2024GXNSFDA010064, and the National Natural Science Foundation of China under project 62172119.
Author Contributions: The authors confirm contribution to the paper as follows: study conception and design: Shijie Tang, Yong Ding; data collection: Shijie Tang, Huiyong Wang; analysis and interpretation of results: Shijie Tang, Yong Ding; draft manuscript preparation: Huiyong Wang. All authors reviewed the results and approved the final version of the manuscript.
Availability of Data and Materials: The datasets generated and/or analyzed during the current study are available in the (SWAT and WADI) repository, https://itrust.sutd.edu.sg/itrust-labs_datasets/dataset_info/ (accessed on 21 October 2024).
Ethics Approval: Not applicable.
Conflicts of Interest: The authors declare no conflicts of interest to report regarding the present study.
References
1. Lee and A. Edward, “Cyber physical systems: Design challenges,” in Proc. 2008 11th IEEE Int. Symp. Object Comp.-Oriented Real-Time Distrib. Comput. (ISORC), Orlando, FL, USA, IEEE, 2008, pp. 363–369. [Google Scholar]
2. Case D U, Analysis of the Cyber Attack on the Ukrainian Power Grid. Washington, DC, USA: Electricity Information Sharing and Analysis Center (E-ISAC2016, pp. 1–22. [Google Scholar]
3. C. James, A. Rubin, and L. Watkins, “Don’t drink the cyber: Extrapolating the possibilities of Oldsmar’s water treatment cyberattack,” in Proc. 2022 Int. Conf. Cyber Warf. Secur., New York, 2022, vol. 17, no. 1. [Google Scholar]
4. W. Li, L. Xie, Z. Deng, and Z. Wang, “False sequential logic attack on SCADA system and its physical impact analysis,” Comput. Secur., vol. 58, pp. 149–159, 2016. doi: 10.1016/j.cose.2016.01.001. [Google Scholar] [CrossRef]
5. R. Langner, “Stuxnet: Dissecting a cyberwarfare weapon,” IEEE Secur. Priv., vol. 9, no. 3, pp. 49–51, 2011. doi: 10.1109/MSP.2011.67. [Google Scholar] [CrossRef]
6. H. Gao, B. Qiu, R. J. D. Barroso, W. Hussain, Y. Xu and X. Wang, “TSMAE: A novel anomaly detection approach for internet of things time series data using memory-augmented autoencoder,” IEEE Trans. Netw. Sci. Eng., vol. 10, no. 5, pp. 2978–2990, 2022. doi: 10.1109/TNSE.2022.3163144. [Google Scholar] [CrossRef]
7. J. Lee, The Revolutionary Transformation and Value Creation in Industry 4.0 Era. Beijing: China Machine Press, 2015. [Google Scholar]
8. J. Kim, J. H. Yun, and H. C. Kim, “Anomaly detection for industrial control systems using sequence-to-sequence neural networks,” in Comp. Secur.: ESORICS 2019 Int. Workshops, Luxembourg City, Luxembourg, Sep. 26–27, 2020, pp. 3–18. [Google Scholar]
9. T. Zhang et al., “When moving target defense meets attack prediction in digital twins: A convolutional and hierarchical reinforcement learning approach,” IEEE J. Sel. Areas Commun., vol. 41, no. 10, pp. 3293–3305, 2023. doi: 10.1109/JSAC.2023.3310072. [Google Scholar] [CrossRef]
10. Y. Yin et al., “IGRF-RFE: A hybrid feature selection method for MLP-based network intrusion detection on UNSW-NB15 dataset,” J. Big Data, vol. 10, no. 1, 2023, Art. no. 15. doi: 10.1186/s40537-023-00694-8. [Google Scholar] [CrossRef]
11. E. Mushtaq, A. Zameer, and A. Khan, “A two-stage stacked ensemble intrusion detection system using five base classifiers and MLP with optimal feature selection,” Microprocess. Microsyst., vol. 94, no. 104660, 2022, Art. no. 104660. doi: 10.1016/j.micpro.2022.104660. [Google Scholar] [CrossRef]
12. A. Zeng, M. Chen, L. Zhang, and Q. Xu, “Are transformers effective for time series forecasting?” in Proc. AAAI Conf. Artif. Intell., Washington, DC, USA, 2023, vol. 37, pp. 11121–11128. doi: 10.1609/aaai.v37i9.26317. [Google Scholar] [CrossRef]
13. V. Ekambaram, A. Jati, N. Nguyen, P. Sinthong, and J. Kalagnanam, “TSMixer: Lightweight mlp-mixer model for multivariate time series forecasting,” in Proc. ACM SIGKDD Int. Conf. Know. Disc. Data Min., Xi’an, China, 2023, pp. 459–469. [Google Scholar]
14. H. Li, H. Xu, W. Peng, C. Shen, and X. Qiu, “Multi-scale sampling based MLP networks for anomaly detection in multivariate time series,” in Proc. 29th IEEE Int. Conf. Parallel Distrib. Syst. (ICPADS), China, Ocean Flower Island, 2023, pp. 1421–1428. [Google Scholar]
15. K. He, X. Chen, S. Xie, Y. Li, P. Dollár and R. Girshick, “Masked autoencoders are scalable vision learners,” in Proc. IEEE/CVF Conf. Comput. Vis. Pattern Recognit., New Orleans, LA, USA, 2022, pp. 16000–16009. [Google Scholar]
16. Y. Fu and F. Xue, “MAD: Self-supervised masked anomaly detection task for multivariate time series,” in Int. Joint Conf. Neural Netw. (IJCNN), Padua, Italy, 2022, pp. 1–8. [Google Scholar]
17. K. Zhao, X. Zhao, Z. Zhang, and M. Li, “MAE4Rec: Storage-saving transformer for sequential recommendations,” in Proc. 31st ACM Int. Conf. Inform. Know. Manag., Atlanta, GA, USA, 2022, pp. 2681–2690. [Google Scholar]
18. P. Tang and X. Zhang, “MTSMAE: Masked autoencoders for multivariate time-series forecasting,” in IEEE 34th Int. Conf. Tools with Artif. Intell. (ICTAI), Macao, 2022, pp. 982–989. [Google Scholar]
19. C. Zhang, T. Zhou, Q. Wen, and L. Sun, “TFAD: A decomposition time series anomaly detection architecture with time-frequency analysis,” in Proc. 31st ACM Int. Conf. Inform. Know. Manag., Atlanta, USA, 2022, pp. 2497–2507. [Google Scholar]
20. J. Goh, S. Adepu, K. N. Junejo, and A. Mathur, “A dataset to support research in the design of secure water treatment systems,” in Critical Inform. Infrast. Secur.: 11th Int. Conf., CRITIS 2016, Paris, France, Oct. 10–12, 2016. [Google Scholar]
21. Á.L. PeralesGómez, L. Fernández Maimó, A. H. Celdrán, and F. J. García Clemente, “Madics: A methodology for anomaly detection in industrial control systems,” Symmetry, vol. 12, no. 10, 2020, Art. no. 1583. doi: 10.3390/sym12101583. [Google Scholar] [CrossRef]
22. C. M. Ahmed, V. R. Palleti, and A. P. Mathur, “WADI: A water distribution testbed for research in the design of secure cyber physical systems,” in Proc. 3rd Int. Workshop Cyber-Phy. Sys. Smart Water Netw., PA, USA, 2017, pp. 25–28. [Google Scholar]
23. D. Nedeljkovic and Z. Jakovljevic, “CNN based method for the development of cyber-attacks detection algorithms in industrial control systems,” Comput. Secur., vol. 114, no. 2, 2022, Art. no. 102585. doi: 10.1016/j.cose.2021.102585. [Google Scholar] [CrossRef]
Cite This Article
 Copyright © 2025 The Author(s). Published by Tech Science Press.
This work is licensed under a Creative Commons Attribution 4.0 International License , which permits unrestricted use, distribution, and reproduction in any medium, provided the original work is properly cited.


 Submit a Paper
 Propose a Special lssue
 View Full Text
 Download PDF
 Downloads
 Citation Tools