 Open Access
ARTICLE
Attention Eraser and Quantitative Measures for Automated Bone Age Assessment
College of Computer and Information Science, Chongqing Normal University, Chongqing, 401331, China
* Corresponding Author: Lei Yu. Email:
(This article belongs to the Special Issue: Medical Imaging Based Disease Diagnosis Using AI)
Computers, Materials & Continua 2025, 82(1), 627-644. https://doi.org/10.32604/cmc.2024.056077
Received 13 July 2024; Accepted 10 October 2024; Issue published 03 January 2025
Abstract
Bone age assessment (BAA) aims to determine whether a child’s growth and development are normal concerning their chronological age. To predict bone age more accurately based on radiographs, and for the left-hand X-ray images of different races model can have better adaptability, we propose a neural network in parallel with the quantitative features from the left-hand bone measurements for BAA. In this study, a lightweight feature extractor (LFE) is designed to obtain the feature maps from radiographs, and a module called attention eraser module (AEM) is proposed to capture the fine-grained features. Meanwhile, the dimensional information of the metacarpal parts in the radiographs is measured to enhance the model’s generalization capability across images from different races. Our model is trained and validated on the RSNA, RHPE, and digital hand atlas datasets, which include images from various racial groups. The model achieves a mean absolute error (MAE) of 4.42 months on the RSNA dataset and 15.98 months on the RHPE dataset. Compared to ResNet50, InceptionV3, and several state-of-the-art methods, our proposed method shows statistically significant improvements (p < 0.05), with a reduction in MAE by 0.2 ± 0.02 years across different racial datasets. Furthermore, t-tests on the features also confirm the statistical significance of our approach (p < 0.05).Keywords
Bone age assessment (BAA) is crucial for diagnosing growth disorders and endocrine problems [1]. Additionally, it can be used to predict a child’s eventual adult height [2]. In clinical practices, the most commonly used standards for BAA in children are the Greulich and Pyle (G&P) standard [3] and the Tanner-Whitehouse (TW3) standard [4]. In the G&P method, bone age is analyzed by comparing X-ray images with annotated image sets, a process that can result in significant variabilities [5]. The TW3 method identifies twenty specific regions of interest (ROIs) and assigns a score to each ROI based on the analysis of structural features such as shape, intensity, and texture. These scores are then combined to determine the final bone age.
With the development of medical image processing technology, various automated bone age assessment methods based on machine learning have been proposed [6–8]. Nevertheless, these models are complex, and the identified key parts lack sufficient accuracy. Additionally, Tanner et al. [9–11] have reported challenges in converting morphological features into quantitative measurements when applying the G&P method. In recent years, several evaluation indicators for BAA have been proposed [12], and these indicators show a strong correlation with bone age.
In this study, we use eight quantitative features, including the width and length of the second to fifth metacarpal bones. We integrate the high-level semantic features extracted from the network with these quantitative features to improve the accuracy of BAA. The main contributions of this study are summarized as follows:
(1) Propose a feature fusion method based on the attention eraser module (AEM). This module can locate key regions in an unsupervised manner. In addition, it utilizes an attention map to erase parts of the original image and fuses the features extracted from the erased image to obtain the final high-level semantic feature vector.
(2) To the best of our knowledge, it is the first time to fuse features extracted by the proposed model and quantitative features from left-hand radiographs. The predicted result has a lower mean absolute error (MAE) compared to models using only quantitative features.
(3) Validate the proposed method across different datasets and races. We conduct training and testing on various datasets and races to demonstrate the effectiveness of the proposed method and perform statistical tests and analyses. The results show the superiority of the proposed framework over some state-of-the-art methods.
2.1 Machine Learning and Deep Learning Methods
Existing algorithms for automated bone age assessment can be primarily categorized into two types: traditional machine learning methods and deep learning methods. The traditional machine learning methods typically follow a two-stage process, involving the extraction of image features followed by the application of regression algorithms to predict bone age. However, the features used in these methods are often predefined and rely heavily on subjective judgment. Kashif et al. [13] employed SIFT, BRISK, and FREAK to extract and describe discriminative parts in hand bone images, achieving the best mean absolute error (MAE) of 0.605 years using dense SIFT. Davis et al. [14] combined image processing and feature extraction algorithms to automate the TW3 method, extracting 25 geometric features associated with the phalanges, epiphyses, and metaphyses to assist clinicians in achieving more accurate bone age assessments. In recent years, deep learning-based methods have also been widely applied to automated bone age assessment [15,16]. By incorporating convolutional neural networks (CNNs), these approaches can autonomously learn and extract features, thereby improving prediction accuracy with richer semantic information. Chen et al. [17] developed a two-stage model that utilizes attention mechanisms and age distribution learning. In the first stage, the model focuses on locating and cropping RoIs, and in the second stage, a regression network is designed to predict bone age based on these RoIs. Compared to these methods, our proposal does not require manual intervention and can be trained together with the bone age prediction network as a one-stage model. The attention eraser module, based on attention mechanisms, accurately locates regions of interest without manual annotations, thereby extracting richer high-level semantic features.
2.2 Quantitative Measures in BAA
In prior studies [12], features such as the length, width, and thickness of the 2nd to 5th metacarpal bones and metacarpophalangeal joints have been utilized as quantitative features for bone age assessment. Haghnegahdar et al. [18] employed 21 quantitative features, including chronological age, height, trunk height, weight, the length and width of the 2nd to 5th metacarpals and metacarpophalangeal joints, to train a regression network for predicting bone age. Their experiments were conducted on Asian children datasets, achieving the best results of 0.65 years for males and 0.83 years for females. Khadilkar et al. [19] proposed using the distal phalanx of the left middle finger, the radius, and the capitate for automated BAA. Compared to the G&P and the TW3 methods, this approach demonstrated root mean square errors (RMSE) of 0.6, 0.7, and 0.6 years, along with mean differences of 0.19, 0.49, and −0.14 years by utilizing a limited number of bones. Jung et al. [20] segmented the hand bones into phalanges, metacarpals, and carpals, and they achieved a mean absolute error (MAE) of 6.45 months when using the metacarpals. In contrast to these methods, we only use eight quantitative features derived from the metacarpals, significantly reducing the cost of manual measurements. These features are combined with high-level semantic features extracted from the deep learning network for BAA, ensuring the performance of the model.
In this study, the proposed method is trained and validated on three datasets: (1) the Radiological Society of North America (RSNA) dataset originates from the pediatric bone age challenge, including 12,611 training, 1425 validation, and 200 test hand X-ray images. Each image is labeled by multiple experts, with bone ages ranging from 0 to 228 months (0–19 years). (2) The DHA dataset is derived from the digital hand atlas database system, and includes 1103 left hand radiographs from four different racial groups: Asian, African-American, Hispanic, and Caucasian. (3) The Radiological Hand Pose Estimation (RHPE) dataset contains 6288 hand X-ray images [21]. The model trained on the RSNA and RHPE dataset is transferred to different racial groups. Due to the variability in X-ray images across different races, the quantitative features are introduced to assist the network in effectively capturing the racial differences, improving the model’s prediction accuracy across various racial groups. The primary framework structure in the feature training stage is shown in Fig. 1.
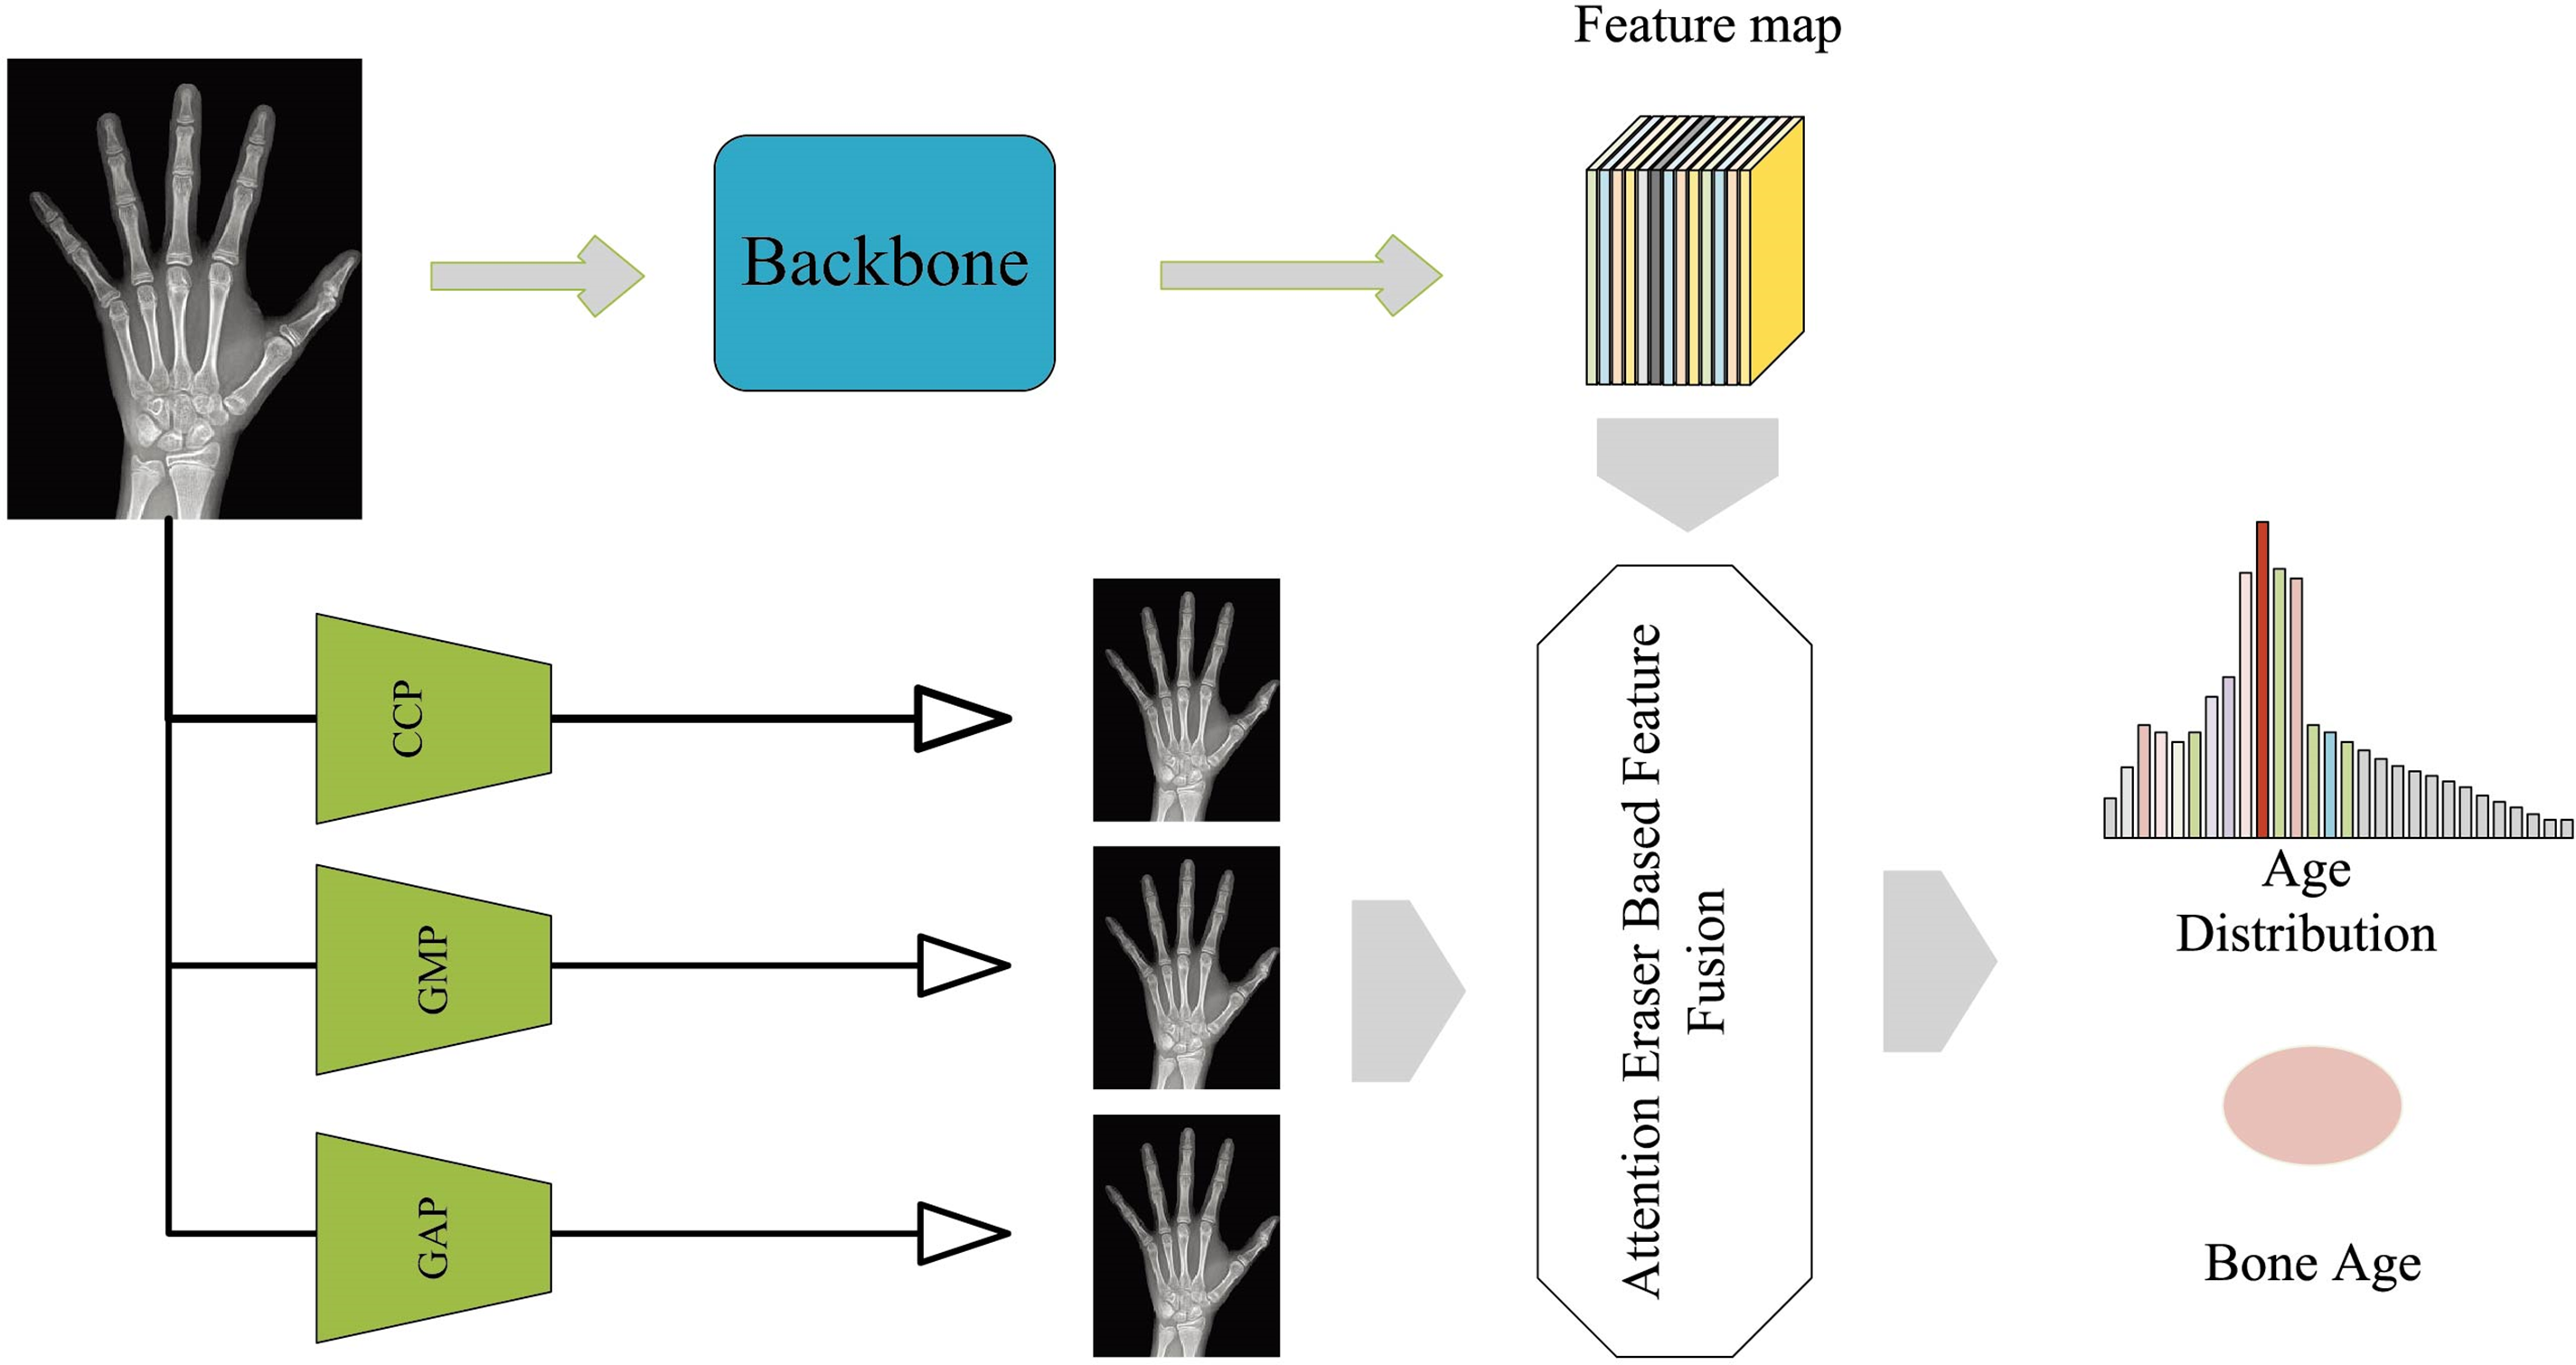
Figure 1: Framework of feature extraction stage
As shown in Fig. 1, the proposed framework is composed of two branches. One branch processes the original image through a feature extractor to obtain feature maps. The other branch pools the image with three different pooling methods, and feeds the pooled images into the attention eraser module, subsequently fusing them with the feature maps obtained from the original image, which ultimately get the bone age distribution and the bone age.
With the advancement of deep learning technology, highly effective feature extractors have been developed that exhibit remarkable performance across various tasks. However, due to the differences between radiographs and other datasets, existing feature extractors are unsuitable for the left hand X-ray images. Therefore, a lightweight feature extractor (LFE) architecture is proposed, and the details are illustrated in Fig. 2.
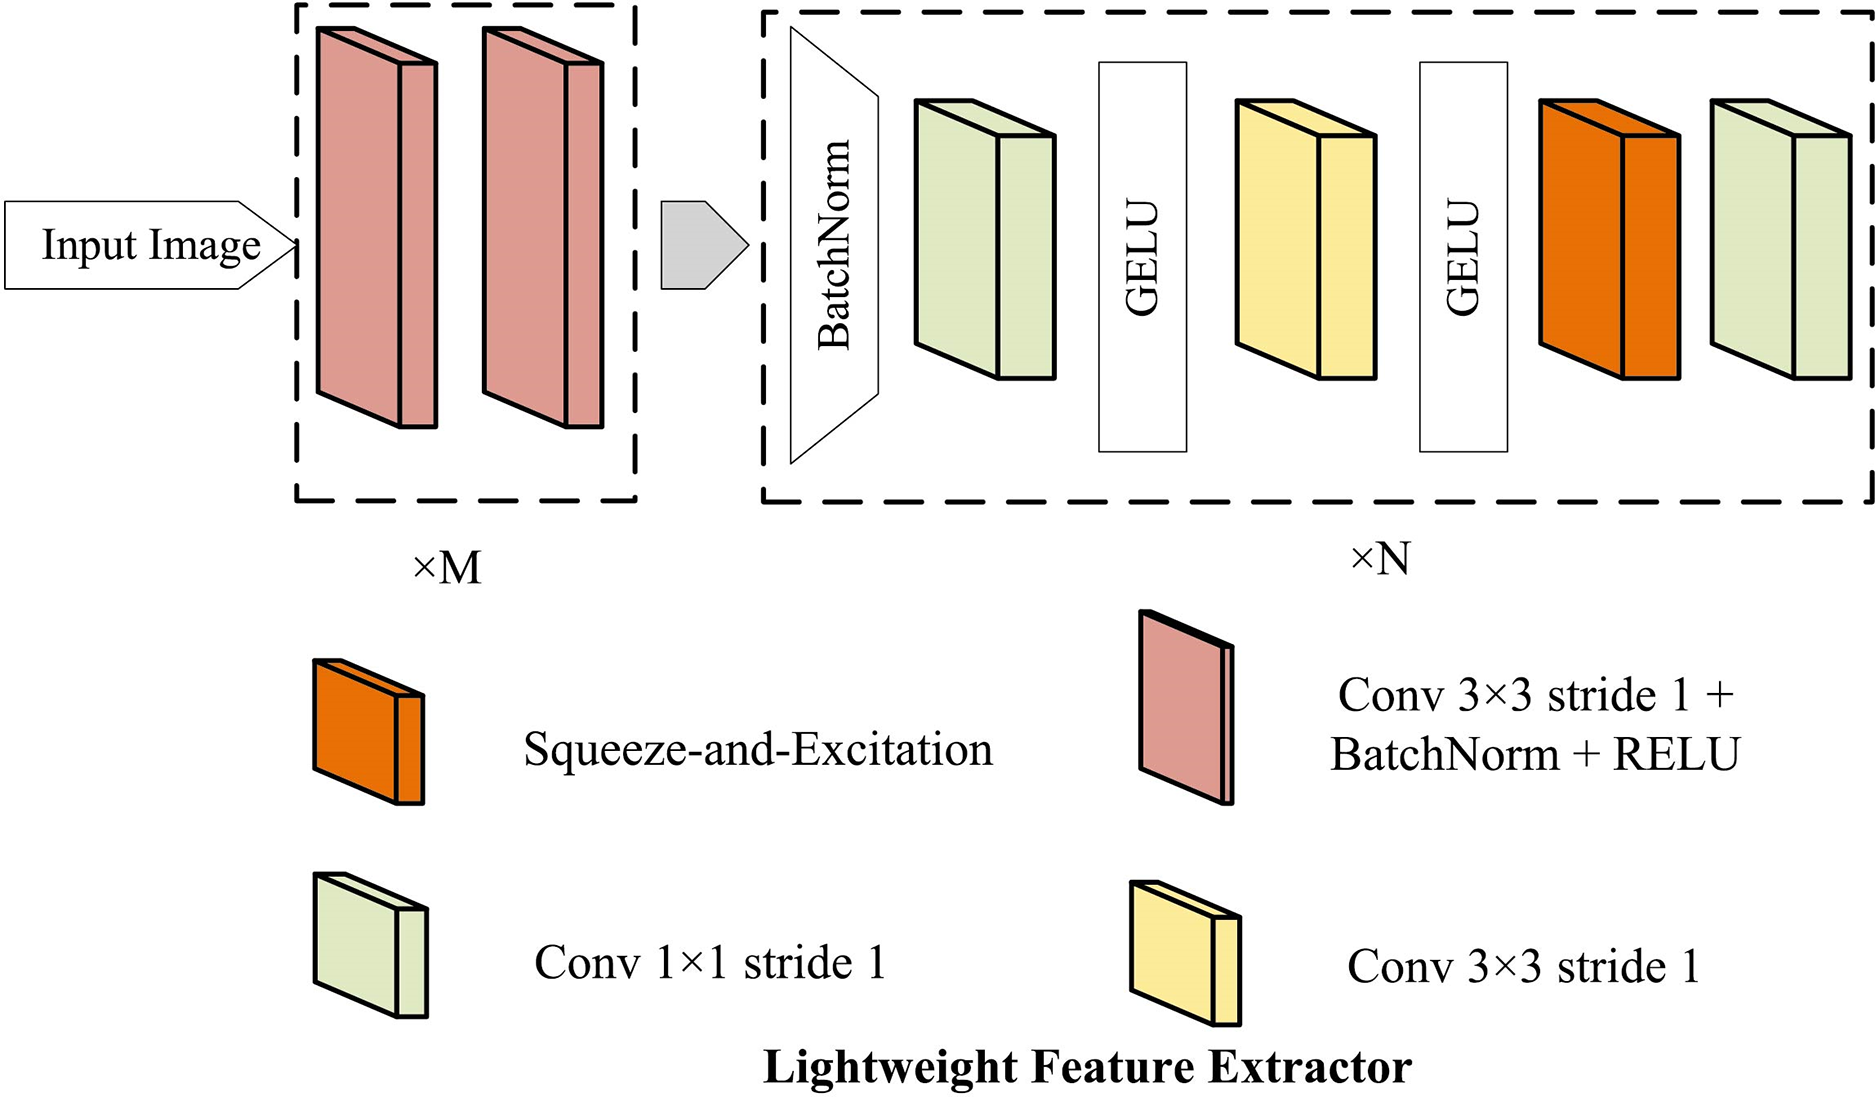
Figure 2: The proposed lightweight feature extractor (LFE)
We assume the preprocessed image as
Here,
3.2 Feature Fusion with Attention Eraser Module
The proposed feature fusion module is designed to capture comprehensive high-level semantic information while extracting finer-grained features from the pooled images. The process of the feature fusion is shown in Fig. 3. To effectively capture the global features in radiographs, the self-attention mechanism dynamically refines the feature representation by computing similarity weights among different positions in the input feature map. This approach facilitates the integration of global information, thereby enhancing the model’s performance. The process for calculating the global feature map is outlined as follows:
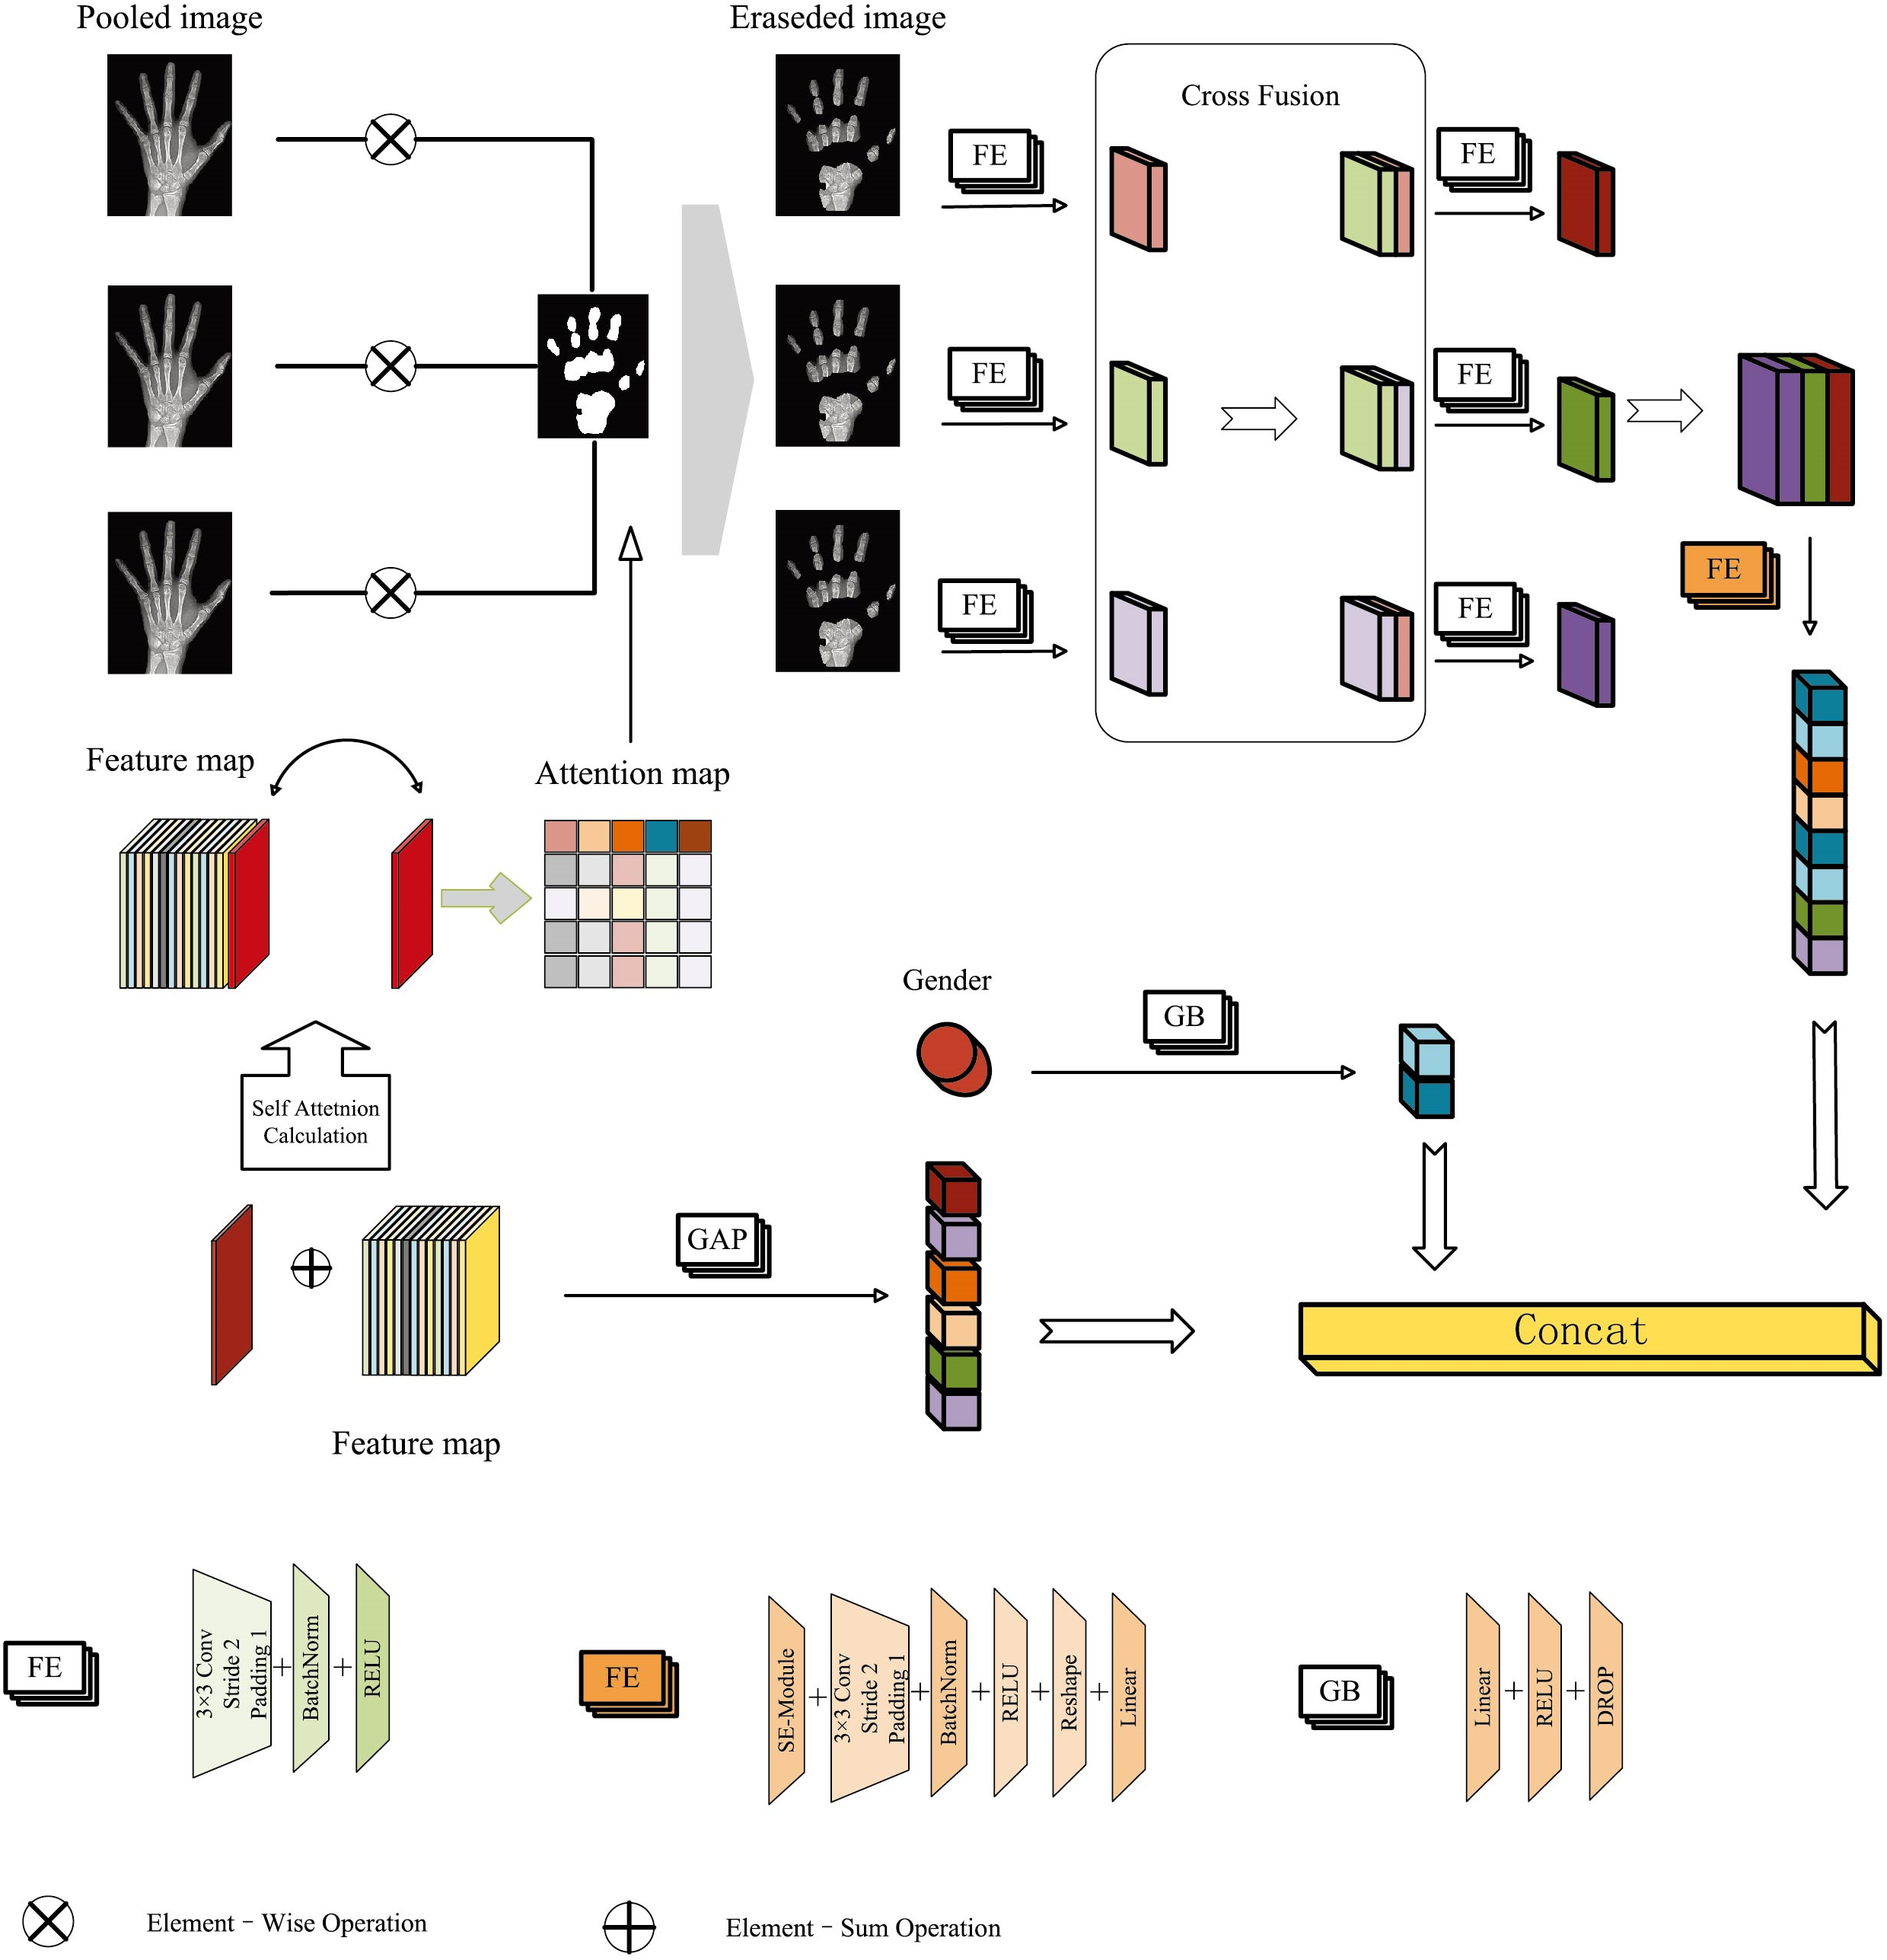
Figure 3: Feature fusion module with the attention eraser mechanism
where
By performing dot-product calculations on the query and key to get a probability distribution
We assign the last column of
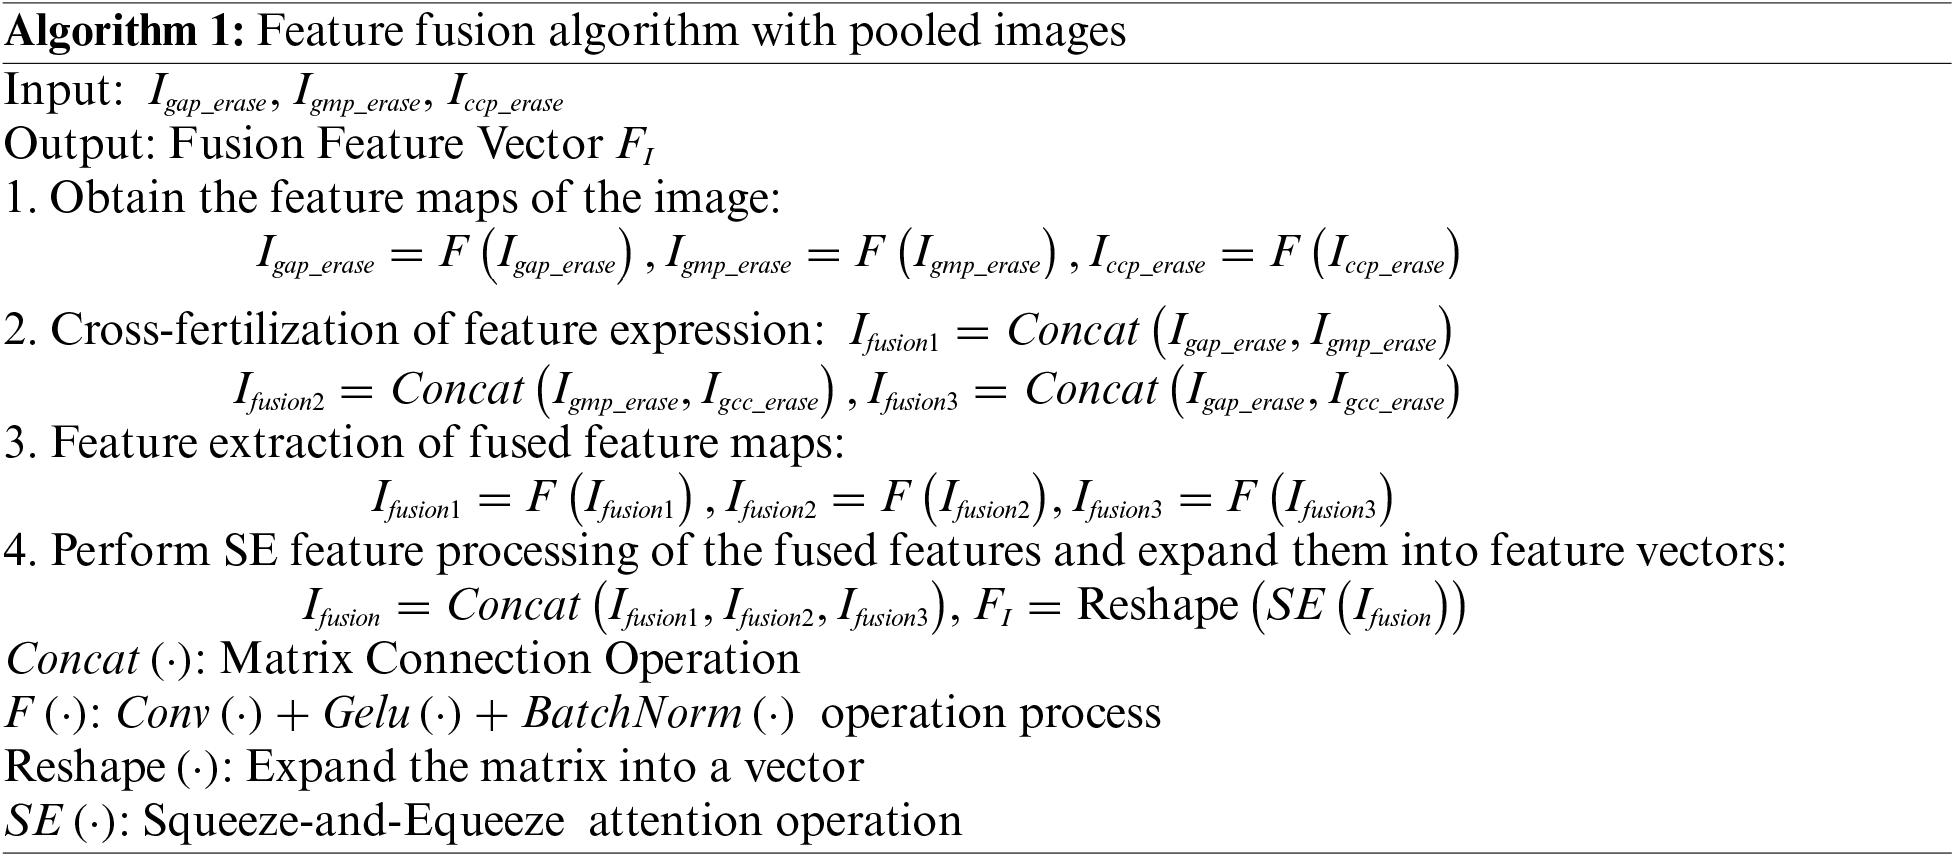
A novel approach is proposed to process the original image by combining different pooling methods to obtain fine-grained features, which improves the feature representation through the fusion of these diverse pieces of information. The fusion process is outlined in Algorithm 1. As can be seen in Fig. 1, each channel of the original image is downsampled in three different paths: Global Maximum Pooling (GMP), Global Average Pooling (GAP), and Cross Channel Pooling (CCP).
where
where
3.3 Effectiveness of Attention Eraser Module
The proposed attention eraser module is applied in the feature fusion process. It utilizes the self-attention mechanism to calculate the model’s attention map, which is then used to generate a binary mask that erases the attention regions in images at different pooling stages. The erased images are subjected to feature extraction, and the resulting feature maps undergo cross-fusion to produce a high-level semantic feature representation. The attention-erased semantic feature representation, along with the feature vector obtained directly from the original image and the gender feature vector derived through linear projection, are collectively used for bone age assessment. The introduction of the attention eraser module enables the model to capture discriminative regions across different local areas of the image. By extracting features from the images after erasing key regions, the model can more accurately and comprehensively identify fine-grained features that are crucial for bone age assessment, thereby enhancing the overall prediction accuracy.
3.4 Quantitative Features Measured from Radiograph
In this study, the width and length dimensions of the 2nd–5th metacarpal bones are selected as the quantitative features. By integrating quantitative information, the model performs better in automated BAA tasks across individuals from different racial groups. To measure the dimensions in the X-ray images of the left hand bones, Adobe Photoshop CS5 is used as the image processing tool. All radiographs are captured at a resolution of 1024 dpi (dots per inch), and all the measurements are conducted in centimeters. The measurement scale is dynamically adjusted based on the image resolution, with 250 pixels representing 25 mm. Additionally, the ruler tool is employed to measure the length and width of the metacarpal bones. Length measurements are recorded based on the values displayed after using the ruler tool to draw a line. When measuring the width of bones and joints, the zoom level is set to 400% to facilitate precise observation and measurement of details. In contrast, the zoom level is set to 100% to measure the length of bones, ensuring that the entire length is visible within the field of view. By varying the zoom level, more accurate measurements at different scales are achieved, minimizing errors associated with image resolution and enhancing the overall accuracy and reliability of the measurements.
The methodology for measuring the metacarpals is illustrated in Fig. 4. A line is drawn parallel to the long axis of the diaphysis, and the length indicated by this line is defined as the bone length. Each bone’s width is measured at its thinnest part. Consequently, a total of eight features are extracted from each sample.
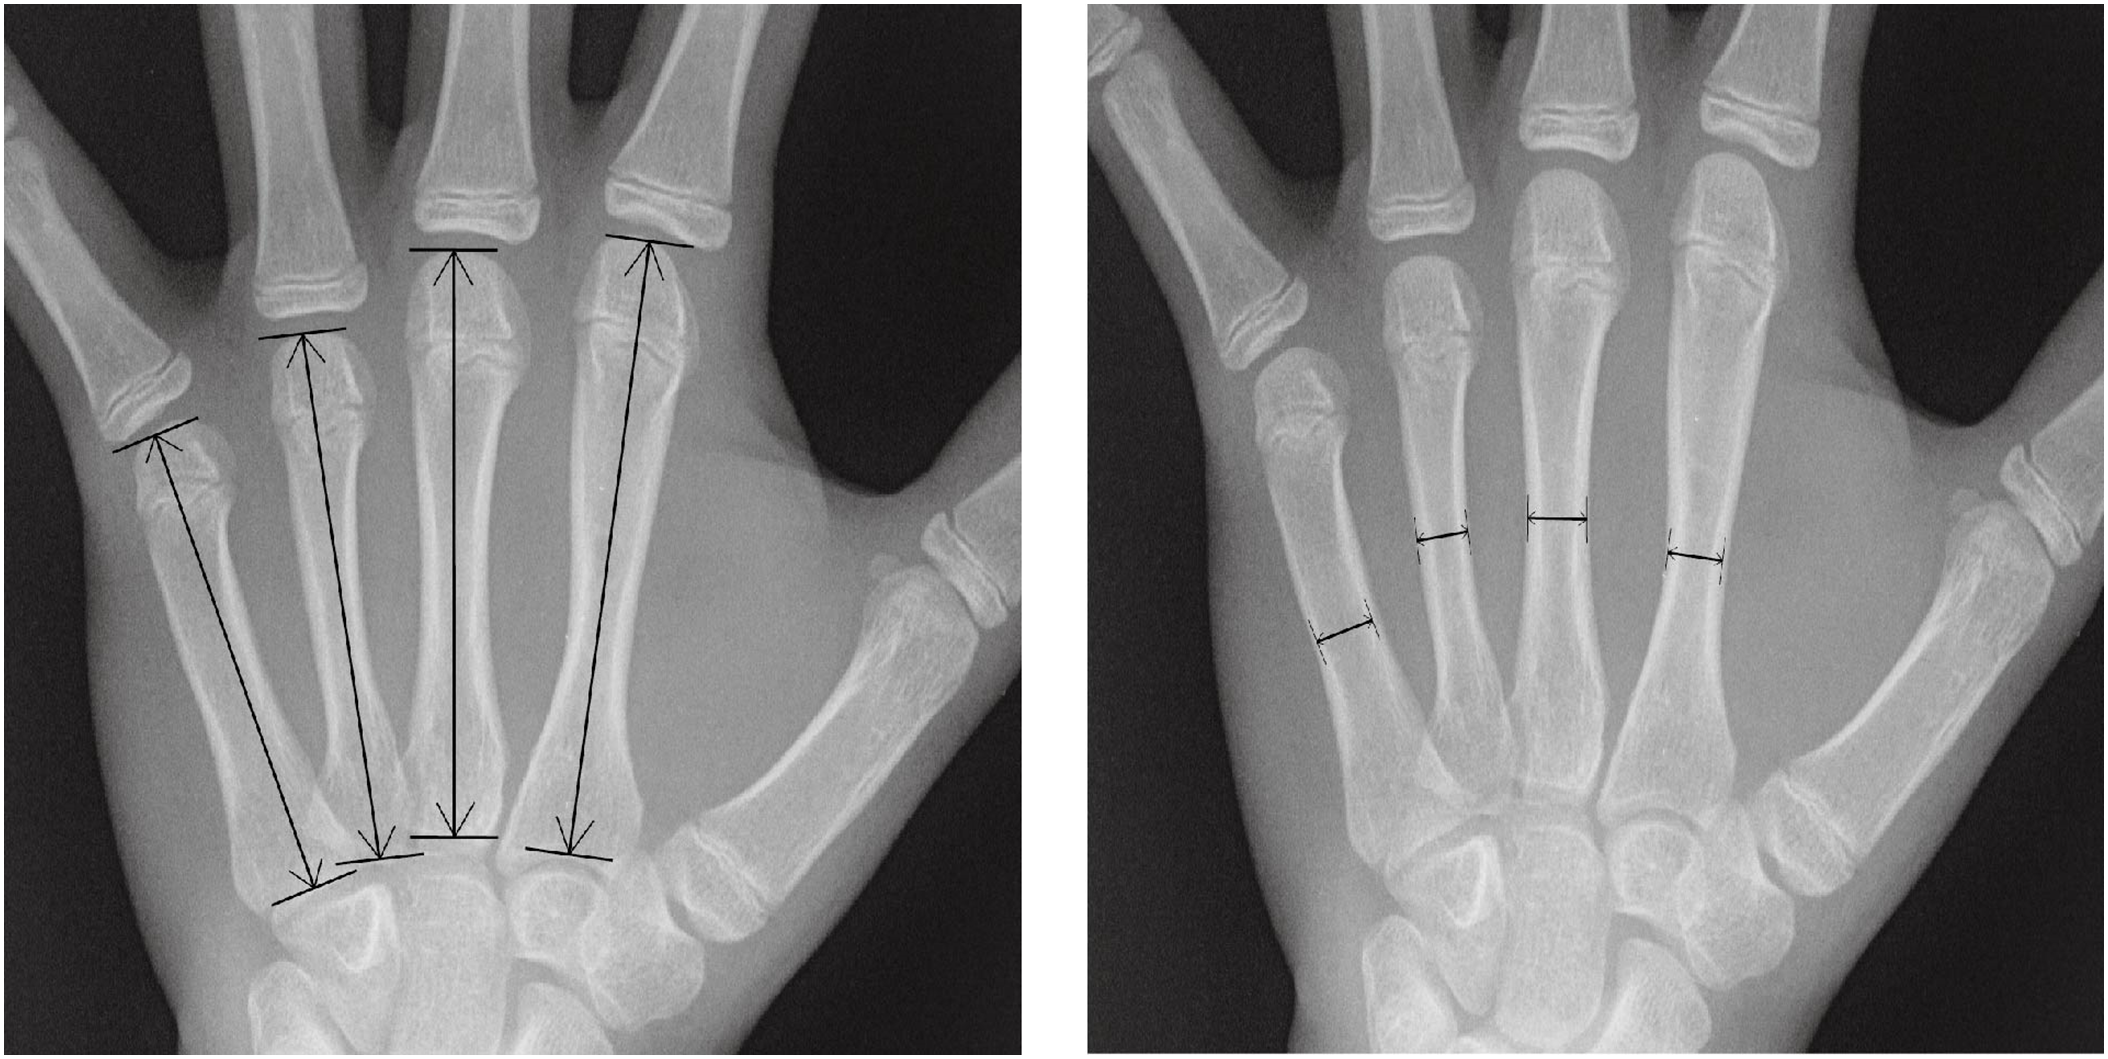
Figure 4: Quantitative feature measurements of the width and length in the metacarpal
In this study, we simultaneously train our model to learn both the age distribution and the single age label for each X-ray image. Firstly, we assume that
Then, KL scatter is employed as a measurement of divergence between the two distributions:
MAE is used as a regression loss for bone age:
Finally, the sum of the two loss functions is used as the final loss function:
In the training process, the total number of epochs is configured to 100, with a batch size of 32 and an initial learning rate of 0.0001. To optimize the network’s performance, the learning rate is reduced by half every 50 epochs. Within the lightweight feature extractor (LFE), the parameters
To evaluate the effectiveness of the attention eraser module, the ResNet50 and Inception V3 models are employed as feature extractors, with the attention eraser module integrated into each architecture. The corresponding prediction results are detailed in Table 1. As shown in Table 1, the inclusion of the attention eraser module significantly improved the performance of both the ResNet50 and Inception V3 models. Specifically, the mean absolute error (MAE) is reduced by 0.25 for the ResNet50 model and by 0.20 for the Inception V3 model. When utilizing the lightweight feature extractor (LFE), the resulting MAE is 4.42. In comparison to other feature extractors, the LFE exhibits enhanced feature extraction capabilities. The proposed model architecture, LFE+AEM, achieves an MAE of 4.42 months, showing a decrease of 3.84 months compared to the ResNet50+AEM model and a decrease of 2.20 months compared to the Inception V3+AEM model. This underscores the LFE module’s suitability for feature extraction in RSNA images. Additionally, experiments are conducted on the RHPE dataset, with the results presented in Table 2. The results demonstrate that the incorporation of the AEM reduces the MAE of the ResNet50 model by an average of 5.86 months and that of the Inception V3 model by an average of 2.27 months. When employing our proposed model architecture, the MAE of the predictions decreases by 11.30 months compared to the ResNet50+AEM model and by 7.89 months compared to the Inception V3+AEM model.


As shown in Tables 2 and 3, it can be observed that the MAE of the model on the RSNA dataset is smaller than that on the RHPE dataset. Fig. 5 presents the heatmaps of the proposed model on the RSNA and RHPE datasets, respectively. It is evident from Fig. 5 that both datasets contain a significant amount of background noise. Notably, the model accurately identifies the phalanges, metacarpal bones, and carpal bones in the radiographs of the RSNA dataset. However, on the RHPE dataset, the model primarily identifies the metacarpal region, with a lower recognition rate for the phalanges. This discrepancy is attributed to the RHPE dataset’s lack of high-level semantic features that are strongly correlated with the metacarpal bones, leading to a higher MAE on the RHPE dataset.


Figure 5: The visualization of the proposed method on the RSNA and RHPE datasets. (a) The visual results on the RSNA dataset. (b) The visual results on the RHPE dataset
In the experiments, different models are trained with 10 independent repetitions on the RSNA training dataset to assess the validity of the results, as shown in Fig. 6. To provide an intuitive view of the model’s performance, Fig. 7 shows the relationship between the predicted and the actual bone age for the RSNA and RHPE test datasets, indicating a strong correlation between the predicted and actual bone ages. Furthermore, a statistical significance test is conducted to assess the reliability of the observations, with the null hypothesis
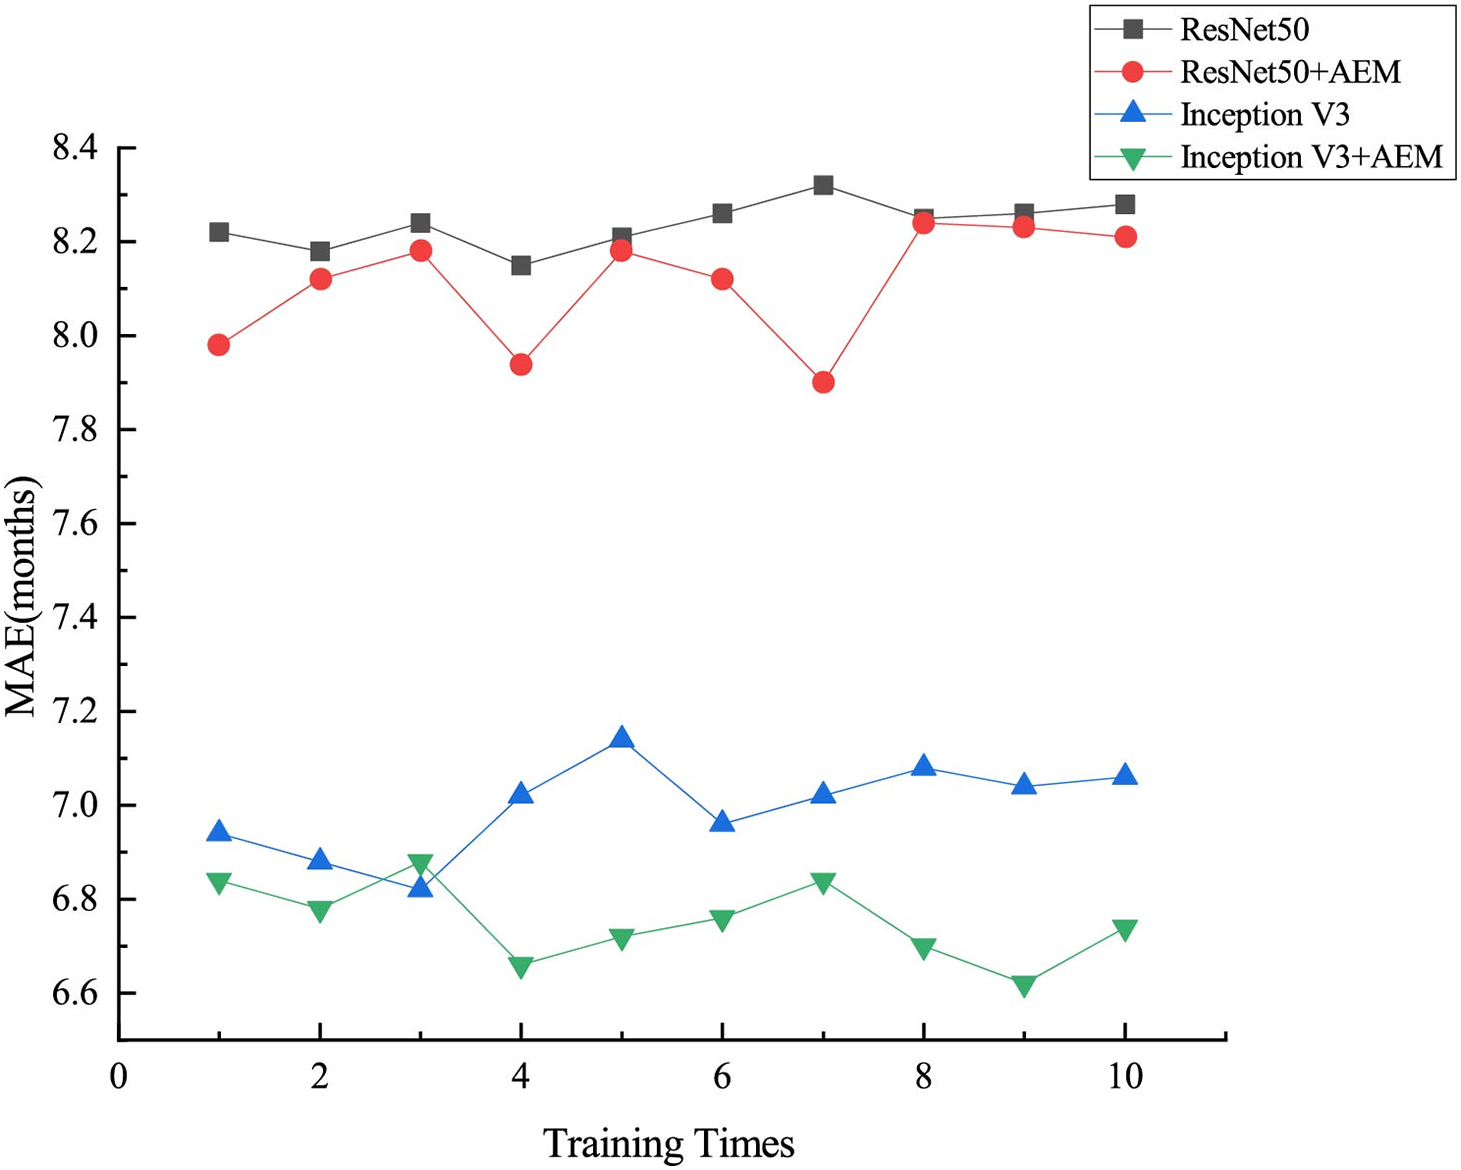
Figure 6: Results of ten independent experiments with different models on the RSNA dataset
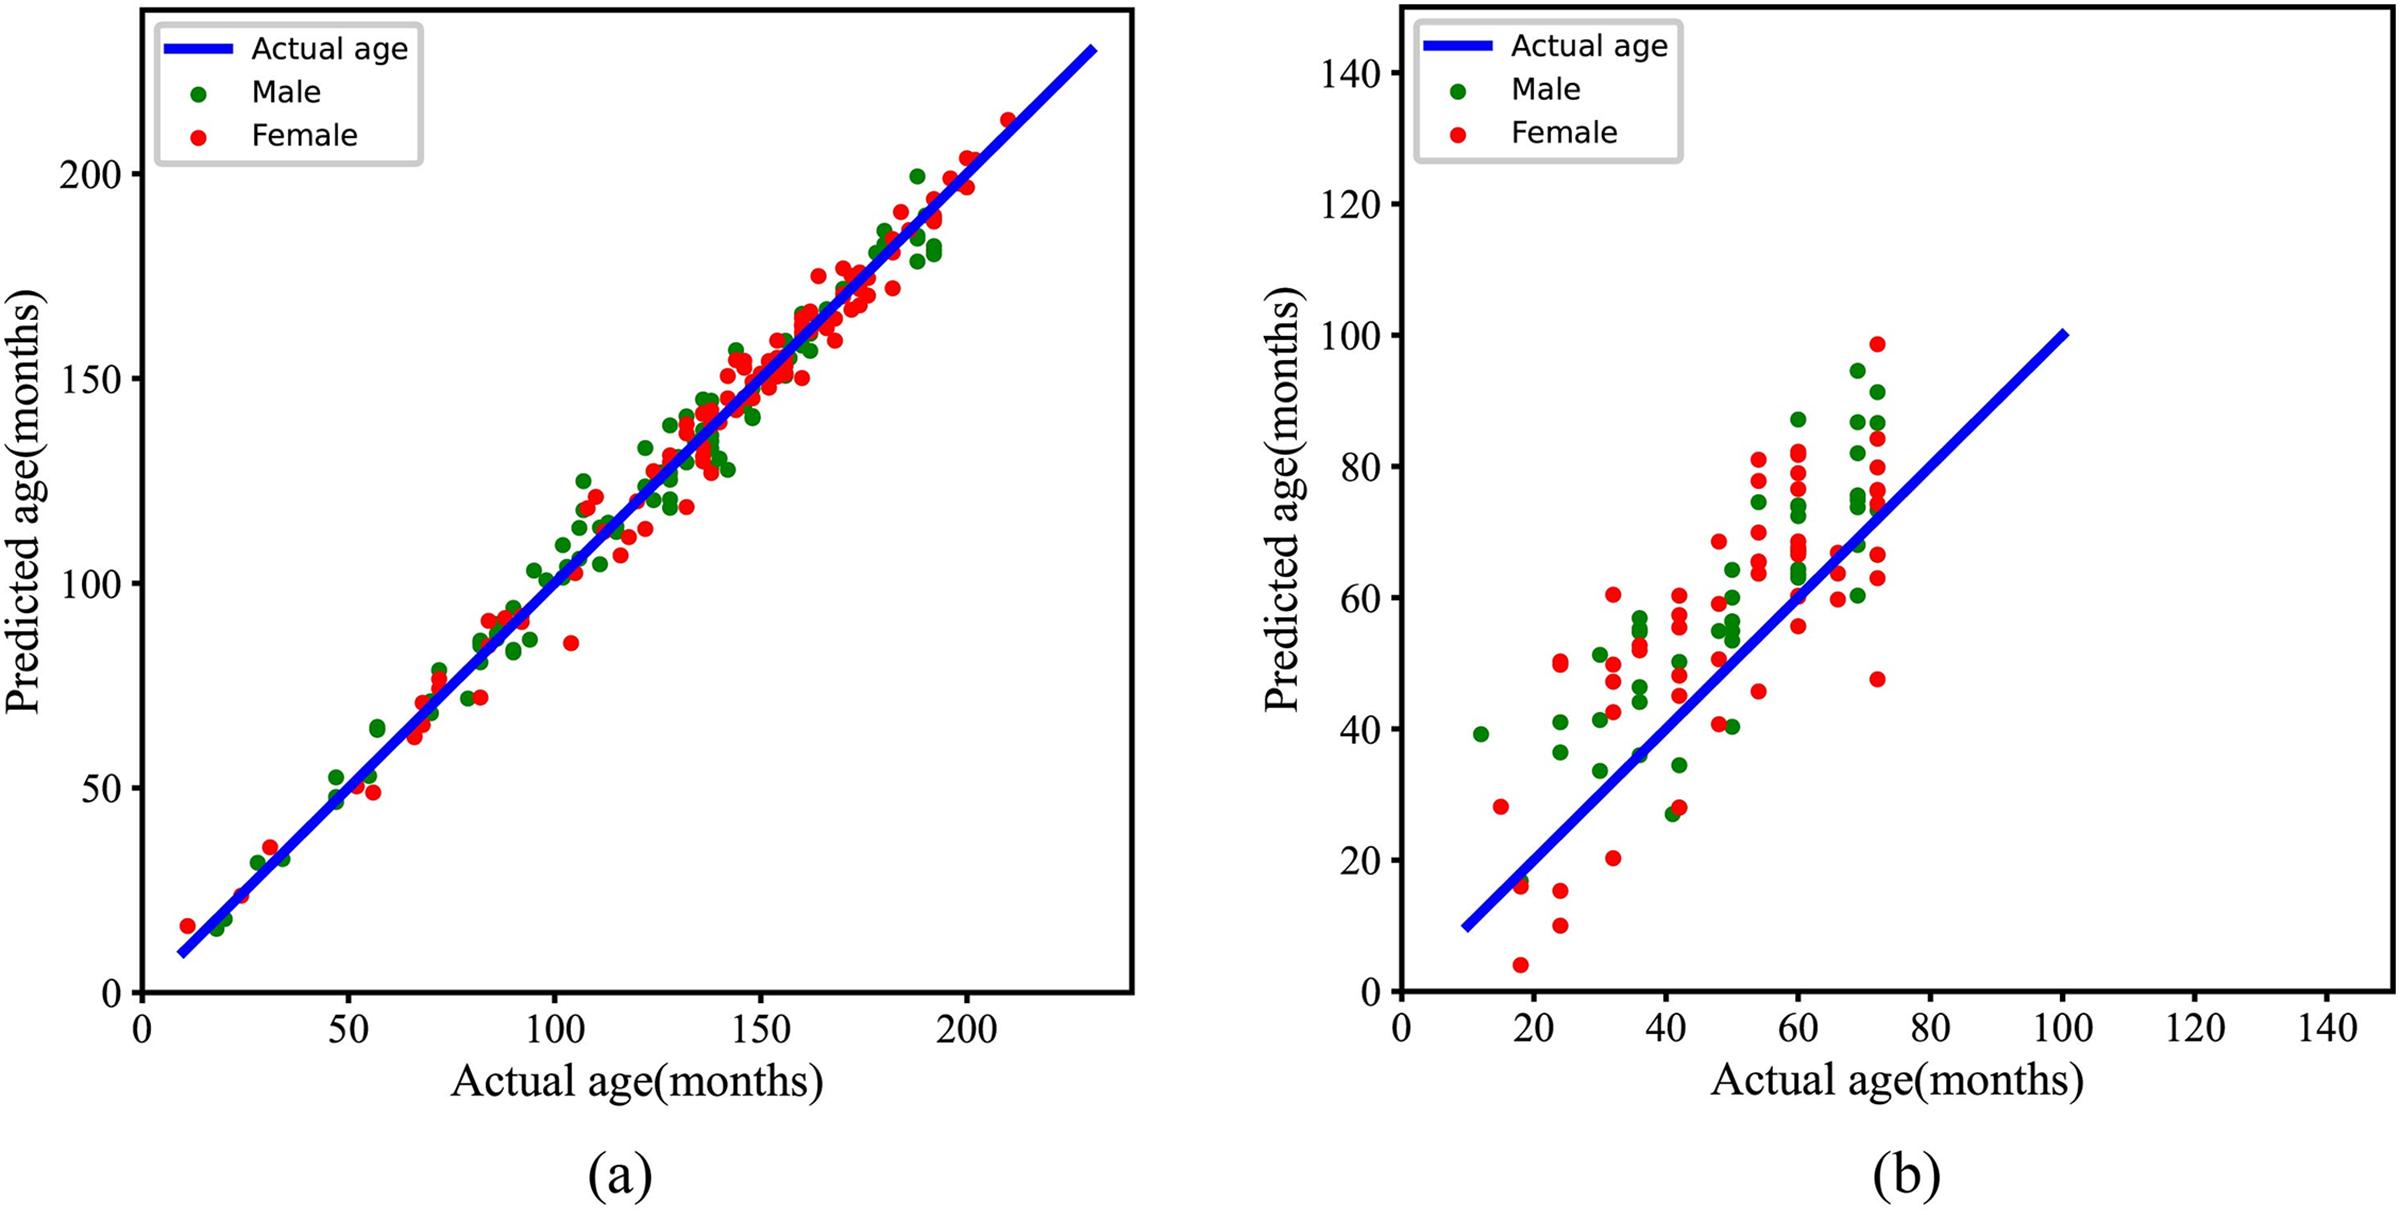
Figure 7: Statistical results of the proposed methods for BAA. (a) The relationship between predicted age and actual age on the RSNA test dataset. (b) The relationship between predicted age and actual age on the RHPE test dataset
4.3 Influence of Pooling Methods
In the proposed method, attention erasure is applied to images processed with different pooling operations. To investigate the impact of various pooling operations on model performance, the LEM feature extractor is utilized, and combinations of three different pooling methods—Global Maximum Pooling (GMP), Global Average Pooling (GAP), and Cross Channel Pooling (CCP) are tested. A total of seven combinations are evaluated: GMP, GAP, CCP, GMP+GAP, GMP+CCP, GAP+CCP, and GMP+GAP+CCP. The model is trained on both the RSNA and RHPE datasets, and the experimental results are shown in Fig. 8. Fig. 8a presents the test results on the RSNA, while Fig. 8b presents the test results on the RHPE dataset.
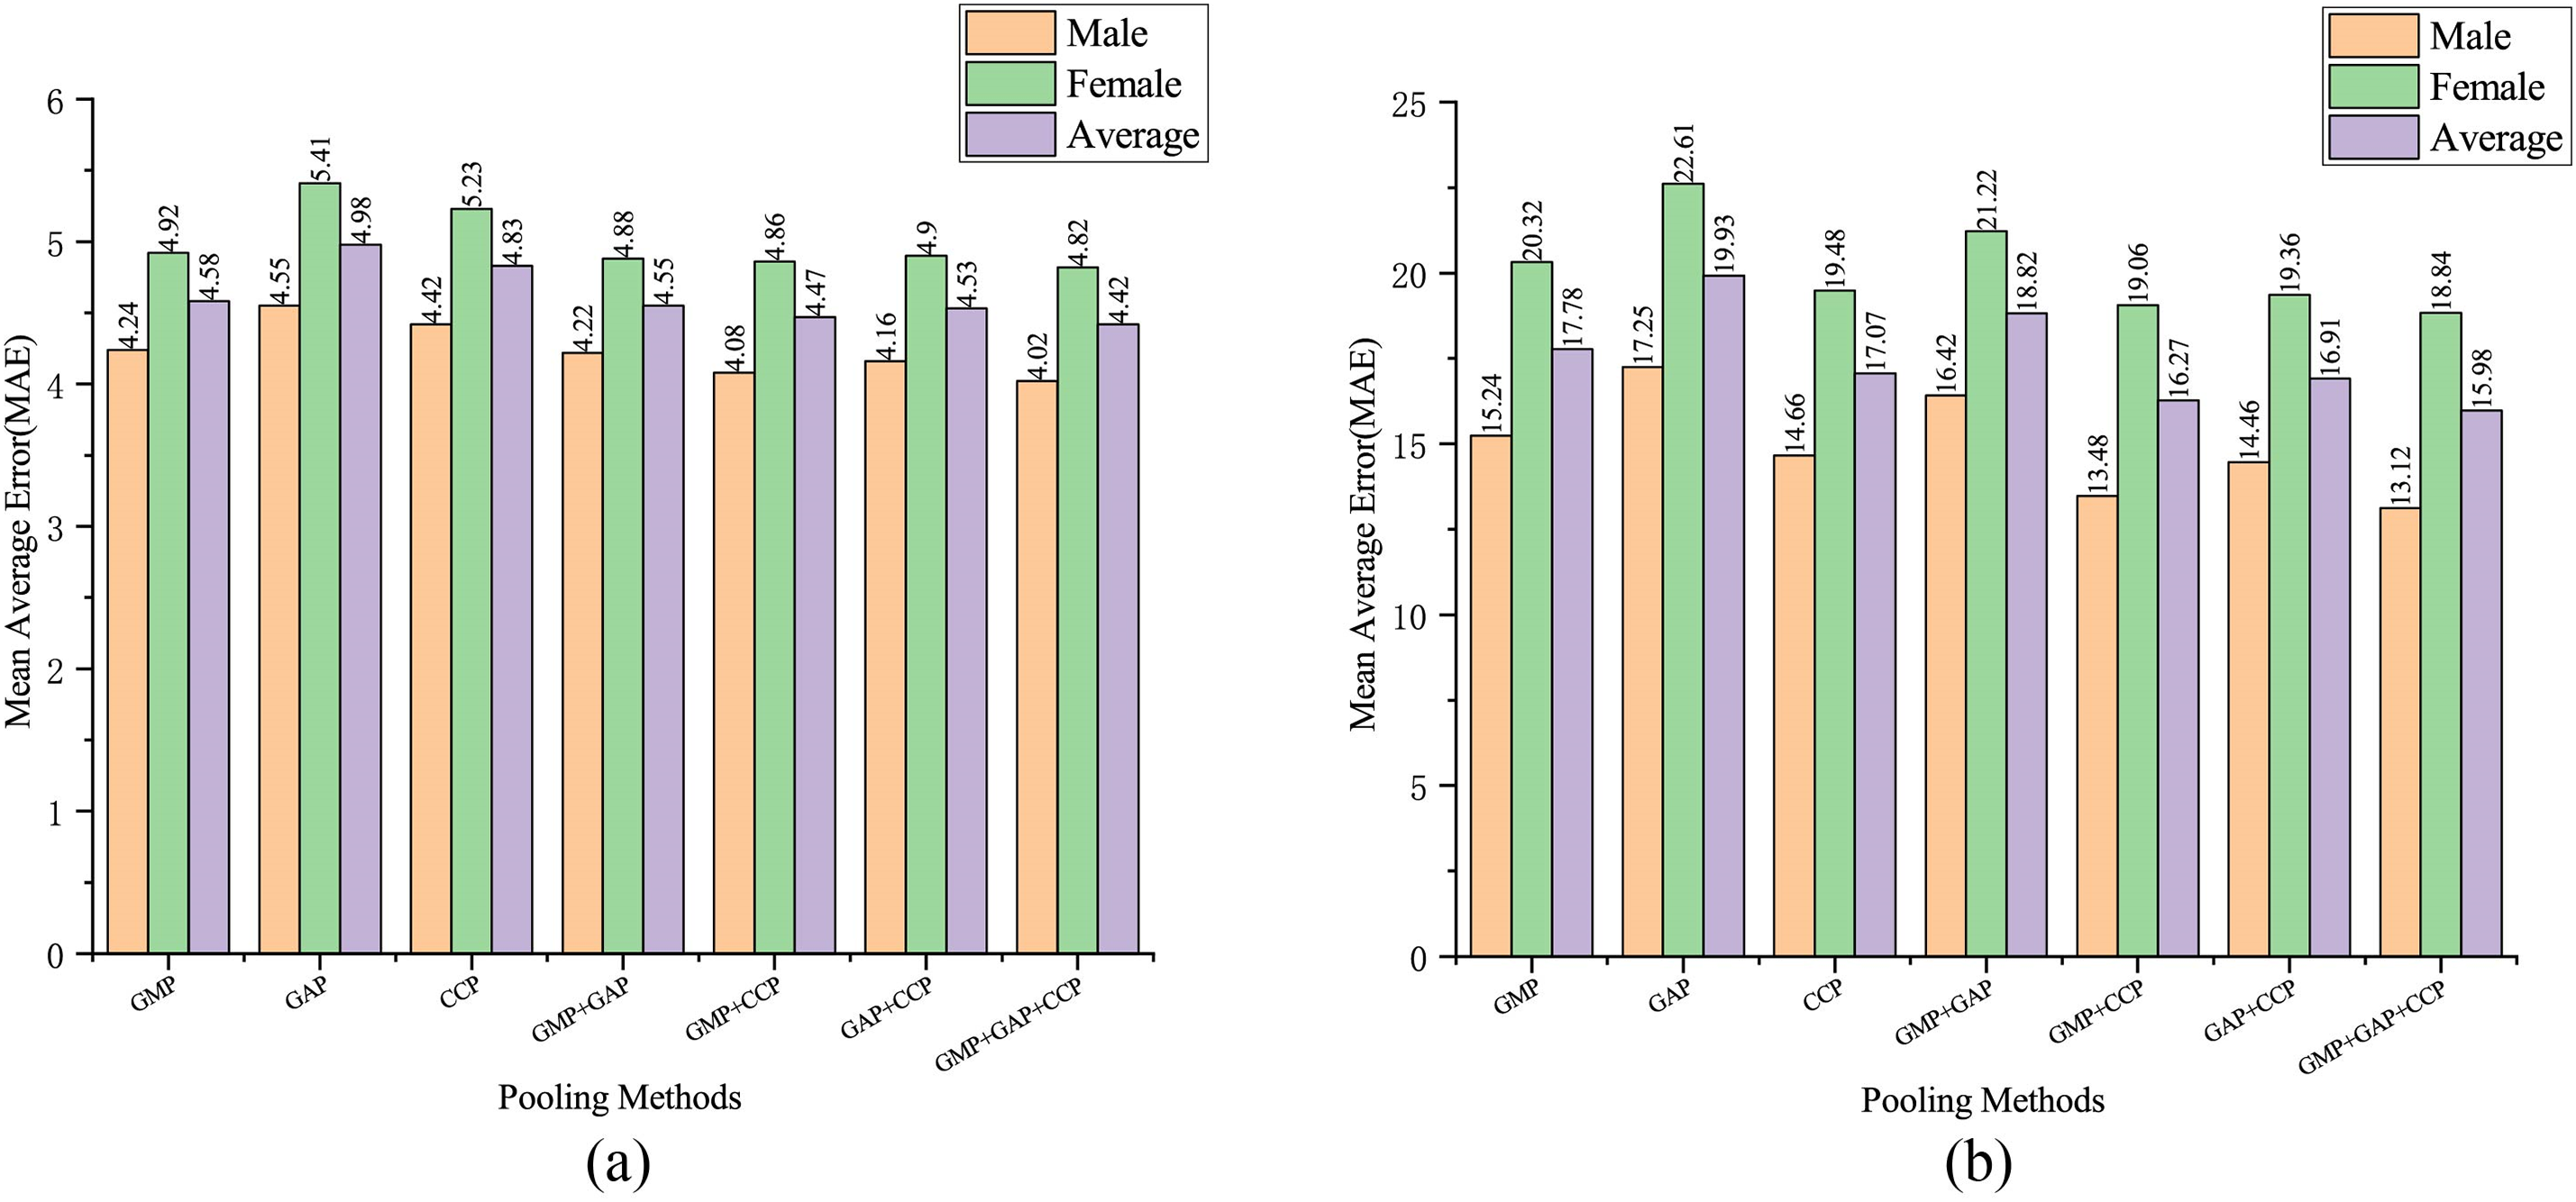
Figure 8: Results on the RSNA and RHPE datasets using different pooling methods. (a) Prediction results on the RSNA dataset. (b) Prediction results on the RHPE dataset
As shown in Fig. 8, Global Max Pooling (GMP) demonstrates superior performance among the individual pooling methods. In the RSNA dataset, the average MAE achieved with GMP pooling is 0.4 months lower than that obtained with Global Average Pooling (GAP). It is also 0.25 months lower than that with Channel-wise Context Pooling (CCP). In contrast, for the RHPE dataset, the average MAE with CCP pooling is 2.86 months lower than the average MAE with GAP pooling. It is also 0.71 months lower than the average MAE with GMP pooling. Notably, the combination of pooling methods results in a lower MAE than any single method, with the most effective predictive performance attained through the integration of GMP, GAP, and CCP.
4.4 Dataset Migration Experiment
The objectives of migration learning are twofold: (1) the model trained on the RSNA dataset is capable of accurately identifying discriminative regions, such as the metacarpals and phalangeal joints in hand bone images. By incorporating quantitative information, such as the width and length of these key areas, the model’s performance can be further improved. (2) The RSNA dataset includes individuals from diverse ethnic backgrounds, there are notable differences in the detailed features of hand bone images across these populations. By introducing quantitative features, the model can effectively complete the migration learning process with fewer samples, thereby improving its predictive performance across different racial groups.
In this research, we test four different races of datasets separately during the experimental process and use the feature vectors extracted by the feature extraction network and the quantitative features of the images to combine with each other for the final prediction of the bone age. The related results are shown in Table 4. As can be observed from Table 4, F1 is denoted as the original feature vectors obtained from the feature extraction network, F2 represents the width features of the metacarpal bones, including measurements from the 2nd to the 5th metacarpal bones, and F3 represents the length features of the metacarpal bones, including measurements from the 2nd to the 5th metacarpal bones. When the feature combination F1 + F2 + F3 is utilized, the model’s heatmap is shown in Fig. 9. Fig. 10 demonstrates the relationship between the predicted bone age and actual bone age across different race datasets.

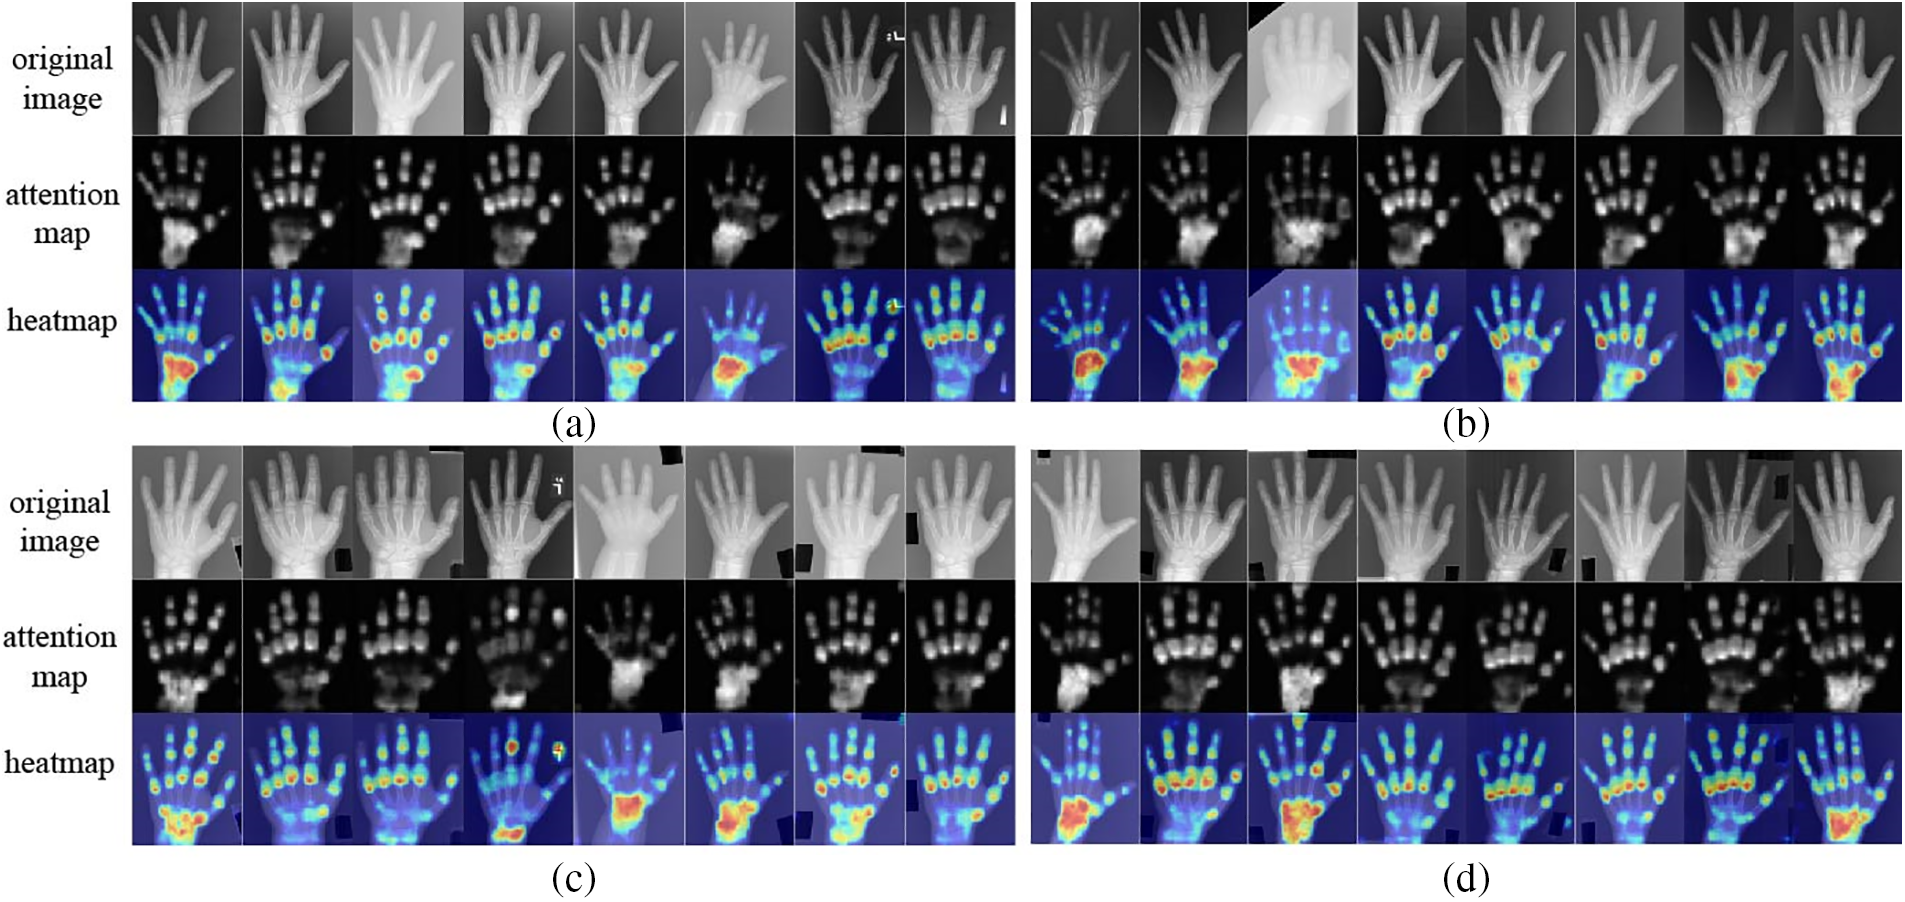
Figure 9: Visualization of the proposed method on the DHA datasets: (a) Asian group, (b) Caucasian group, (c) African group, and (d) Hispanic group

Figure 10: Statistical results of the proposed methods for BAA. (a) Actual age and predicted age in the Asian group. (b) Actual age and predicted age in the Caucasian group. (c) Actual age and predicted age in the African group. (d) Actual age and predicted age in the Hispanic group
To further investigate the performance of the original feature vectors and the quantitative features of images, this study introduces a hyperparameter
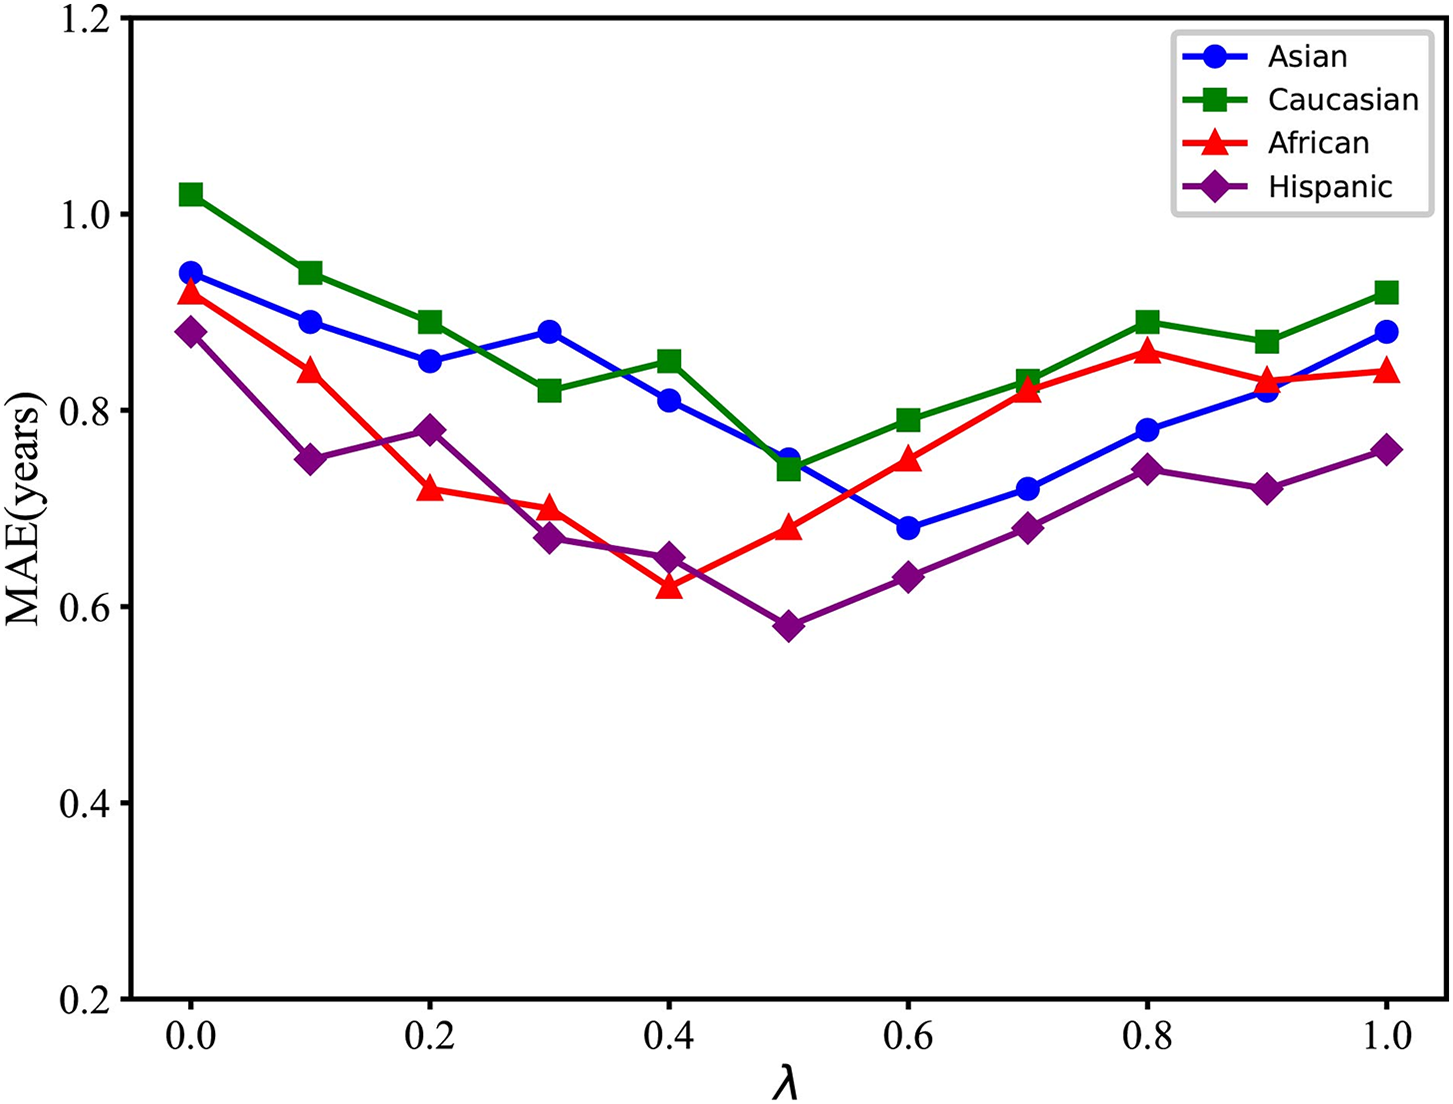
Figure 11: The model’s performance across various racial datasets under different values of the
To validate the effectiveness of the introduced quantitative features, 10 independent experiments are conducted for each dataset. Statistical tests are then performed to determine whether the null hypothesis

Some recent studies showed various methods to extract rich semantic features from radiographs for bone age assessment [16–18,22] and introduced additional objective indicators for bone age assessment [12,18]. For instance, Ji et al. [16] designed a part selection module to identify important parts and a part relation module for BAA, achieving an MAE of 4.49 months. Similarly, Chen et al. [22] developed a complex network that includes feature extraction, identification of informative regions, and an assessment subnet for BAA, using ResNet50 as the feature extractor, and reported an MAE of 6.65 months on the RSNA test set. Palkar et al. [23] applied the pre-trained Xception model to the RSNA dataset using transfer learning, achieving a mean absolute error (MAE) of 9.24 months. Prasanna et al. [24] compared the performance of various deep learning-based bone age assessment methods using hand X-rays, obtaining an MAE of 25.73 months with the ResNet50 model and 17.46 months with the VGG19 model. These methods employing baselines like ResNet50 and InceptionV3 are directly trained on the RSNA dataset. The feature extraction capabilities of these models alone are relatively poor, leading to higher MAE. The introduction of the AEM module enhances the model’s predictive performance, achieving an optimal MAE of 4.42 months on the RSNA test dataset. Haghnegahdar et al. [18] employed 21 quantitative features to train a neural network for predicting bone age. Their experiments were conducted exclusively on Asian children and achieved prediction results of 0.65 years for males and 0.83 years for females. However, this study utilized only 8 quantitative features, combining them with feature vectors extracted by a deep learning network for BAA. The method is tested across four different racial groups, achieving an optimal MAE of 0.58 years on the Hispanic dataset.
Due to the use of quantitative features of hand bones in this study, it required manual measurement of the length and width of the second to fifth metacarpal bones, which is labor-intensive and subjective. The limited number of quantitative features introduced in this study means that the model’s final prediction relies more heavily on the feature vectors extracted by the deep learning network.
The proposed model can capture subtle, fine-grained details in radiographs that might be missed by conventional assessment techniques, which is significant in assisting physicians in making more accurate and consistent diagnoses. In a clinical setting, this could translate to more precise evaluations of a child’s growth and development, enabling earlier detection of growth disorders such as growth hormone deficiencies or precocious puberty. Additionally, the model’s ability to quantify bone development with a high degree of accuracy could also aid in monitoring the effectiveness of treatments over time, providing physicians with a valuable tool for tracking patient progress and adjusting treatment plans as needed.
In this paper, a novel framework for automated bone age assessment is proposed, which can obtain fine-grained features by erasing background information in the images based on the attention feature map. Experimental results on the RSNA and RHPE datasets have demonstrated the effectiveness of the method. To further improve the performance across different racial groups, quantitative information regarding the width and length of metacarpal bones in radiographs is incorporated. Experimental results on the DHA dataset indicate a remarkable improvement in prediction accuracy. Additionally, statistical tests reveal significant differences across various methodologies, highlighting the effectiveness of the proposed method. In the future, more feature selection strategies will be proposed, and additional datasets will be used for model training. We will explore more optimized feature selection algorithms. Furthermore, we will introduce other quantitative features that are strongly correlated with bone age to enhance the model’s generalization ability and robustness.
Acknowledgement: All authors declare that they have no known conflicts of interest in terms of competing financial interests or personal relationships that could have an influence or are relevant to the work reported in this paper. The authors would like to thank the anonymous editors and reviewers for their valuable advice and help.
Funding Statement: This work is partially supported by the grant from the National Natural Science Foundation of China (No. 72071019), and grant from the Natural Science Foundation of Chongqing (No. cstc2021jcyj-msxmX0185).
Author Contributions: Liuqiang Shu conducted data collection, designed and performed all experiments, and prepared the final manuscript. Lei Yu overviewed and corrected the manuscript. All authors reviewed the results and approved the final version of the manuscript.
Availability of Data and Materials: The RSNA dataset is openly available in a public repository, https://www.rsna.org/ (accessed on 10 April 2024). The DHA dataset is openly available from http://www.ipilab.org/BAAweb (accessed on 10 April 2024).
Ethics Approval: Not applicable.
Conflicts of Interest: The authors declare no conflicts of interest to report regarding the present study.
References
1. K. Poznanski, R. J. Hernandez, K. E. Guire, U. L. Bereza, and S. M. Garn, “Carpal length in children—A useful measurement in the diagnosis of rheumatoid arthritis and some congenital malformation syndromes,” Radiology, vol. 129, no. 3, pp. 661–668, Dec. 1978. doi: 10.1148/129.3.661. [Google Scholar] [PubMed] [CrossRef]
2. W. A. Marshall, “Interrelationships of skeletal maturation, sexual development and somatic growth in man,” Ann. Hum. Biol., vol. 1, no. 1, pp. 29–40, Jan. 1974. doi: 10.1080/03014467400000031. [Google Scholar] [PubMed] [CrossRef]
3. W. W. Greulich and S. I. Pyle, “Radiographic atlas of skeletal development of the hand and wrist,” Am. J. Med. Sci., vol. 238, no. 3, Jan. 1959, Art. no. 393. doi: 10.6061/clinics/2018/e480. [Google Scholar] [CrossRef]
4. H. Carty, “Assessment of skeletal maturity and prediction of adult height (TW3 method),” J. Bone Joint Surg. British, vol. 84, no. 2, pp. 310–311, Oct. 2002. doi: 10.1002/ajhb.10098. [Google Scholar] [CrossRef]
5. A. F. Roche, C. G. Rohmann, N. Y. French, and G. H. Dávila, “Effect of training on replicability of assessments of skeletal maturity (Greulich-Pyle),” Am. J. Roentgenol., vol. 108, no. 3, pp. 511–515, Mar. 1970. doi: 10.2214/ajr.108.3.511. [Google Scholar] [PubMed] [CrossRef]
6. L. Su, X. Fu, and Q. Hu, “Generative adversarial network based data augmentation and gender-last training strategy with application to bone age assessment,” Comput. Methods Programs Biomed., vol. 212, no. 5, 2021, Art. no. 106456. doi: 10.1016/j.cmpb.2021.106456. [Google Scholar] [PubMed] [CrossRef]
7. A. Gertych, A. Zhang, J. Sayre, S. Pospiech-Kurkowska, and H. K. Huang, “Bone age assessment of children using a digital hand atlas,” Comput. Med. Imaging Graph, vol. 31, no. 4–5, pp. 322–331, Jun.–Jul. 2007. doi: 10.1016/j.compmedimag.2007.02.012. [Google Scholar] [PubMed] [CrossRef]
8. D. Haak, J. Yu, H. Simon, H. Schramm, T. Seidl and T. M. Deserno, “Bone age assessment using support vector regression with smart class mapping,” in Med. Imaging 2013: Comput.-Aided Diagnosis, SPIE, 2013, vol. 8670, pp. 62–70. [Google Scholar]
9. J. M. Tanner and R. D. Gibbons, “A computerized image analysis system for estimating Tanner-Whitehouse 2 bone age,” Horm. Res. Paediatr., vol. 42, no. 6, pp. 282–287, 1994. doi: 10.1159/000184210. [Google Scholar] [PubMed] [CrossRef]
10. F. Cao, H. K. Huang, E. Pietka, and V. Gilsanz, “Digital hand atlas and web-based bone age assessment: System design and implementation,” Comput. Med. Imaging Graph., vol. 24, no. 5, pp. 297–307, 2000. doi: 10.1016/S0895-6111(00)00026-4. [Google Scholar] [PubMed] [CrossRef]
11. E. Pietka, S. Pospiech, A. Gertych, F. Cao, H. K. Huang and V. Gilsanz, “Computer automated approach to the extraction of epiphyseal regions in hand radiographs,” J. Digit. Imaging, vol. 14, no. 4, Dec. 2001, Art. no. 165. doi: 10.1007/s10278-001-0101-1. [Google Scholar] [PubMed] [CrossRef]
12. A. Haghnegahdar, H. Pakshir, and I. Ghanbari, “Correlation between skeletal age and metacarpal bones and metacarpophalangeal joints dimensions,” J. Dent., vol. 20, no. 3, Sep. 2019, Art. no. 159. doi: 10.30476/DENTJODS.2019.44904. [Google Scholar] [PubMed] [CrossRef]
13. M. Kashif, T. M. Deserno, D. Haak, and S. Jonas, “Feature description with SIFT, SURF, BRIEF, BRISK, or FREAK? A general question answered for bone age assessment,” Comput. Biol. Med., vol. 68, no. 3, pp. 67–75, 2016. doi: 10.1016/j.compbiomed.2015.11.006. [Google Scholar] [PubMed] [CrossRef]
14. L. M. Davis, B. J. Theobald, and A. Bagnall, “Automated bone age assessment using feature extraction,” presented at the 13th Int. Conf. Intell. Data Eng. Autom. Learn. (IDEALNatal, Brazil, Aug. 29–31, 2012. [Google Scholar]
15. M. Zhang, D. Wu, Q. Liu, Q. Li, Y. Zhan and X. S. Zhou, “Multi-task convolutional neural network for joint bone age assessment and ossification center detection from hand radiograph,” presented at the 10th Int. Workshop Mach. Learn. Med. Imaging (MLMIShenzhen, China, Oct. 13, 2019. [Google Scholar]
16. Y. Ji, H. Chen, D. Lin, X. Wu, and D. Lin, “PRSNet: Part relation and selection network for bone age assessment,” presented at the 22nd Int. Conf. Med. Image Comput. Comput.-Assist. Interv. (MICCAIShenzhen, China, Oct. 13–17, 2019. [Google Scholar]
17. C. Chen, Z. Chen, X. Jin, L. Li, W. Speier and C. W. Arnold, “Attention-guided discriminative region localization and label distribution learning for bone age assessment,” IEEE J. Biomed. Health Inform., vol. 26, no. 3, pp. 1208–1218, 2021. doi: 10.1109/JBHI.2021.3095128. [Google Scholar] [PubMed] [CrossRef]
18. A. Haghnegahdar, H. R. Pakshir, M. Zandieh, and I. Ghanbari, “Computer assisted bone age estimation using dimensions of metacarpal bones and metacarpophalangeal joints based on neural network,” J. Dent., vol. 25, no. 1, pp. 51–58, Mar. 2024. doi: 10.30476/dentjods.2023.95629.1882. [Google Scholar] [PubMed] [CrossRef]
19. V. Khadilkar et al., “Development of a simplified new method of bone age estimation using three bones of the hand and wrist,” Endocrine, vol. 84, no. 3, pp. 1–11, 2024. doi: 10.1007/s12020-024-03684-9. [Google Scholar] [PubMed] [CrossRef]
20. K. Jung, T. D. Nguyen, D. -T. Le, J. Bum, S. S. Woo and H. Choo, “Hand bone X-rays segmentation and congregation for age assessment using deep learning,” presented at the 2023 Int. Conf. Inf. Netw. (ICOINBangkok, Thailand, 2023. [Google Scholar]
21. M. Escobar, C. González, F. Torres, L. Daza, G. Triana and P. Arbeláez, “Hand pose estimation for pediatric bone age assessment,” presented at the 22nd Int. Conf. Med. Image Comput. Comput.-Assist. Interv. (MICCAIShenzhen, China, Oct. 13–17, 2019. [Google Scholar]
22. K. Chen, J. Wu, Y. Mao, W. Lu, K. Mao and W. He, “Research on an intelligent evaluation method of bone age based on multi-region combination,” Syst. Sci. Control Eng., vol. 11, no. 1, 2023. doi: 10.1080/21642583.2023.2233545. [Google Scholar] [CrossRef]
23. A. Palkar, S. Shanbhog, and J. Medikonda, “Bone age estimation of pediatrics by analyzing hand X-rays using deep learning technique,” presented at the 2023 Int. Conf. Recent Adv. Inf. Technol. Sustain. Dev. (ICRAISManipal, India, 2023. [Google Scholar]
24. R. G. V. Prasanna, M. F. Shaik, L. V. Sastry, C. G. Sahithi, J. Jagadeesh and P. V. Rao, “Deep learning-based bone age assessment from hand X-rays: An evaluation and analysis,” presented at the 2023 Int. Conf. Data Sci., Agents Artif. Intell. (ICDSAAIChennai, India, 2023. [Google Scholar]
Cite This Article
 Copyright © 2025 The Author(s). Published by Tech Science Press.
This work is licensed under a Creative Commons Attribution 4.0 International License , which permits unrestricted use, distribution, and reproduction in any medium, provided the original work is properly cited.


 Submit a Paper
 Propose a Special lssue
 View Full Text
 Download PDF
 Downloads
 Citation Tools