
 Submit a Paper
 Propose a Special lssue
 Open Access
ARTICLE

An Improved YOLO Detection Approach for Pinpointing Cucumber Diseases and Pests
1 Department of IT Convergence Engineering, University of Kyungnam, Changwon, 51767, Republic of Korea
2 Department of Computer Engineering, University of Kyungnam, Changwon, 51767, Republic of Korea
3 College of Computer Science and Technology, Beihua University, Jilin, 132013, China
* Corresponding Author: Sang-Yong Rhee. Email:
Computers, Materials & Continua 2024, 81(3), 3989-4014. https://doi.org/10.32604/cmc.2024.057473
Received 19 August 2024; Accepted 26 October 2024; Issue published 19 December 2024
 View Full Text
 Download PDF
Abstract
In complex agricultural environments, cucumber disease identification is confronted with challenges like symptom diversity, environmental interference, and poor detection accuracy. This paper presents the DM-YOLO model, which is an enhanced version of the YOLOv8 framework designed to enhance detection accuracy for cucumber diseases. Traditional detection models have a tough time identifying small-scale and overlapping symptoms, especially when critical features are obscured by lighting variations, occlusion, and background noise. The proposed DM-YOLO model combines three innovative modules to enhance detection performance in a collective way. First, the MultiCat module employs a multi-scale feature processing strategy with adaptive pooling, which decomposes input features into large, medium, and small scales. This approach ensures that high-level features are extracted and fused effectively, effectively improving the detection of smaller and complex patterns that are often missed by traditional methods. Second, the ADC2f module incorporates an attention mechanism and deep separable convolution, which allows the model to focus on the most relevant regions of the input features while reducing computational load. The identification and localization of diseases like downy mildew and powdery mildew can be enhanced by this combination in conditions of lighting changes and occlusion. Finally, the C2fe module introduces a Global Context Block that uses attention mechanisms to emphasize essential regions while suppressing those that are not relevant. This design enables the model to capture more contextual information, which improves detection performance in complex backgrounds and small-object scenarios. A custom cucumber disease dataset and the PlantDoc dataset were used for thorough evaluations. Experimental results showed that DM-YOLO achieved a mean Average Precision (mAP50) improvement of 1.2%p on the custom dataset and 3.2%p on the PlantDoc dataset over the baseline YOLOv8. These results highlight the model’s enhanced ability to detect small-scale and overlapping disease symptoms, demonstrating its effectiveness and robustness in diverse agricultural monitoring environments. Compared to the original algorithm, the improved model shows significant progress and demonstrates strong competitiveness when compared to other advanced object detection models.Keywords
Cucumbers are a widely cultivated vegetable globally [1], but they are vulnerable to various diseases that can have a significant impact on their yield and quality when infestations are prevalent [2]. Effective management and control require the detection of these diseases at an early and accurate level. The application of traditional machine learning methods, like Support Vector Machine (SVM) [3], Decision Trees [4], and K-Nearest Neighbors (KNN) [5], has been successful in detecting diseases and pests. For example, Ebrahimi et al. [6] presented an SVM-based insect detection system that is used on crop canopy images in strawberry greenhouses, and it achieves an error rate lower than 2.25% by relying on regional metrics and color indicators to detect thrips. Xu et al. [7] used a BP neural network and Random Forest model to detect damage caused by Dendrolimus punctatus Walker in pine forests, with the Random Forest model achieving a detection precision of 79.30% and a kappa coefficient of 0.7151, demonstrating the feasibility of using the Random Forest algorithm for pest occurrence detection and multilevel discrete indicators.
These traditional methods have achieved some success, but they are heavily based on manual feature design and have limitations when handling complex, high-dimensional data. Deep learning algorithms have demonstrated superior performance by automatically extracting features and improving detection accuracy, compared to conventional algorithms. Recent advances in deep learning have revolutionized agricultural diagnostics [8]. For example, in the field of rice leaf disease classification, the research by Firnando et al. [9] exemplify that InceptionV3 performed exceptionally in three different tested datasets, obtaining accuracy rates of 99.53%, 58.94%, and 90.00%, respectively. The study emphasizes the significance of selecting suitable data augmentation strategies according to the characteristics of the dataset. Liu et al. [10] introduced the DCNSE-YOLOv7 algorithm, which improved cucumber leaf disease detection by incorporating deformable convolution (DCNv2) for better feature extraction and SENet attention mechanism to enhance early disease detection. Yang et al. [11] proposed a tomato detection method based on the YOLOv8s model, which incorporates depthwise separable convolutions and an attention module to improve the model’s detection precision, achieving an mAP of 93.4%. Rachman et al. [12] proposed an enhanced Vision Transformer (ViT) model, combined with transfer learning, for recognition of rice diseases. The ViT model achieved excellent performance with an accuracy of 97.9% thanks to the use of the self-attention mechanism.
The detection of small or overlapping objects in complex environments is still a challenge, despite the progress made by researchers. One of the most important models in the YOLO series is YOLOv8. After YOLOv5, Ultralytics developed YOLOv8 [13] as a next-generation object detection model. The anchor-free approach used by YOLOv8 offers a higher degree of detection accuracy and speed compared to the original anchor-based detection methods. In difficult scenarios, YOLOv8 decreases the resolution of feature maps with multiple downsampling operations to improve inference speed, but this can result in compressed or lost small object features. Moreover, the YOLOv8 detection algorithm is still struggling with localization errors and inadequate target perception. To address these issues, this paper introduces a new cucumber pest detection model, DM-YOLO, that utilizes YOLOv8. Through the design of key modules such as the feature enhancement module and attention mechanism module, the model improves the performance of small object detection, reduces interference from background noise, and enhances feature extraction in small object scenarios. DM-YOLO enhances detection accuracy by minimizing parameter increases while maintaining low computational overhead and a compact model size.
This work’s main contribution is as follows:
– We propose a lightweight, single-stage YOLOv8 model named Detailed and Multi-scale YOLO Network (DM-YOLO) for real-time recognition of cucumber diseases and pests. By combining features at various scales with the MultiCat module, the model’s capacity to detect cucumber pests and diseases of varying sizes is increased. Combined with a global context module, the C2f module is transformed into C2fe, which deeply processes features within the same layer. In addition, a fresh AD-C2f module is created with an attention mechanism that relies on adaptive average pooling to enhance the model’s focus on crucial elements, resulting in improved detection accuracy and overall performance.
– We constructed a new dataset on cucumber diseases and pests by extracting data from the AI-Hub public dataset. To ensure the quality of the data, every leaf in the images was meticulously annotations, and the original photos were rigorously screened and filtered. After eliminating unstructured data, the focus was on two primary cucumber diseases: downy mildew, and powdery mildew, resulting in an optimized new dataset.
2 Leaf Disease Detection Overview
This paper utilizes the public “Plant Disease Induction Comprehensive Data” dataset as well as the publicly available PlantDoc dataset [14]. The “Plant Disease Induction Comprehensive Data” dataset can be accessed via AI-Hub (Fig. 1). The PlantDoc dataset (Fig. 2) consists of 2598 data points, covering 13 plant species and up to 17 disease classes, involving approximately 300 h of manual annotation.
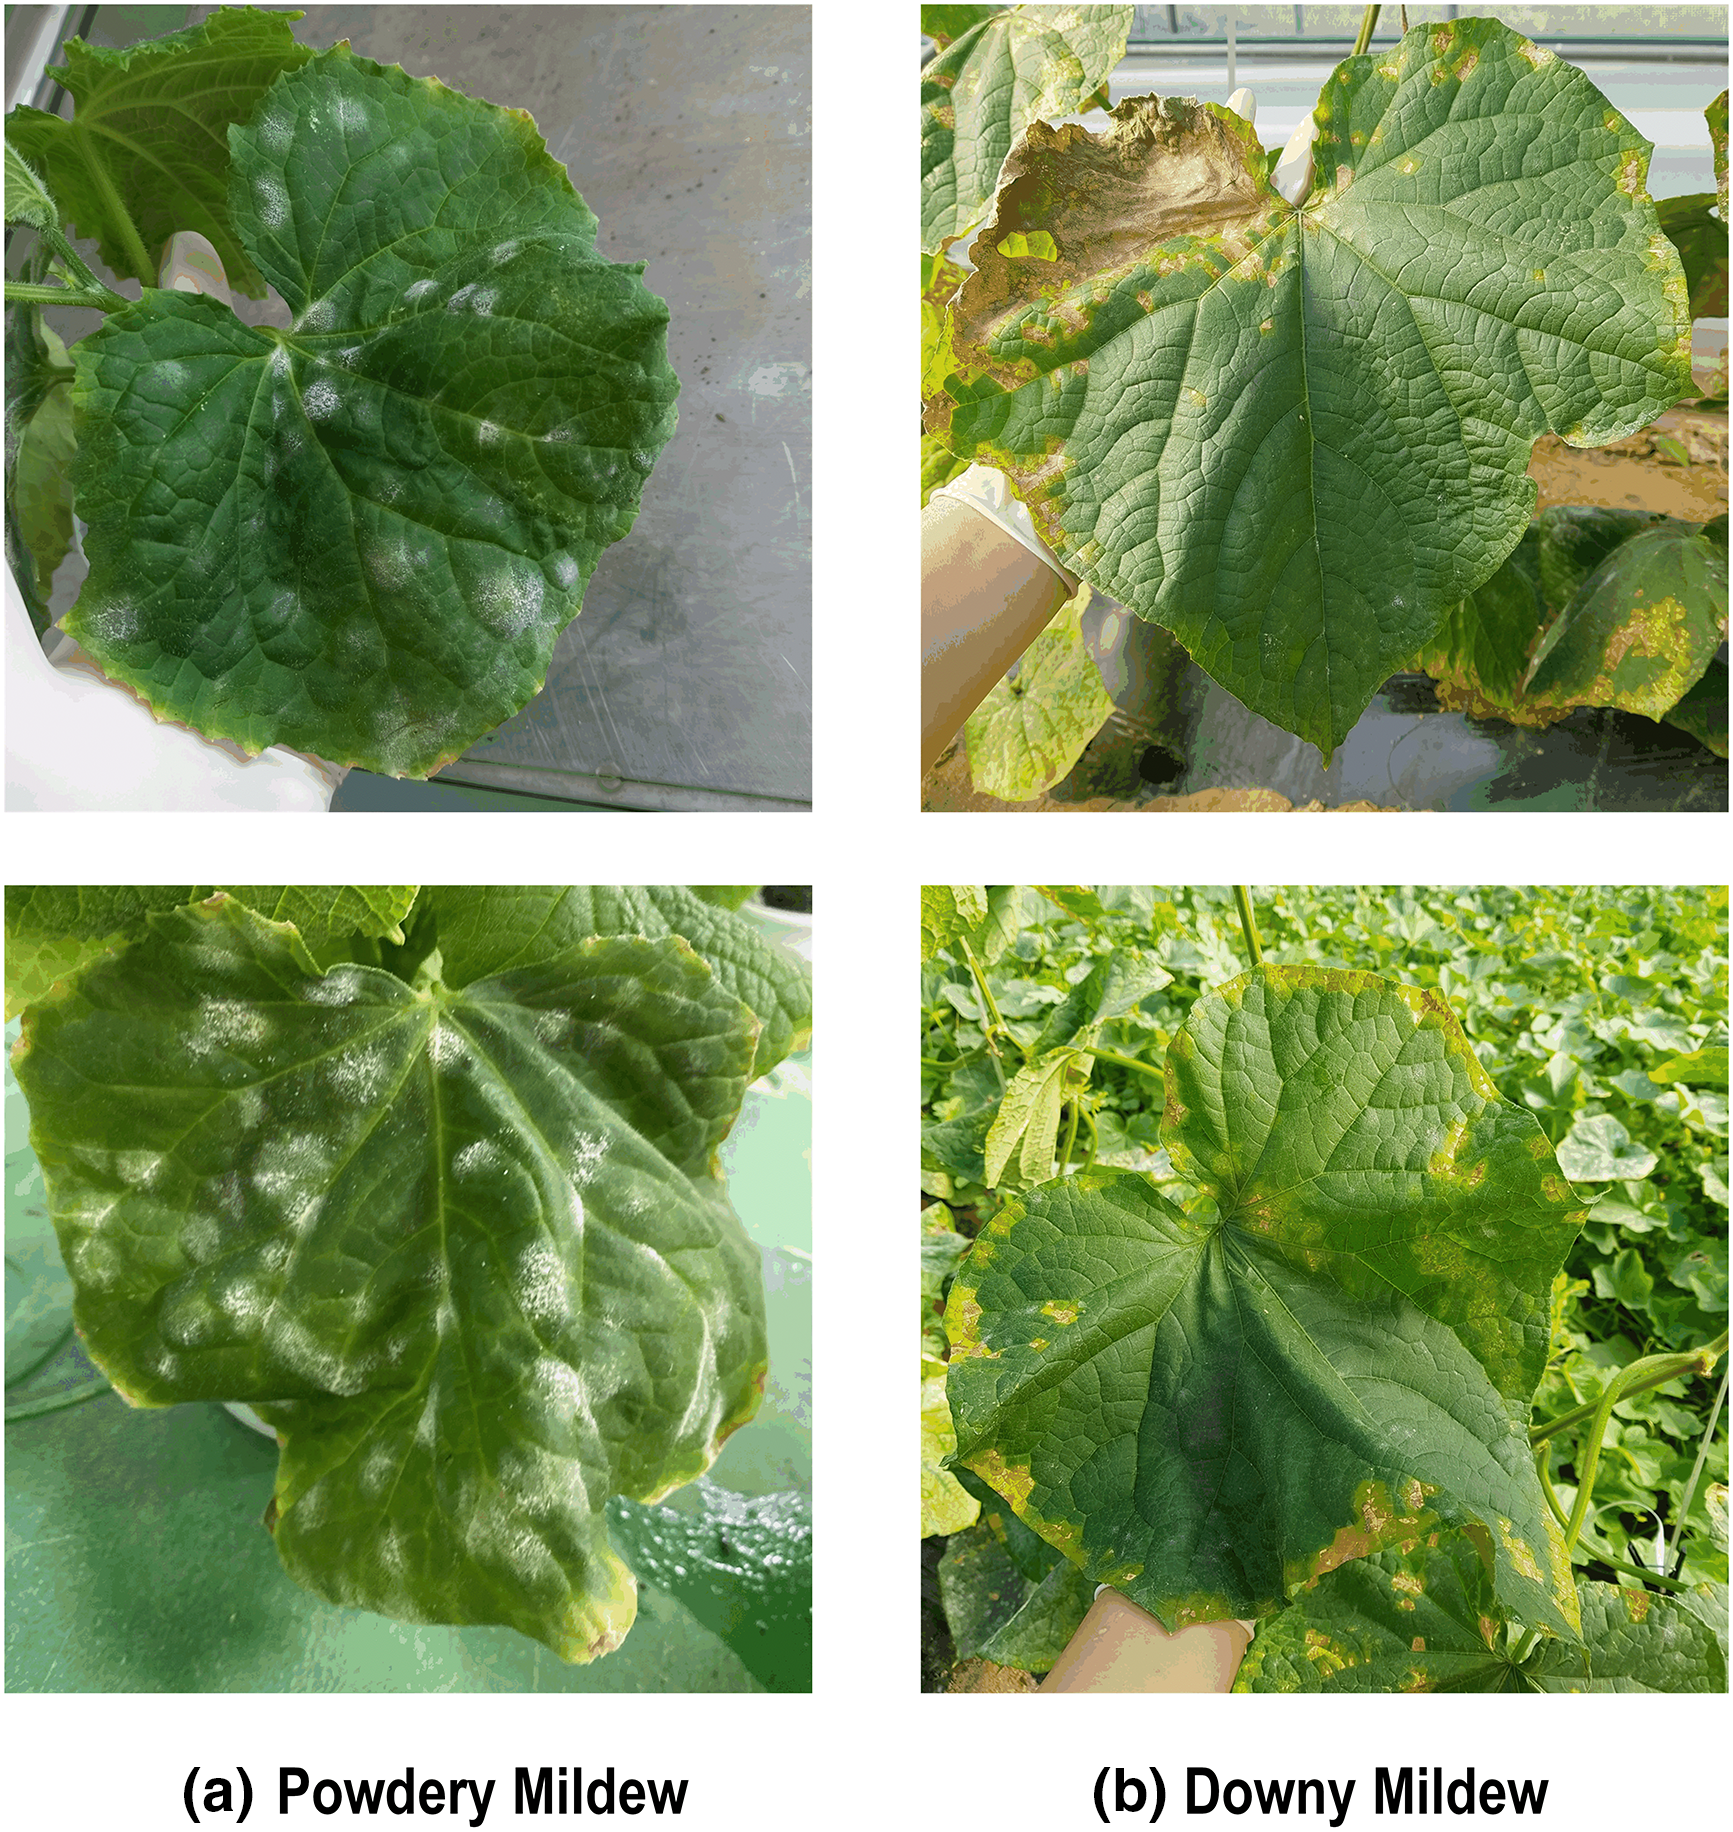
Figure 1: Integrated data on plant disease induction (a) Powdery Mildew, (b) Downy Mildew
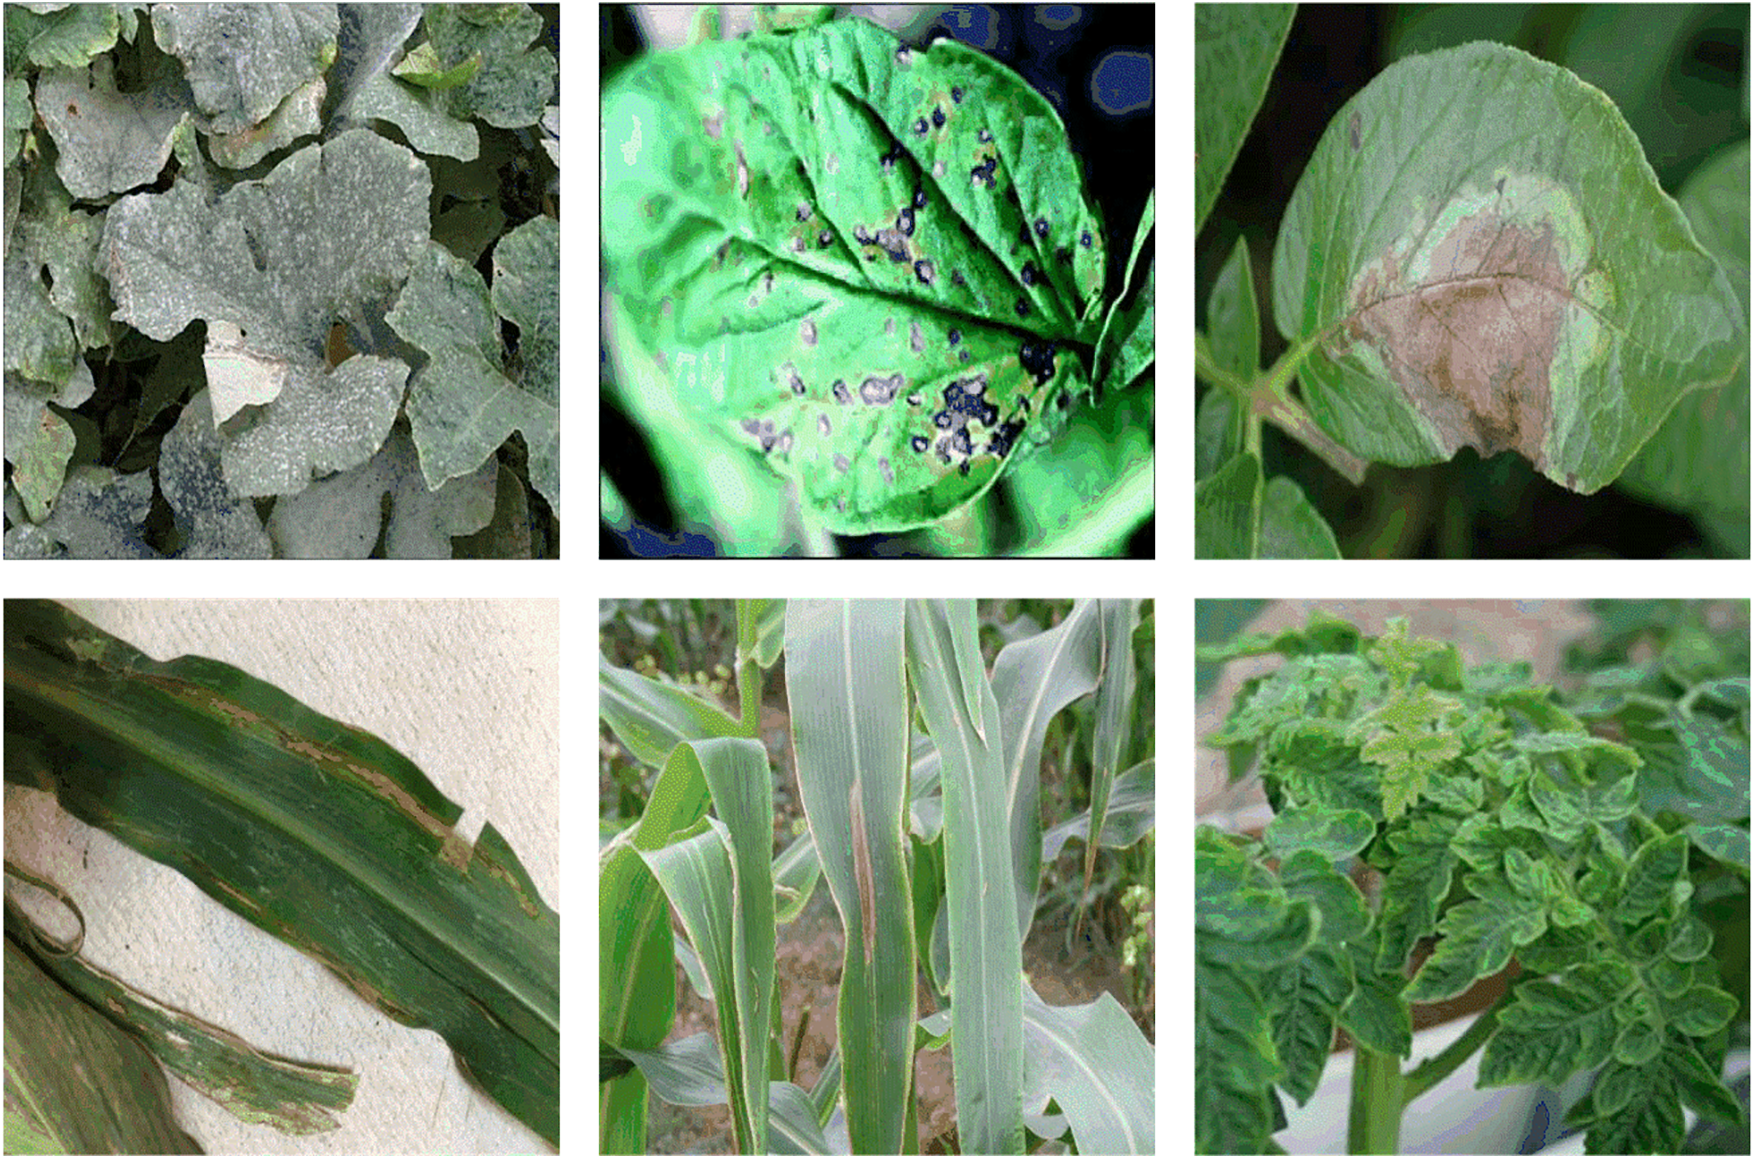
Figure 2: Examples of diseased plant leaves from the PlantDoc dataset
To construct a dataset suitable for cucumber pests and diseases, we extracted a subset from the original dataset and integrated it comprehensively. To ensure the model’s wide adaptability and robustness, we precisely manually labeled the leaves in each image and strictly screened and filtered the original images. Our goal was to obtain a high-quality dataset containing 2000 images of cucurbit pests and diseases after removing irregular data and concentrating on two common cucumber diseases, downy mildew and powdery mildew. Three subsets were created in this dataset: training set, validation set, and test set, with an 8:1:1 ratio between them. Fig. 3a shows the number of category labels and label size distribution for the PlantDoc dataset, while Fig. 3b shows the number of category labels and label size distribution for the self-built cucumber disease dataset.
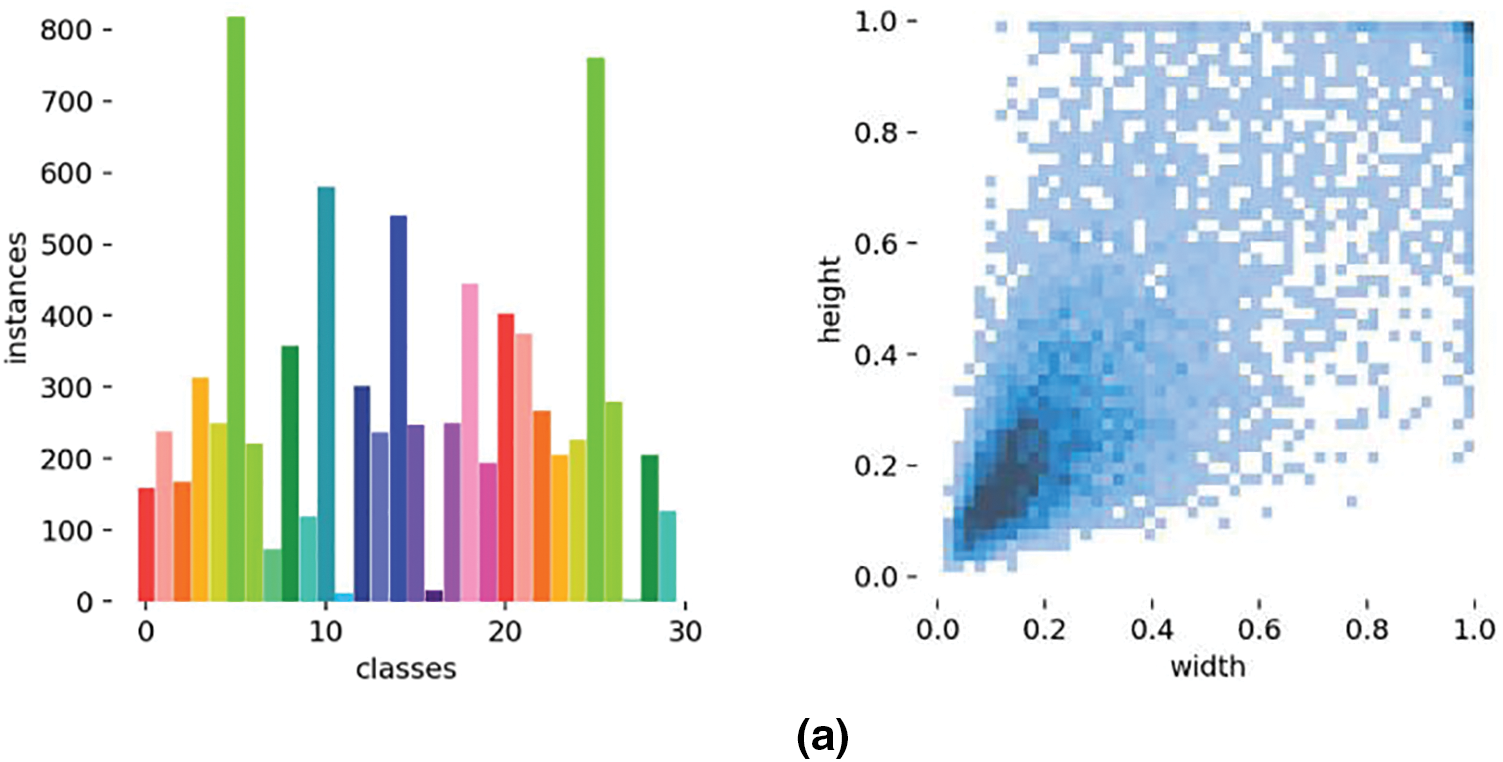
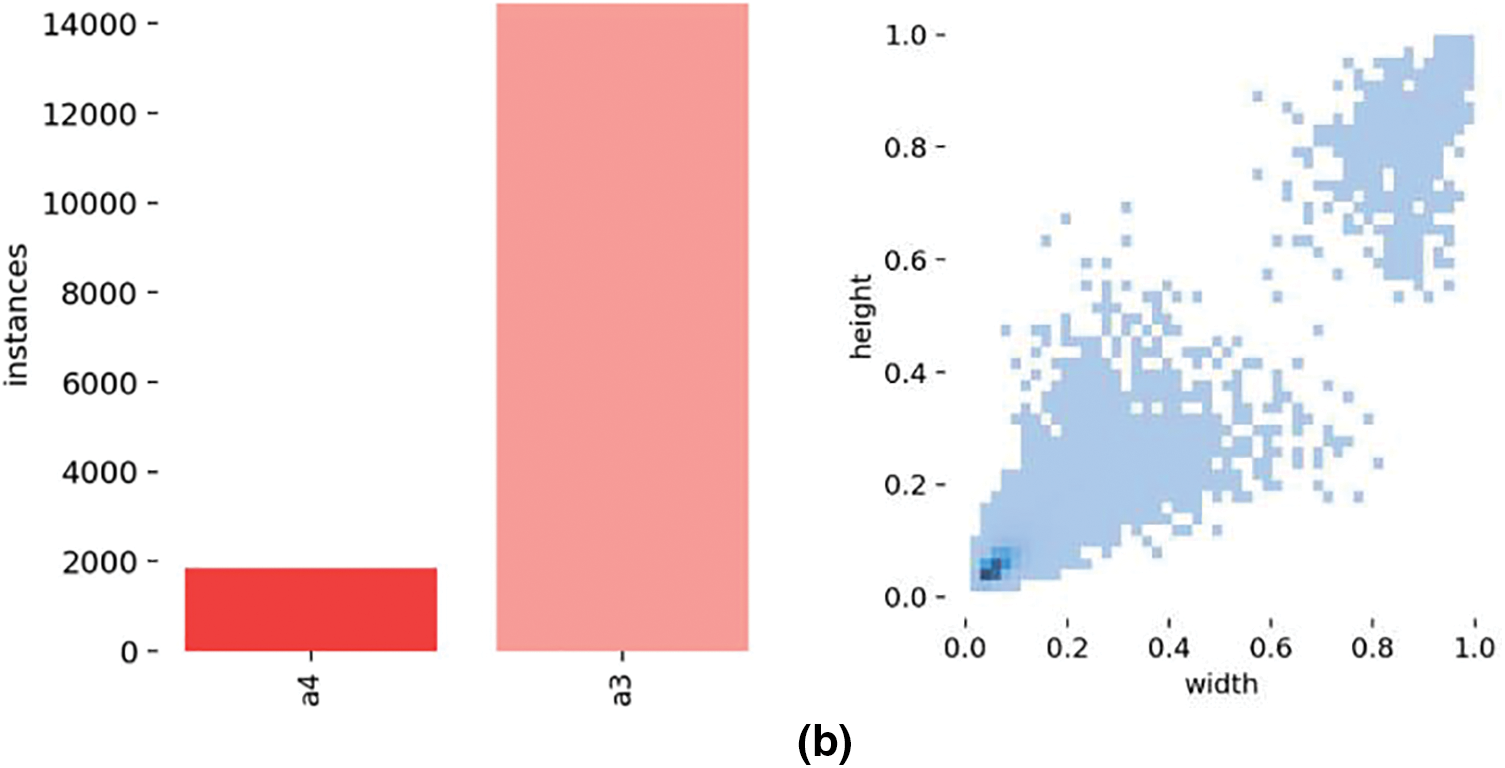
Figure 3: Category label count and object size distribution in the PlantDoc and cucumber disease datasets. (a) Number of category labels and label size distribution in the PlantDoc dataset, (b) Number of category labels and label size distribution in the self-built cucumber disease dataset
The YOLO series has undergone significant evolution with the release of YOLOv8, which builds on the improvements made in YOLOv5. The model incorporates a range of enhancements and optimizations that are designed to enhance performance across various tasks. The integration of detection networks that operate at different resolutions and scales is a critical improvement in YOLOv8, which allows the model to adapt to diverse usage scenarios.
From the backbone to the head, YOLOv8 is constructed with meticulous refinement, including the Gradient Flow Enhanced C2f structure and innovative decoupled head design. The classification and detection processes become more autonomous and efficient with this design choice. The architecture of YOLOv8 has changed significantly by converting from anchor-based to anchor-free detection, which reduces computational complexity and improves adaptability to objects of different sizes compared to previous models. YOLOv8’s loss function is capable of detecting objects more precisely because it combines Task-Aligned Assigner [15] and Distributed Focal Loss [16]. To refine performance further, the model employs strategic data augmentation techniques, including deactivating mosaic augmentation in the later stages of training. Fig. 4 demonstrates the intricate design of YOLOv8, highlighting the system’s architecture and sophisticated features.
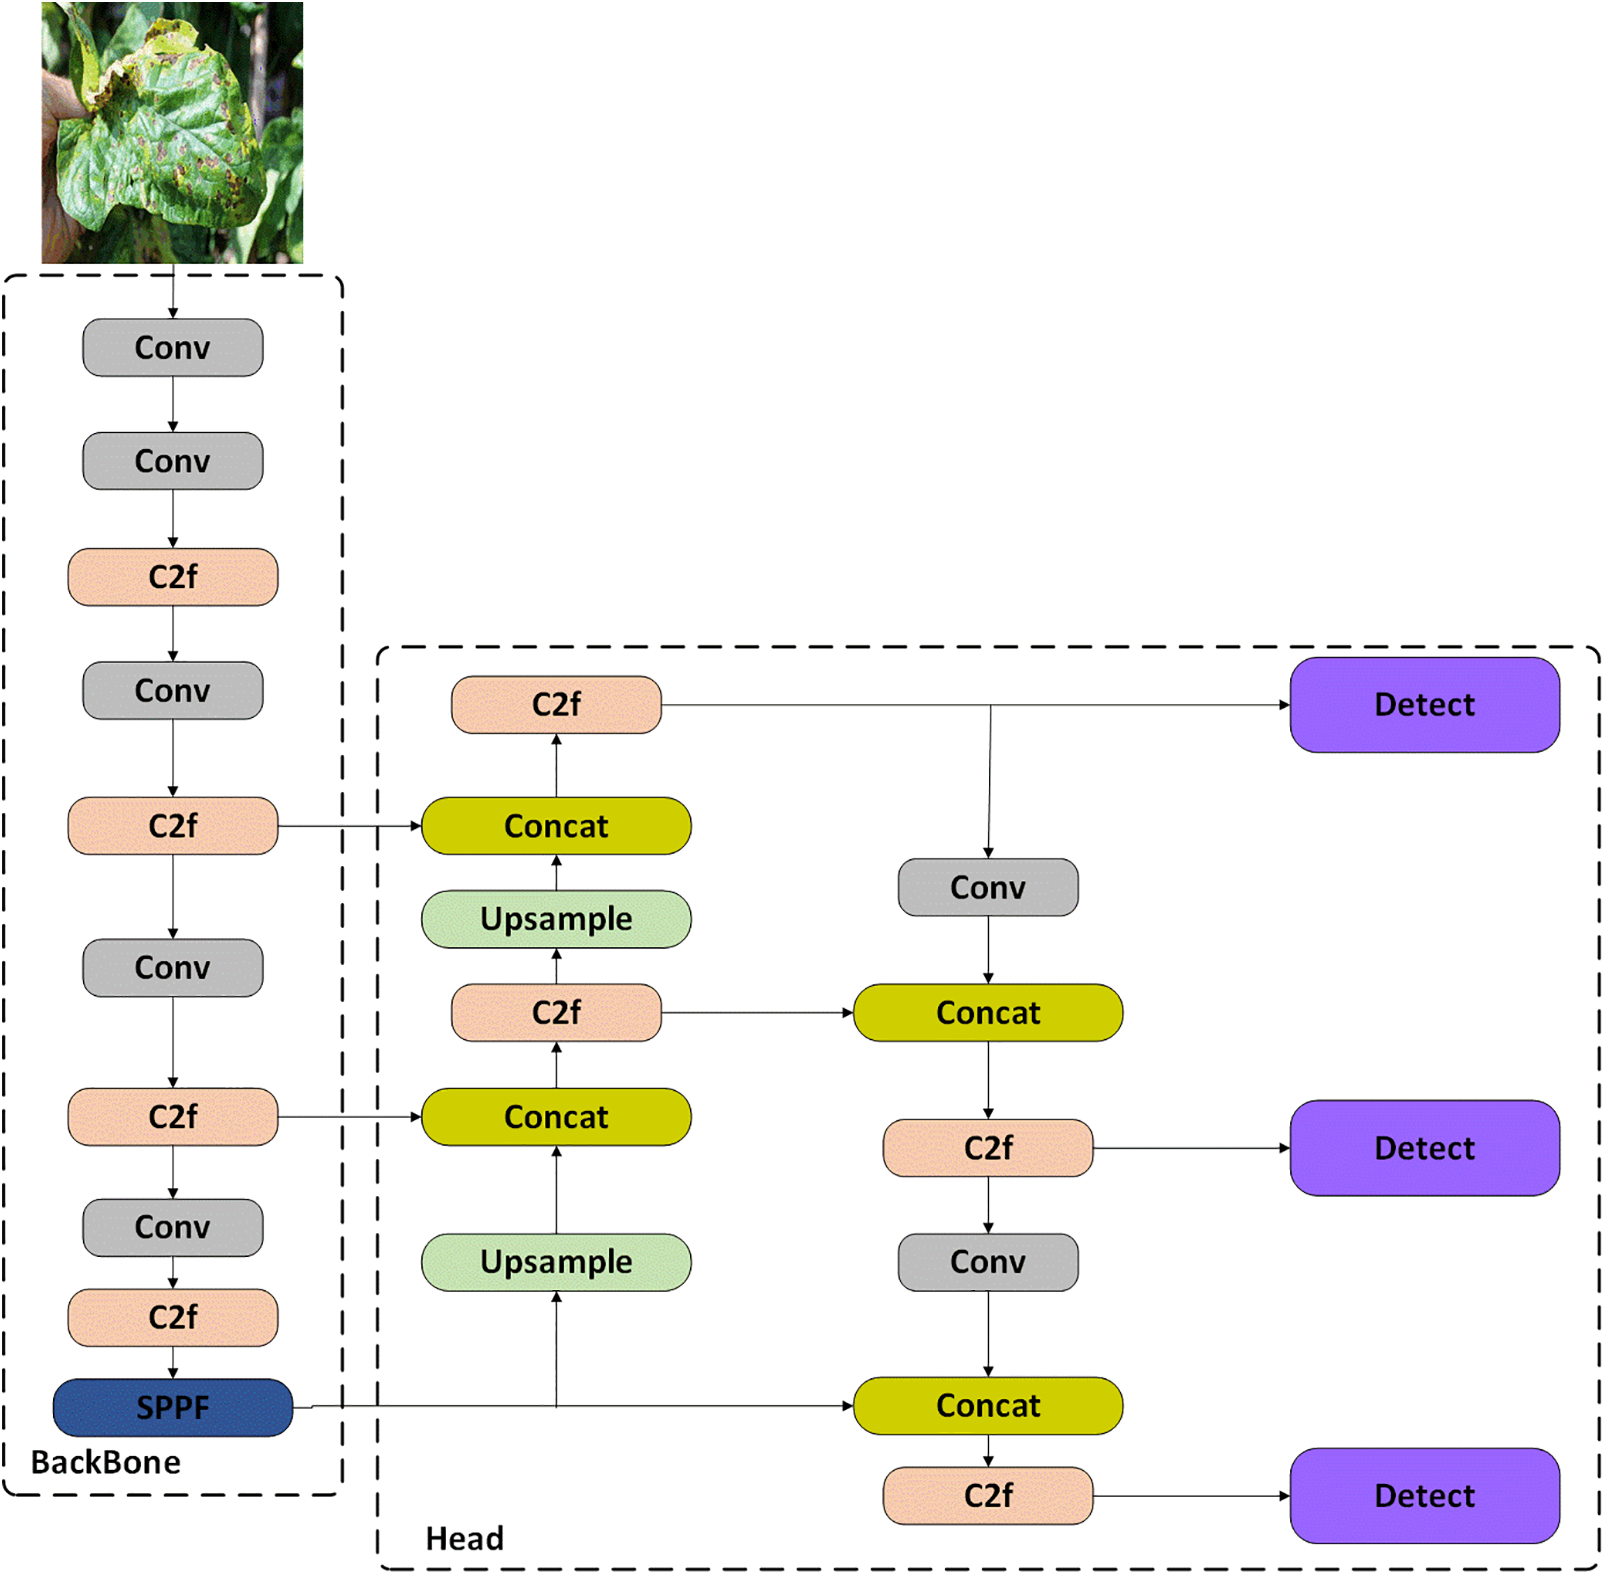
Figure 4: Visualization architecture of standard YOLOv8
In Fig. 5, we propose the DM-YOLO model to enhance the ability to detect small targets. We first introduce the AD-C2f module, which incorporates attention mechanism features within the C2f module, increasing the ability to process features for plant disease detection. Our ConvBlock module is utilized in conjunction with the C2f module, allowing for powerful feature extraction while maintaining efficient computation. The AD-C2f module can extract high-level features more effectively without significantly increasing parameters. Next, we design the MultiCat module, which adopts multi-scale feature processing and fusion strategies to enhance the model’s ability to detect smaller pest and disease targets on plant leaves, while also integrating rich feature information from the backbone network, further improving plant disease detection performance. Finally, we propose the C2fe module, which introduces a global context module into the C2f module, enhancing feature representation capabilities through global context modeling and attention mechanisms. The global context module reweights the channel addition and channel multiplication attention mechanisms at the channel level, allowing the model to capture more inter-channel correlations and enhance feature representation capabilities.
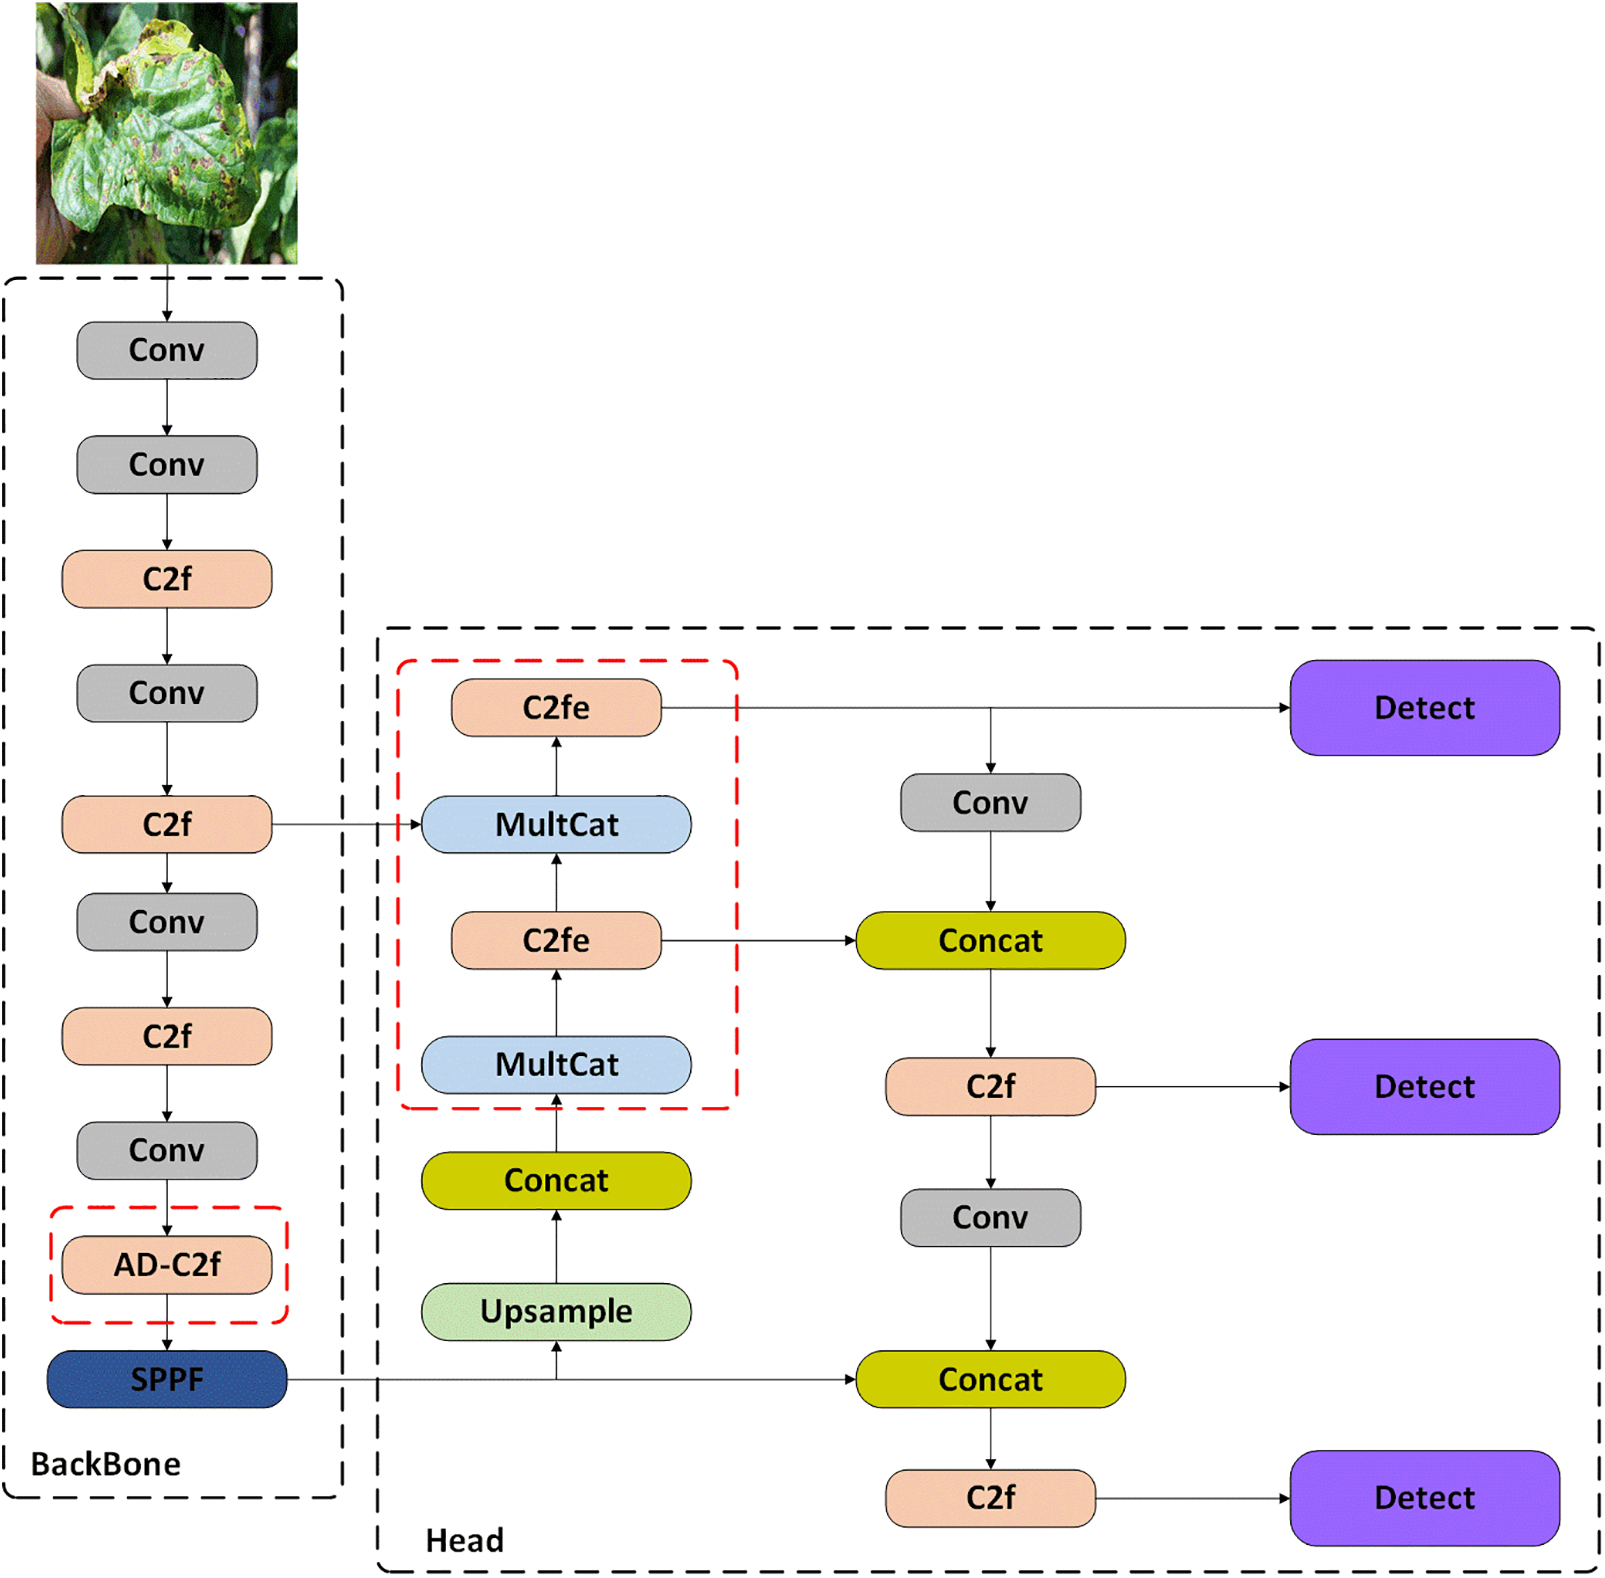
Figure 5: Visualization architecture on proposed model
In agricultural monitoring, detecting plant diseases and pests presents numerous challenges, including variations in lighting conditions, object occlusion, and interference from other diseases and pests. Image noise, such as cluttered backgrounds or irrelevant elements, can further reduce the accuracy of disease detection. We integrated the MultiCat module into our enhanced cucumber disease detection model to address these challenges, as illustrated in Fig. 6. The MultiCat module employs a multi-scale feature processing and fusion strategy to improve the model’s ability to detect smaller targets on plant leaves while incorporating rich feature information from the backbone network.
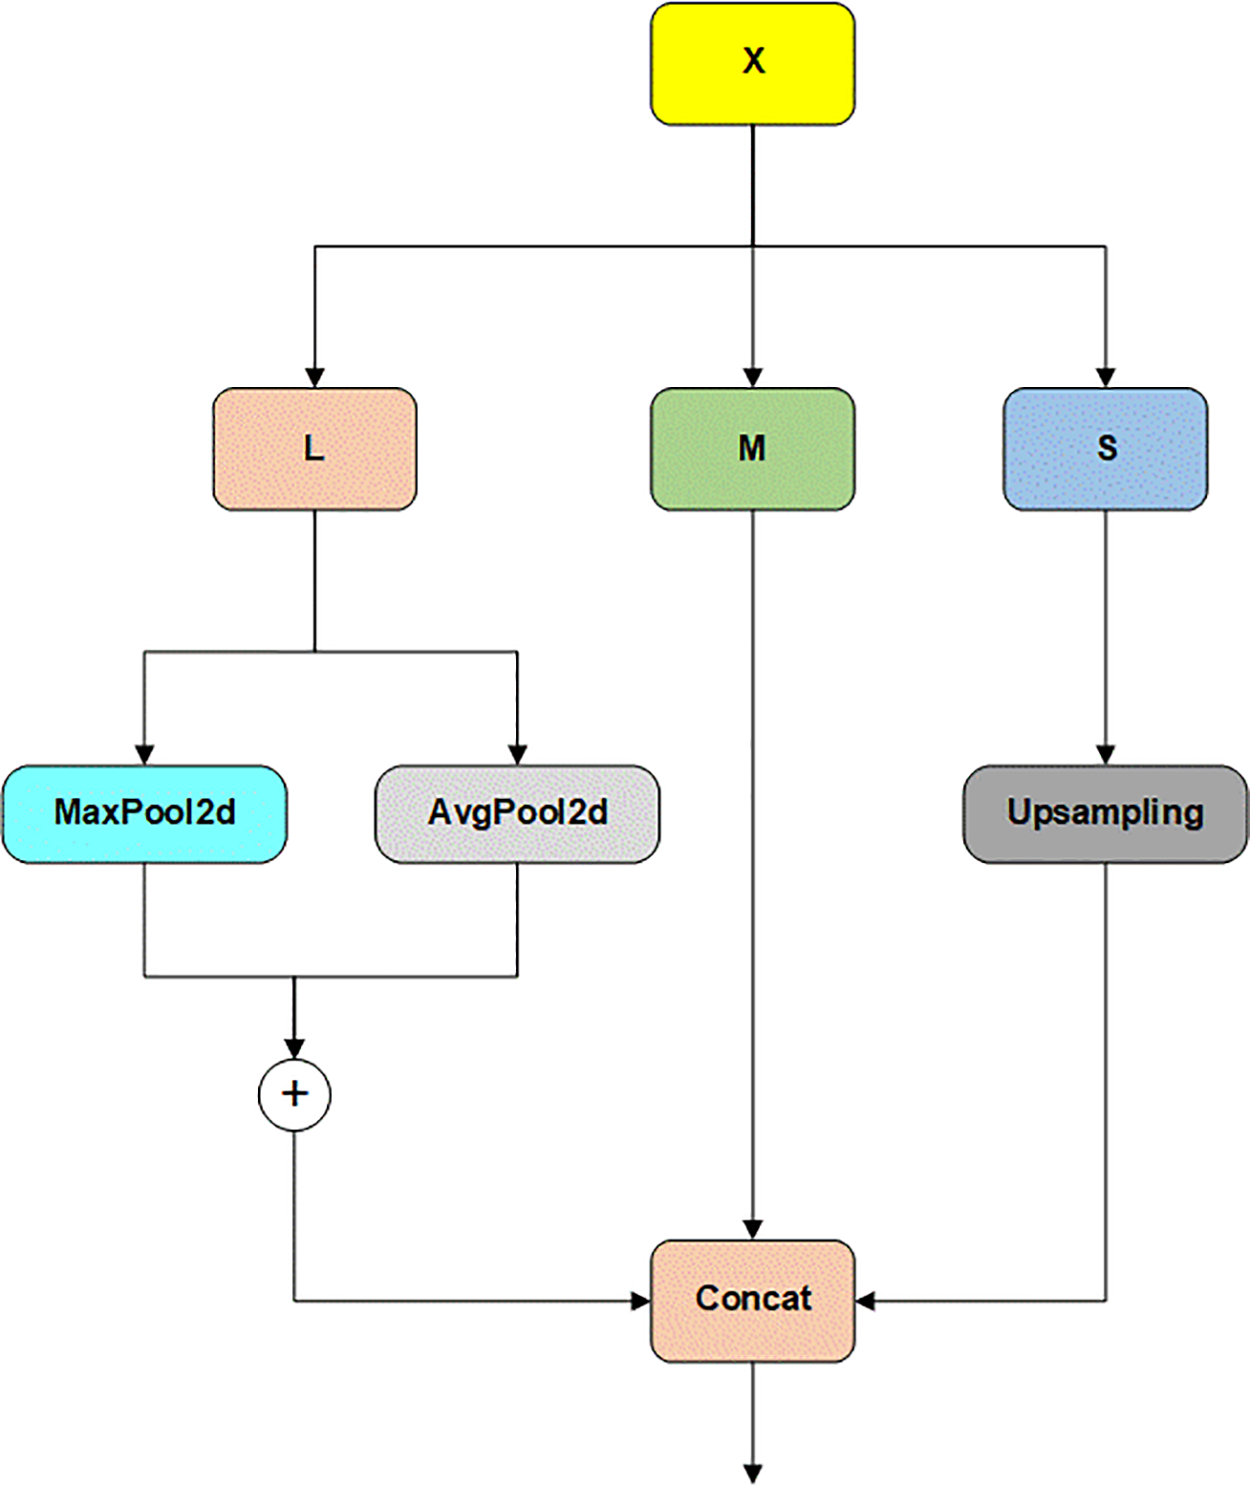
Figure 6: Visualization of MultiCat module
Within the MultiCat module, the input feature map is decomposed into three scales: L (large scale), M (medium scale), and S (small scale). The large-scale feature map (L) leverages adaptive max pooling and adaptive average pooling to stably extract features, thereby reducing the impact of lighting changes and noise on detection. The medium-scale feature map (M) preserves the primary structural information of the image, complementing the large and small scales and enhancing overall feature extraction. The small-scale feature map (S) is upsampled using nearest-neighbor interpolation to maintain the original data values and ensure that all feature maps have the same spatial dimensions. This step is crucial for retaining rich local disease feature details. Finally, the three scaled feature maps are fused into a unified feature map through channel concatenation and returned as output. This multi-scale feature fusion strategy significantly enhances the model’s performance in complex agricultural monitoring environments, enabling it to perform more effectively under diverse and challenging real-world conditions.
Downy mildew and powdery mildew are two prevalent diseases that significantly impair the growth and yield of cucumber. Downy mildew typically manifests as a white or gray layer on the leaves, whereas powdery mildew presents as a white powdery coating. Although these two diseases exhibit distinct visual characteristics, detecting them remains challenging due to factors such as lighting variations and occlusion.
To address these challenges, we integrated the attention mechanism and deep separable convolution into the model and designed the AD-C2f module, as illustrated in Fig. 7a. This module provides robust technical support for the accurate identification and localization of plant pests and diseases. The attention mechanism is a technique that enables the model to focus on key parts when processing data. It allows the model to selectively focus on task-relevant information by assigning different “attention” weights to different regions when processing images.
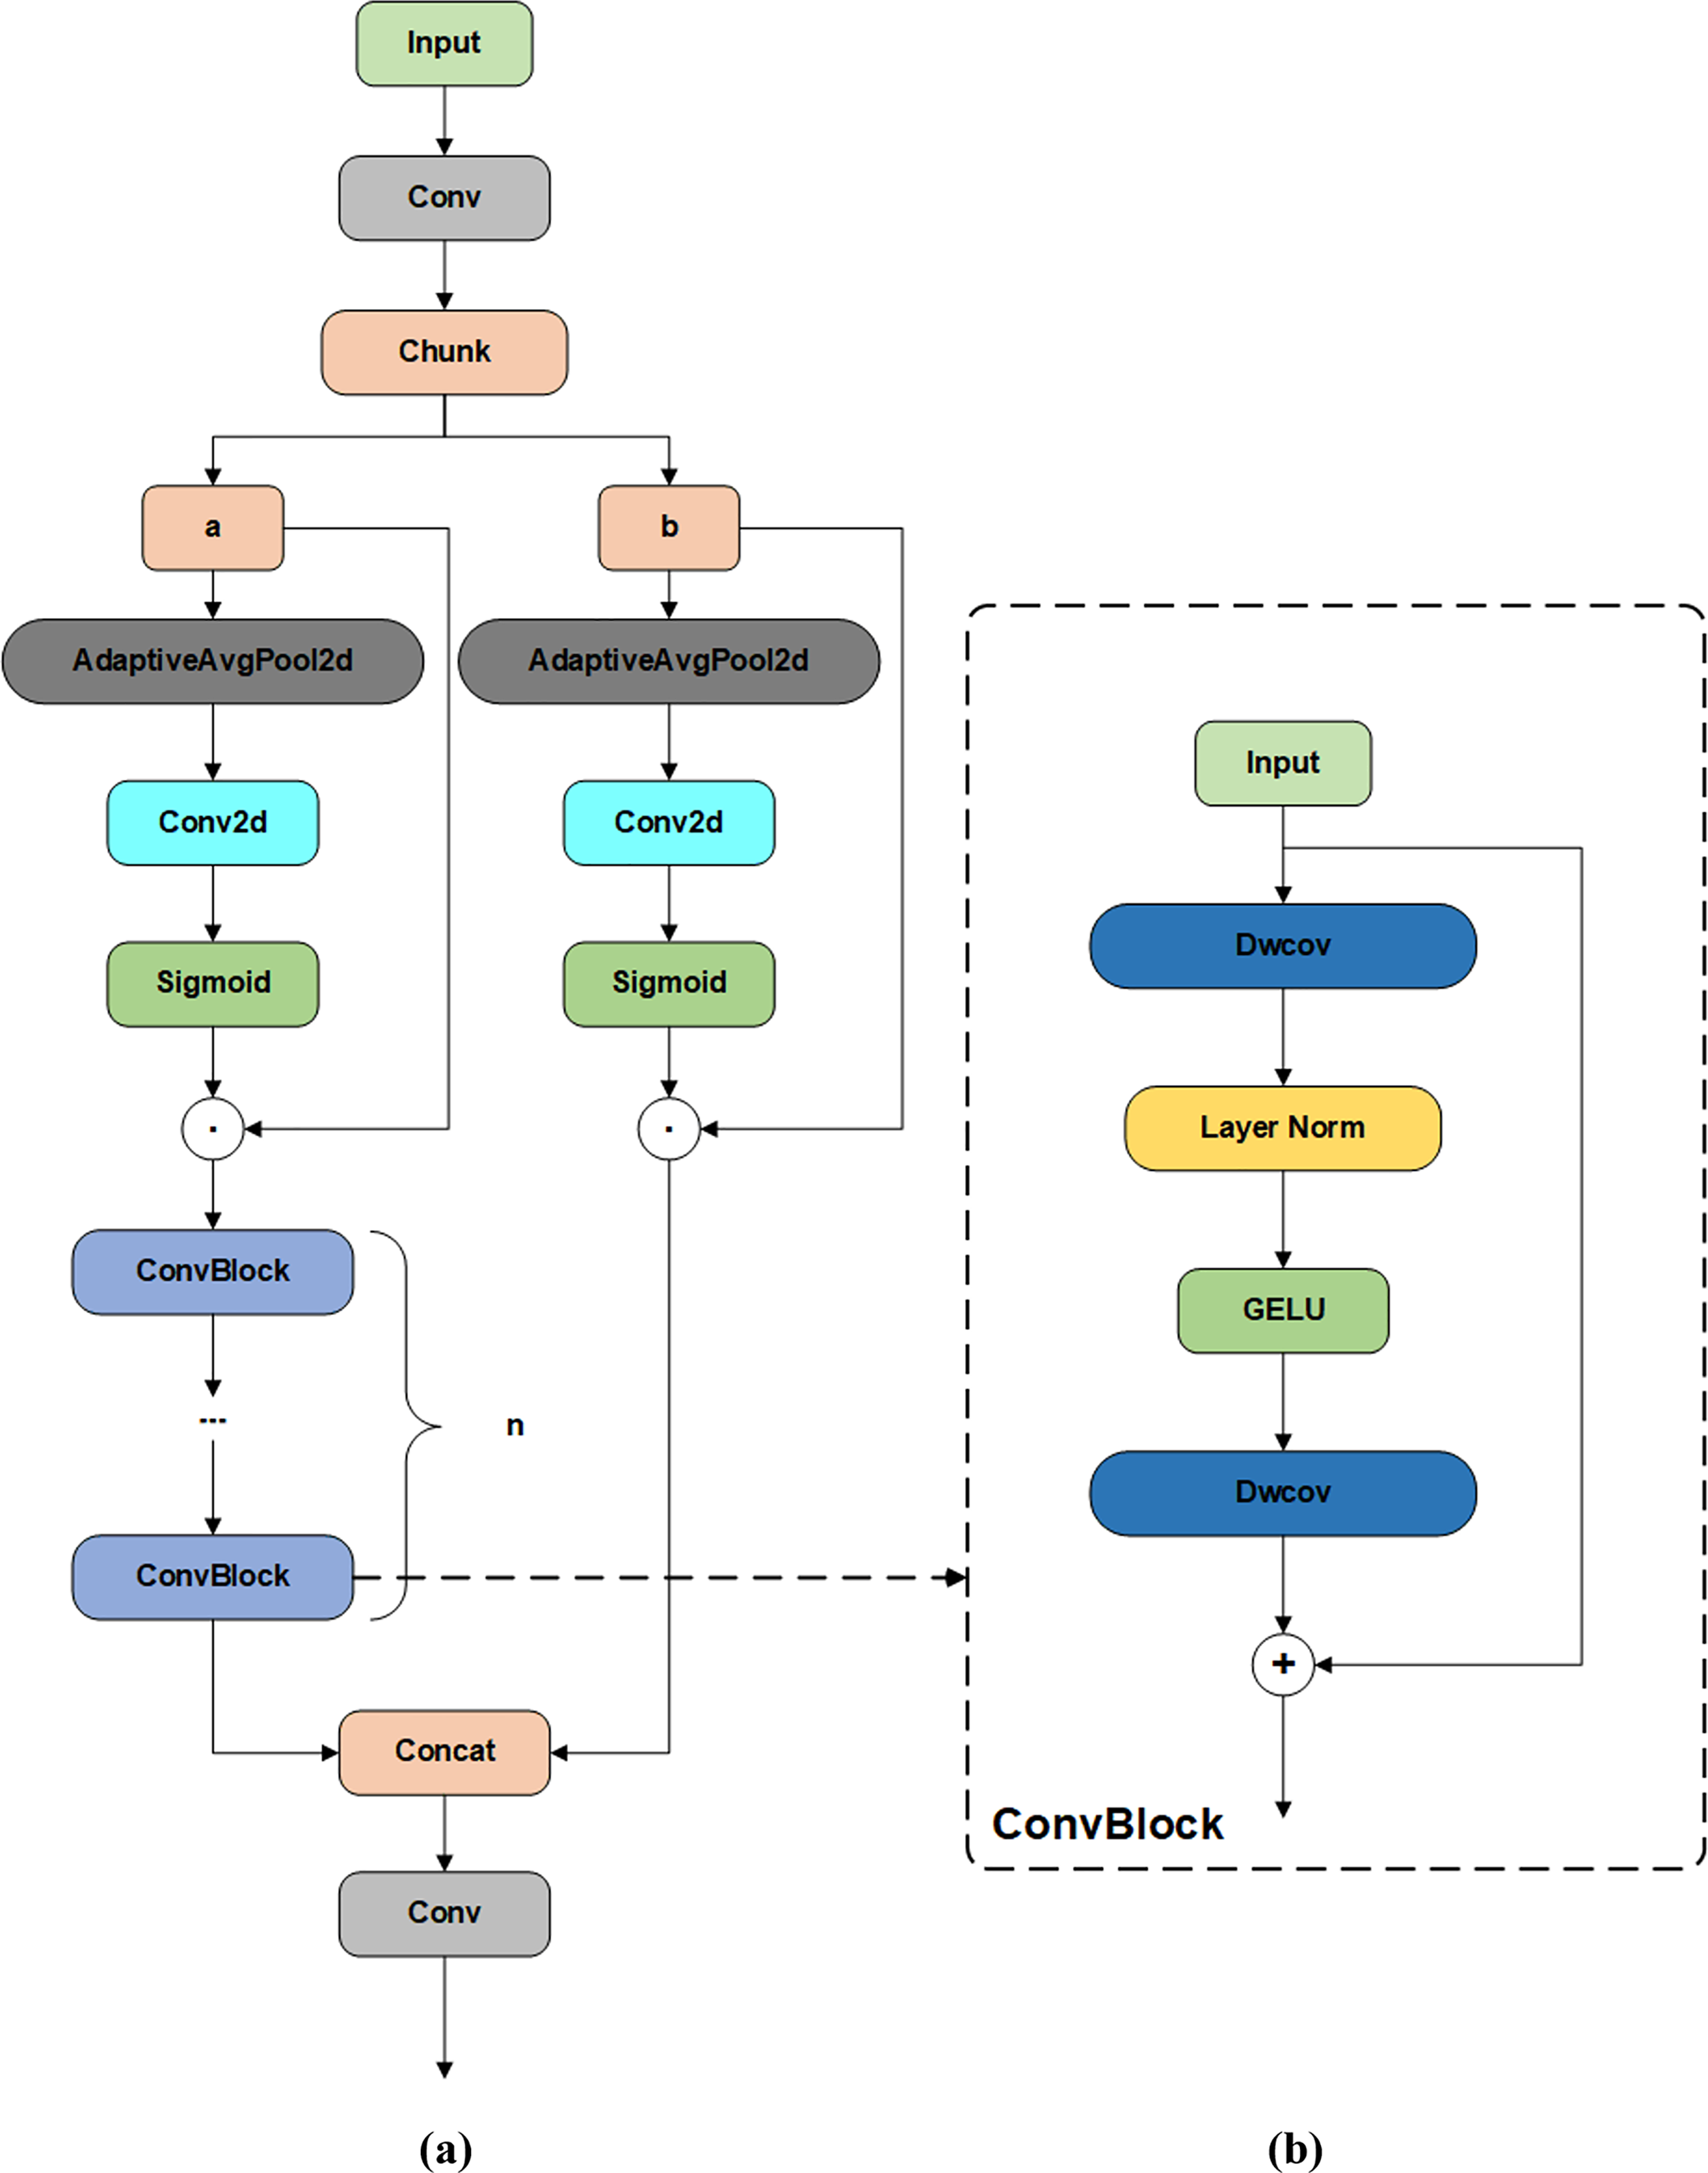
Figure 7: Visualization of AD-C2f and ConvBlock modules (a) AD-C2f module (b) ConvBlock
In the ADC-2f module, the input feature map is initially divided into two sections, designated as a and b. These two sections are then weighted for the channel direction using the sigmoid activation function via an adaptive averaging pooling layer and two convolution layers, respectively.
Its formula is as follows:
In this context, σ represents the Sigmoid function, fc denotes the convolution layer, pool stands for the adaptive average pooling layer, and xi is a component of the input feature map (‘a’ or ‘b’).
By applying attention weights, the module can adjust each part of the input feature map, thereby enabling the model to focus on the most pertinent areas relevant to the task at hand. This process can be represented by the following equation:
The AD-C2f module employs the attention mechanism to filter out crucial feature information, thereby enhancing the model’s accuracy in identifying and locating cucumber downy mildew and powdery mildew. As illustrated in Fig. 7b, the AD-C2f module’s ConvBlock structure employs depthwise separable convolution to achieve efficient feature extraction. Depthwise separable convolution is a convolutional structure that decomposes traditional convolution operations into two smaller operations (depthwise convolution and pointwise convolution). This decomposition significantly reduces the computational load and model parameters while maintaining or even improving the model’s performance.
In depthwise separable convolution:
In this manner, the AD-C2f module is capable of reducing the computational burden while maintaining a high degree of feature extraction capability. This provides a robust foundation for the accurate identification of complex patterns in pest and disease images. The design of the AD-C2f module enables accurate identification and localization of diseases at a low computational cost.
This combination of attentional mechanisms and deeply separable convolution confers significant advantages upon the AD-C2f module in the context of pest detection, particularly in the presence of challenges such as changes in lighting, occlusion, and background noise.
The C2f module draws inspiration from the ELAN (Efficient Layer Aggregation Network) concept introduced in YOLOv7 [17]. By incorporating more parallel gradient flow branches, C2f aims to maintain a lightweight architecture while capturing richer gradient flow information. In this study, we enhanced the C2f module by developing the C2fe module. This improvement introduces a global context block (GC Block) that generates attention weights at every position of the feature map, thereby emphasizing important regions and suppressing irrelevant ones. This modification enhances the model’s ability to process features in complex backgrounds and small-object scenarios, significantly improving detection performance under challenging conditions [18].
The architecture of the C2fe module with Integrated Bottleneck and GC Block is shown in Fig. 8. The C2fe module introduces a Global Context Block (Fig. 8c) that enhances feature representation through global context modeling and attention mechanisms. The Global Context Block utilizes both channel addition and channel multiplication attention mechanisms, re-weighting the channels to better capture inter-channel correlations, thereby strengthening the feature representation capabilities of the model. This channel-level fusion allows the C2fe module to effectively capture and express correlations between different channels, which is crucial for improving the model’s recognition and localization accuracy.
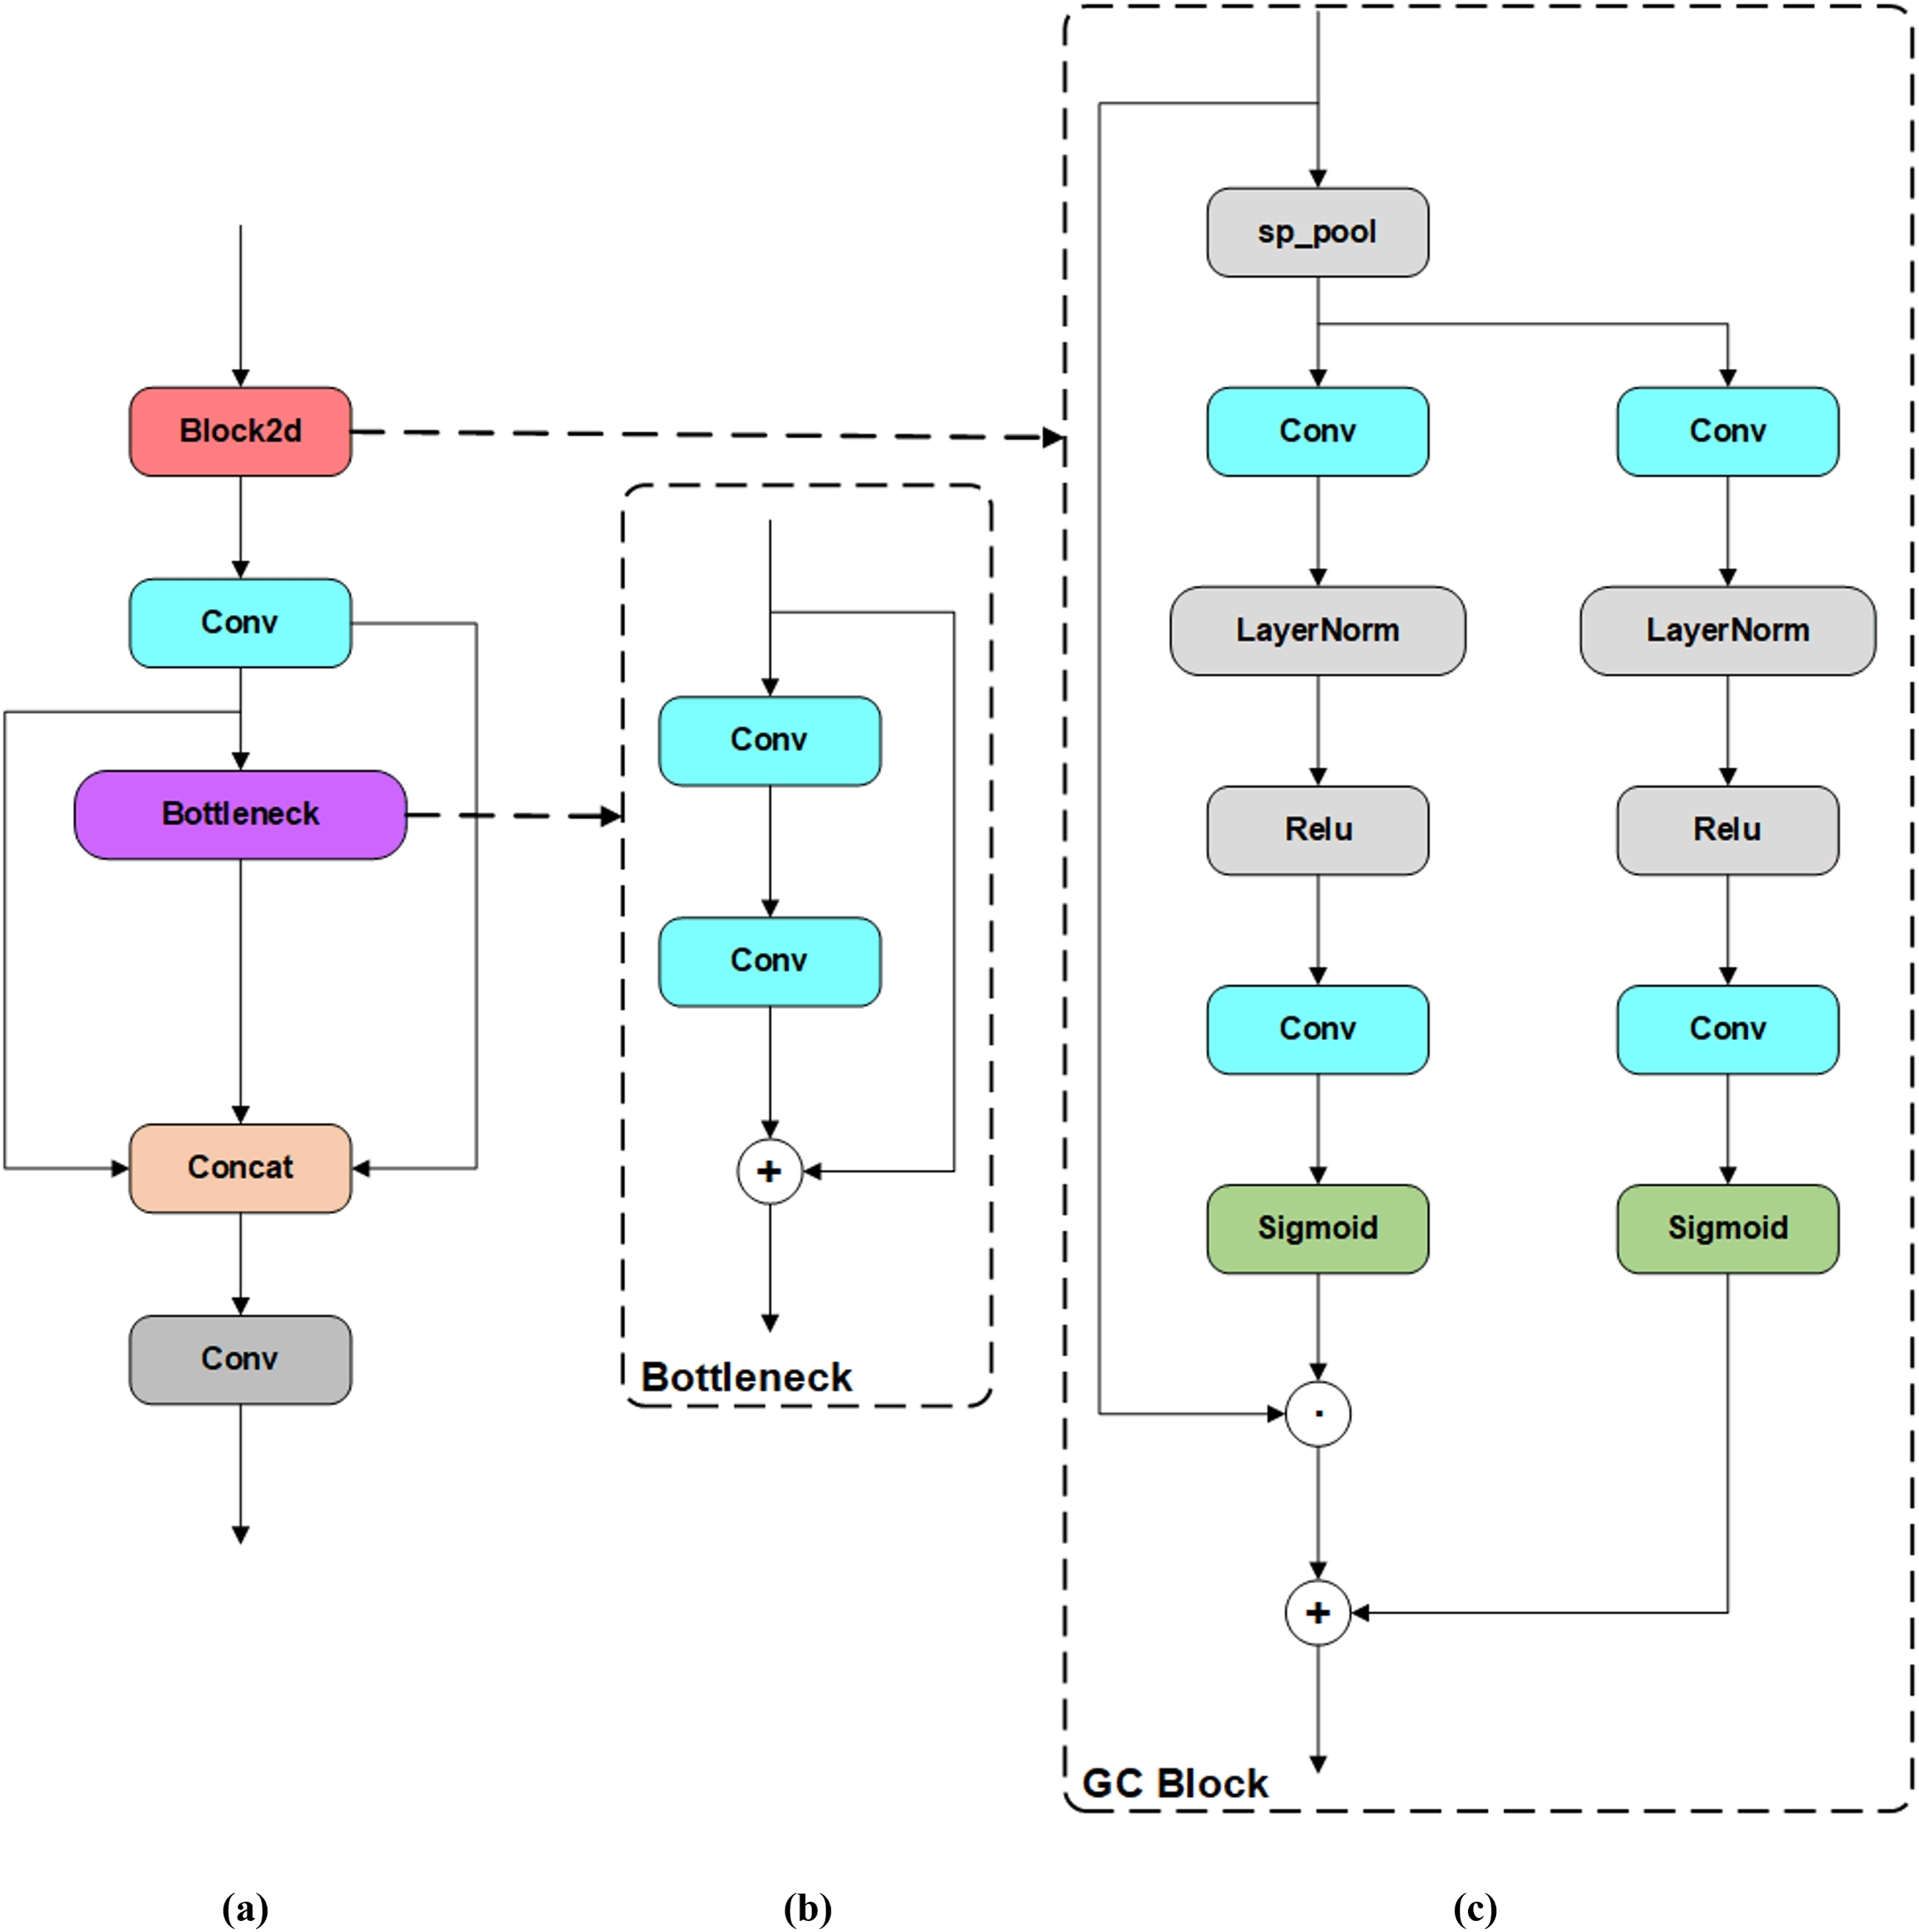
Figure 8: Architecture of the C2fe module with integrated bottleneck and GC Block (a) C2fe module (b) Bottleneck (c) GC Block
In terms of implementation, the C2fe module incorporates a series of convolutional layers and bottleneck layers (Fig. 8b) that work together to further extract and fuse features. This design captures multi-level and multi-scale information from the input image, enabling the network to obtain richer and more accurate feature representations.
In C2f module is compared to its counterpart to have a less complex structure, primarily utilizing a combination of initial convolutional layers and multiple bottleneck layers for feature extraction. Although the C2f module can capture certain feature information, it is inferior to the C2fe module in handling complex backgrounds and small object detection. C2fe module has made the model better at handling complex backgrounds and detecting small objects.
3 Experiment Environment and Result
3.1 Experiment and Parameter Setup
This study utilizes Windows 10, with PyTorch as the framework for developing deep learning models. The experimental environment is given in detail in Table 1.

Training parameter settings: The input image size is 640 × 640, batch size is 16, initial learning rate is 0.01, and the total number of training epochs is 200. Specific parameter settings are listed in Table 2. Additionally, various data augmentation techniques were used during training to improve the model’s generalization ability. These techniques include HSV color space adjustment, random translation, scaling, horizontal flipping, mosaic enhancement, random deletion, and RandAugment automatic augmentation strategy. These data augmentation methods help increase the diversity of training data, prevent model overfitting, and improve the model’s robustness and accuracy in different environments.
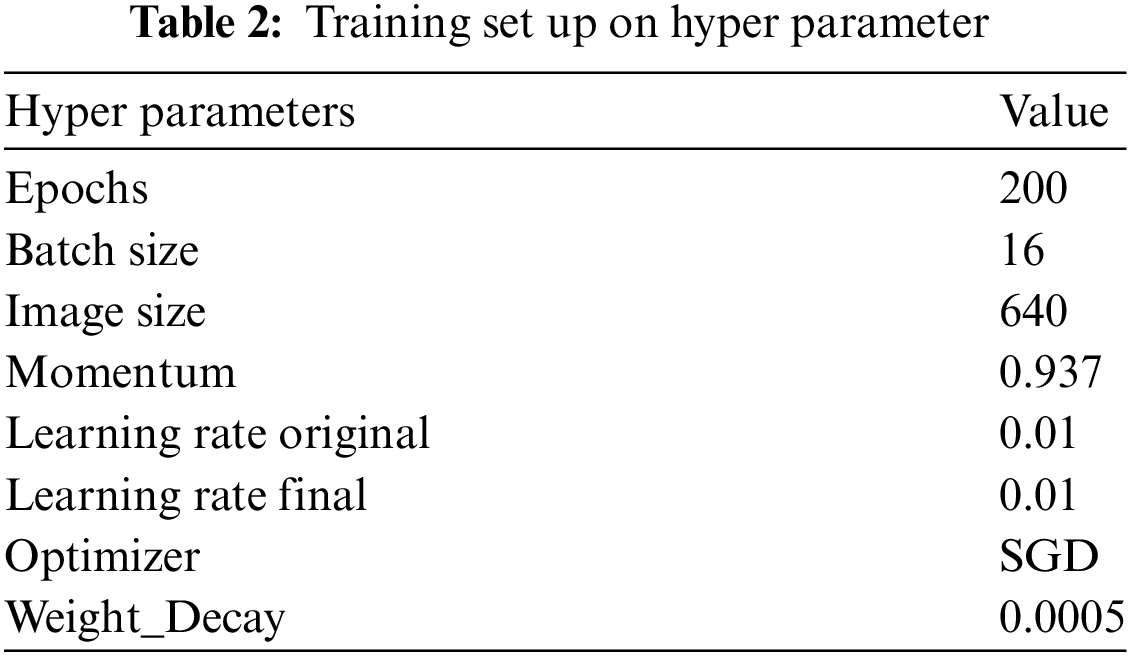
This paper’s parameters are essentially the default parameters for the YOLOv8 model. Batch size, Epochs, and Optimizer were modified to achieve model convergence while ensuring training speed.
To evaluate the effectiveness and performance of the DM-YOLO in accurately identifying pests and diseases, several key metrics were selected for analysis. These metrics include the accuracy rate, recall rate, precision rate, and mean average precision (mAP).
The symbols
As the evaluation metric of the model, mAP50 is the one used in the experiment. When using mAP50, the Intersection over Union (IoU) threshold is represented by ‘50’. Specifically, when calculating AP, the difference between the predicted bounding box and the ground truth bounding box must be equal to or greater than 50%. The overlap between the predicted and ground truth bounding boxes is measured by dividing the area of their intersection by the area of their union. If the threshold exceeds this, the prediction is considered correct. Therefore, it reflects the mean Average Precision across all classes under the condition that it is at least 50%, making it a crucial metric for assessing the model’s detection accuracy.
The DM-YOLO model was compared with the YOLOv8 model in an experiment to demonstrate its effectiveness. Table 3 presents the results of this comparison. Various loss metrics and performance indicators fluctuate during the training and validation processes, as shown in Figs. 9 and 10, the model’s visual effects are highlighted by selected images.

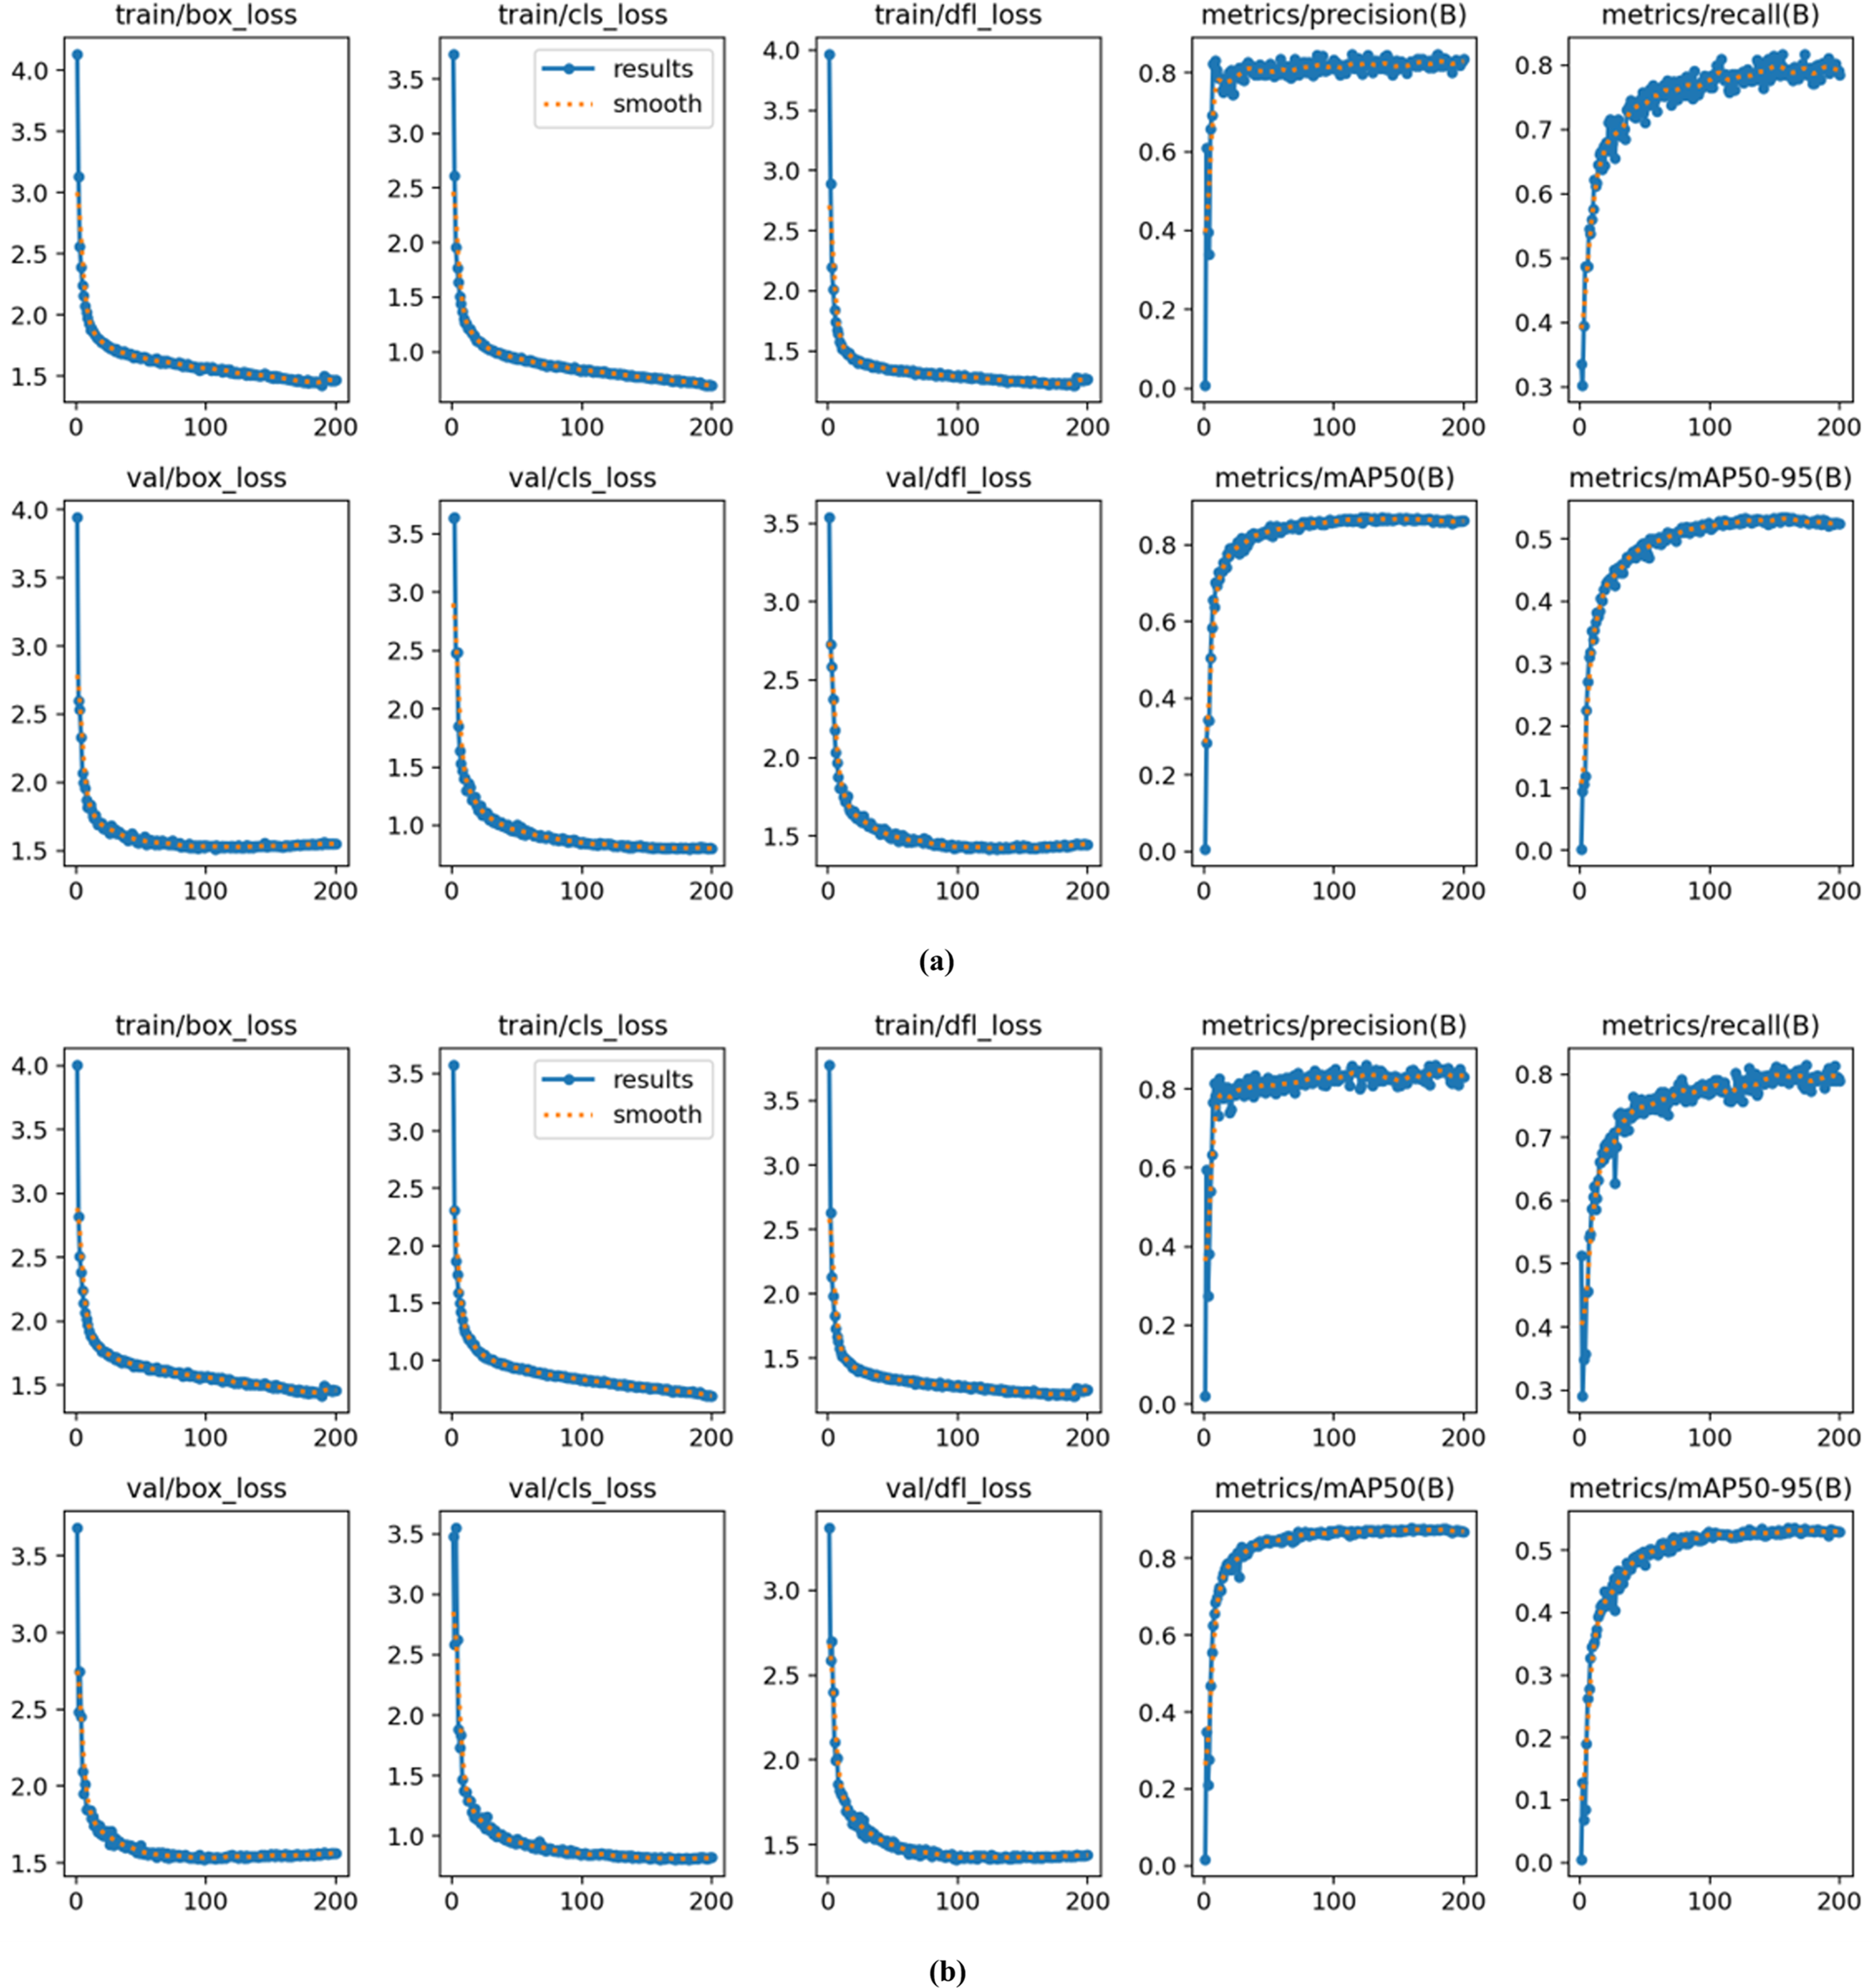
Figure 9: Performance metrics and convergence curves for training and validation losses. (a) Standard YOLOv8 (b) DM-YOLO
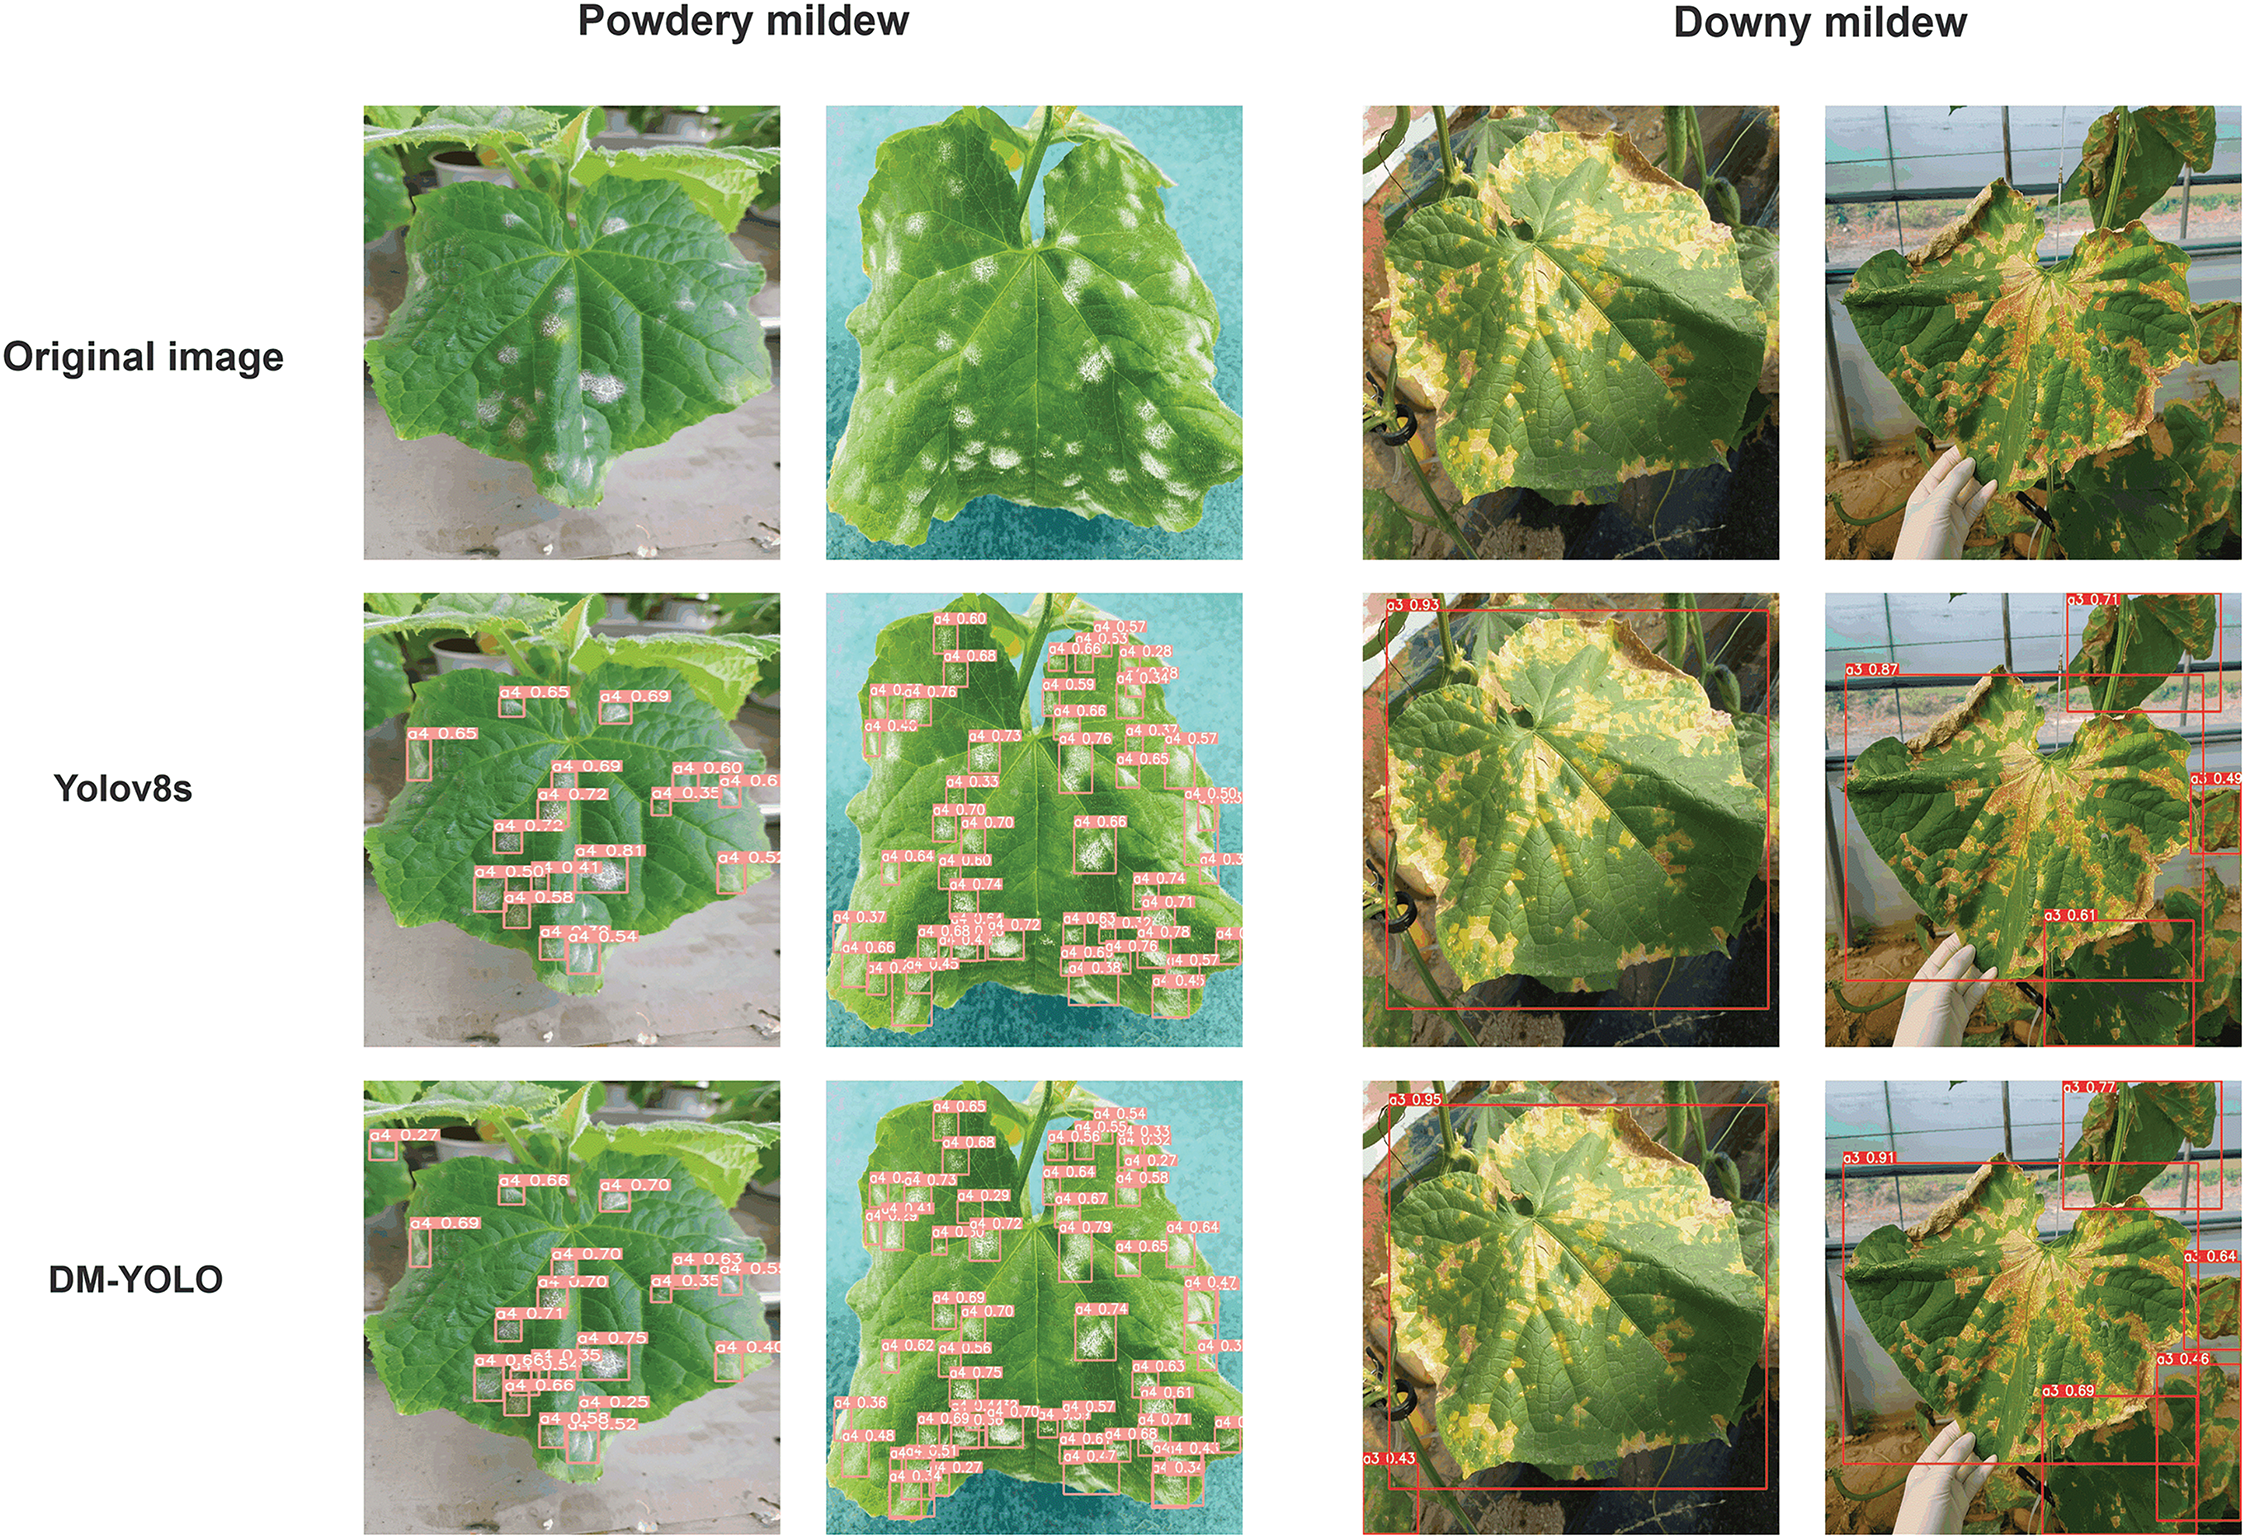
Figure 10: Comparison result of cucumber disease detection by model
The DM-YOLO model has observed gains in accuracy, recall, and mAP50 across every category by 1.3%p, 1.2%p, and 1.2%p, respectively. Across all categories, the DM-YOLO model exhibits improvements in accuracy, recall, and mAP50, with a 1%p, 1%p, and 1%p increase in each area. Powdery mildew (A4) was met with an increase in accuracy, recall, and mAP50 by 0.7%p, 0.6%p, and 1.12%p in response to DM-YOLO. Downy mildew (A3) saw a 2.0%p improvement in accuracy, 1.7%p in recall, and 0.9%p in mAP50. These enhancements underscore the DM-YOLO model’s superior ability to decrease missed detections and enhance detection accuracy and recall.
Fig. 7 displays that the DM-YOLO model is superior to the original YOLO model in many aspects, demonstrating the comparison of experimental results between YOLO (a) and DM-YOLO (b). Firstly, the DM-YOLO model exhibits faster convergence, with a more rapid decline in training and validation losses. Secondly, the DM-YOLO model demonstrates superior generalization ability and lower validation loss, indicating more stable performance across different datasets. Lastly, the DM-YOLO model outperforms in detection performance, achieving higher accuracy, recall, mAP50, and mAP50-95 metrics, particularly in scenarios involving complex backgrounds and small target detection. The integration of multi-scale feature fusion and the introduction of enhanced spatial and channel attention modules are responsible for these improvements.
To ensure robust and reliable performance, we employed the commonly used cross-validation method for model evaluation. As shown in Table 4, the dataset was divided into five-folds, and training and testing were conducted on different folds. This approach helps reduce bias that may arise from a single data split. It provides a more comprehensive reflection of the model’s performance and prevents the model from performing well on a single dataset but poorly on others.

From the results of the five-fold cross-validation, we can calculate the average performance metrics and their standard deviations. The average accuracy of DM-YOLO across the folds was 82.6%, with a standard deviation of 0.88%. Compared to the accuracy of 84.1% when trained on the entire dataset, there was an improvement of 1.5%, indicating that training on a larger dataset can enhance the model’s accuracy. The average recall across the folds was 80.0%, with a standard deviation of 1.51%, while the recall when trained on the entire dataset was 80.1%, showing only a 0.1% improvement. This indicates that the recall of DM-YOLO is relatively stable across different data folds. The average mAP50 across the folds was 87.6%, with a standard deviation of 1.99%. The low standard deviation across folds suggests that the model’s performance variability on different data subsets is minimal, indicating high stability in DM-YOLO.
Fig. 7 compares the loss curves and performance metrics between the original YOLO model (a) and the improved DM-YOLO model (b) during training and validation. DM-YOLO exhibits superior performance in several aspects compared to the original YOLO. The bounding box regression loss (train/box_loss and val/box_loss) and classification loss (train/cls_loss and val/cls_loss) decrease more rapidly in the early stages of training and stabilize at lower values, indicating greater precision in both bounding box prediction and classification tasks. Additionally, the distributed focal loss decreases more quickly, leading to improved localization accuracy compared to YOLOv8.
Moreover, the precision and recall curves of DM-YOLO are smoother and the final values are significantly higher than those of the original YOLO model, demonstrating better precision and comprehensiveness in the object detection task. Particularly in the mAP50 and mAP50-95 metrics, the DM-YOLO curves rise faster and achieve higher final levels compared to the original model.
In summary, the improved DM-YOLO model shows better performance than YOLOv8 in terms of loss convergence speed, model stability, and object detection accuracy.
Fig. 10 demonstrates the enhanced performance of the DM-YOLO model in plant disease detection and algorithm comparison. Compared to the baseline YOLOv8 model, DM-YOLO shows higher accuracy and confidence in detecting powdery mildew and downy mildew. Notably, DM-YOLO excels in boundary box description and achieves higher confidence scores, enabling more precise identification of pest and disease features on leaves. This is because the AD-C2f module designed in this paper uses attention mechanisms and the designed ConvBlock module, which enhances the extraction of plant disease features while maintaining efficient computation, thereby improving the detection performance of plant diseases.
Additionally, the MultiCat module designed in this paper adopts multi-scale feature processing and fusion strategies to enhance the model’s ability to detect smaller pest and disease targets on plant leaves, while also integrating rich feature information from the backbone network, further improving plant disease detection performance. Moreover, the C2fe module designed in this paper introduces a global context module, enhancing feature representation capabilities through global context modeling and attention mechanisms, enabling the model to better capture inter-channel correlations, further enhancing feature representation capabilities, and thus improving plant disease detection performance. However, the improved algorithm in this paper may have lower detection effectiveness in nighttime or low-light environments compared to well-lit conditions.
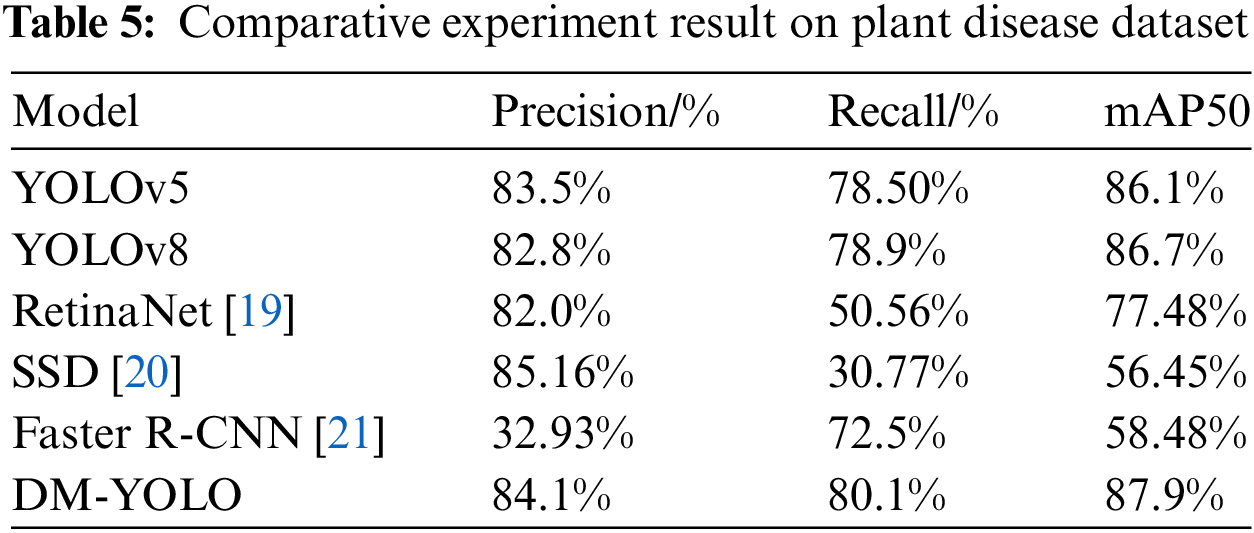
This paper conducted comparisons with other algorithms under the same environmental settings to evaluate the performance and versatility of several advanced object detection models in agricultural pest detection tasks. The traditional models tested in this study include Faster R-CNN, RetinaNet, and SSD, as well as YOLOv5, YOLOv8, and proposed DM-YOLO model. These models were tested on both the original self-built dataset and the PlantDoc dataset.
In the experiments conducted on the integrated dataset, as shown in Table 5, DM-YOLO demonstrated outstanding performance. The accuracy of DM-YOLO reached 84.1%, representing improvements of 0.6%p and 1.3%p over YOLOv5 and YOLOv8, respectively. Additionally, the recall rate and mAP50 of DM-YOLO were 80.1% and 87.9%, making it the top performer among all compared models. In contrast, RetinaNet achieved a recall rate and mAP50 of only 50.56% and 77.48%, while SSD’s recall rate and mAP50 were even lower at 30.77% and 56.45%. Particularly notable is Faster R-CNN, which, despite reaching a recall rate of 72.5%, had a mAP50 of only 58.48%, far behind DM-YOLO. These results highlight DM-YOLO’s superior stability and consistency across comprehensive evaluation metrics, especially under high recall and mAP50 requirements.
As seen in Table 6, the experiments on the PlantDoc dataset further confirm DM-YOLO’s leading position, with a mAP50 of 59.8%, outperforming YOLOv5 by 9.5%p and YOLOv8 by 3.2%p. Although DM-YOLO’s accuracy (51.5%) was slightly lower than that of YOLOv8 (55.3%), its overall performance was still superior to most other models. Compared to DM-YOLO, RetinaNet, and SSD showed slightly higher accuracy, but their recall rates and mAP50 were significantly lower, revealing a clear disadvantage. Particularly for Faster R-CNN, the mAP50 on the PlantDoc dataset was only 25.96%, much lower than DM-YOLO’s 58.9%. These findings further demonstrate that DM-YOLO achieves a better balance between precision and recall.

When handling tasks involving complex backgrounds and small object detection, DM-YOLO exhibited greater versatility and adaptability. The comparison results indicate that the DM-YOLO model outperforms existing mainstream detection algorithms in key performance indicators such as accuracy, recall, and mAP50, particularly in addressing diverse and challenging detection tasks.
Fig. 11 illustrates the performance of different object detection models in identifying leaf diseases. Faster R-CNN is capable of detecting a large number of diseased areas, but it exhibits a high false positive rate, particularly when identifying narrow-range lesions. This limitation could lead to significant misjudgments in pest detection tasks that require high precision. RetinaNet generates fewer detection boxes and shows higher accuracy in depicting actual diseased areas, yet it still suffers from missed detections. The SSD model performs poorly when identifying fine features. YOLOv8, while maintaining a large number of detection boxes, reduces the number of false positives, thereby improving the model’s accuracy. DM-YOLO’s results align closely with the ground truth, demonstrating significant improvements in accuracy and recall for small-scale target identification.

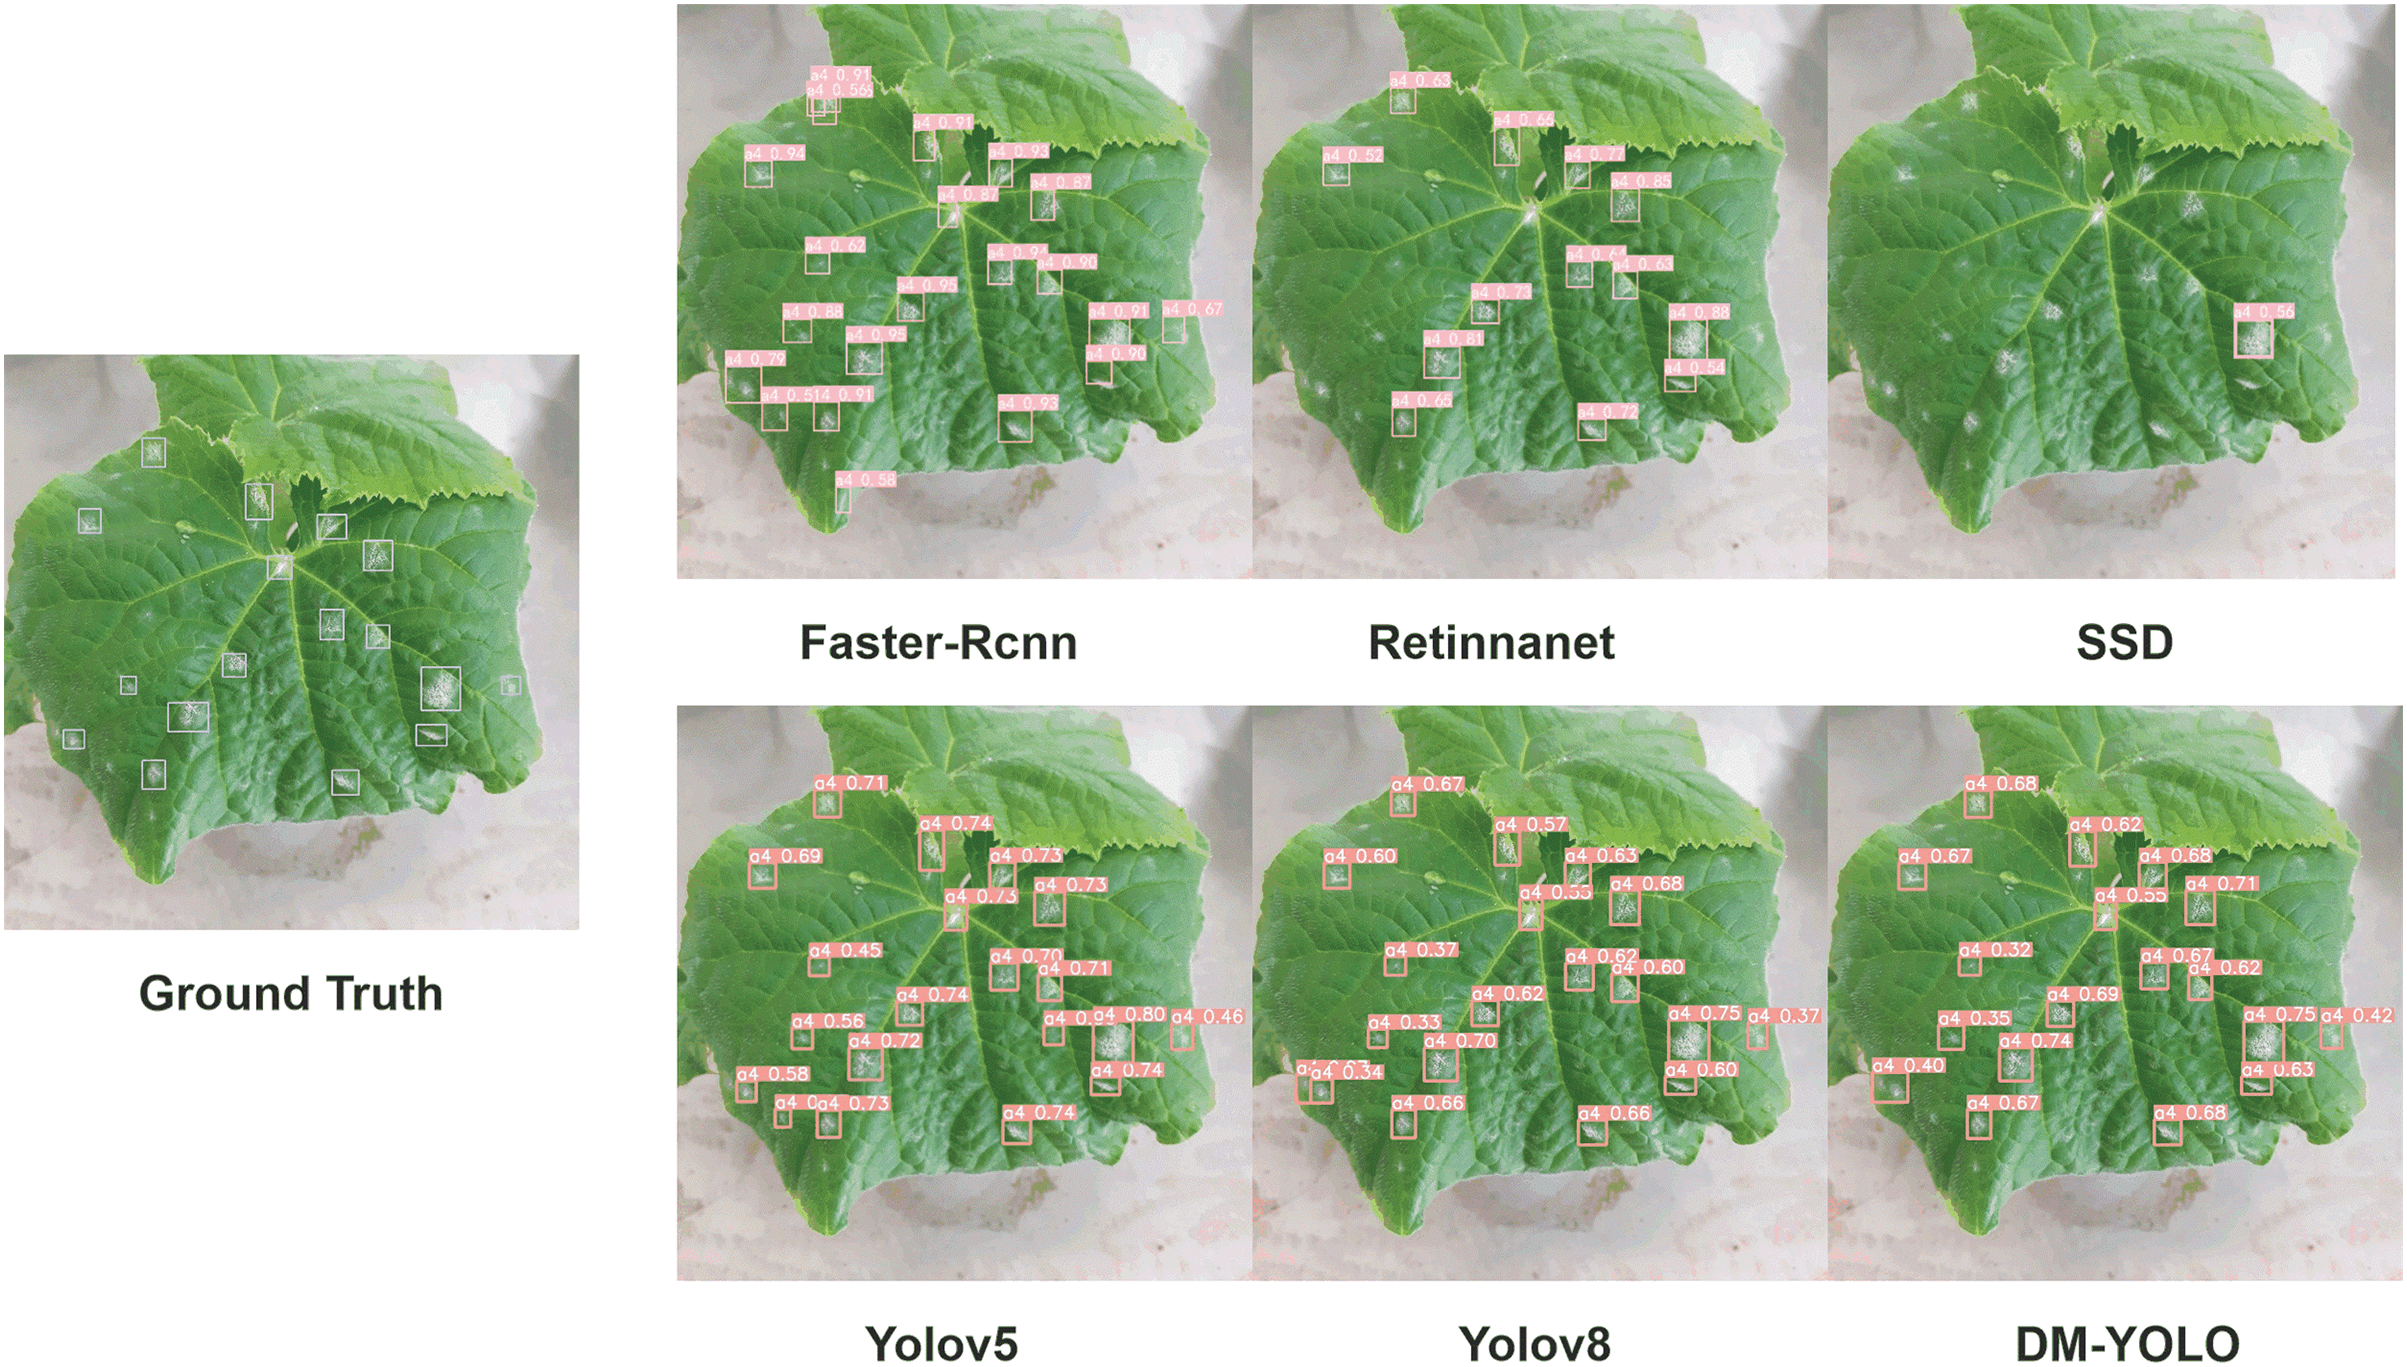
Figure 11: Comparative analysis of object detection models on leaf disease identification
Fig. 12 shows that DM-YOLO consistently exhibits superior detection performance across various leaf disease recognition tasks. Compared to other models, DM-YOLO’s detection results are closest to the ground truth, offering higher accuracy and stability, and significantly reducing false positives and missed detections. YOLOv8 also shows strong detection capability. While Faster R-CNN and SSD perform adequately in some tasks, they suffer from higher false positive and missed detection rates. RetinaNet performs relatively poorly across all tasks, with particularly noticeable missed detections. Overall, DM-YOLO delivers the best comprehensive performance, making it suitable for plant disease detection tasks that demand high precision.
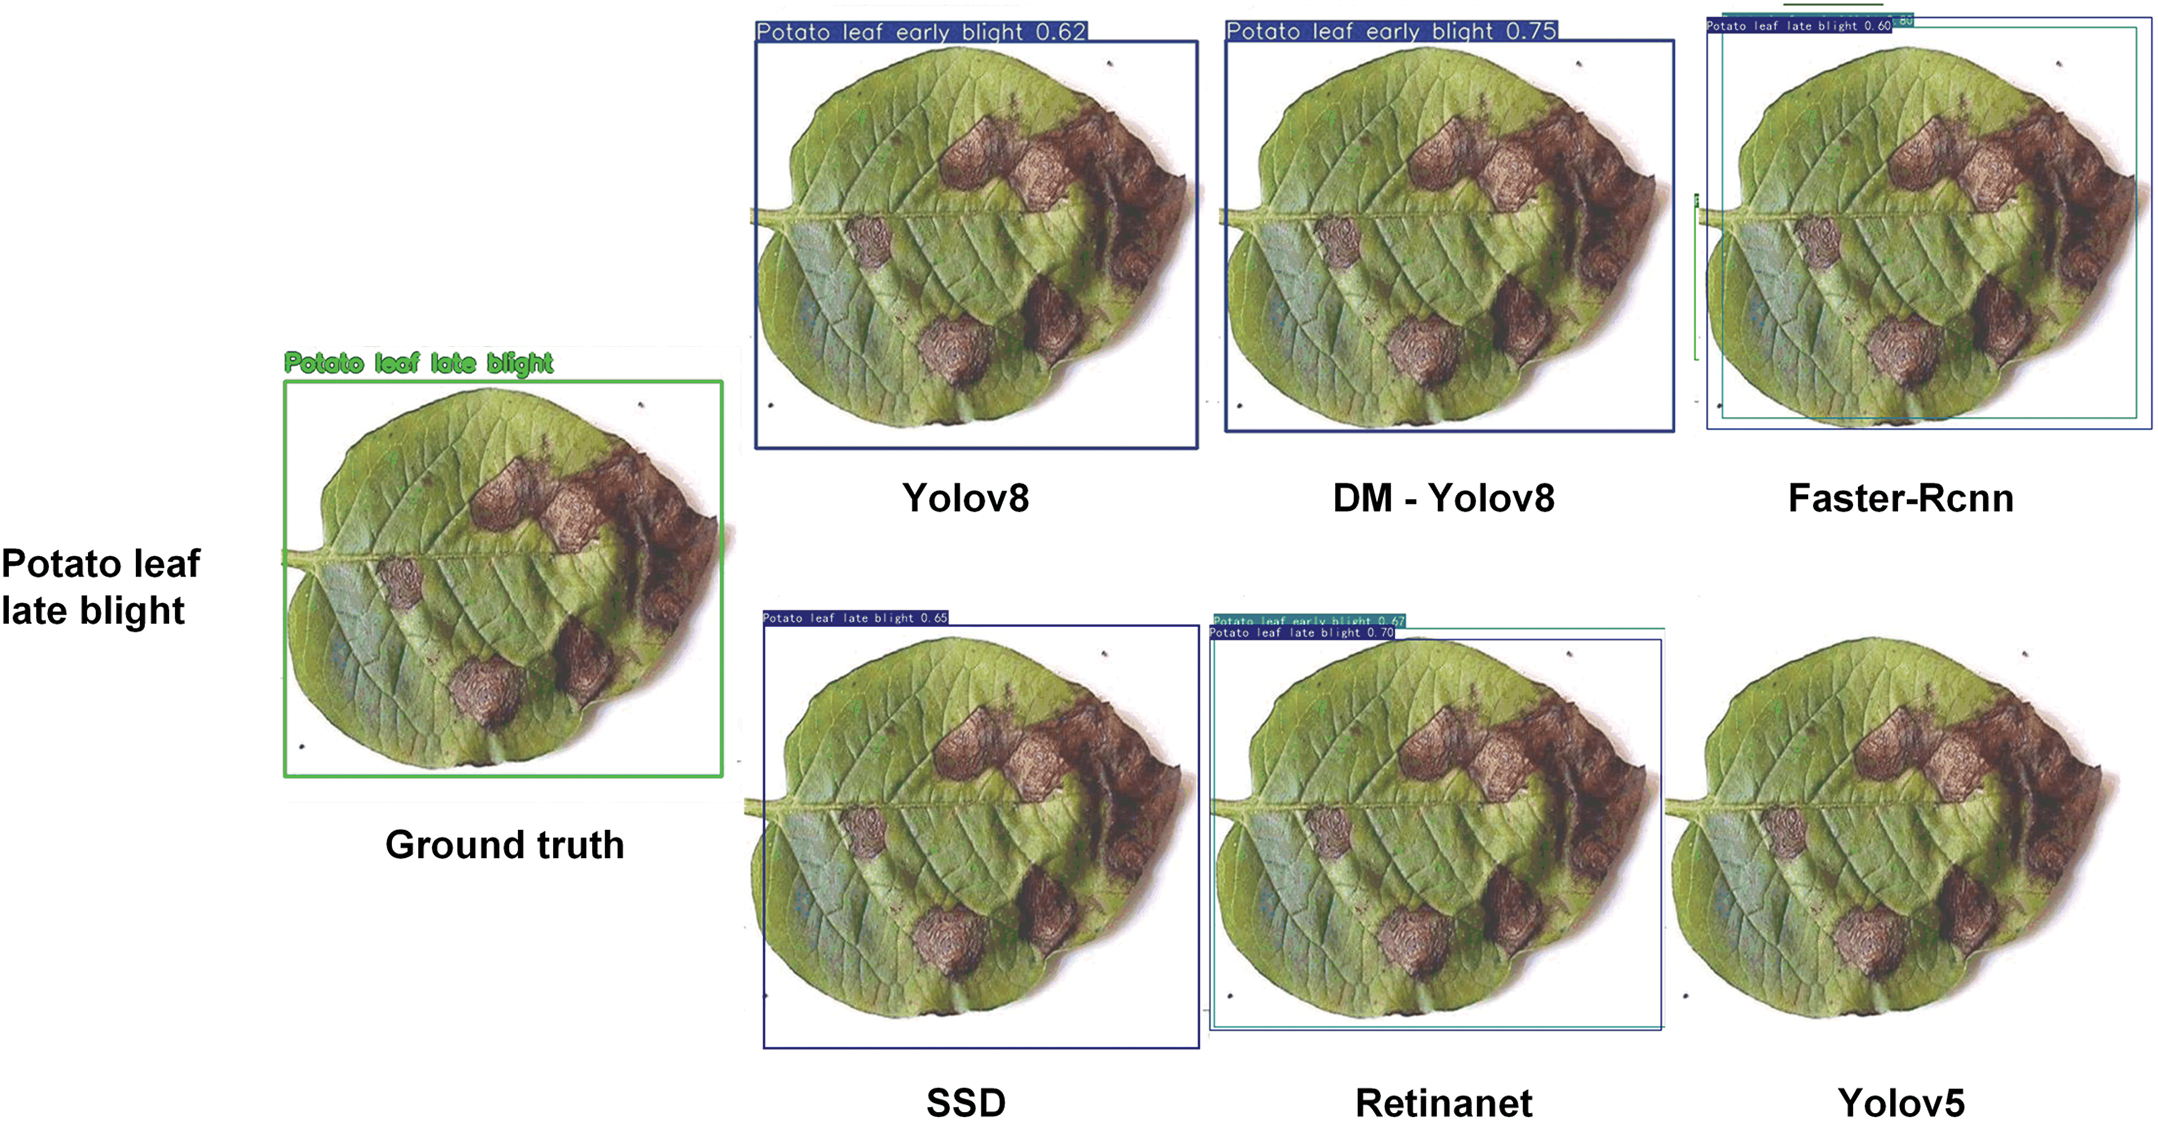
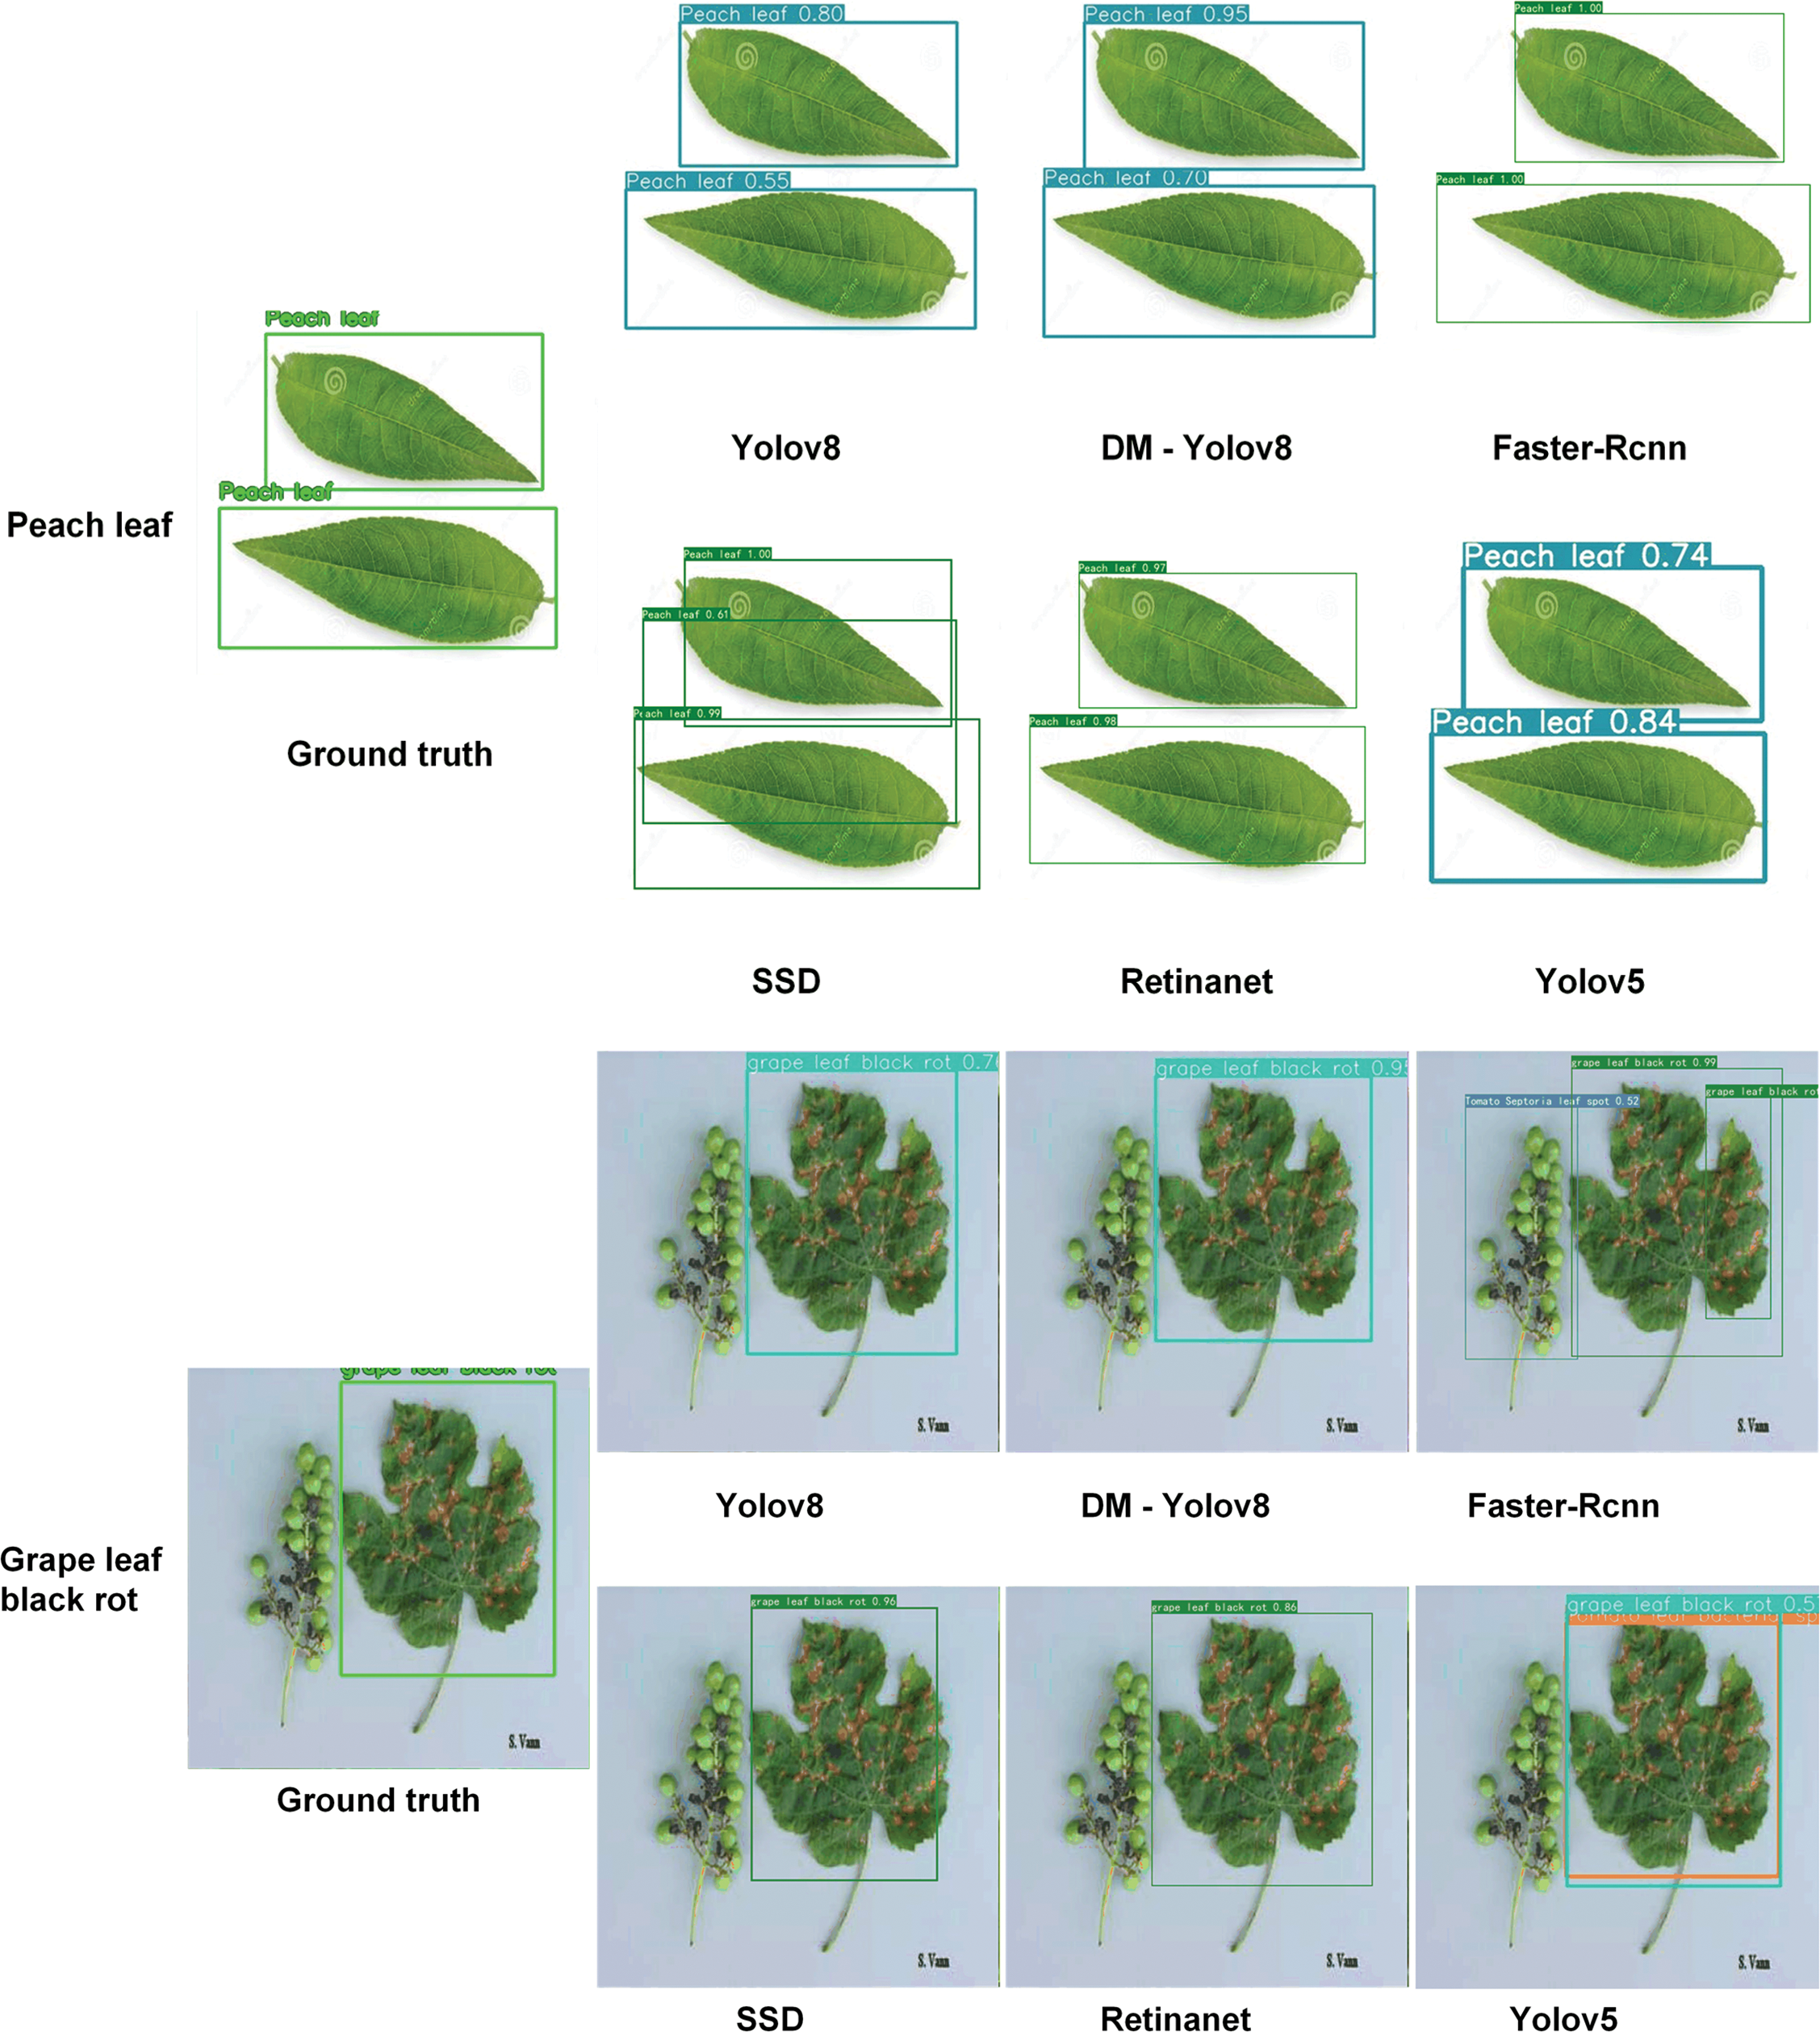
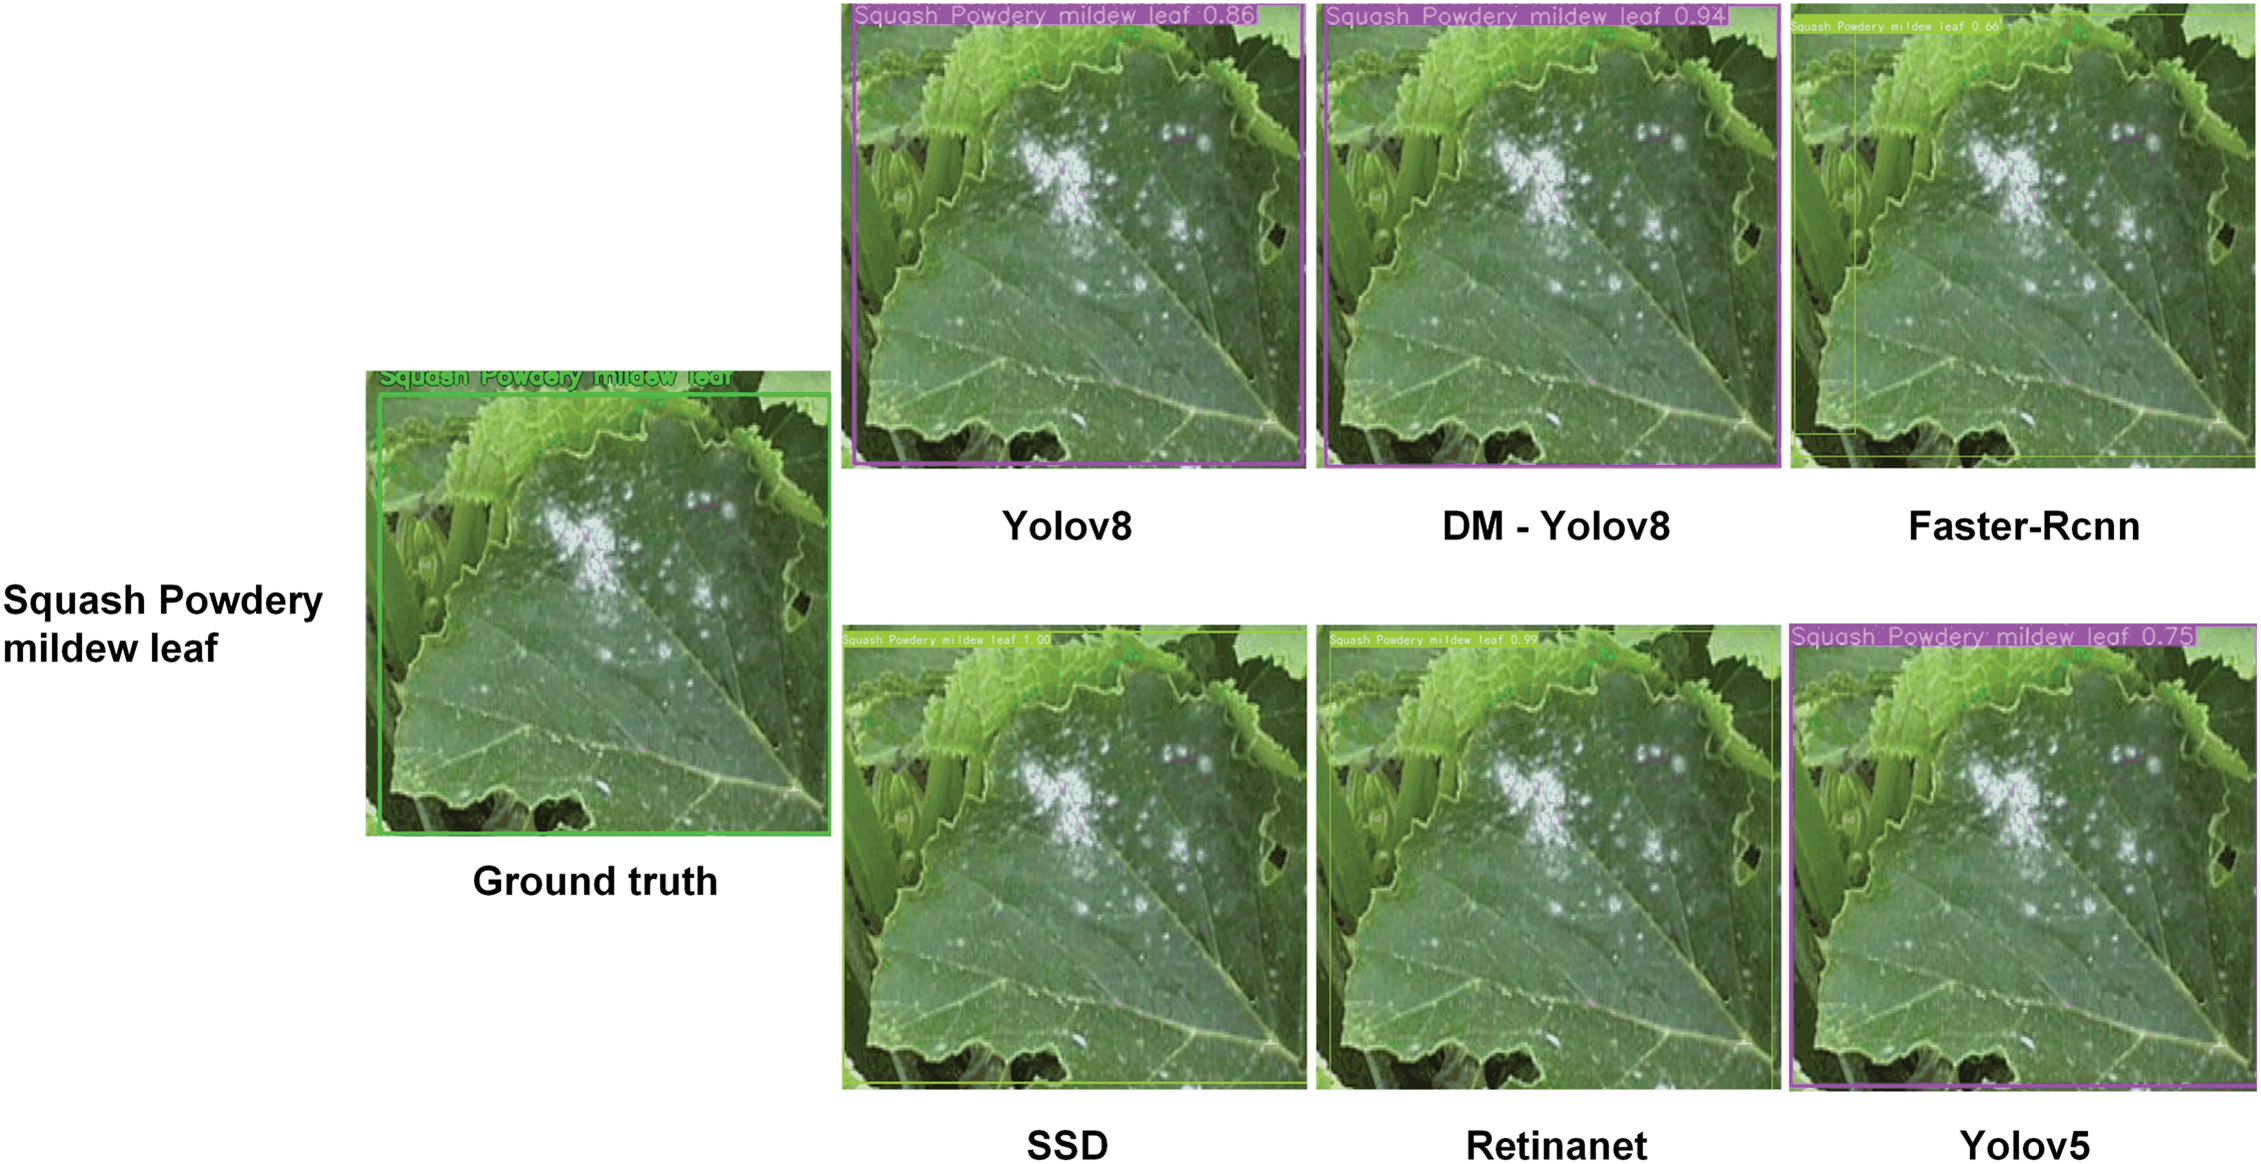
Figure 12: Comparative outcomes in detecting and recognizing leaf diseases
These comparative experiments highlight DM-YOLO’s excellent performance in detecting small targets and handling complex backgrounds. In some cases, the detection results show that our model almost eliminates missed detections. These results confirm the effectiveness and versatility of the DM-YOLO model.
3.5 Ablation Experiment and Result
To identify the contributions of various components within the enhanced YOLOv8 model, an ablation study was conducted. The purpose of this study was to isolate and evaluate the individual and combined impacts of the C2fe, AD-C2f, and MultiCat modules on the model’s performance. To ensure consistent comparisons, different variants of the model were evaluated on the same dataset, employing uniform training and validation procedures. By maintaining consistent hyperparameters and training conditions across all experiments, any observed performance changes can be confidently attributed to architectural modifications rather than external factors.
The results from the ablation studies, as shown in Tables 7 and 8, indicate that the MultiCat, C2fe, and AD-C2f modules each play a distinct role in improving model performance. The MultiCat module significantly enhances the model’s precision by improving the network’s focus on key features. For instance, on the Integrated Data on Plant Disease Induction dataset, the introduction of the MultiCat module alone increased precision from 82.8% to 83.0%. On the PlantDoc dataset, the MultiCat module increased precision to 56.8% and mAP50 to 59.8%.


The C2fe module, by optimizing the multi-scale feature fusion strategy, effectively improved both precision and recall rates. On the Integrated Data on Plant Disease Induction dataset, incorporating C2fe into the backbone network, which combines spatial attention mechanisms to enhance feature representation, raised precision to 83.9% and recall to 78.4%. On the PlantDoc dataset, when combined with other modules, the C2fe module increased recall to 60.5%.
Furthermore, the AD-C2f module, when introduced into the deeper layers of the backbone network to process high-level features, significantly boosted recall and mAP50. On the Integrated Data on Plant Disease Induction dataset, recall increased to 81.7%, and mAP50 reached 87.4%. Similarly, on the PlantDoc dataset, the AD-C2f module raised recall to 57.3% and mAP50 to 59.3%.
Moreover, when these modules were combined, the model’s performance improved even more significantly. On the Integrated Data on Plant Disease Induction dataset, the combination of the MultiCat and C2fe modules increased mAP50 to 87.2%, while the combination of C2fe and AD-C2f achieved the highest mAP50 of 87.4%. When all three modules were applied together, precision increased to 84.1%, recall reached 80.1%, and the final mAP50 was 87.9%. Similarly, on the PlantDoc dataset, the combination of C2fe and AD-C2f achieved the highest mAP50 of 60.0%. These results demonstrate that the combined use of these modules significantly improves the model’s precision, recall, and mAP50, highlighting a strong synergistic effect.
Heatmaps were generated using Gradient-weighted Class Activation Mapping (Grad-CAM) for both YOLOv8 and DM-YOLO models. These heatmaps visually and intuitively reflect which areas of the feature map the model is focusing on. Grad-CAM is a visualization technique used to interpret the decisions of Convolutional Neural Networks (CNNs). It works by leveraging the gradient information from the model’s output to create a heatmap that highlights the regions of the input image that contribute most to the prediction. Pixels with higher gradients in the feature map are represented by deeper red colors on the heatmap, while pixels with lower gradients are represented by deeper blue colors.
As depicted in Fig. 13, there is a distinct difference in the areas of focus between the YOLOv8 and DM-YOLO models when identifying leaf diseases. The heatmaps generated by the YOLOv8 model (column b) illustrate concentrated attention on specific regions of the leaf, particularly those with prominent color contrasts corresponding to diseased areas. However, this focused approach may limit the model’s ability to comprehensively assess the entire leaf, potentially leading to the omission of some disease-affected areas.
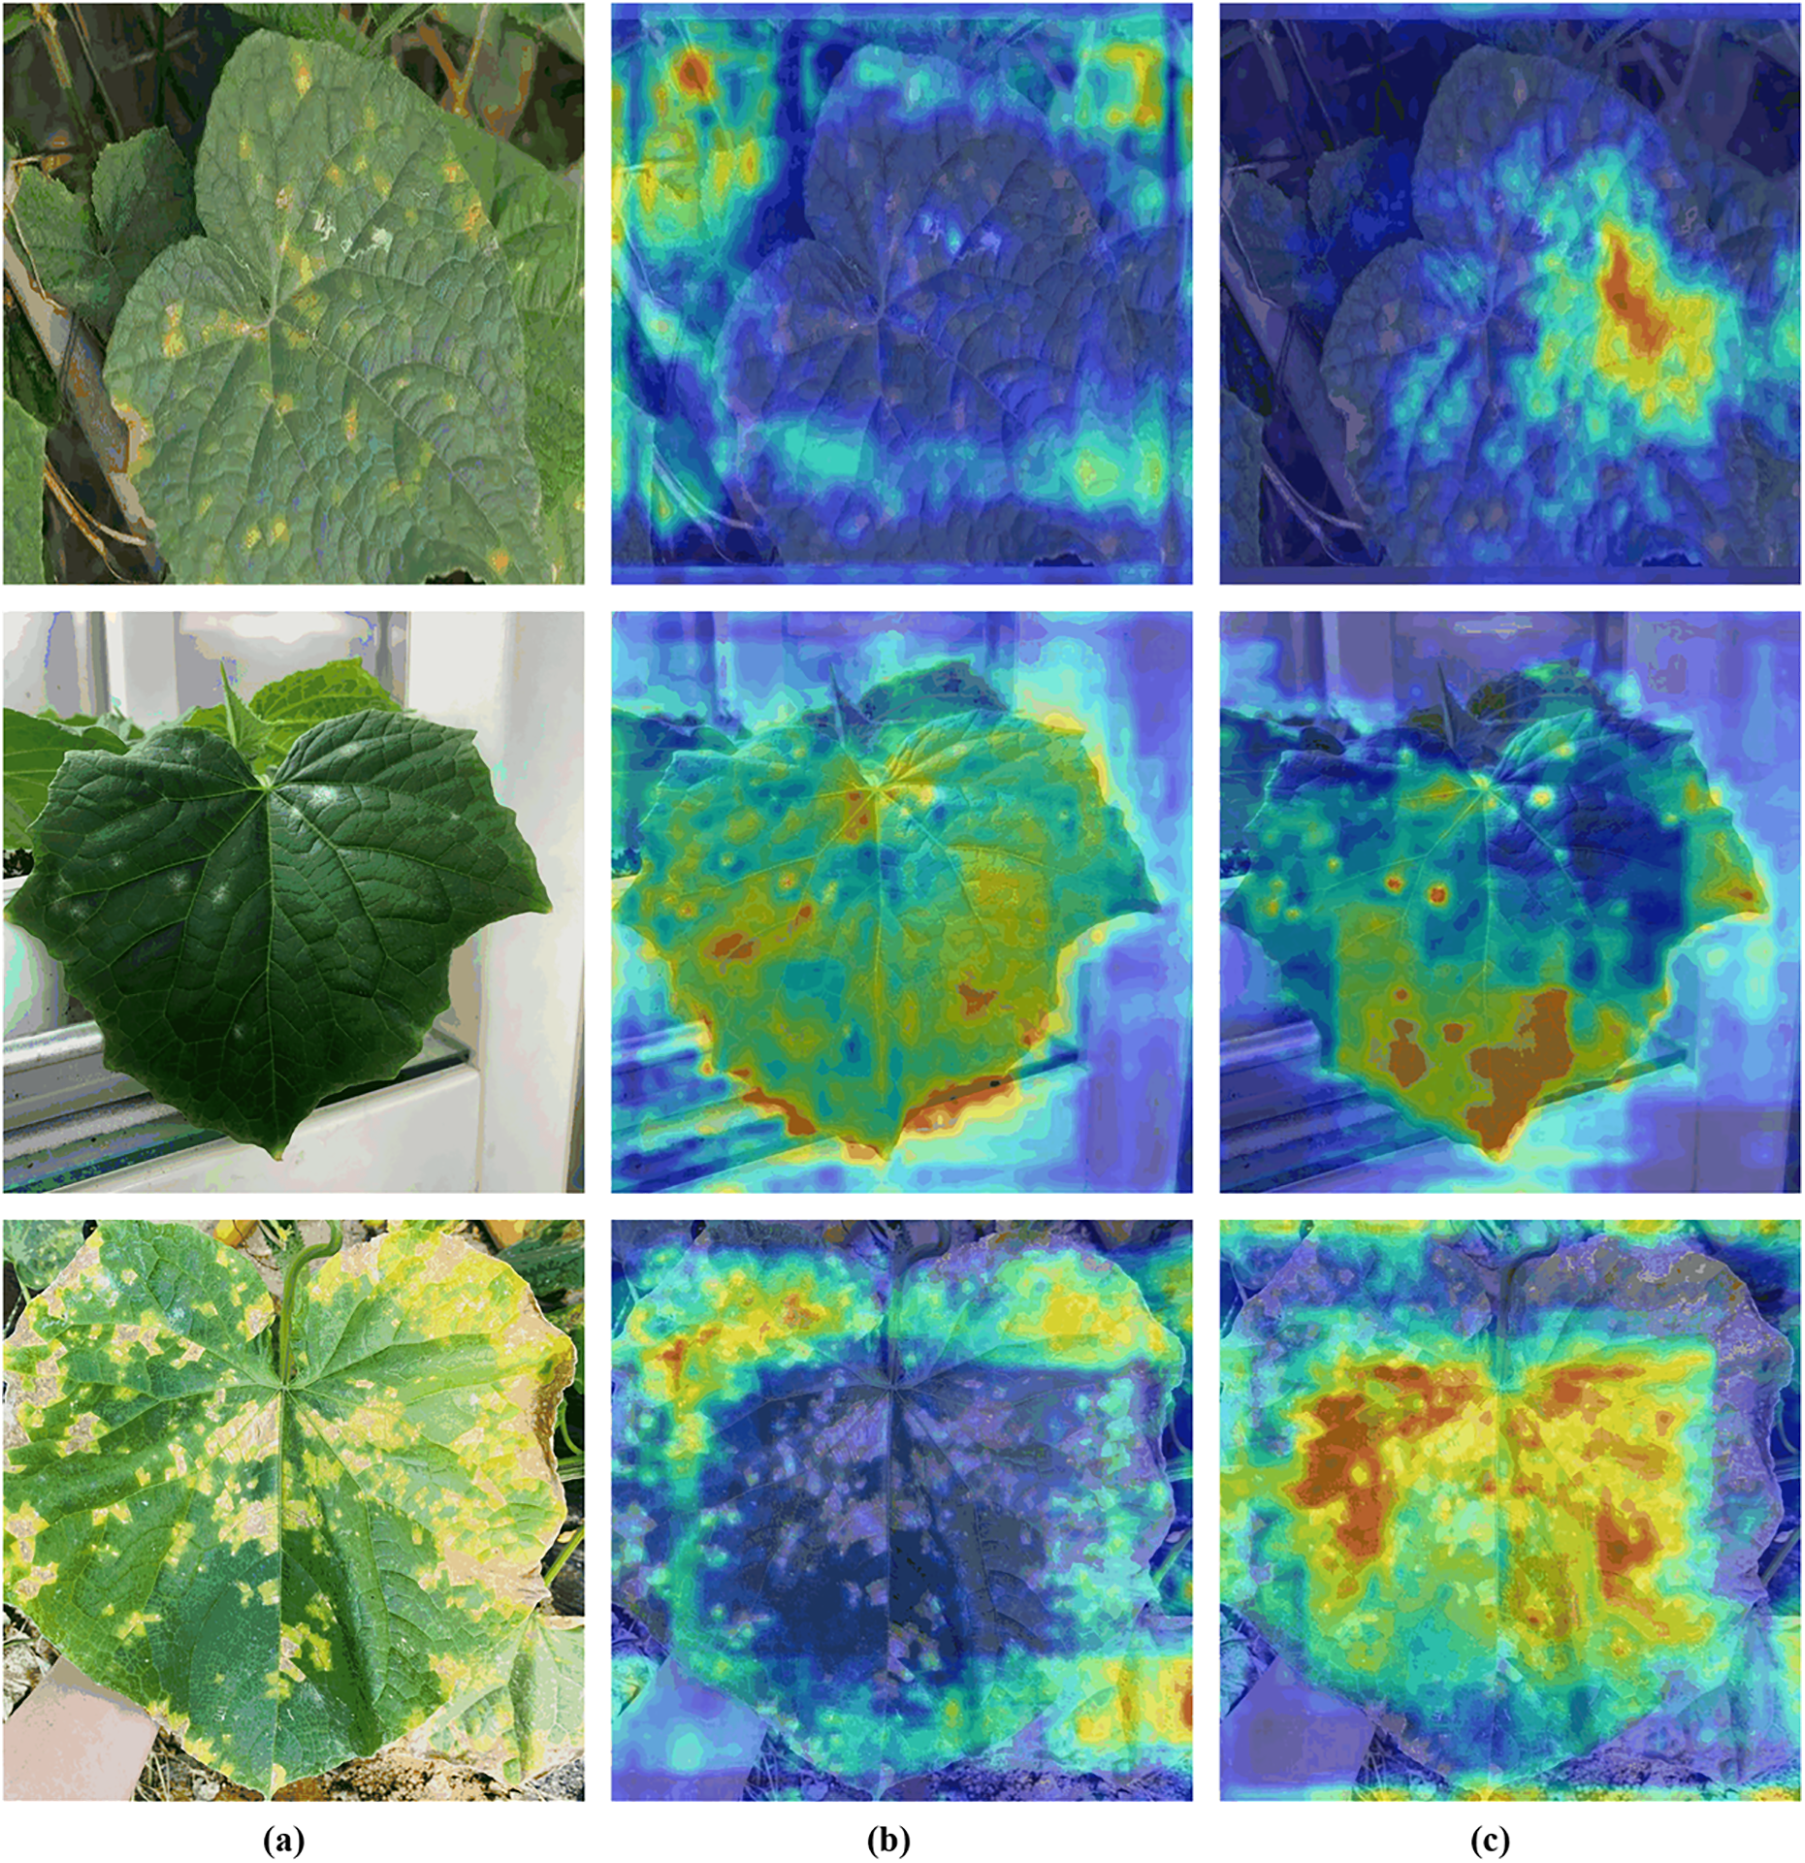
Figure 13: Visual comparison of Grad-CAM outputs. (a) Original images (b) heat maps of YOLOv8 (c) heat maps of our model
In contrast, the DM-YOLO model (column c) demonstrates a broader and more detailed focus across the leaf. The heatmaps indicate that DM-YOLO not only identifies the primary diseased regions but also detects additional subtle disease features spread across the leaf. This expanded attention enables DM-YOLO to capture a wider range of disease spots, thereby enhancing its accuracy and comprehensiveness in disease detection.
Thus, the comparative analysis of the heatmaps suggests that DM-YOLO exhibits superior performance in disease detection, as it effectively identifies a more extensive range of diseased areas, making it more robust in practical applications.
To address the challenges of environmental interference and low detection accuracy in cucumber disease identification, this paper proposes the DM-YOLO model. The model is specifically optimized for cucumber disease detection, with a focus on identifying downy mildew and powdery mildew. By leveraging multi-scale feature fusion and an enhanced spatial-channel attention module, DM-YOLO achieves significant improvements in both detection accuracy and efficiency. Extensive experiments conducted on a custom cucumber disease dataset and the PlantDoc dataset demonstrate that DM-YOLO outperforms the YOLOv8 model. The ablation study highlights the significant contributions of various modules, including C2fe, AD-C2f, and MultiCat, to the model’s performance. The outstanding performance of the DM-YOLO model across both datasets underscores its adaptability and robustness under various imaging conditions, making it a promising tool for automated plant health monitoring.
In the future, research will concentrate on including more intricate network architectures, such as self-attention mechanisms or graph neural networks, to enhance the model’s ability to detect diverse disease regions. We are looking to improve the accuracy and robustness of feature extraction by optimizing the hierarchical structure of the model. The model’s generalization ability will be enhanced by expanding the diversity of the training dataset to include more crop types and diseases. Also, the focus will be on studying model light weighting and real-time performance, employing model compression and pruning techniques to ensure efficient operation on resource-constrained devices. In the end, we will examine the potential uses of DM-YOLO in different agriculture situations, such as detecting pests and monitoring crop growth.
Acknowledgement: This result was supported by “Regional Innovation Strategy (RIS)” through the National Research Foundation of Korea (NRF) funded by the Ministry of Education (MOE). This work was supported by the Institute of Information & Communications Technology Planning & Evaluation (IITP)-Innovative Human Resource Development for Local Intellectualization program grant funded by the Korea government (MSIT). This work was supported by the “Development and Demonstration of AI Services for Manufacturing Industry Specialization” grant funded by the Korea government (The Ministry of Trade, Industry and Energy).
Funding Statement: This result was supported by “Regional Innovation Strategy (RIS)” through the National Research Foundation of Korea (NRF) funded by the Ministry of Education (MOE) (2021RIS-003).
Author Contributions: The authors confirm contribution to the paper as follows: study conception and design: Ji-Yuan Ding and Wang-Su Jeon; data collection: Ji-Yuan Ding and Wang-Su Jeon; analysis and interpretation of results: Ji-Yuan Ding, Wang-Su Jeon and Sang-Yong Rhee; draft manuscript preparation: Ji-Yuan Ding, Wang-Su Jeon and Chang-Man Zou; manuscript final layout and preparation for submission: Ji-Yuan Ding, Wang-Su Jeon, Sang Yong Rhee and Chang-Man Zou. All authors reviewed the results and approved the final version of the manuscript.
Availability of Data and Materials: The original contributions presented in the study are included in the article, further inquiries can be directed to the corresponding authors.
Ethics Approval: Not applicable.
Conflicts of Interest: The authors declare no conflicts of interest to report regarding the present study.
References
1. J. E. Staub, M. D. Robbins, and T. C. Wehner, “Cucumber,” in Vegetables I: Asteraceae, Brassicaceae, Chenopodicaceae, and Cucurbitacea, Prohens, J. Nuez, Ed. New York, USA: Springer, 2008, pp. 241–282. [Google Scholar]
2. M. Rur, B. Ramert, M. Hokeberg, R. R. Vetukuri, and L. Grenville-Briggs, “Screening of alternative products for integrated pest management of cucurbit powdery mildew in Sweden,” Eur. J. Plant. Pathol., vol. 150, no. 1, pp. 127–138, Jan. 2018. doi: 10.1007/s10658-017-1258-x. [Google Scholar] [CrossRef]
3. C. Cortes and V. Vapnik, “Support-vector networks,” Mach. Learn., vol. 20, no. 3, pp. 273–297, 1995. doi: 10.1007/BF00994018. [Google Scholar] [CrossRef]
4. L. Breiman, J. Friedman, R. Olshen, and C. Stone, Classification and Regression Trees. Belmont, CA, USA: Wadsworth, 1984. [Google Scholar]
5. T. Abeywickrama, M. A. Cheema, and D. Taniar, “k-Nearest neighbors on road networks: A journey in experimentation and in-memory implementation,” vol. 9, no. 6, pp. 492–503, Aug. 2016. doi: 10.14778/2904121.2904125. [Google Scholar] [CrossRef]
6. M. A. Ebrahimi, M. H. Khoshtaghaza, S. Minaei, and B. Jamshidi, “Vision-based pest detection based on SVM classification method,” Comput. Electron. Agric., vol. 137, no. 2, pp. 52–58, May 2017. doi: 10.1016/j.compag.2017.03.016. [Google Scholar] [CrossRef]
7. Z. Xu et al., “BP neural networks and random forest models to detect damage by Dendrolimus punctatus Walker,” J. Forestry Res., vol. 31, no. 8, pp. 107–121, Nov. 2020. doi: 10.1007/s11676-018-0832-1. [Google Scholar] [CrossRef]
8. M. Turkoglu and D. Hanbay, “Plant disease and pest detection using deep learning-based features,” Turkish J. Elect. Eng. Comput. Sci., vol. 27, no. 3, pp. 1636–1651, May 2019. doi: 10.3906/elk-1809-181. [Google Scholar] [PubMed] [CrossRef]
9. F. M. Firnando, D. R. I. M. Setiadi, A. R. Muslikh, and S. W. Iriananda, “Analyzing inceptionV3 and InceptionResNetV2 with data augmentation for rice leaf disease classification,” J. Future Artif. Intell., vol. 1, no. 1, pp. 1–11, 2024. doi: 10.62411/faith.2024-4. [Google Scholar] [CrossRef]
10. S. Liu, B. Hu, and C. Zhao, “Detection and identification of cucumber leaf diseases based improved YOLOv7,” Transact. Chinese Soc. Agric. Eng., vol. 39, pp. 164–172, 2023. doi: 10.11975/j.issn.1002-6819.202305042. [Google Scholar] [CrossRef]
11. G. Yang et al., “A lightweight YOLOv8 tomato detection algorithm combining feature enhancement and attention,” Agronomy, vol. 13, no. 7, Jul. 2023, Art. no. 1824. doi: 10.3390/agronomy13071824. [Google Scholar] [CrossRef]
12. R. K. Rachman, D. R. I. M. Setiadi, A. Susanto, K. Nugroho, and H. M. M. Islam, “Enhanced vision transformer and transfer learning approach to improve rice disease recognition,” J. Comput. Theor. Appl., vol. 1, no. 4, pp. 446–460, 2024. doi: 10.62411/jcta.10459. [Google Scholar] [CrossRef]
13. G. Jocher, A. Chaurasia, J. Qiu, and N. Stoken, “YOLOv5,” GitHub Repository, 2020. Accessed: Oct. 24, 2024. [Online]. Available: https://github.com/ultralytics/yolov5 [Google Scholar]
14. D. Singh et al., “PlantDoc: A dataset for visual plant disease detection,” 2019. doi: 10.48550/arXiv.1911.10317. [Google Scholar] [CrossRef]
15. C. Feng et al., “TOOD: Task-aligned one-stage object detection,” Aug. 2021. doi: 10.48550/arXiv.2108.07755. [Google Scholar] [CrossRef]
16. X. Li et al., “Generalized focal loss: Learning qualified and distributed bounding boxes for dense object detection,” 2020. doi: 10.48550/arXiv.2006.04388. [Google Scholar] [CrossRef]
17. C. Y. Wang, A. Bochkovskiy, and H. Y. M. Liao, “YOLOv7: Trainable bag-of-freebies sets new state-of-the-art for real-time object detectors,” 2022. doi: 10.48550/arXiv.2207.02696. [Google Scholar] [CrossRef]
18. Y. Cao et al., “GCNet: Non-local networks meet squeeze-excitation networks and beyond,” in Proc. IEEE/CVF Int. Conf. Comput. Vis. (ICCV) Workshops, Venice, Italy, Oct. 22–29, 2017, pp. 618–626. [Google Scholar]
19. T. -Y. Lin et al., “Focal loss for dense object detection,” 2017. doi: 10.48550/arXiv.1708.02002. [Google Scholar] [CrossRef]
20. W. Liu et al., “SSD: Single shot multibox detector,” 2016. doi: 10.1007/978-3-319-46448-0. [Google Scholar] [CrossRef]
21. S. Ren, K. He, R. Girshick, and J. Sun, “Faster R-CNN: Towards real-time object detection with region proposal networks,” 2015. doi: 10.48550/arXiv.1506.01497. [Google Scholar] [CrossRef]
Cite This Article
 Copyright © 2024 The Author(s). Published by Tech Science Press.
This work is licensed under a Creative Commons Attribution 4.0 International License , which permits unrestricted use, distribution, and reproduction in any medium, provided the original work is properly cited.
 Downloads
 Citation Tools