
 Submit a Paper
 Propose a Special lssue
 Open Access
ARTICLE

Dual-Modal Drowsiness Detection to Enhance Driver Safety
Faculty of Information Science and Technology, Multimedia University, Ayer Keroh, Melaka, 75450, Malaysia
* Corresponding Author: Siti Fatimah Abdul Razak. Email:
Computers, Materials & Continua 2024, 81(3), 4397-4417. https://doi.org/10.32604/cmc.2024.056367
Received 21 July 2024; Accepted 10 October 2024; Issue published 19 December 2024
 View Full Text
 Download PDF
Abstract
In the modern world, the increasing prevalence of driving poses a risk to road safety and necessitates the development and implementation of effective monitoring systems. This study aims to enhance road safety by proposing a dual-modal solution for detecting driver drowsiness, which combines heart rate monitoring and face recognition technologies. The research objectives include developing a non-contact method for detecting driver drowsiness, training and assessing the proposed system using pre-trained machine learning models, and implementing a real-time alert feature to trigger warnings when drowsiness is detected. Deep learning models based on convolutional neural networks (CNNs), including ResNet and DenseNet, were trained and evaluated. The CNN model emerged as the top performer compared to ResNet50, ResNet152v2, and DenseNet. Laboratory tests, employing different camera angles using Logitech BRIO 4K Ultra HD Pro Stream webcam produces accurate face recognition and heart rate monitoring. Real-world vehicle tests involved six participants and showcased the system’s stability in calculating heart rates and its ability to correlate lower heart rates with drowsiness. The incorporation of heart rate and face recognition technologies underscores the effectiveness of the proposed system in enhancing road safety and mitigating the risks associated with drowsy driving.Keywords
In the 21st century, the increasingly common drowsiness driving poses a threat to road safety and requires the development and implementation of effective monitoring systems. The recent statistics reveal a worrying trend, showing that drowsiness is a leading cause of traffic accidents [1]. Not only that, but drunk driving was also a concern because of its incidence and high fatality rate [2]. Studies also show that 26.5% of all traffic accidents were caused by sleep-deprived driving [3]. The shocking number of deaths and injuries highlights the urgent need for surveillance technology and proactive measures to combat the growing risks associated with driving.
Most researchers focused on either drowsiness or heart rate detection for facial expression detection, and rarely combined these two detection functions in a single system. Coupled with the inherent limitations of possible emotional concealment and external interference, traditional facial expression analysis methods for unimodal detection were unable to measure a driver’s driving condition. These methods often fail to account for the complexity and variability in physiological signals when training and testing are insufficient. Specifically, improper training can lead to the model not adequately learning the subtle variations in both facial expressions and heart rate that signal drowsiness. Without sufficient training data that reflects different real-world conditions, the model struggles to generalize effectively [4,5]. In particular, the success of these training stages is critical to the suggested integration of heart rate and facial expression recognition, which is enabled by a pre-trained model. Similarly, insufficient testing may prevent the system from being evaluated under different practical conditions, leaving gaps in its reliability and accuracy [6,7]. Thorough testing is necessary to ensure the system performs accurately across different environments and driver states, validating its robustness for real-world application.
Real-time interventions, which were critical to addressing immediate risks, were often lacking in current driver monitoring systems [8]. Drowsy drivers require external interventions to alert drivers to stay awake or take countermeasures while driving [9]. Safe driving can be defined as when drivers are fully alert, focused, and capable of operating their car safely without endangering others or themselves. Drivers must remain alert, avoid distractions [10], and address issues such as fatigue or drowsiness that may interfere with the ability to drive safely. Detecting driver status by examining physiological indicators and facial expressions is essential for ensuring road safety and preventing accidents caused by reduced alertness [11]. There is an urgent need for accurate drowsy detection methods. Moreover, physiological parameter monitoring, particularly heart rate, is a valuable tool for learning about a driver’s physical and mental health and for constructing a thorough picture of the driver’s overall status [12]. Facial expression recognition also adds another level to deciphering a driver’s emotional and cognitive state. This includes identifying drowsiness indicators like yawning, blinking frequently, and closing of the eyes [13].
Given the situation, this study fills the gap by focusing on the practical implementation of a real-time alert system. This study addresses the shortcomings of unimodal methods and proposes a dual model that integrates heart rate readings and facial expression analysis, aiming to develop a more comprehensive method for detecting driver drowsiness. By combining heart rate and facial expression analysis, the system will autonomously trigger warnings to provide timely interventions to reduce the potential risks associated with drowsy drivers, hence, significantly improve overall driving safety using a non-invasive method to detect driver drowsiness.
The following sections present related work on heart rate detection and facial expression recognition methods which are present in the literature for drowsiness detection. In addition, combined models are also included. Section 3 presents the methodology applied in this study, followed by Section 4 which describes the system development. Section 5 explains the experimental results and analysis while the final section concludes the outcomes of this study.
Ramzan et al. [14] reviewed the drowsiness detection techniques and classified the techniques into 3 main categories based on the parameters, i.e., behavioral, vehicular, and physiological. Another category known as hybrid techniques was added by Hussein et al. [15]. This section provides related articles on advanced driver monitoring technologies, with a particular focus on heart rate recognition and facial expression analysis. The research ranges from traditional photoplethysmography to cutting-edge remote photoplethysmography, focusing on the evolution of non-invasive physiological monitoring. In these studies, research on image classification algorithms and neural networks revealed the complexity of achieving accurate driver monitoring. Notably, the articles considered for this exploration were taken from publications from the calendar years 2019 to 2023, obtained through Google Scholar and Mendeley. Keywords such as heart rate, facial expression, rPPG, and CNN were used during the search.
2.1 Heart Rate Detection Methods
There has been considerable innovation for the purpose of heart rate detection and heart rate (HR) monitoring among drivers. For instance, the Japanese Pioneer Corporation has produced a wearable heart rate detection system for drivers. However, the wearable device does not provide a pleasant driver experience [16]. Thus, a study emphasized the growing importance of monitoring driver status in smart vehicles considering the increasing amount of time people spend in them [17].
Moreover, recognizing that heart rate (HR) is an important physiological indicator for assessing driver status [18]. For instance, heart rate was used for early detection of fatigue and drowsiness [19]. The traditional Electroencephalography (EEG) method can also be utilized to distinguish between alert and sleepy states. Their proposed method uses a support vector machine classifier and demonstrates the potential of single-electrode EEG-based sleepiness detection with 78.3% accuracy. This method focuses on short duration daytime naps and successfully identifies alert and drowsy states by extracting informative features [20].
In 2023, R-R Interval-based electrocardiography (RRI-based ECG) drowsiness detection method that utilized an anomaly detection algorithm with a self-attentive autoencoder was proposed and achieved promising results. In an experiment, the method achieved 88% sensitivity and successfully detected 16 out of 18 sleep-related events that occurred during driving. In addition, the false positive rate of 0.60 events per hour was very low. As part of the research validation process, the technology was tested on 18 middle-aged professional drivers, confirming its potential as a reliable method of stopping sleepy driving from causing accidents. The method demonstrates how anomaly detection techniques and RR Interval (RRI) data can be effectively utilized for reliable driver drowsiness detection to improve road safety [21].
In the biomedical field, photoplethysmography (PPG) is an important component of infrared non-destructive testing technology, which detects changes in the absorption of reflected light by body tissues and blood to calculate the heart rate based on the acquired pulse waveform [22]. Earlier, a survey done by Pilz et al. [12] focused on the use of PPG and algorithms such as Independent Component Analysis (ICA), Singular Spectrum Reconstruction (SSR), and diffusion processes. The authors highlighted the challenges of ICA in maintaining accurate heart rate readings, while SSR demonstrated sharper head motion during frequency trajectories, but still fall short compared to robust diffusion process models. Notably, the diffusion process consistently provided clear heart rate readings throughout the head movement sequence, showing it to be superior to both ICA and SSR. In this article, it highlights the potential importance of models of diffusion processes for applications that rely on accurate physiological monitoring by emphasizing stability and adaptability to disturbances.
However, Liu et al. [18] critically evaluated existing methods to recognize heart rate, revealing limitations associated with dedicated sensors based on the traditional Photoplethysmography (PPG) method. The introduction of tree-based probabilistic fusion neural network (TPFN) algorithms and facial expression-based methods represent a shift from traditional sensor-dependent methods to a more friendly and efficient paradigm. Their results not only outperform consumer smartwatches in outlier detection for heart rate variability measurements, but also significantly improve the equalization accuracy, exemplifying the potential advancement of innovative algorithmic approaches for heart rate variability estimation.
Babusiak et al. [19] integrated the ECG and PPG sensors into steering wheels along with inertial units that can measure important health metrics such as heart rate, heart rate variability, and oxygen saturation. The platform created has demonstrated its utility in identifying specific cardiac conditions and drowsiness in both laboratory and real-world environments.
In recent years, remote photoplethysmography (rPPG) has attracted attention for its ability to measure heart rate remotely without physical contact. The rPPG captures the colour changes reflected on the skin by using the sensor of the camera [23]. Reference [24] mentioned that rPPG is using a camera to detect variations, in the reflection of green and blue light, on the skin. Unlike conventional techniques, rPPG records blood volume pulse by tracking changes in skin reflectance through a camera [25]. Building on this novel strategy, recent studies have examined the benefits and outcomes of rPPG, including those by [24] and [25]. This method has several advantages, highlighted by its non-invasiveness and convenience. Its performance is comparable to more established technologies such as ECG, EEG and PPG. rPPG’s ability to measure heart rate remotely underscores its potential to revolutionize physiological monitoring, providing a more practical and easier-to-use alternative to traditional contact methods.
2.2 Facial Expression Recognition Methods
In this section, the methods and algorithms proposed by previous work which successfully interpreted and recorded human facial expressions while driving were examined. In general, drowsiness can be indicated by physiological markers such as heart rate, brain signals, and pulse [26]. Another method is using the sensors on the gas pedal and steering wheel. The third method is to use facial expressions, utilizing metrics such as yawning, blinking frequency and eye closure.
The Convolutional Neural Networks (CNNs) method is used for image classification. Jeon et al. [11] proposed a new technique to recognize drowsy driving using vehicle sensor data from pedal pressure and steering wheel. They provide an ensemble CNN model for accurate detection and categorize drowsy driving into long and short duration. The model had an amazing accuracy of 94.2%. The study used a variety of driving simulation data to analyze the characteristics of drowsy driving and proposed a novel detection method. The excellent performance of the ensemble CNN validates the utility of the proposed features and unbalanced data processing techniques.
Xiong et al. [27] utilized Densely Connected Convolutional Networks (DenseNet), one of the CNN model representatives in their study. Furthermore, Bidirectional Long-Short-Term Memory Recurrent Neural Network models (BiLSTM-RNN) and Long-Short-Term Memory Recurrent Neural Network models (LSTM-RNN) were included. The results highlight the lack of a universally applicable solution for all data streams and highlight the significance of sequence-awareness (LSTM and BiLSTM) and feature-reuse (DenseNet) in particular scenarios. Interestingly, the study shows that image representation has a major influence on validation accuracy, supporting the idea that appropriate representations should be considered when driving.
Similarly, Face2Multi-modal, an in-car multimodal state estimator under development that uses facial expressions for driver estimation, was proposed by Huang et al. [13]. The prototype uses the Densely Connected Convolutional Networks (DenseNet) model to estimate skin conductance, heart rate, and vehicle speed. According to preliminary findings, the accuracy for skin conductance, vehicle speed, and heart rate is 83.78%, 59.89%, and 58.60%, respectively. To improve accuracy, the study proposes incorporating temporal information and modifying the neural network model (possibly using recurrent neural network layers), despite limitations in the BROOK database, such as unprocessed facial captures and lighting differences. Face2Multi-modal holds promise for multimodal insights into driver physiological states, even though it is not yet at a commercially viable level.
According to Jeyasekar et al. [26], the Residual Networks with 50 layers (ResNet50) model outperformed AlexNet and VGGNet, with an error rate of 8% for the top five over 15 calendar cycles, compared to AlexNet’s accuracy of 10.38%. Compared to AlexNet and VGGNet, the authors chose the Convolutional Neural Network (CNN) ResNet because of its ability to smoothly pass the output to the next stage, thus improving the efficiency of detecting driver drowsiness.
In more recent work, Kim et al. [16] proposed a customized VGG19 for facial expression recognition but not specific to drivers. The customized model has a more complex structure since it adopts the conventional VGG, Inception-v1, ResNet, and Xception designs for training large data samples, i.e., up to 15,000. Experimental results show that the customized VGG19 performed better than the other conventional methods on five different datasets including the FER 2013 dataset, RAF dataset, FERG-DB dataset, AffectNet dataset, and a merged dataset.
2.3 Combination of Methods for Driver Drowsiness Detection
Murugan et al. [28] mentioned that drowsiness does not appear immediately, but is accompanied by some symptoms, such as inability to concentrate and reduced alertness. Hence, previous work also considered different approach to fill the gap. Zou et al. [22] utilized the principles of photoplethysmography (PPG) to demonstrate real-time monitoring of key physiological parameters, including heart rate (HR) and blood oxygen saturation (SpO2). In addition, the research incorporates a neural network to recognize the driver’s facial expressions. The OpenCV library was also used for surface detection and customization. The normalized signals were processed using the JADER algorithm and noise was removed using independent component analysis (ICA). In summary, the authors utilized the PPG principle to achieve real-time monitoring of physiological parameters such as HR and SpO2. Simultaneous facial expression recognition enhanced the monitoring of physiological parameters. Their experimental results demonstrate the high accuracy of their method.
In another study, Du et al. [29] aimed to improve the way games optimize users’ entertainment and learning experiences by understanding their reactions. Among the methods that rely on physiological signals, the authors proposed a different approach that utilizes heart rate (HR) signals and facial expressions (FE) to detect emotions. Heart rate and facial expression detection is achieved by analyzing videos captured by Kinect 2.0, thus ensuring that the measurement process is temporal and non-invasive. To learn heart rate features, the authors used a bidirectional short-term memory (Bi LSTM) network, while to learn facial expression features, they trained a convolutional neural network (CNN) model. To meet real-time processing requirements, they used a SOM BP network fusing HR and FE features to recognize emotions such as “excited”, “angry”, “sad”, and “calm” in the game scene. The method combines a multi-layered feed-forward network trained with the backpropagation learning rule and Kohonen’s self-organizing maps. The intensity of the emotions is estimated by observing the heart rate values. Their method performs well compared to methods relying on speech, body movements, micro-expressions and electroencephalogram (EEG) signals.
Tavakoli et al. [30] showed a significant association between larger vehicles and elevated driver heart rate (HR) and negative mood levels. Additionally, closer proximity to the lead vehicle and increased distance variability during naturalistic driving were associated with sudden spikes in heart rate, indicating elevated stress levels. Notably, participants consistently reported elevated levels of positive emotions, more engaged faces, and slower heart rate increases while driving on the freeway compared to city streets. The study relied on the HARMONY dataset, a human-centered multimodal study conducted in a real-world setting with 15 participants (7 men and 8 women). The analysis utilized the Natural Driving Research Database to investigate changes in drivers’ heart rate and facial expressions in response to changes in driving scenarios, including road objects and the dynamics between the self and leading vehicles. Heart rate variability was assessed using a Bayesian change point (BCP) detector, which is known for its ability to quantify uncertainty and integrate a priori. The BCP has been recognized for its value in identifying changes in data in a variety of disciplines including behavioral science, traffic engineering, and health. There were two key metrics for assessing Facial Expression (FE): “Valence” measures the degree of positive or negative emotion, ranging from −100 to +100 and “Engagement” represents the level of emotional expression, ranging from 0 to 100.
Pandey et al. [31] proposed two models based on temporal features and spatiotemporal characteristics to classify video dataset either alert or drowsy. In the temporal features model, YOLOv3 was utilized to obtain the temporal characteristics before being processed using the long short-term memory (LSTM). Afterwards, the authors applied the CNN model to extract the spatiotemporal characteristics. The authors concluded that drowsiness detection using the spatiotemporal characteristics model is superior to the temporal features model based on AUC-ROC score and confusion metrics. Table 1 summarises previous work related to driver drowsiness detection.

A dataset called the Drowsiness dataset is used due to its high reliability in realistic scenarios. This dataset consists of 2900 images from Kaggle [32]. These images were categorized into closed images (closed eyes), open images (open eyes), no yawn images (non-drowsy), and yawn images (drowsy). Specifically, there are 726 closed images, 726 open images, 725 no yawn images, and 723 yawn images. The images are in RGB format and have a resolution of 640 × 480 pixels. The dataset covers a range of expressions corresponding to different levels of alertness and is ideally suited for training a robust model to accurately classify facial expressions as drowsy or non-drowsy. However, for this study only applies the yawn and no yawn images for training the models. This focus allows the model to distinguish effectively between drowsy and non-drowsy states based on the presence or absence of yawning. The large size of the dataset and its inclusion of real-world images enhance the representativeness and improve the success rate of the proposed solution in recognizing driver drowsiness. Fig. 1 shows sample images from the datasets obtained from the Kaggle repository.

Figure 1: Sample images of yawn and no yawn
Before training the model, the images were resized to 145 × 145 pixels for uniformity. 725 no yawn images as non-drowsy and 723 yawn images are re-labelled as drowsy and non-drowsy with binary, 0 and 1, respectively. The function drowsyface loaded images from specified directories, detected faces using Haar Cascade, extracted and resized the region of interest (ROI) to 235 × 235 pixels, and appended the processed images and their labels to the no drowsy list. 80–20 split was applied to the dataset to evaluate the performance of the models effectively. As a result of the split, 264 images were used for training and 66 images for testing purposes. Data augmentation was applied to the training images using techniques like rescaling, rotation, width/height shifts, shear, zoom, and horizontal flips to enhance generalization. This increased the diversity of the training data, aiding in more robust model learning.
3.3 Model Development and Implementation
A Convolutional Neural Network (CNN) model was implemented using the ResNet and DenseNet architecture. CNN was trained to recognize expressions and classify them into drowsy and active states. The CNN model included layers for feature extraction and classification. Conv2D layers extracted features from images, MaxPooling2D layers reduced spatial dimensions, the Flatten layer converted 2D matrices to 1D vectors, and Dense layers performed final classification using a sigmoid activation function for binary output. The model was compiled with binary cross-entropy loss and the RMSprop optimizer. This configuration was suitable for binary classification, with the optimizer adjusting weights to minimize loss during training. A learning rate scheduler adjusted the learning rate during training. The initial learning rate was 0.001, reduced by a factor of 10 after 10 epochs to fine-tune the model. The model was trained for 200 epochs with callbacks for learning rate adjustment. Training data was supplied by train_generator, and validation data by test_generator. The model’s performance and training progress were monitored over the epochs.
Evaluation on the models is performed to determine the most optimum model. Finally, the optimal model is stored in hierarchical structure as a h5 format for easy reload in the proposed driver drowsiness detection system. In this study, the CNN algorithm utilized the ResNet model (short for Residual Network), combined with skip connection technology. These skip connections solve the vanishing gradient problem, allowing efficient training of deep networks. The encoding phase involved setting hyperparameters such as the number of epochs, learning rate, and batch size. These parameters play a crucial role in influencing the performance of the ResNet model, ensuring optimal accuracy and efficiency for drowsiness detection in laboratory tests. Table 2 presents various parameter settings to train the CNN model as well as the results.

The CNN model shows consistent performance across all configurations. One noteworthy configuration for CNN was training for 50 epochs with the Adam optimizer and a batch size of 64, yielding an F1-score of 0.94 and an accuracy of 0.9306, indicating strong performance and a well-fitting model. However, another configuration involved training for 200 epochs with the RMSprop optimizer and a batch size of 208, resulting in an F1-score of 0.97 and an accuracy of 0.9421, suggesting a better well-fitting model. This configuration struck a balance between bias and variance, making it highly reliable for the task. Hence, this model is determined as the optimum model to fulfill the scope of this study which is to detect driver drowsiness from facial expression. Fig. 2 shows the training and validation loss plot while Fig. 3 shows the training and validation accuracy over the 200 epochs of the optimal model.

Figure 2: Training and validation loss plot for optimal model

Figure 3: Training and validation accuracy plot for optimal model
In this study, we propose a dual modal for detecting driver drowsiness which combines face recognition and heart rate detection. Visual Studio Code and Google Collab, with Python as the designated programming language were utilized for this purpose. The ASUS Vivobook USB 2.0 HD UV webcam played a role in capturing expressions and enabling heart rate sensing. By utilizing the principle of photoplethysmography, the system is able to non-invasively detect changes in a driver’s blood volume, especially in facial areas such as the forehead, providing a valuable source of information for heart rate detection. Integrating rPPG into the model design enhances the system’s ability to monitor the user’s heart rate in real time without the need for direct contact or specialized sensors. Unlike electrocardiograms (ECG) which require plastic patches to the skin, rPPG only requires non-invasive physiological measurements to effectively and accurately detect heart rates. The system overview is shown in Fig. 4.

Figure 4: System overview
Initially, essential libraries were imported, followed by loading the h5 file format for the optimal model of facial expression recognition. The webcam along with facial expression detection components are initialized. Methods were created to manage data collection, including toggling data collection on and off, resetting collected data, and saving this data to a CSV file. These functions are used for collecting data such as time, heart rate, and driver status. The “get_pulse.py” initializes key processes for the system.
In the main loop function, def main_loop(self), the captured video frame is processed to perform heart rate analysis using the findFaceGetPulse class. The class findFaceGetPulse which is in the noopenmdao.py is programmed to detect a driver’s face, identify the forehead and eyes as well as calculate his heart rate from webcam captured images. It utilizes several libraries such as OpenCV for image processing, NumPy for numerical operations, and PyInstaller for creating standalone executables. The class includes various methods for adjusting parameters, toggling face detection, and processing video frames, as listed in Table 3.

In the run method, if face detection is enabled, it detects faces in the current frame and draws rectangles around detected faces. After this, the system will start the heart rate calculation. If a face is locked, it calculates the heart rate by analyzing the pixel values in the forehead region. The method performs several steps including buffering data, FFT (Fast Fourier Transform) analysis, and heart rate estimation:
Data buffering: The data from the forehead region of the face is collected and stored in a buffer. The buffer ensures that only the latest buffer_size samples are kept, allowing the calculation to use a sliding window of data.
Signal processing: The mean pixel values from the forehead region are used as the input signal. The signal is processed to remove noise and make it suitable for analysis.
Fourier transform: A Fourier Transform is applied to the processed signal to convert it from the time domain to the frequency domain.
Heart rate estimation: The dominant frequency in the signal is identified, which corresponds to the heart rate. The frequency corresponding to the highest peak in the FFT result is taken as the heart rate. The heart rate is then converted from frequency (Hz) to beats per minute (BPM) and displayed to the user in the system. During the estimation time, the system waits to ensure that enough data is collected to accurately estimate the heart rate. During this time, the system can properly process the signal, filter out noise, and confirm the stability of the detected frequency. The length of the estimation time depends on the design of the system and the accuracy required but typically ranges from a few seconds to a minute.
If drowsiness prediction is enabled, the system converts the frame to grayscale and detects faces using Dlib’s face detector. For each detected face, it extracts facial landmarks and evaluates eye blinks to assess drowsiness. The region of interest (ROI) for the face is extracted, resized, and normalized before being fed into the pre-trained CNN model to predict drowsiness. The drowsiness probability, Pdrowsy is typically the output of the sigmoid activation function in the final layer of the network. In this study, a Pdrowsy value of 0.65 is used to trigger an early warning for real-time driver drowsiness detection. In addition, a heart rate value which is out of the normal range, i.e., 60 to 80 beats per minute and closed eyes period of more than 5 seconds are used to determine the driver’s status as either drowsy or active. Once the system determines that the driver is drowsy, an audio alert may be triggered if necessary. Finally, the system displays the driver’s status and heart rate on the video frame and logs this data along with timestamps. Fig. 5 presents the system flow chart to determine the driver’s state either drowsy or active.

Figure 5: System flowchart
5 Experimental Results and Analysis
5.1 Preliminary Testing and Results
In the preliminary testing, operational efficiency was attained through the direct integration of Dlib library’s 68 facial feature point detectors and face detectors. In this study, the system starts when the user runs the command “python get_pulse.py”. The system automatically opened the camera and proceeded to detect the user’s face, forehead, and eyes, drawing a rectangle box around the driver’s face. By pressing “S,” the system drew a rectangle at the centre of the forehead and started detecting the user’s heart rate using non-contact heart rate detection technology, which is rPPG (remote Photoplethysmography).
When the system detected closed eyes for more than 5 s, a heart rate below 60 beats per minute (bpm) or higher than 80 bpm, and a drowsiness probability above 0.65, it displayed an alert message and sounded an alarm indicating drowsiness. For cases where closed eyes were detected for less than 5 s, and the heart rate was 60 bpm or higher with a drowsiness prediction score of 0.65 or less, the system showed an active message. Similarly, if the closed eyes were detected for less than 5 s, and the heart rate was below 60 bpm with a drowsiness prediction score of 0.65 or less, it displayed an active message. In all other cases, the system defaulted to showing an active message. After displaying these messages, the system continued to assess the user’s face and heart rate to ensure ongoing monitoring and real-time assessment of drowsiness levels. Users could start and stop saving data to a CSV file by pressing “F”, restart the detection process by pressing “A”, and end system operation by pressing the “Esc” key. Fig. 6 presents an example of a video frame when the system is running.
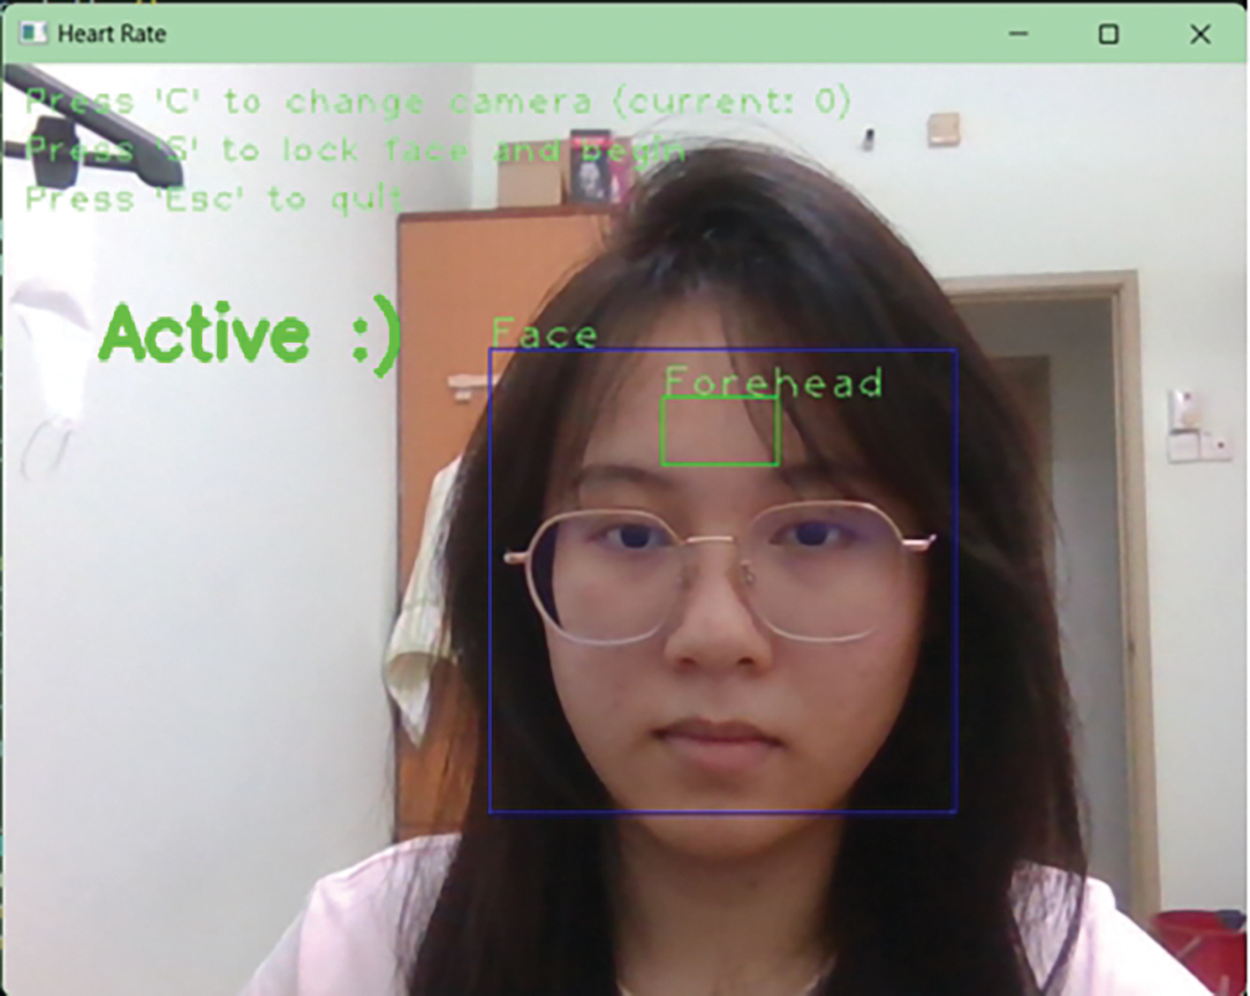
Figure 6: Example of a video frame showing the face detection
After the system has been run for 15 min, mild drowsiness can be detected. Nevertheless, external factors such as brightness may affect the displayed results when performing system testing indoor. This emphasizes the need for the system to be in a well-lit area to provide more reliable drowsiness detection results.
Apart from that, during the preliminary system testing, two types of webcams were considered i.e., the Logitech BRIO 4K Ultra HD Pro Stream webcam and the Logitech HD Pro webcam C920. In addition, four different camera angles and height were considered to determine the optimal location for in-vehicle use so that the facial features, eye closure, facial drowsiness, and heart rate may accurately be monitored and detected during actual vehicle testing. To ensure adequate lighting conditions, the interior lights were kept on throughout the test. The distance between the human body and the camera was maintained at approximately one arm’s length to simulate the typical distance between the driver and the steering wheel. Fig. 7 shows the video frames based in different camera angles including top left, top center, bottom center and bottom left.
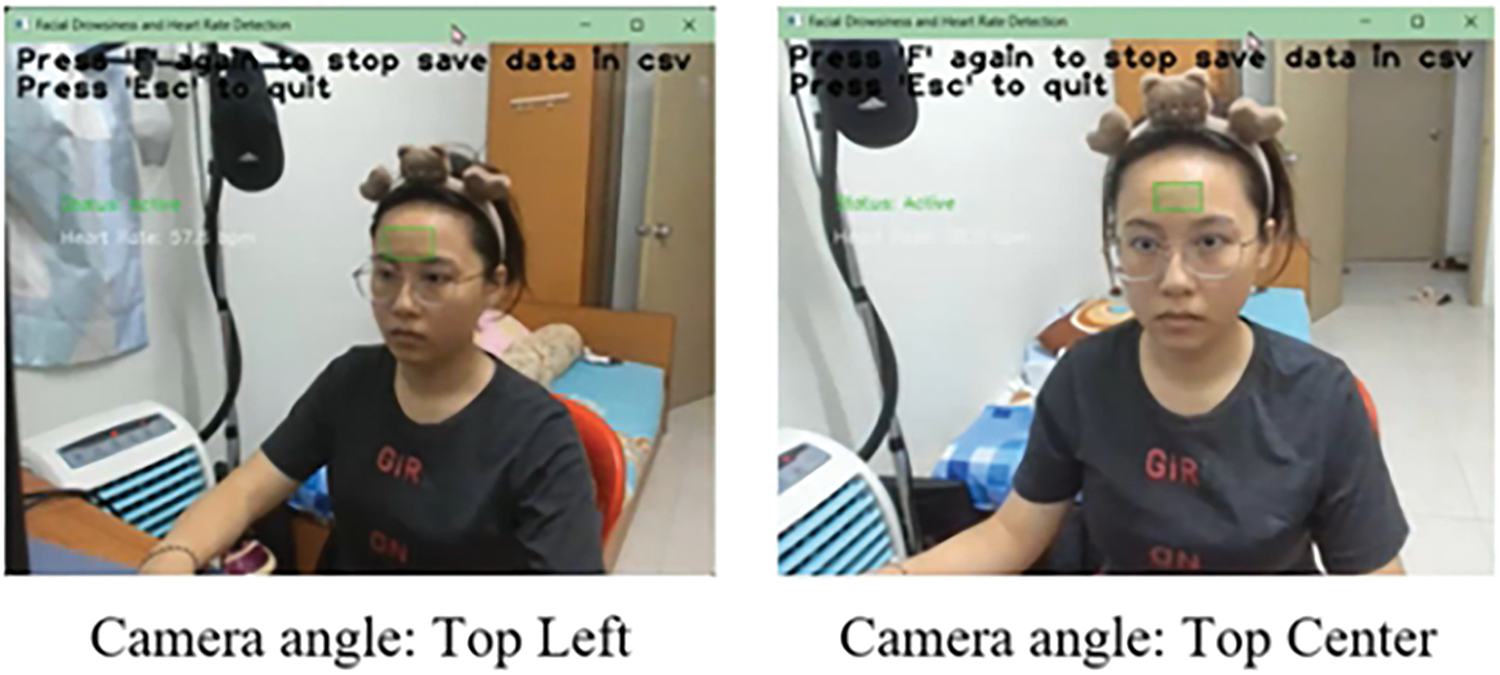

Figure 7: Four different camera angles
During testing, subjects simulated driving with the head turned from side to side to assess whether the system could reliably detect the face, eyes and forehead at different angles. This is important to ensure that the system can effectively detect even if the driver moves the head while driving. Based on the testing, it was essential that the forehead remained within the designated rectangle area for accurate detection. The Logitech BRIO 4K Ultra HD Pro Stream webcam was observed to outperform the Logitech HD Pro webcam C920. The Logitech BRIO 4K Ultra HD Pro Stream camera excels at detecting facial features, especially the face and forehead, which are critical for monitoring eye closure, facial drowsiness, and heart rate. The Logitech HD Pro webcam C920 failed to detect facial drowsiness and low heart rate with eyes closed. Moreover, the best angle and height for placing the camera, based on the laboratory testing, is the top center position. This positioning ensures that the system can accurately monitor the driver’s face and physiological indicators under real-world conditions. Fig. 8 presents the video frame when Logitech BRIO 4K Ultra HD Pro Stream webcam successfully provides input for the system to produce the status and heart rate of the subject. The preliminary testing results were further investigated in the actual in-vehicle setting.
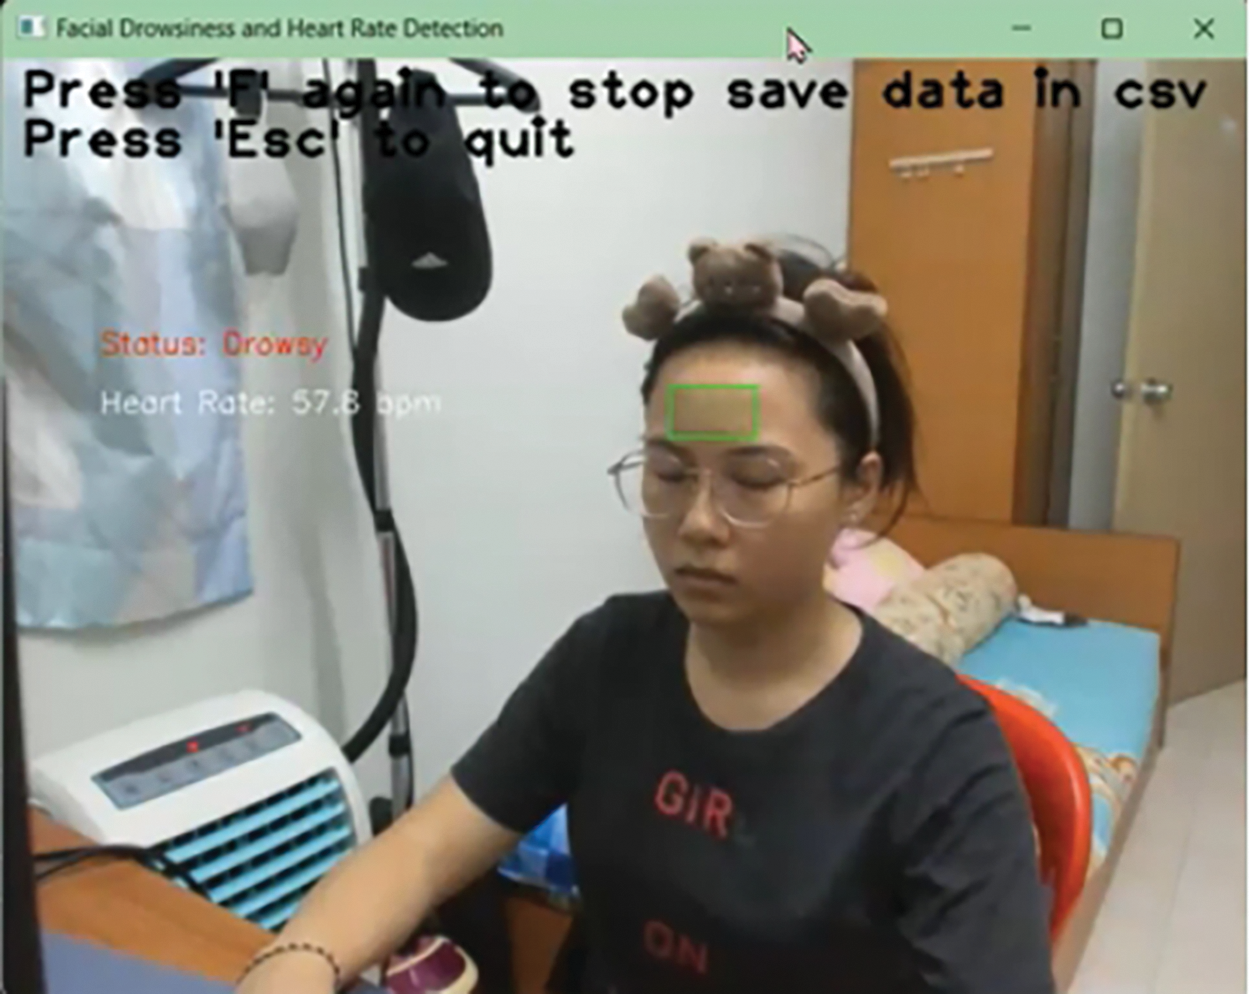
Figure 8: Successful drowsiness detection with Logitech BRIO 4K camera
5.2 In-Vehicle Testing and Results
During the in-vehicle testing, the Logitech BRIO 4K Ultra HD Pro Stream Webcam was utilized. This camera played a pivotal role in capturing video clips, with a particular focus on areas such as the user’s forehead, face, and eyes. The aim of capturing these areas was to augment the system’s safety features by combining them with heart rate detection technology. The camera used for heart rate detection served as a sensor to capture blood-related signals on the forehead, contributing to a holistic approach in enhancing system safety.
Before conducting the real-world vehicle testing, a protocol was established following the real-world vehicle testing. This protocol involved six persons, comprising three males and three females, each subjected to a 15-min driving test at speeds up to 30 km/h. The tests were carried out during the daytime at the campus and around a nearby residential area as in Fig. 9.

Figure 9: Driving area
The volunteers were instructed not to use mobile phones or listen to music during the test. The air conditioning was kept on throughout to maintain a consistent environment. The aim was to evaluate the driver’s responses and physiological indicators under controlled driving conditions intended to induce drowsiness. The Logitech BRIO 4K Ultra HD Pro Stream Webcam was positioned on top of the dashboard (Fig. 10).

Figure 10: Position of the webcam in a 5-door hatchback car
The data was collected from six volunteers, including time, heart rate, and status, was saved in each CSV file. The average heart rate for each minute over the 15-min period was then graphed. Consistent readings were gathered after one to two minutes system initiation which is when the system becomes stabilized. To further illustrate the system’s performance, screenshots of active and drowsy states were taken for each participant from video recordings during the test (as in Figs. 11 and 12).

Figure 11: Testing (male)

Figure 12: Testing (female)
The active state screenshot was taken before the 7-min mark within the 15-min test, while the drowsy state screenshot was taken after the 7-min mark. The drivers’ heart rates decreased while they were drowsy, indicating a correlation between lower heart rates and drowsiness. The drowsiness was induced by asking the driver to drive within the 30 km/h speed limit and testing was conducted after office hours. The graphs in Figs. 13 and 14 show the driver’s state throughout the 15-min duration of the in-vehicle testing for two subjects. The drowsy states are highlighted in red color. During the testing period, a buzzer was sounded when the system classified the driver as drowsy.
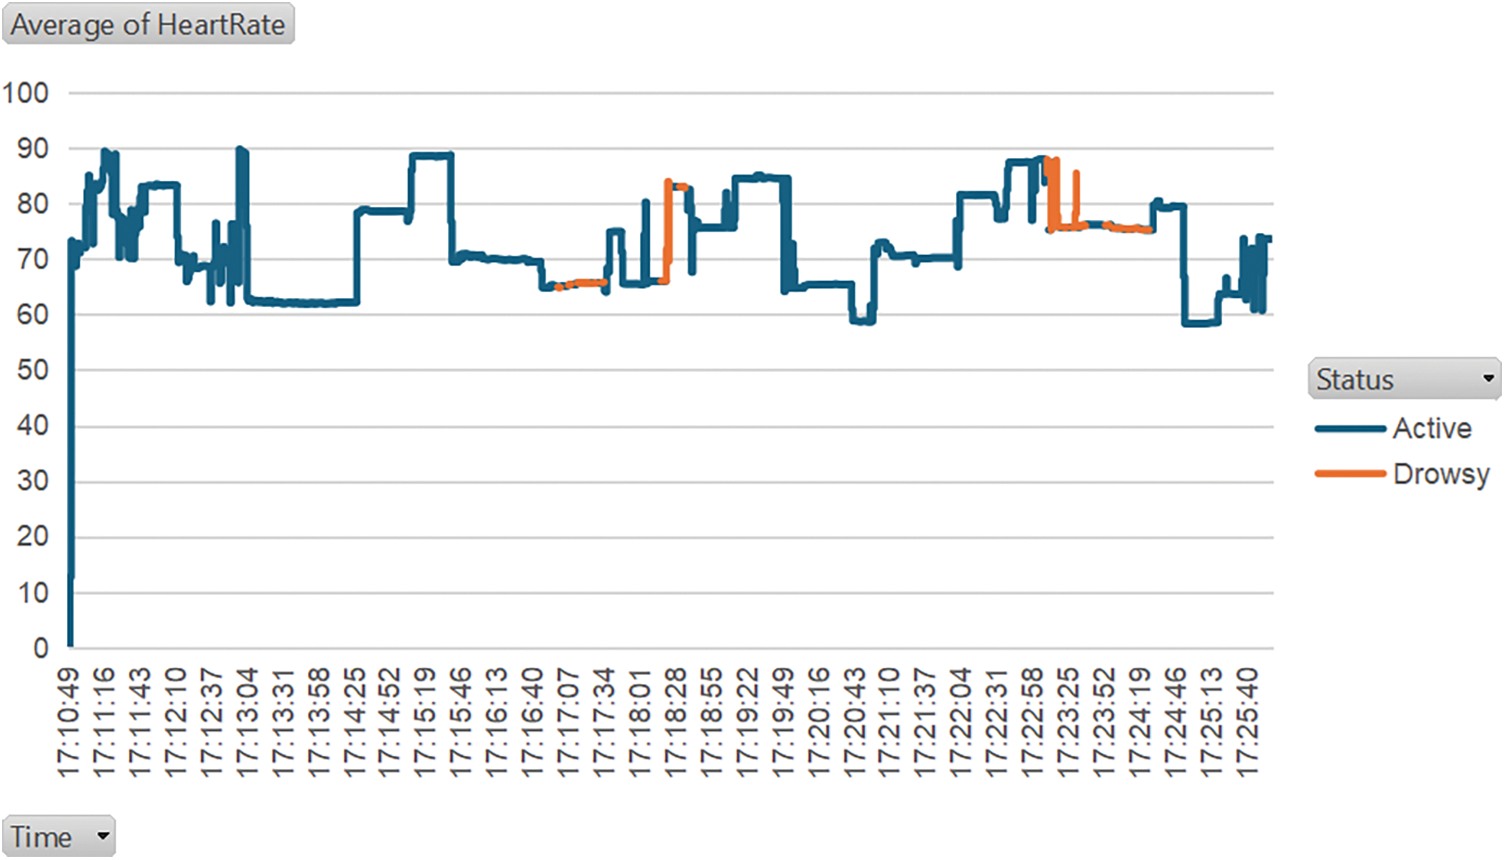
Figure 13: Average heart rate of male subject
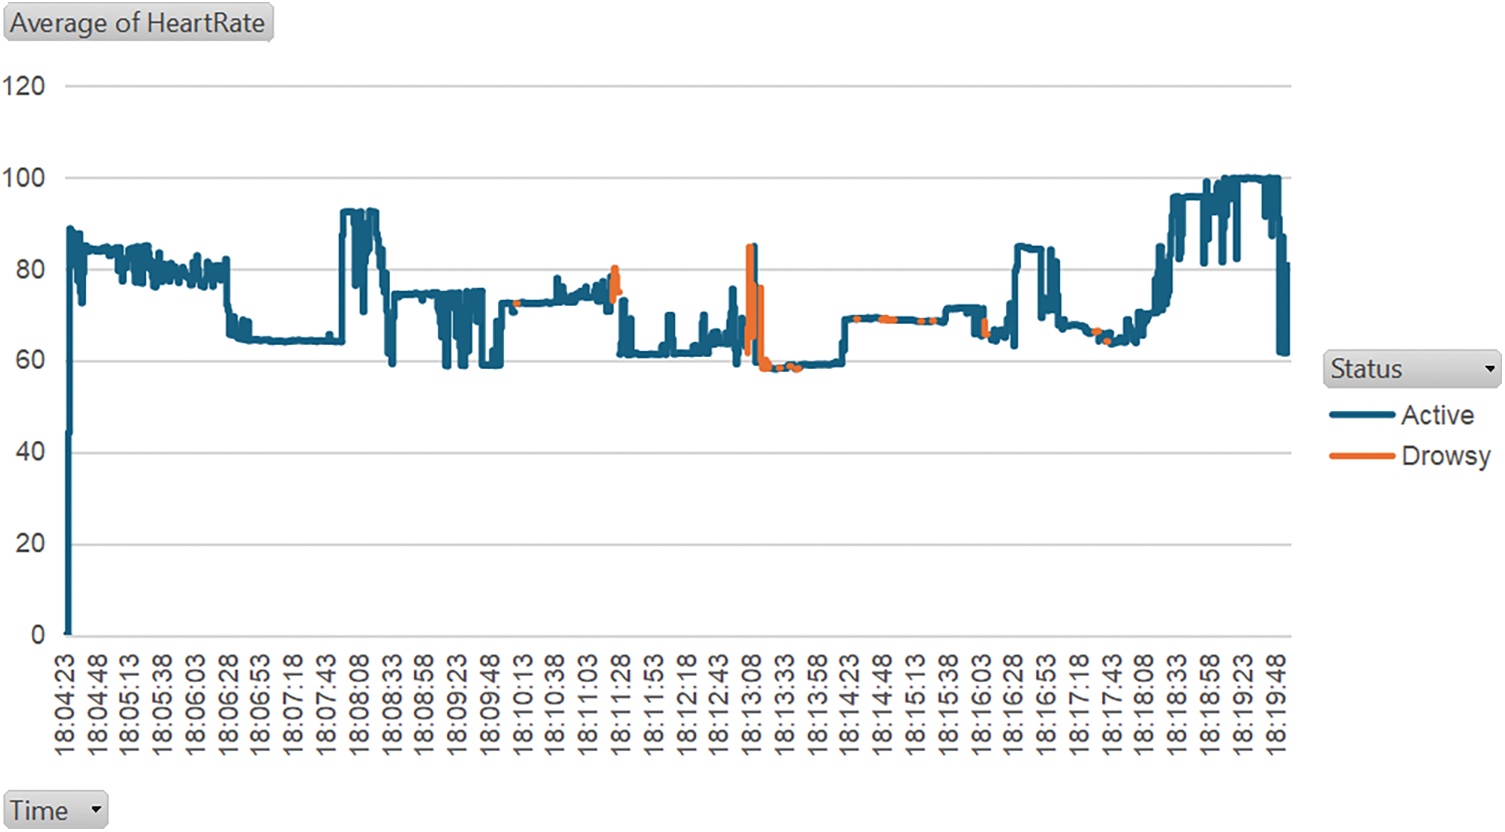
Figure 14: Average heart rate of female subject
This work has the potential to reduce accidents on the roads that are caused by drowsy drivers. A real-time driver alertness monitoring system would be able to detect if a driver is drowsy and alert them before any accident can occur. The system would not only make it safer for the driver to drive, but it also makes the roads safer for other surrounding road users. Furthermore, the success of this study could lay the foundation for other driving monitoring research to use heart rate and facial expression analysis as means to monitor driver behavior. Other researchers can utilize the findings from this study to develop systems that further improve safety on the roads for all users.
However, this system has some limitations. For starters, the forehead of the driver needs to be in the center view of the webcam, and good lighting on the driver’s face is also required for accurate detection from the system. Not to mention any visual obstruction of the face, such as glasses or masks, will affect the accuracy of the system as well. These limitations could be addressed in future works to make the system more versatile and robust. Improvements can be made to accurately determine facial expression regardless of the head’s position. Infrared (IR) technology could be added to make the system more effective and accurate in low-lighting conditions.
This research successfully detects the heart rate of a driver using a webcam, and it is also able to determine the state of alertness of the driver. State-of-the-art technology is used to improve the detection and classification accuracy of the system. Technology such as remote photoplethysmography rPPG allows for the detection of the driver’s heart rate without the use of additional equipment. Additionally, an optimal convolutional neural network (CNN) is utilized to detect the facial expression of drivers and subsequently classify them as either in an alert state or drowsy state. This non-intrusive method of monitoring driver alertness helps keep them safe on the road while maintaining comfort, compared to conventional wearable devices that need to be placed on the driver’s body which could potentially limit the driver’s movements. The convolutional neural network implemented in the system ensures a high accuracy in detecting driver drowsiness. In conclusion, although results from this study are encouraging and the system has been shown to be an effective driver alertness monitoring system, addressing its limitations is still vital in ensuring that the system works as flawlessly as possible in real-world driving environments. Further exploration and continuous research into this matter is needed to constantly improve the safety of all road users and for the betterment of countless lives.
Acknowledgement: Authors would like to thank the Centre for Intelligent Cloud Computing for the encouragement and support.
Funding Statement: This research was funded by the TM R&D, grant number RDTC/221046.
Author Contributions: The authors confirm contribution to the paper as follows: study conception and design: Siti Fatimah Abdul Razak, Sumendra Yogarayan; data collection: Yi Xuan Chew, Sumendra Yogarayan; analysis and interpretation of results: Siti Fatimah Abdul Razak, Sharifah Noor Masidayu Sayed Ismail; draft manuscript preparation: Yi Xuan Chew, Siti Fatimah Abdul Razak, Sharifah Noor Masidayu Sayed Ismail. All authors reviewed the results and approved the final version of the manuscript.
Availability of Data and Materials: The authors confirm that the data supporting the findings of this study are available within the article.
Ethics Approval: Not applicable.
Conflicts of Interest: The authors declare no conflicts of interest to report regarding the present study.
References
1. M. Kamboj, K. Kadian, V. Dwivedi, A. Wary, and S. Ojha, “Advanced detection techniques for driver drowsiness: A comprehensive review of machine learning, deep learning, and physiological approaches,” Multimed. Tools Appl., 2024. doi: 10.1007/s11042-024-19738-z. [Google Scholar] [CrossRef]
2. S. W. Jang and B. Ahn, “Implementation of detection system for drowsy driving prevention using image recognition and IoT,” Sustainability, vol. 12, no. 7, 2020, Art. no. 3037. doi: 10.3390/su12073037. [Google Scholar] [CrossRef]
3. R. Rahmadiyani and A. widyanti, “Prevalence of drowsy driving and modeling its intention: An Indonesian case study,” Transp. Res. Interdiscip. Perspect., vol. 19, no. 23, May 2023, Art. no. 100824. doi: 10.1016/j.trip.2023.100824. [Google Scholar] [CrossRef]
4. L. Chen et al., “Driver fatigue detection via differential evolution extreme learning machine technique,” Electronics, vol. 9, no. 11, Nov. 2020, Art. no. 1850. doi: 10.3390/electronics9111850. [Google Scholar] [CrossRef]
5. C. H. Cheng, K. L. Wong, J. W. Chin, T. T. Chan, and R. H. Y. So, “Deep learning methods for remote heart rate measurement: A review and future research agenda,” Sensors, vol. 21, no. 18, 2021, Art. no. 6296. doi: 10.3390/s21186296. [Google Scholar] [PubMed] [CrossRef]
6. L. Michiels, R. Verachtert, A. Ferraro, K. Falk, and B. Goethals, “A framework and toolkit for testing the correctness of recommendation algorithms,” ACM Trans. Recommender Syst., vol. 2, no. 1, pp. 1–45, Mar. 2024. doi: 10.1145/3591109. [Google Scholar] [CrossRef]
7. N. Ruiz et al., “Simulated adversarial testing of face recognition models,” in Proc. 2022 IEEE/CVF Conf. Comput. Vis. Pattern Recognit. (CVPR), New Orleans, LA, USA, Jun. 18–24, 2022, pp. 4135–4145. doi: 10.1109/CVPR52688.2022.00411. [Google Scholar] [CrossRef]
8. S. Yogarayan, S. F. A. Razak, A. Azman, and M. F. A. Abdullah, “Applications of Internet of Things for monitoring drivers- a comprehensive study,” Indones. J. Electr. Eng. Comput. Sci., vol. 25, no. 3, pp. 1599–1606, Mar. 2022. doi: 10.11591/ijeecs.v25.i3.pp1599-1606. [Google Scholar] [CrossRef]
9. S. S. Jasim and A. K. A. Hassan, “Modern drowsiness detection techniques: A review,” Int. J. Electr. Comput. Eng., vol. 12, no. 3, 2022. doi: 10.11591/ijece.v12i3.pp2986-2995. [Google Scholar] [CrossRef]
10. S. F. A. Razak, Y. J. Tong, S. Yogarayan, S. N. M. S. Ismail, and O. C. Sui, “Driver-centered pervasive application for heart rate measurement,” Int. J. Electr. Comput. Eng., vol. 14, no. 1, pp. 1176–1184, Feb. 2024. doi: 10.11591/ijece.v14i1.pp1176-1184. [Google Scholar] [CrossRef]
11. Y. Jeon, B. Kim, and Y. Baek, “Ensemble CNN to detect drowsy driving with in-vehicle sensor data,” Sensors, vol. 21, no. 7, Mar. 2021, Art. no. 2372. doi: 10.3390/s21072372. [Google Scholar] [PubMed] [CrossRef]
12. C. S. Pilz, S. Zaunseder, U. Canzler, and J. Krajewski, “Heart rate from face videos under realistic conditions for advanced driver monitoring,” Curr. Dir. Biomed. Eng., vol. 3, no. 2, pp. 483–487, Sep. 2017. doi: 10.1515/cdbme-2017-0102. [Google Scholar] [CrossRef]
13. Z. Huang et al., “Face2Multi-modal: In-vehicle multi-modal predictors via facial expressions,” in Proc. 12th Int. Conf. Automot. User Interfaces Interact. Veh. Appl., Sep. 21–22, 2020, pp. 21–22. doi: 10.1145/3409251.3411716. [Google Scholar] [CrossRef]
14. M. Ramzan, H. U. Khan, S. M. Awan, A. Ismail, M. Ilyas and A. Mahmood, “A survey on state-of-the-art drowsiness detection techniques,” IEEE Access, vol. 7, pp. 61904–61919, 2019. doi: 10.1109/ACCESS.2019.2914373. [Google Scholar] [CrossRef]
15. M. K. Hussein, T. M. Salman, A. H. Miry, and M. A. Subhi, “Driver drowsiness detection techniques: A survey,” in Proc. 2021 1st Babylon Int. Conf. Inform. Technol. Sci. (BICITS), Apr. 28–29, 2021, pp. 28–29. doi: 10.1109/BICITS51482.2021.9509912. [Google Scholar] [CrossRef]
16. J. H. Kim, A. Poulose, and D. S. Han, “CVGG-19: Customized visual geometry group deep learning architecture for facial emotion recognition,” IEEE Access, vol. 12, pp. 41557–41578, 2024. doi: 10.1109/ACCESS.2024.3377235. [Google Scholar] [CrossRef]
17. S. F. A. Razak, S. Yogarayan, A. A. Aziz, M. F. A. Abdullah, and N. H. Kamis, “Physiological-based driver monitoring systems: A scoping review,” Salehan Inst. Higher Educ., Dec. 01, 2022. doi: 10.28991/CEJ-2022-08-12-020. [Google Scholar] [CrossRef]
18. S. Liu et al., “Toward nonintrusive camera-based heart rate variability estimation in the car under naturalistic condition,” IEEE Internet Things J., vol. 9, no. 14, pp. 11699–11711, Jul. 2022. doi: 10.1109/JIOT.2021.3131742. [Google Scholar] [CrossRef]
19. B. Babusiak, A. Hajducik, S. Medvecky, M. Lukac, and J. Klarak, “Design of smart steering wheel for unobtrusive health and drowsiness monitoring,” Sensors, vol. 21, no. 16, Aug. 2021, Art. no. 5285. doi: 10.3390/s21165285. [Google Scholar] [PubMed] [CrossRef]
20. K. S. Gangadharan and A. P. Vinod, “Drowsiness detection using portable wireless EEG,” Comput. Methods Programs Biomed., vol. 214, Feb. 2022, Art. no. 106535. doi: 10.1016/j.cmpb.2021.106535. [Google Scholar] [PubMed] [CrossRef]
21. K. Fujiwara, H. Iwamoto, K. Hori, and M. Kano, “Driver drowsiness detection using r-r interval of electrocardiogram and self-attention autoencoder,” IEEE Trans. Intell. Veh., 2023. doi: 10.1109/TIV.2023.3308575. [Google Scholar] [CrossRef]
22. J. Zou, Z. Li, and P. Yan, “Automatic monitoring of driver’s physiological parameters based on microarray camera,” in Proc. 2019 IEEE Eurasia Conf. Biomed. Eng., Healthc. Sustain. (ECBIOS), IEEE, May 2019, pp. 15–18. doi: 10.1109/ECBIOS.2019.8807443. [Google Scholar] [CrossRef]
23. W. Wang, A. C. Den Brinker, S. Stuijk, and G. De Haan, “Algorithmic principles of remote PPG,” IEEE Trans. Biomed. Eng., vol. 64, no. 7, pp. 1479–1491, Jul. 2017. doi: 10.1109/TBME.2016.2609282. [Google Scholar] [PubMed] [CrossRef]
24. S. Premkumar and D. J. Hemanth, “Intelligent remote photoplethysmography-based methods for heart rate estimation from face videos: A survey,” Informatics, vol. 9, no. 3, 2022, Art. no. 57. doi: 10.3390/informatics9030057. [Google Scholar] [CrossRef]
25. N. S. Suriani, N. A. Jumain, A. A. Ali, and N. H. Mohd, “Facial video based heart rate estimation for physical exercise,” in Proc. 2021 IEEE Symp. Ind. Electr. Appl. (ISIEA), Jul. 2021, pp. 1–5. doi: 10.1109/ISIEA51897.2021.9509986. [Google Scholar] [CrossRef]
26. A. Jeyasekar and V. R. Iyengar, “Driver’s drowsiness detection based on behavioural changes using ResNet,” Int. J. Recent Technol. Eng. (IJRTE), vol. 8, no. 3, pp. 5708–5712, Sep. 2019. doi: 10.35940/ijrte.B2494.098319. [Google Scholar] [CrossRef]
27. Z. Xiong et al., “Face2Statistics: User-friendly, low-cost and effective alternative to in-vehicle sensors/monitors for drivers,” in HCI in Mobility, Transport, and Automotive Systems. Cham: Springer, 2022, vol. 13335, pp. 289–308. doi: 10.1007/978-3-031-04987-3_20. [Google Scholar] [CrossRef]
28. S. Murugan, J. Selvaraj, and A. Sahayadhas, “Detection and analysis: Driver state with electrocardiogram (ECG),” Phys. Eng. Sci. Med., vol. 43, no. 2, pp. 525–537, Jun. 2020. doi: 10.1007/s13246-020-00853-8. [Google Scholar] [PubMed] [CrossRef]
29. G. Du, S. Long, and H. Yuan, “Non-contact emotion recognition combining heart rate and facial expression for interactive gaming environments,” IEEE Access, vol. 8, pp. 11896–11906, 2020. doi: 10.1109/ACCESS.2020.2964794. [Google Scholar] [CrossRef]
30. A. Tavakoli, N. Lai, V. Balali, and A. Heydarian, “How are drivers’ stress levels and emotions associated with the driving context? A naturalistic study,” J. Transp. Health, vol. 31, Jul. 2023, Art. no. 101649. doi: 10.1016/j.jth.2023.101649. [Google Scholar] [CrossRef]
31. N. N. Pandey and N. B. Muppalaneni, “Dumodds: Dual modeling approach for drowsiness detection based on spatial and spatio-temporal features,” Eng. Appl. Artif. Intell., vol. 119, Mar. 2023. doi: 10.1016/j.engappai.2022.105759. [Google Scholar] [CrossRef]
32. D. Perumandla, “Drowsiness dataset,” Accessed: Jul. 15, 2024. [Online]. Available: https://www.kaggle.com/datasets/dheerajperumandla/drowsiness-dataset/data [Google Scholar]
Cite This Article
 Copyright © 2024 The Author(s). Published by Tech Science Press.
This work is licensed under a Creative Commons Attribution 4.0 International License , which permits unrestricted use, distribution, and reproduction in any medium, provided the original work is properly cited.
 Downloads
 Citation Tools