 Open Access
ARTICLE
DC-FIPD: Fraudulent IP Identification Method Based on Homology Detection
1 College of Computer and Information Engineering, Henan Normal University, Xinxiang, 453007, China
2 Intelligent Medical Engineering, SanQuan Medical College, Xinxiang, 453003, China
3 Information Engineering University, Information Engineering University, Zhengzhou, 450001, China
4 Key Laboratory of Cyberspace Situation Awareness of Henan Province, Zhengzhou, 450001, China
* Corresponding Author: Ruixiang Li. Email:
Computers, Materials & Continua 2024, 81(2), 3301-3323. https://doi.org/10.32604/cmc.2024.056854
Received 01 August 2024; Accepted 29 September 2024; Issue published 18 November 2024
Abstract
Currently, telecom fraud is expanding from the traditional telephone network to the Internet, and identifying fraudulent IPs is of great significance for reducing Internet telecom fraud and protecting consumer rights. However, existing telecom fraud identification methods based on blacklists, reputation, content and behavioral characteristics have good identification performance in the telephone network, but it is difficult to apply to the Internet where IP (Internet Protocol) addresses change dynamically. To address this issue, we propose a fraudulent IP identification method based on homology detection and DBSCAN(Density-Based Spatial Clustering of Applications with Noise) clustering (DC-FIPD). First, we analyze the aggregation of fraudulent IP geographies and the homology of IP addresses. Next, the collected fraudulent IPs are clustered geographically to obtain the regional distribution of fraudulent IPs. Then, we constructed the fraudulent IP feature set, used the genetic optimization algorithm to determine the weights of the fraudulent IP features, and designed the calculation method of the IP risk value to give the risk value threshold of the fraudulent IP. Finally, the risk value of the target IP is calculated and the IP is identified based on the risk value threshold. Experimental results on a real-world telecom fraud detection dataset show that the DC-FIPD method achieves an average identification accuracy of 86.64% for fraudulent IPs. Additionally, the method records a precision of 86.08%, a recall of 45.24%, and an F1-score of 59.31%, offering a comprehensive evaluation of its performance in fraud detection. These results highlight the DC-FIPD method’s effectiveness in addressing the challenges of fraudulent IP identification.Keywords
Telecom fraud refers to the illegal acquisition and fraudulent use of public and private property through the exploitation of telecommunications network technologies [1], employing methods such as remote and non-contact approaches. It encompasses various forms, including telephone, network, and SMS (Short Message Service)-based fraud. The prevalence of telecom fraud cases has increased significantly with the rapid advancement of information technology, resulting in substantial financial losses for individuals. However, due to the intricate and intangible nature of communication networks, the identification of telecom fraud has emerged as a pressing issue in need of resolution.
Telecom fraud identification (recorded as TFI) aims to analyze and identify abnormal behaviors and patterns in communication networks, so that telecom fraud activities can be detected and prevented. Recently, a series of researches have been conducted. Generally speaking, they can be divided into four categories: 1) fraud identification based on blacklist systems, 2) fraud identification based on reputation systems, 3) fraud identification based on identification based on content detection techniques, 4) fraud identification based on behavioral profiling.
The fraud identification method [2] based on a blacklist system is currently the most commonly used. By collecting suspicious phone numbers, IP addresses, and other user-reported information, we create a blacklist and mark and block the listed data. Companies like 360 Security Center and Tencent Security Center have developed and implemented such systems. Anti-spam organizations like Project Honeypot [3] and Spamhaus [4] provide extensive IP blacklist databases to detect and prevent spam, cyber fraud, and other malicious activities. While blacklist-based approaches are simple, easy to implement, and maintain, they can only detect known fraud, making it challenging to identify new types of fraud.
The fraud identification method [5] based on a reputation system provides users with a score indicating the caller’s reputation, based on characteristics such as the number and frequency of calls. Hu et al. [6] proposed a reputation system based on evidence theory for identifying abnormal phone calls. This system uses user feedback and historical spam detection results to represent reputation and synthesizes local reputations into a global reputation, ensuring reliability. Esquivel et al. [7] introduced a pre-acceptance filtering mechanism based on IP reputation within a mail system. They categorized Simple Mail Transfer Protocol (SMTP) senders into legitimate servers, end hosts, and spam gangs, developing techniques to create customized IP reputation lists. Legitimate and spam domains often use the Domain Name System (DNS) Sender Policy Framework (SPF) to pass simple authentication checks. By collecting good and bad domains and their SPF resource records, good and bad IP addresses are systematically identified. This method performs well in spam identification, detecting 90% of spam messages. However, maintaining high accuracy requires continuous updates to the IP reputation list.
Fraud identification based on content detection techniques employs Natural Language Processing (NLP) to analyze call and chat content to identify fraudulent information. Zhao et al. [8] collected descriptions of telecom fraud from news reports and social media and used machine learning algorithms to analyze this data. They then applied NLP to extract features from the text and build rules to recognize similar content in calls for further fraud identification. However, in practice, this approach is challenging due to privacy concerns surrounding calls, text messages, and emails.
Fraud identification based on behavioral feature analysis [9] is one of the most researched methods. It involves constructing user communication behavioral features and using machine learning and deep learning models for training to distinguish between fraudulent and normal numbers, as well as fraudulent and normal IPs. For fraudulent number identification, features such as time, location, call frequency, and call duration are typically extracted for training and applied to detect fraud, like shutdown operations for high-frequency calls and numbers that reach a certain threshold. Huang et al. [10] used deep neural networks and convolutional neural networks (CNN) to analyze user behavior, developing a system for detecting phone fraud and fraudulent advertisements. Chu et al. [11] developed a fraud detection model based on spatio-temporal intertwined patterns of user behavior. This model extends statistical and interaction features to dynamic call patterns and builds a probabilistic model to simulate user call behavior. Sequential patterns reflecting individual behavior are obtained through a hybrid Hidden Markov model, while structural patterns reflecting user collaboration in a telecommunications network are derived using an attention-based graph SAGE (Surrendering Accepting Gifting Extending) model. The model ultimately outputs a fraud score for each user to identify potential fraudsters.
In recent years, the integration of deep learning techniques in telecom fraud detection has significantly advanced the field. Researchers have explored various deep learning architectures such as recurrent neural networks (RNNs), long short-term memory (LSTM) networks, and graph neural networks (GNNs) to enhance detection accuracy by capturing complex temporal and spatial dependencies in telecom data. For instance, the study by Hu et al. [12] incorporated Graph Neural Networks (GNNs) to analyze the intricate relationships within telecom networks. By leveraging the GNNs’ capability to model interconnected nodes and dynamic network structures, this approach facilitated the detection of sophisticated fraud schemes that exploit network connectivity. The augmented GNNs demonstrated significant potential in enhancing the precision and recall of fraud detection systems, owing to their ability to learn and represent complex hierarchical relationships within the telecom data. These approaches have demonstrated considerable promise in improving the precision and recall of fraud detection systems by leveraging the deep learning model’s ability to learn hierarchical feature representations. However, the challenge of interpretability and the need for large labeled datasets remain key issues that need to be addressed to fully leverage these methods in practical telecom fraud detection scenarios.
Although the above research on telecom fraud identification has made great progress and to a certain extent can prevent telecom fraud incidents, the current research methodology still has some limitations in the face of existing problems:
• Cannot cope with potential fraud. Although common fraud identification methods can identify fraudulent numbers and fraudulent IPs, they can only identify known fraudulent numbers and fraudulent IPs, and cannot effectively respond to newly emerged fraudulent numbers and fraudulent IPs.
• IP reputation is difficult to score. For fraudulent phone numbers, the historical results of user feedback and spam call detection can be utilized as a reputation representation. However, fraudulent IP addresses lack these characteristics, and IP addresses are interchangeable, making it difficult to determine the criteria for scoring IP reputation.
• High false alarm rate. Fraud identification methods may generate false positives, incorrectly labeling legitimate users or entities as fraudulent users. High false alarm rates may cause unnecessary inconvenience to users and disrupt business processes. Reducing the false alarm rate is an important issue that needs to be addressed in telecom fraud detection methods.
To address the above problems, we combine blacklists with reputation systems based on the idea of IP homology to solve the issues of potential fraud and the difficulty in scoring IP reputation. We propose a fraudulent IP identification method based on homology detection, called DC-FIPD. First, the paper analyzes the aggregation of fraudulent IP geographic locations and the homology of IP addresses. The collected fraudulent IPs are then clustered geographically to determine their regional distribution. Next, a feature set for fraudulent IPs is constructed, and the weights of these features are determined using a genetic optimization algorithm. A calculation method for IP risk value is designed, along with a risk value threshold for identifying fraudulent IPs. Finally, the risk values for the IPs to be recognized are calculated, and IPs are identified as fraudulent or not based on the risk value threshold.
The main contributions of this study are as follows:
• Proposal of a New Fraudulent IP Identification Method: We introduce a fraudulent IP identification method based on homology detection. This novel approach effectively identifies fraudulent IPs and enhances users’ ability to prevent network fraud. Experimental results demonstrate that the proposed method achieves an average identification accuracy rate of 86.64%.
• Analysis of Geographic Distribution of Fraudulent IPs: We analyze the geographic patterns of fraudulent IPs using a clustering algorithm based on density optimization. This clustering analysis reveals the regional distribution of fraudulent IPs and identifies several suspicious IP areas. This method effectively expands the coverage of the fraudulent IP blacklist and addresses potential fraudulent users.
• Construction of Fraudulent IP Feature Set and Risk Value Calculation: We construct a feature set for fraudulent IPs and provide a method for calculating IP risk values. By combining the fraudulent IP feature set with the weights of IP features, we can accurately calculate the IP risk value. We then determine the IP risk value threshold based on the risk value differences to identify the type of IP.
The rest of the paper is organized as follows: Section 2 describes the main steps of the DC-FIPD method. In Section 3, the sources and evaluation metrics of the experimental dataset are described and the performance of the fraudulent IP identification method of the paper is evaluated. Finally, Section 4 summarizes the paper.
To address the issues of low accuracy in fraudulent IP identification and the challenge of identifying potential fraudulent IPs, the DC-FIPD method utilizes IP homology to detect potential fraudulent IPs and assesses the risk of IP addresses using IP risk values.
For the IP address data used by users, this study addresses the issues of difficult identification of potential fraudulent IP addresses and the imbalance in feature weight distribution leading to low identification accuracy. The density-based DBSCAN clustering algorithm is employed to cluster IP addresses, thereby identifying the regional distribution of fraudulent IPs and detecting potential fraudulent IP addresses. Additionally, the genetic optimization algorithm, incorporating selection, crossover, and mutation operations, is utilized to determine the feature weights of IP addresses, thereby enhancing the accuracy of fraudulent IP detection. The framework for the fraudulent IP identification method based on homology detection is illustrated in Fig. 1.
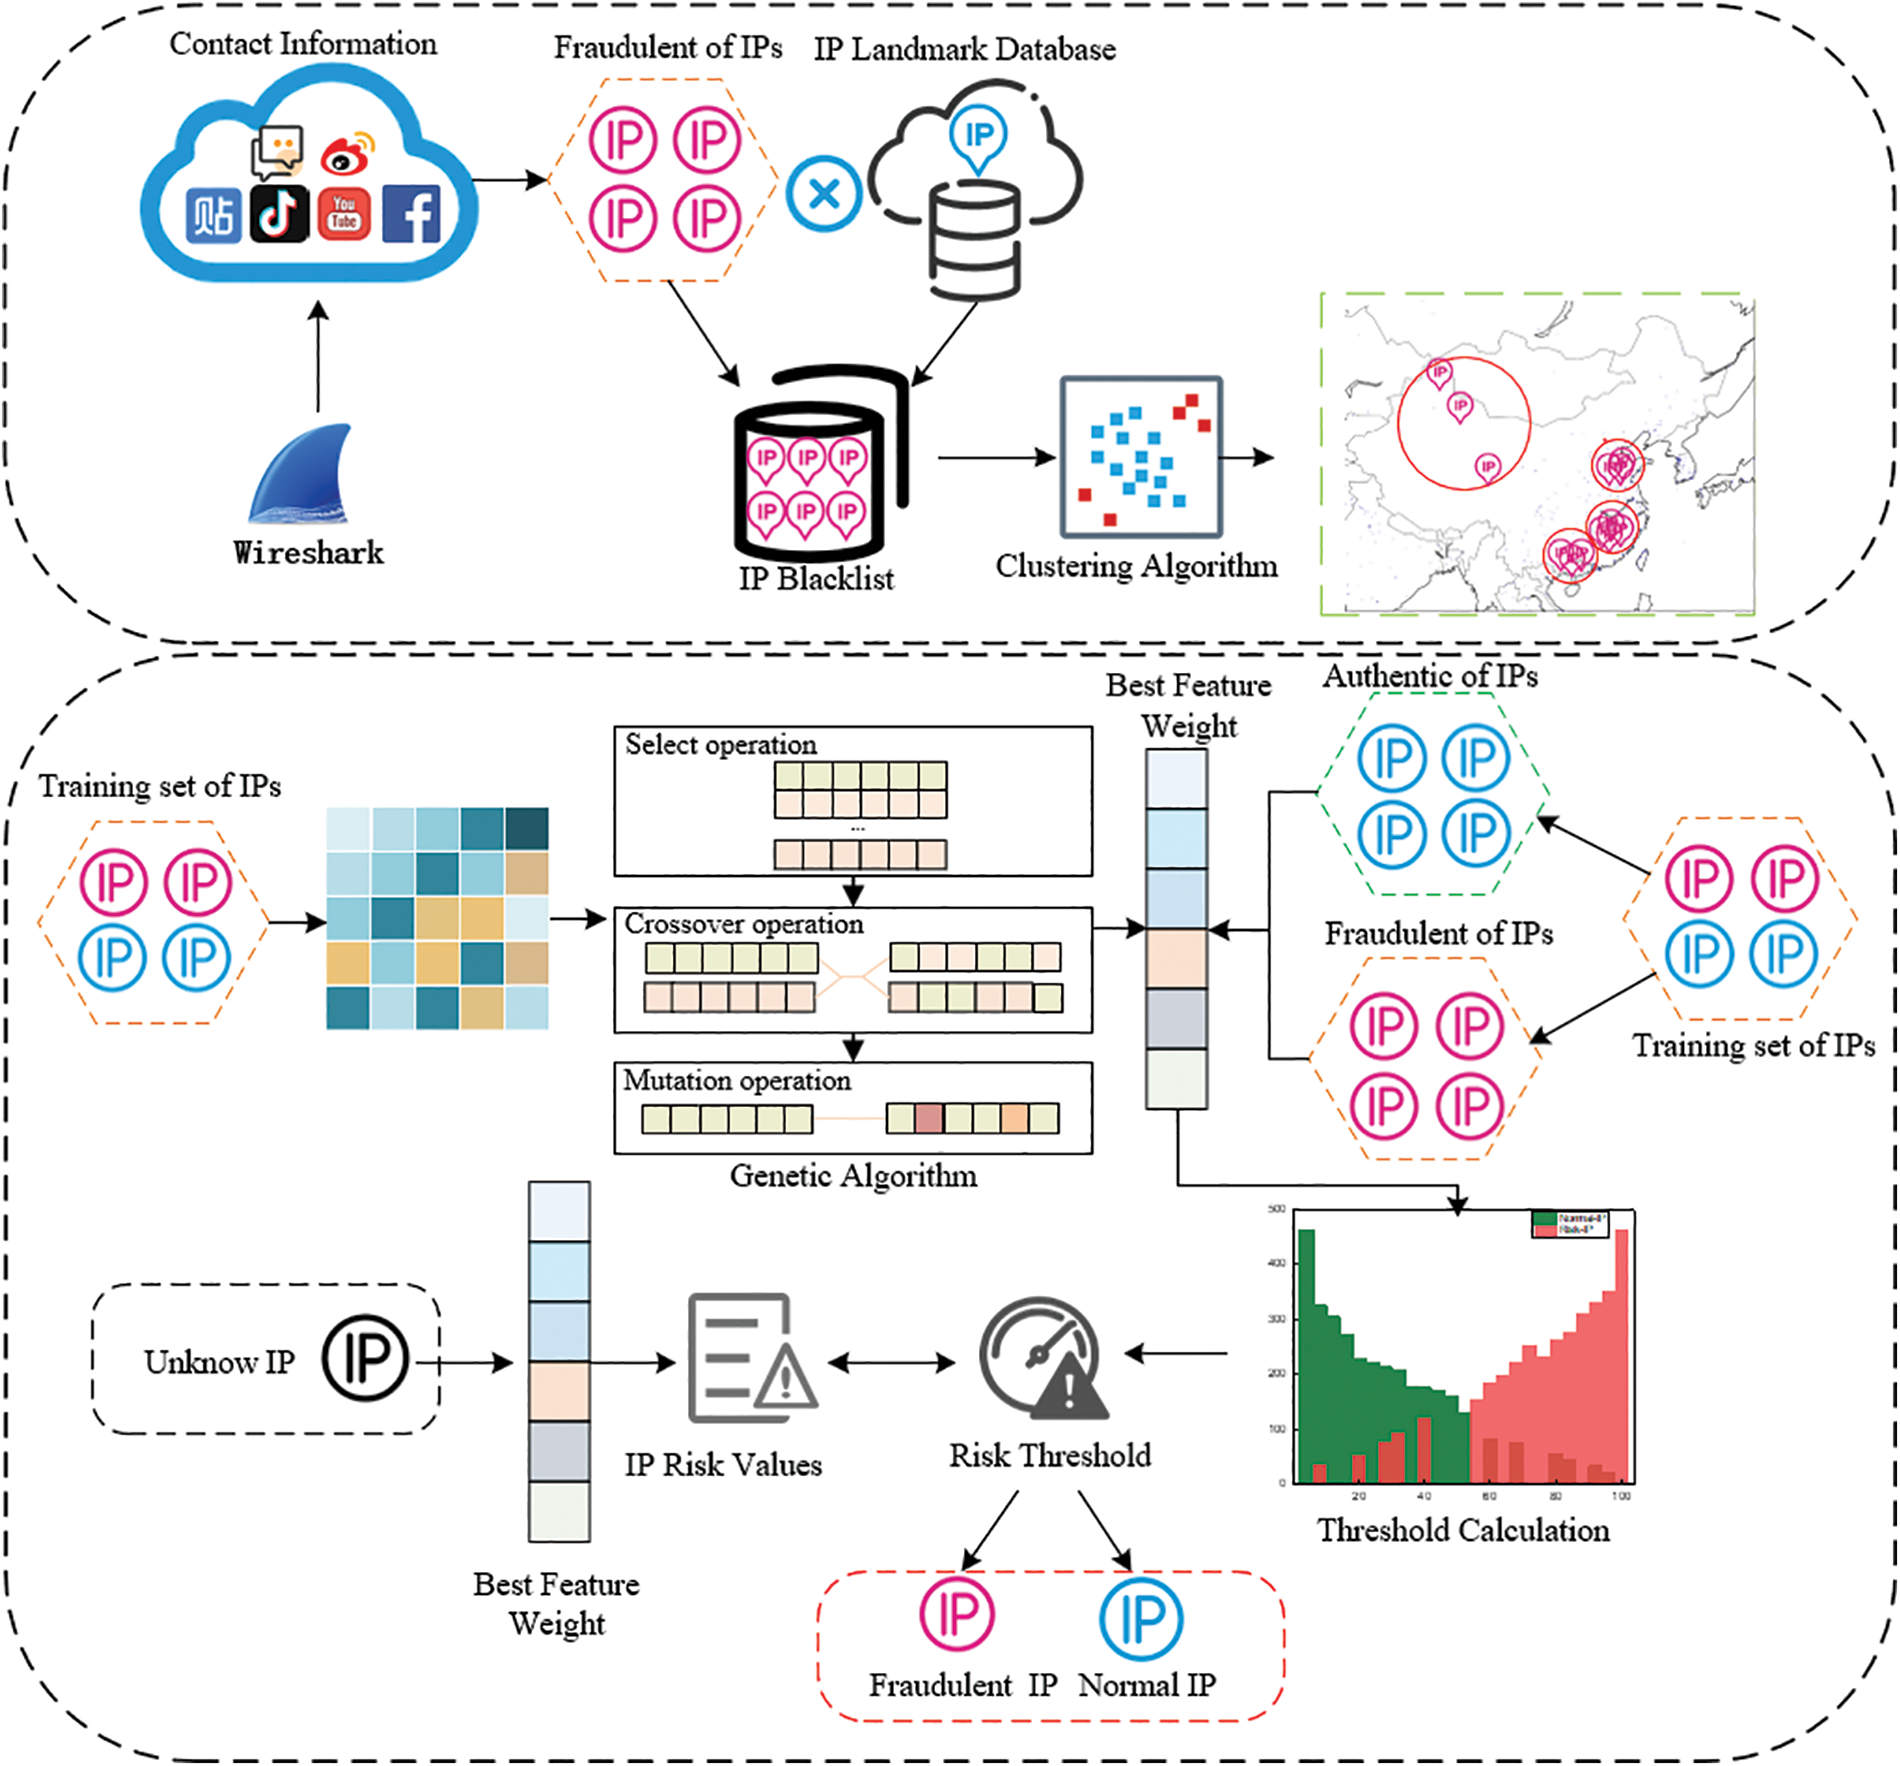
Figure 1: Fraudulent IP identification method based on homology detection
The main steps of the DC-FIPD method are as follows:
Step 1: Data Acquisition: Fraudulent IP data is obtained from various public sources (e.g., postings, microblogs, forums). To ensure data accuracy, screening rules are formulated for preprocessing. The fraudulent IP data is then combined with geographic location information from an IP geolocation database to create a fraudulent IP blacklist database.
Step 2: Suspicious Region Calibration. Based on the aggregation and homology characteristics of fraudulent IPs, the DBSCAN clustering algorithm is used to cluster the fraudulent IPs, obtain the regional distribution of fraudulent IPs, obtain the IP suspicious regions, and identify the potential clusters existing in the suspicious regions. The fraudulent IP dataset consists of IP blacklists. Meanwhile, in order to reduce the influence of abnormal suspicious regions generated by clustering on the results, a suspicious region reduction algorithm is proposed for removing abnormal suspicious regions.
Step 3: Calculation of Feature Weights. The fraudulent IP features set includes whether the IP address is within suspicious area, the autonomous area, and the last route. These features can reflect the degree of influence on the risk value of the IP address, and the genetic optimization algorithm is used to perform selection, crossover, and mutation operations on the fraudulent IP features to determine the weights of the fraudulent IP features.
Step 4: Calculation of IP Risk Value. The IP risk value quantifies the likelihood of an IP being involved in fraud. It is calculated using the weights of fraudulent IP features and the IP features themselves. A threshold for distinguishing fraudulent IPs from normal IPs is determined based on the risk value approximation algorithm. IPs with risk values exceeding this threshold are classified as fraudulent; otherwise, they are classified as normal.
Step 5: Identification of Fraudulent IPs. The identified IP addresses are evaluated by calculating their risk values. IPs are classified according to the risk value threshold to determine if they are fraudulent or normal.
Due to limitations in data sources and delays in data collection, ensuring the validity and real-time nature of data can be challenging with passive collection methods. To address this, this study adopts a proactive approach to collecting fraudulent IP data.
We extract comment and reply data from public channels such as Baidu Posting Bar and Weibo, classifying them into two categories: text data and image data. For text data, regular expressions are used to extract fraudulent contact information from comments and replies. For image data, text is extracted using optical character recognition (OCR) technology, and then processed to extract fraudulent contact information. Our study of comment data from platforms like posting bars and forums reveals that fraud data is more prevalent in comments related to “part-time jobs, beautiful women, same city” compared to other types of comments.
Due to the presence of a significant amount of unusable data in the original contact dataset, there is a considerable additional time cost in the experimental process. To address this, this study formulates specific rules to screen the data. Contact data that meets these rules is stored in the database and users are added in batches. The relevant rules are outlined in Eq. (1).
where
We use Wireshark software to capture the pcap network packets with fraudsters and analyze the network packets to obtain the IP addresses of fraudsters. To prevent fraudsters from using proxy software (such as second dialing or Virtual Private Network) to mask their real IP addresses, we employ the risk portrait identification method [13] to detect whether the IP belongs to a data center. In addition, network entity identification [14] is used to determine whether the IP is from a PC (Personal Computer), Phone, or other devices. By applying these two methods to screen for abnormal IPs, we obtain the user’s real IP address, reduce redundant data, and provide accurate IP data for constructing the IP blacklist, thus reducing the false alarm rate in the experiment.
2.2.3 Construction of Fraudulent IP Blacklists
In constructing the fraudulent IP blacklist, IP location information is determined using IP geolocation technology [15–18]. We query location data from commercial databases such as MaxMind [19], IP2Location [20], and IPIP [21] for each IP address. The obtained IP location data is formatted as follows: IP=<ip|longitude|latitude|country|province|city|risk>.To ensure the accuracy of the IP location data, we validate the geographic location by comparing results from multiple commercial databases [22]. If the location results are consistent across databases, the geographic location of the IP is confirmed. Conversely, if the results differ, the geographic location is deemed unreliable, and the IP is removed from the fraudulent IP blacklist. Details of the specific operations are provided in Table 1.

Between March 2023 and June 2024, we collected 13,369 fraudulent IP addresses and queried one of the IPs listed in Table 1 (113.200.137.89) using IP2Location, IPIP, and MaxMind commercial databases. We found that the location data from IP2Location was inconsistent with the results from IPIP and MaxMind. Therefore, we selected the location data obtained from IPIP and MaxMind as the final IP location results. Based on IP geolocation verification rules, we construct a fraudulent IP blacklist.
2.3 Suspicious Area Calibration
We analyze the fraudulent IPs in the blacklist and observe that their geographical distribution exhibits aggregation and homology [23]. Based on these characteristics, we analyze the address location features of the fraudulent IPs and use a clustering algorithm [24] to group them. This clustering reveals the regional distribution of fraudulent IPs and identifies suspected fraudulent regions, helping to uncover potential fraudulent IPs.
2.3.1 Suspicious Region Acquisition
In this section, we use IP geolocation features and a density optimization-based clustering method, specifically the DBSCAN clustering algorithm, to cluster fraudulent IPs. The DBSCAN algorithm classifies data into core, boundary, and noise points based on the density of data points, determining the clustering results.
First, we extract the latitude and longitude features of IPs from the IP blacklist. Using the DBSCAN algorithm, we cluster these latitude and longitude features. We then identify the core point and the farthest boundary point of each cluster. Each core point serves as the center of a suspicious region, with the distance between the core point and the boundary point defining the radius. This marks multiple IP suspicious regions, representing the geographic areas where fraudulent IPs are likely to exist. Fig. 2 illustrates the schematic diagram of fraudulent IP clustering and the resulting suspicious regions.
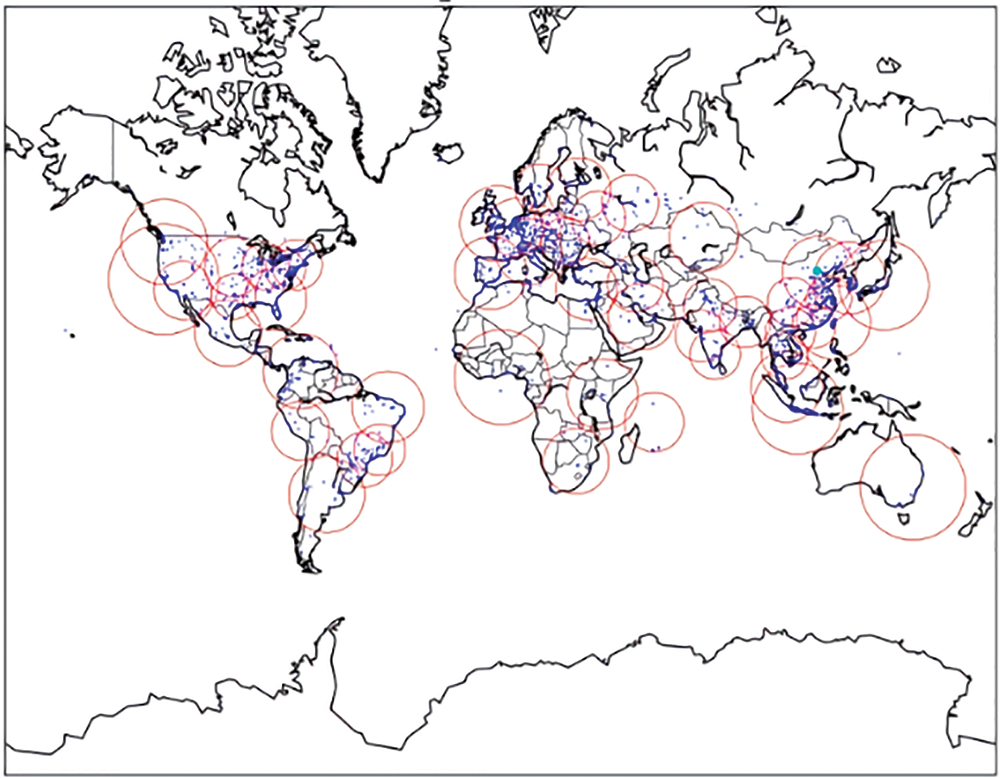
Figure 2: Suspicious areas obtained by DBSCAN clustering (blue dots indicate the location of IPs and red circles indicate suspicious areas)
2.3.2 Suspicious Region Reduction
By analyzing the results of suspicious regions obtained from clustering, we identified two key issues: Larger Suspicious Regions Containing Multiple Smaller Regions: Larger suspicious regions often encompass multiple smaller suspicious regions, leading to a broader and less precise identification area. Dispersion of Data: The dispersion of data can result in discrete points being classified as overly large suspicious regions, which can introduce significant errors between the obtained and actual suspicious regions. To address these issues, the DC-FIPD method proposes a suspicious region reduction algorithm designed to handle abnormal suspicious regions and improve the accuracy of the identified regions.
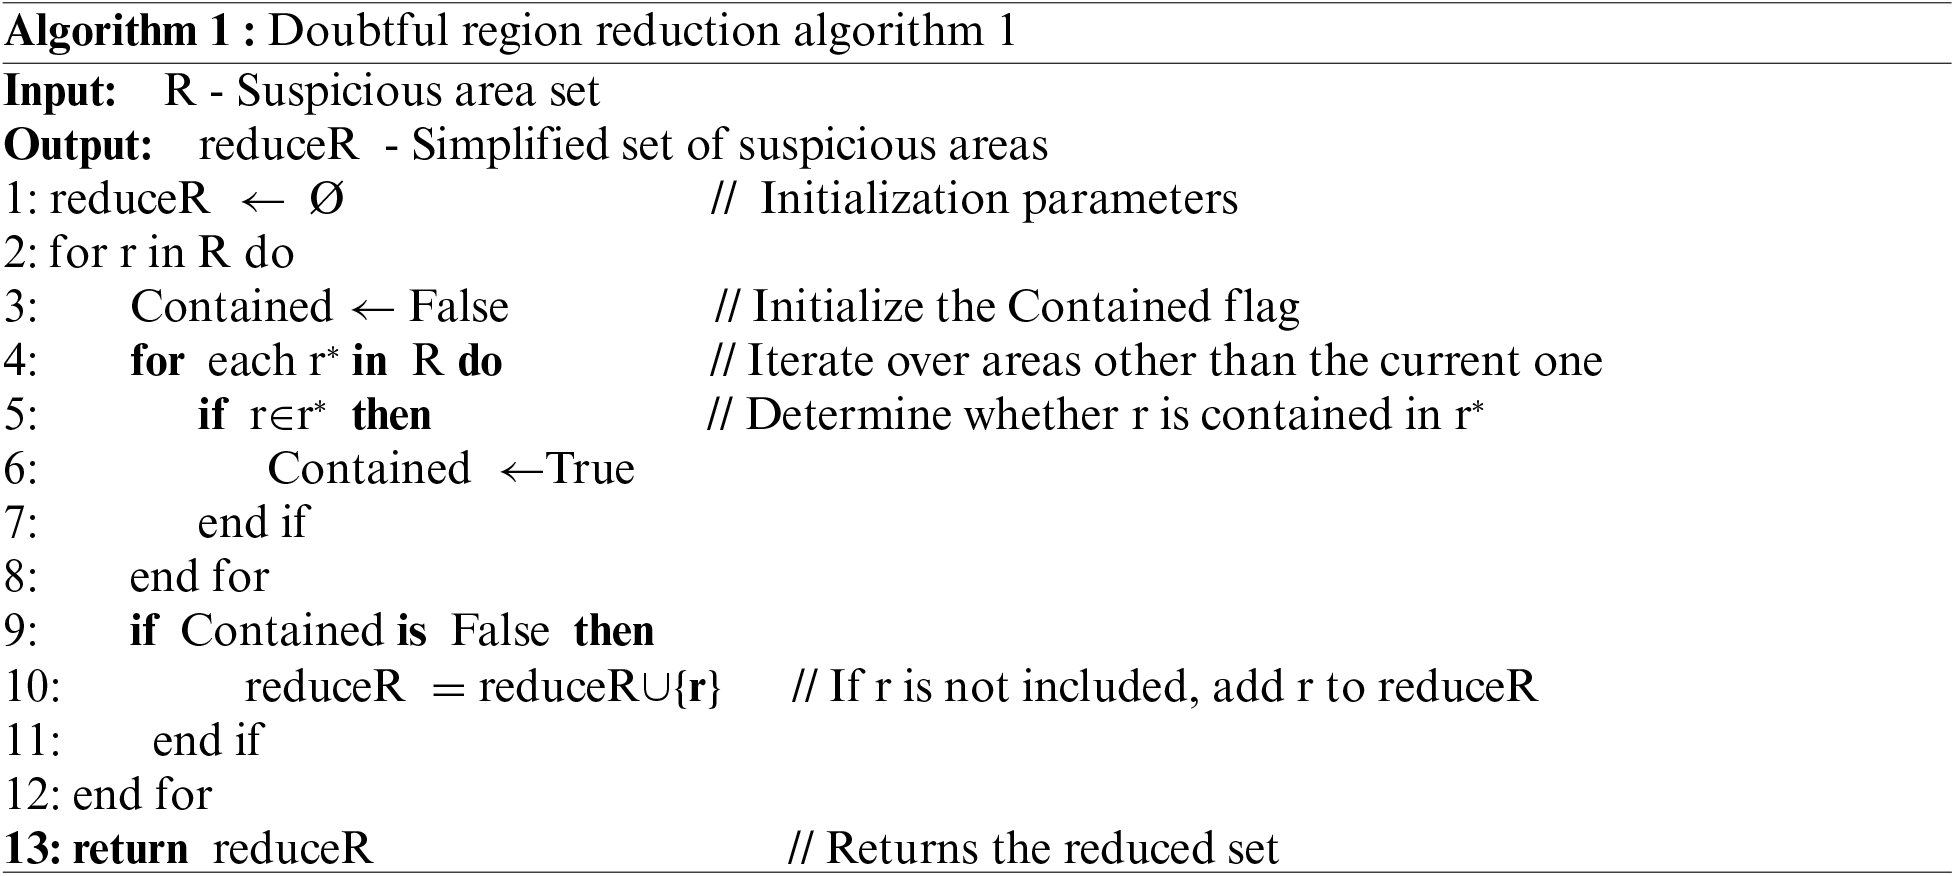
To address the issue of larger suspicious regions containing multiple smaller suspicious regions. Algorithm 1 involves aggregating smaller suspicious regions into a broader superclass region, thereby refining the classification and reducing the complexity of handling multiple overlapping or nested suspicious areas.
To address the problem where data dispersion results in the creation of large anomalous suspicious regions, the region reduction algorithm removes those suspicious regions whose radius exceeds the average radius. Algorithm 2 helps eliminate outliers and refine the accuracy of the suspicious regions by focusing on more representative and consistent areas.
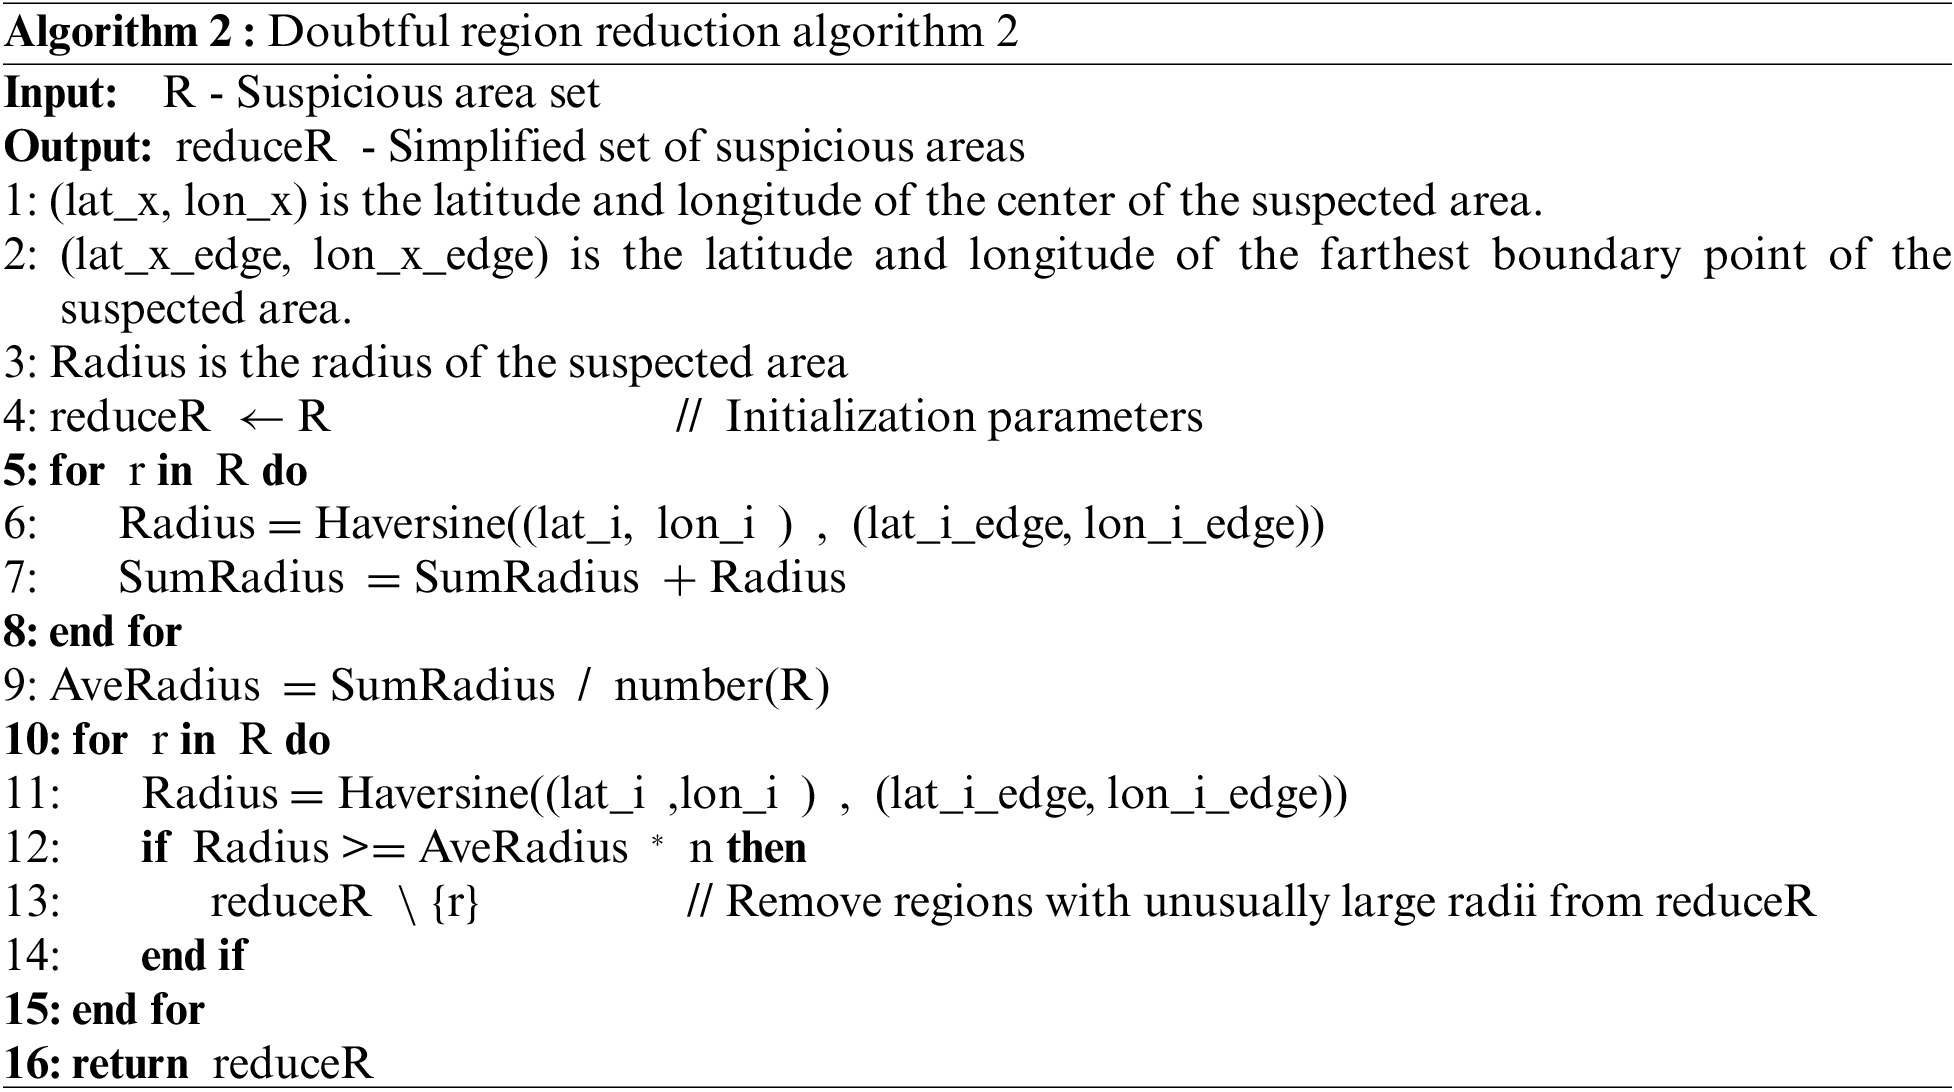
Fig. 3 illustrates the effect of the suspicious reduction algorithm. Assuming that we find a specific cluster of IPs associated with fraudulent activity in a region that contains many IP addresses, we can further narrow the scope of our investigation by subdividing it into smaller regions through the reduction algorithm. Such an approach allows us to locate potential fraudulent IPs more precisely and improve the accuracy of fraudulent IP identification.
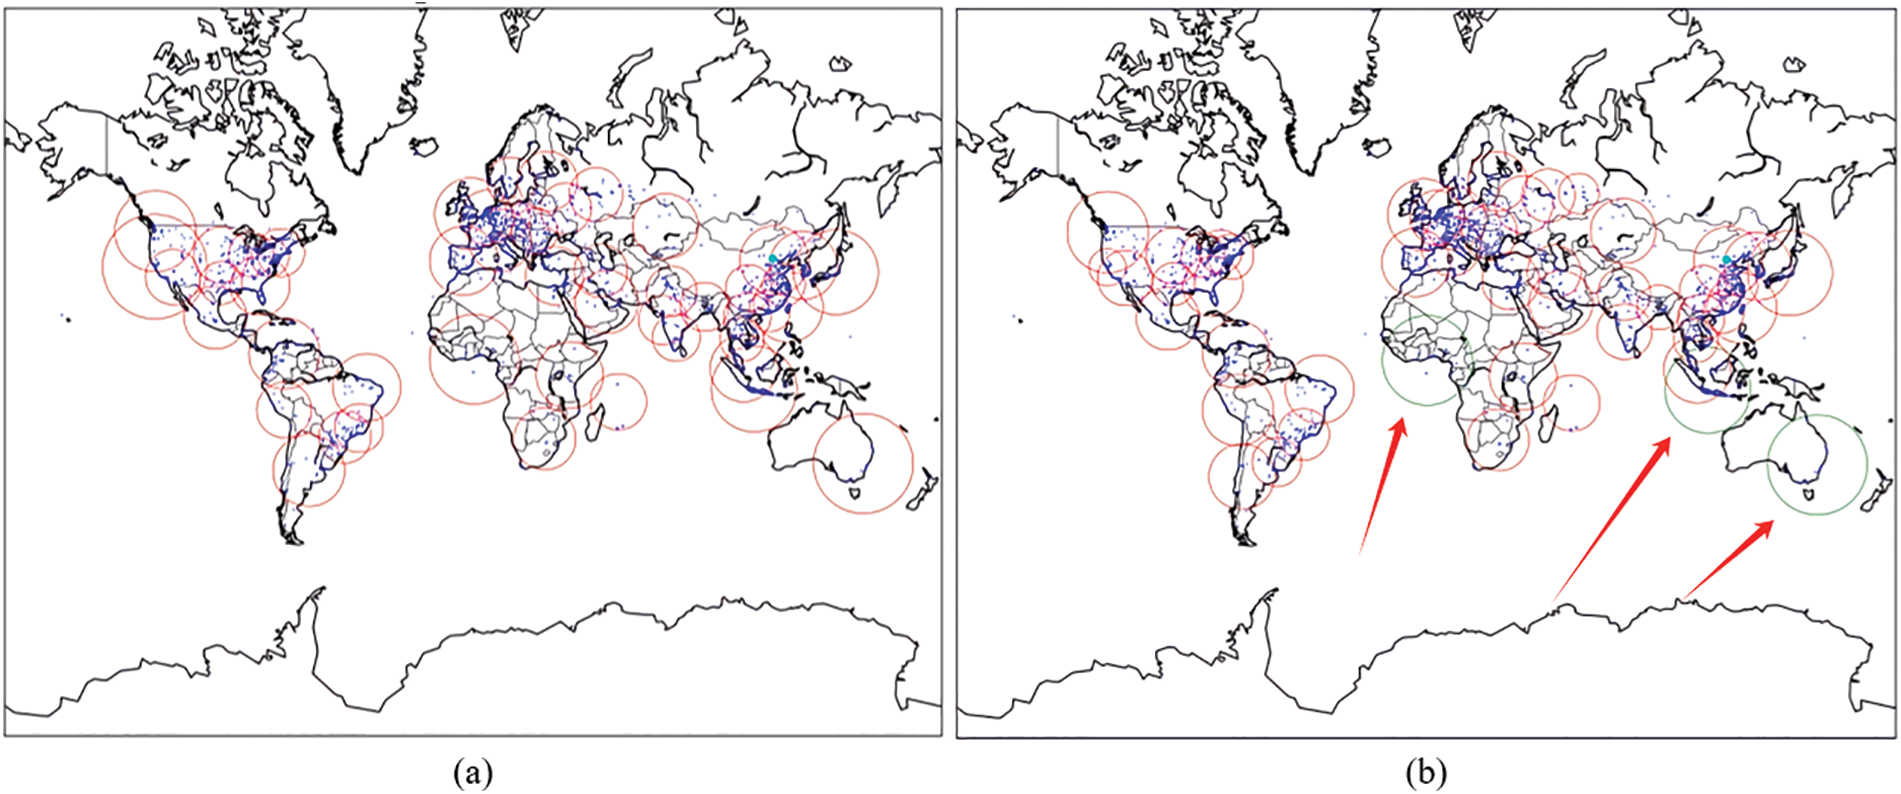
Figure 3: (a) Without using the region reduction algorithm, (b) with the region reduction algorithm (the green areas indicate the deleted suspicious regions)
2.4 Calculation of Feature Weights
In fraudulent IP identification, relying solely on geographic location features can result in a high rate of misjudgment. To address this issue, the DC-FIPD method incorporates additional features to enhance identification accuracy. By evaluating the risk level of IPs more comprehensively, the DC-FIPD method reduces misjudgment rates and improves overall identification accuracy.
Although clustering IPs into blacklists has yielded some results in identifying IP types, this approach may not be practical in real-world situations, as it often leads to a high false alarm rate. This is because many legitimate IPs located in suspicious regions are misclassified as fraudulent. To address this, we sought to extract additional features of fraudulent IPs.
Initially, we considered extracting features related to malicious attack IPs, such as historical behaviors, network traffic, domain-related information, and Whois information. However, since fraudulent IPs often belong to more stationary personal computers (PCs) and mobile phones, obtaining these features is challenging or even infeasible. Thus, we did not use the characteristics of malicious attack IPs.
Upon further analysis, we identified two crucial features for improving fraudulent IP identification accuracy: the Autonomous System Number (ASN) and the last-hop feature obtained from route tracing.
• AS Autonomous System Number: An ASN is a unique identifier assigned to Internet Service Providers (ISPs) by the Internet Assigned Numbers Authority (IANA). Each ISP has a unique ASN used to identify its location and network range on the Internet. The ASN provides valuable information about the ISP’s ownership and administration, which is crucial for identifying fraudulent IPs. By checking the ASN, we can determine whether an IP address belongs to a trusted ISP or is associated with known fraud.
• Last-Hop Feature: The last hop refers to the router or network device closest to the target IP address. In network communication, packets traverse multiple nodes to reach the target IP, with the last-hop node being the exit point from the source network and entry point to the target network. Analyzing the last hop provides insights into the network type (e.g., enterprise network, data center network) and geographic location, which helps in assessing the trustworthiness and potential risk of the IP address.
In this paper, IP features are modeled with the following final selected features:
• IP: Indicates whether the IP is within the suspicious area generated by clustering. If the IP is in the suspicious area, this feature is set to 1; otherwise, it is set to 0.
• Clustering Result: Represents the percentage of the Autonomous System (AS) number of the target IP among the AS numbers of all blacklisted IPs.
• Autonomous Area Percentage: Denoted as the percentage of the last-hop routing IPs of the IPs probed by the probes among all the blacklisted IPs.
• Last Hop Routing IP Percentage: Denoted as the percentage of last-hop routing IPs of the IPs probed by the probes among all the blacklisted IPs.
• Fraudulent IP Indicator: Indicates whether the IP is a fraudulent IP. If it is a fraudulent IP, this feature is set to 1; otherwise, it is set to 0.
2.4.3 Feature Weight Calculation Based on Genetic Optimization Algorithm
To obtain the last-hop IPs, the experiment utilizes a server in Heyuan, Guangdong Province, to perform route tracing of IPs in the IP blacklist using Scamper software. This process yields the last-hop IP features. Subsequently, we query the Autonomous System region information for these IPs through the APNIC Whois database [25]. We then construct the training set, which includes both fraudulent and normal IPs. Normal IPs are sourced from governmental organizations and universities, while fraudulent IPs are drawn from previously collected fraudulent IP data. The suspicious region, ASN, and last-hop features of IPs in the training set are extracted using the same methods applied to the IP blacklist. We calculate the occurrence ratio of ASN and last-hop data features in the training set relative to the IP blacklist to construct the fraudulent IP features.
We determine the optimal weights for each feature and calculate the IP risk value using Eq. (3).
where
In this study, the calculation of feature weights based on the genetic optimization algorithm is illustrated in Fig. 4.
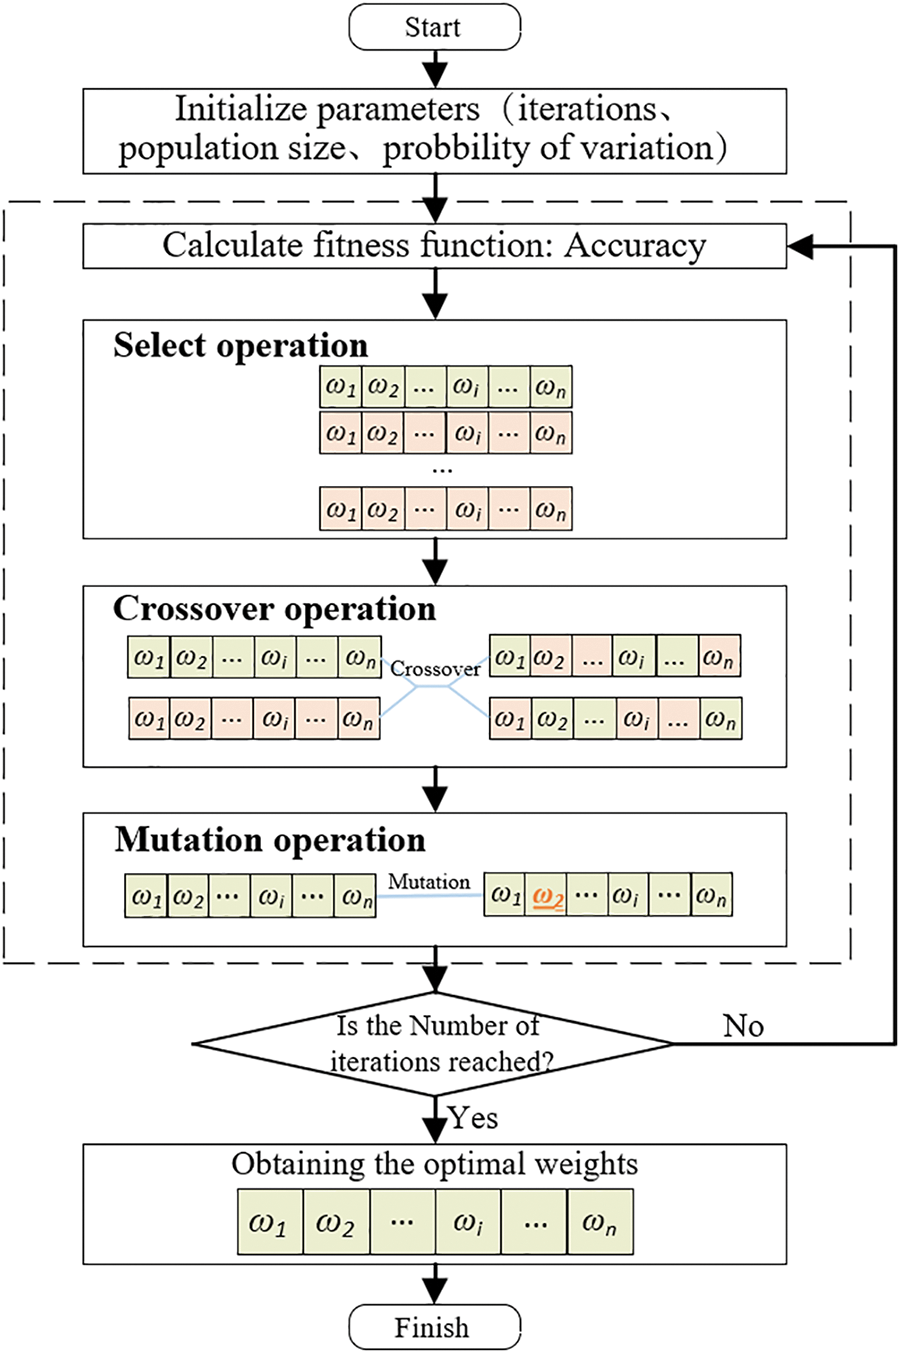
Figure 4: Flowchart of genetic optimization algorithm for solving optimal weights of features
The execution of the genetic algorithm begins with parameter initialization. The initial population consists of multiple individuals, each representing a potential solution—specifically, a combination of feature weights in this study [27]. The initial population is typically generated randomly but can also be initialized using prior knowledge to expedite convergence. The population size is determined by balancing computational efficiency and search space diversity. The fitness function plays a crucial role in evaluating the quality of each individual. In this study, the accuracy of IP identification is used as the fitness function, with the goal of maximizing this metric. The fitness function evaluates the performance of each weight combination in identifying fraudulent IPs, where higher accuracy corresponds to a better fitness score.
Crossover operations are critical for generating new individuals in the genetic algorithm. This process involves exchanging parts of the genes (weight coefficients) between two parent individuals to produce new offspring. In this study, a real-valued encoding scheme is employed, where each feature weight coefficient is represented as a real number. A higher crossover rate helps to increase the diversity of the search space but must be balanced to avoid negatively affecting well-adapted solutions. Mutation operations introduce further diversity by randomly altering some genes in the individuals. A lower mutation rate ensures stability of the generated individuals while preventing the algorithm from falling into local optima.
The genetic optimization algorithm iteratively applies selection, crossover, and mutation operations to evolve the population towards an optimal solution. This iterative process continues until a predefined number of generations is reached or convergence is observed, meaning that fitness improvements are no longer significant. This iterative process ensures both the efficiency and accuracy of the fraud detection method.
Parameter Settings: The specific parameter settings for the genetic optimization algorithm in this study are as follows:
Population Size: Set to 50 individuals. This size is chosen to maintain diversity within the population while avoiding excessive computational overhead.
Max Generations: Set to 20 generations. Experimental validation shows that this number of generations allows the algorithm to converge within a reasonable timeframe.
Crossover Rate: Set to 0.8, meaning 80% of individuals undergo crossover to produce offspring. This higher rate helps accelerate the evolution of the population.
Mutation Rate: Set to 0.01, indicating that 1% of genes will undergo random mutations in each generation. This lower rate maintains individual stability while introducing moderate diversity to avoid local optima.
Selection Pressure: Implemented through a roulette-wheel selection method, where individuals with higher fitness scores have a greater chance of being selected.
Ultimately, the optimal weight coefficients
2.5 Identification of Fraudulent IPs
The core problem of the fraudulent IP identification method lies in the determination of the IP risk value threshold and the IP type identification [28].
2.5.1 Calculation of Value-at-Risk Threshold
First, the DC-FIPD method computes the features of the IPs in the training set, including
Here,
2.5.2 Identification of IP Types
For the IP to be identified, the DC-FIPD method calculates the product of its features and the optimal feature weights to obtain the risk value of the target IP. Based on the IP risk value thresholds derived from the training set, the IP is categorized and identified as either fraudulent or normal. Algorithm 3 is the detailed steps for IP type identification.

Where,
3 Experimentation and Evaluation
To verify the effectiveness of the fraudulent IP identification algorithm, we conducted experiments on IP aggregation analysis, clustering algorithm selection, and suspicious region reduction, followed by an analysis of the experimental results. This section addresses the following questions regarding the method: (1) the rationale behind fraud IP aggregation; (2) the impact of different parameter pairs on the accuracy of the fraud IP identification algorithm; and (3) the accuracy of the fraudulent IP identification algorithm used in this method.
After a year of continuous data collection, we have accumulated a dataset of 13,369 fraudulent IP addresses. To obtain a dataset of normal IP addresses, we conducted searches on the domain names of governments, schools, and major companies worldwide. Through DNS, we performed reverse queries to obtain the corresponding IP address data. Eventually, we collected 100,000 normal IP addresses. Considering that the number of normal IPs globally far exceeds the number of fraudulent IPs, our experiments utilized the entire fraudulent IP dataset from the blacklist, as well as n (n > 1) times the number of normal IPs, to form the training set.
To evaluate the accuracy of our method, we randomly selected 30% of the data from the training set as the test set. The retained validation method was applied to validate the test set. The number of IPs in the IP blacklist, training set, and test set are summarized in Table 2.

Parameter setting: firstly, during data preprocessing, only IP data with the existence of more than 2 IPs with the same location data are retained. In all experiments, ablation experiments are used to train the algorithms by adjusting some parameters to ensure good stability of the algorithms.
The DBSCAN clustering method used in the paper is implemented using the Scikit-Learn module. The input to the DBSCAN algorithm is a geolocation vector based on the fraudulent IPs, where the neighborhood radius
Evaluation metrics: To evaluate the success rate of the experimental method under different parameters, we use multiple metrics to evaluate the performance of the method. One of them is
The following symbols are used in Eqs. (7–10):
We conducted experiments on global fraudulent IP homology analysis, focusing primarily on the in-depth analysis of geographic location clustering of fraudulent IPs.
Fig. 5 illustrates the global distribution of the collected fraudulent IPs. The blue dots represent the fraudulent IPs, while the red circles indicate the suspicious regions of the IPs obtained through the clustering algorithm. It is evident that most of the fraudulent IPs are concentrated in specific regions. This concentration can be attributed to the tendency of fraudulent individuals to aggregate and utilize IP addresses located within similar network segments. Furthermore, the spatial aggregation of fraudulent IPs follows a clear pattern due to the allocation practices of the Internet Addressing Network Allocation (INNA) organization. INNA typically assigns similar IP segments to the same regions when allocating IP ranges.
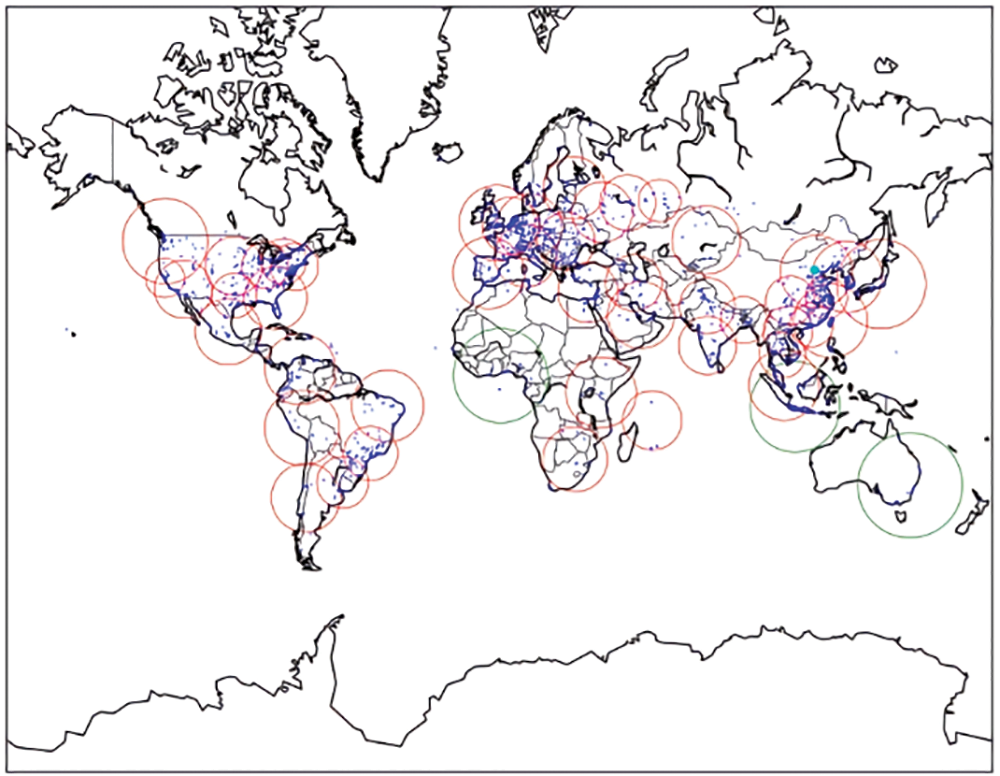
Figure 5: Fraud IP aggregation analysis
To delve deeper into the global homology of fraudulent IP, we focus on the distribution of these IPs across different countries. In Fig. 6, we present the number of fraudulent IPs collected from the top 10 countries globally. This figure clearly illustrates that certain countries exhibit higher levels of fraudulent IP activity, helping us pinpoint key areas of concern. Notably, the United States and China have significantly more fraudulent IP than other countries, with the United States accounting for 30.5% and China for 11.7%. Together, these two countries comprise one-third of the total fraudulent IP, indicating a higher concentration of online fraudulent activities in these regions. However, further analysis of the IPs in the United States reveals that some fraudulent IPs have not been detected by the IP risk profile, and a portion of them are still proxy IPs, contributing to the higher number of U.S. IPs.
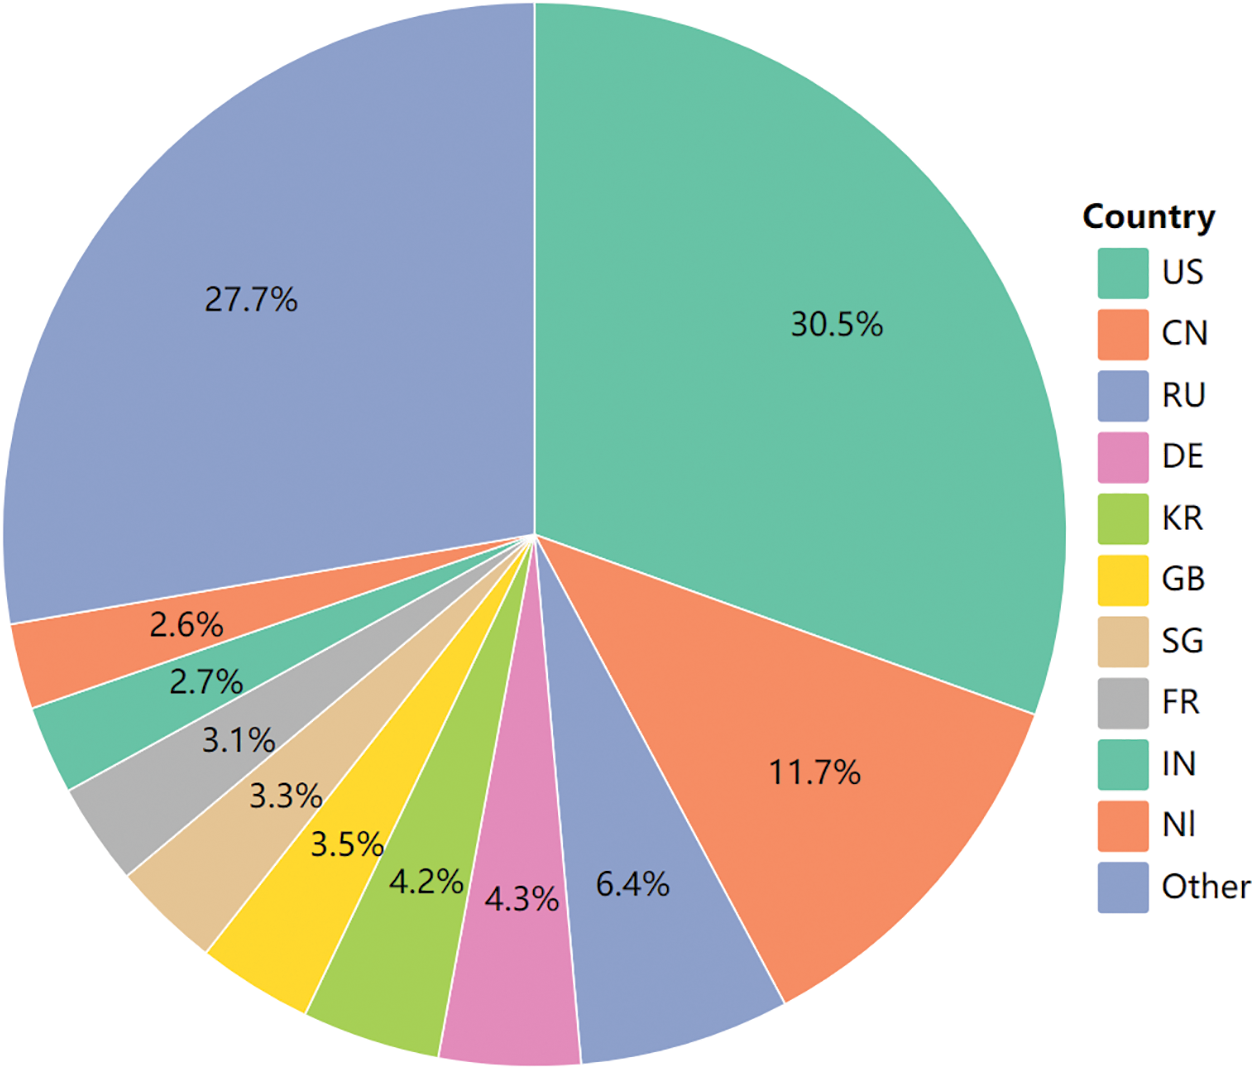
Figure 6: Percentage of State-Level Fraud IP
3.4 Comparison of Clustering Methods
The DC-FIPD method assesses the effectiveness of different clustering methods for fraudulent IP clustering by comparing them. The evaluated clustering methods include the K-Means algorithm, the Gaussian Mixture Model (GMM) algorithm, and the DBSCAN algorithm. Through this comparison, a suitable clustering algorithm is selected for the method. Figs. 7 and 8 present the IP identification accuracy of each clustering method under different parameter combinations.
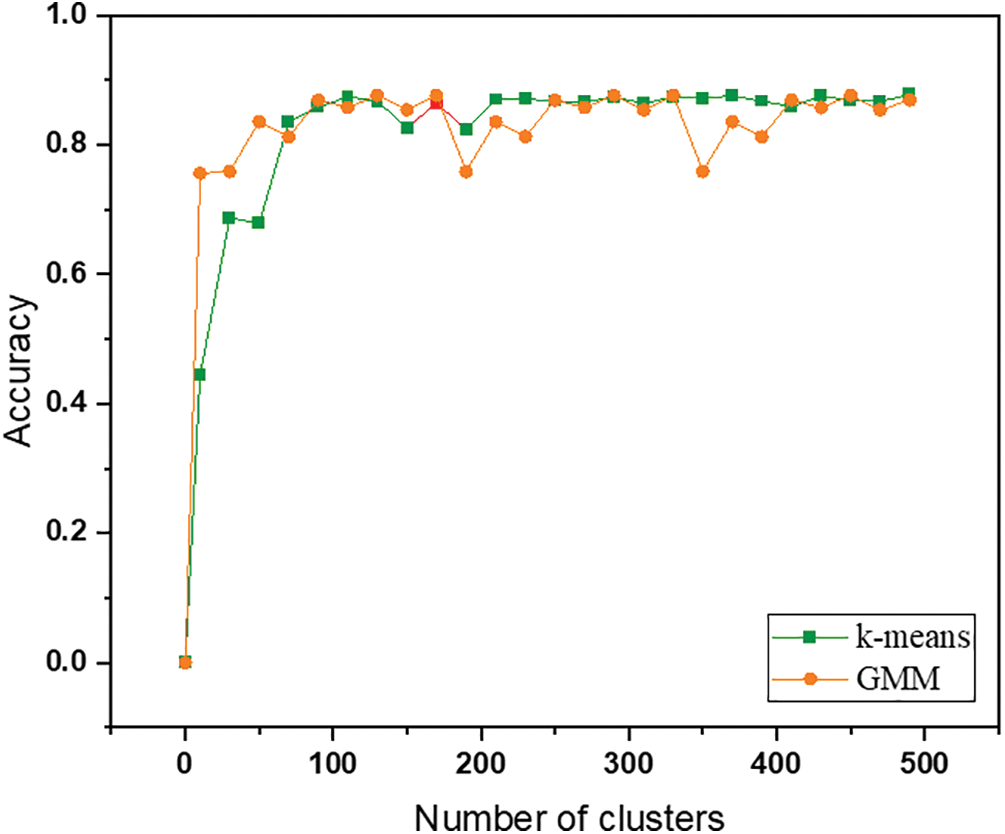
Figure 7: The IP identification accuracy for different numbers of clusters for K-Means and GMM
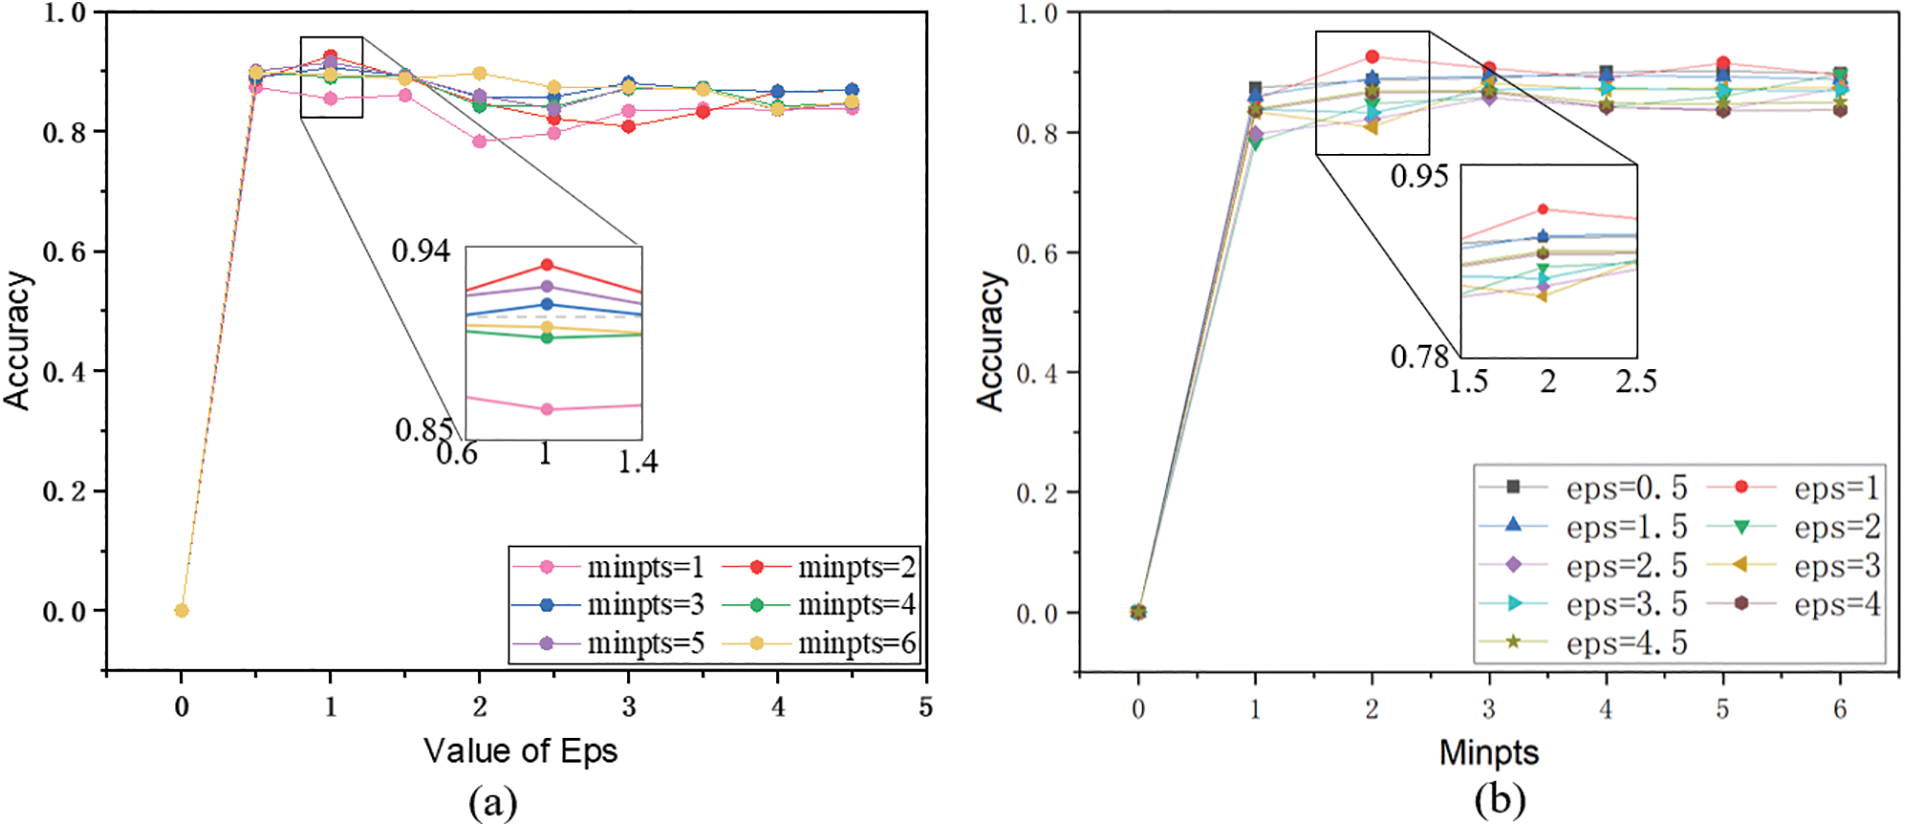
Figure 8: Effect of different parameters of the DBSCAN algorithm on the accuracy of the DC-FIPD method, where (a) is the effect of different minpts parameters and (b) is the effect of different eps parameters
From Fig. 7, it is evident that the IP identification accuracy of both the K-Means algorithm and the GMM algorithm increases as the number of clustered clusters grows, eventually stabilizing within a certain range. Specifically, the K-Means algorithm achieves the highest accuracy of 87.42% when the number of clusters is around 300. On the other hand, the GMM algorithm performs best with an accuracy of 87.64% when the number of clusters is approximately 320.
Fig. 8 demonstrates the impact of different
The interplay between
Table 3 provides a comparison of the average identification results for these three clustering methods under different parameters. The average identification accuracy for the K-Means, GMM, and DBSCAN algorithms is 83.22%, 82.74%, and 86.64%, respectively. In addition to accuracy, the DBSCAN algorithm significantly outperforms the other two methods in terms of precision (86.08%) and recall (45.24%), resulting in a higher F1-score (59.31%). These comprehensive experimental results indicate that the DBSCAN algorithm is better suited for this method.

3.5 Experimental Effect of Simplicity in Suspicious Areas
The DC-FIPD method utilizes clustering techniques to cluster fraudulent IPs and obtain their regional distribution. To improve the accuracy of identifying suspicious IP regions and eliminate regions with anomalies, this method incorporates two reduction Algorithms: Reduction Algorithm 1 and Reduction Algorithm 2.
Fig. 9 and Table 4 present a comparison of IP identification accuracy before and after employing the reduction algorithms. Without applying any reduction algorithm, the IP identification accuracy is 83.28%. After incorporating Reduction Algorithm 1 and Reduction Algorithm 2 separately, the accuracy improves to 84.90% and 83.36%, demonstrating an enhancement in IP identification accuracy with both algorithms. Notably, when both reduction algorithms are applied simultaneously, the method achieves the highest average identification accuracy of 86.64%. In addition, the combination of both algorithms significantly improves precision, recall, and F1-score to 86.08%, 45.24%, and 59.31%, respectively. These results validate the effectiveness of the reduction algorithms in substantially improving the accuracy and overall performance of fraudulent IP identification.
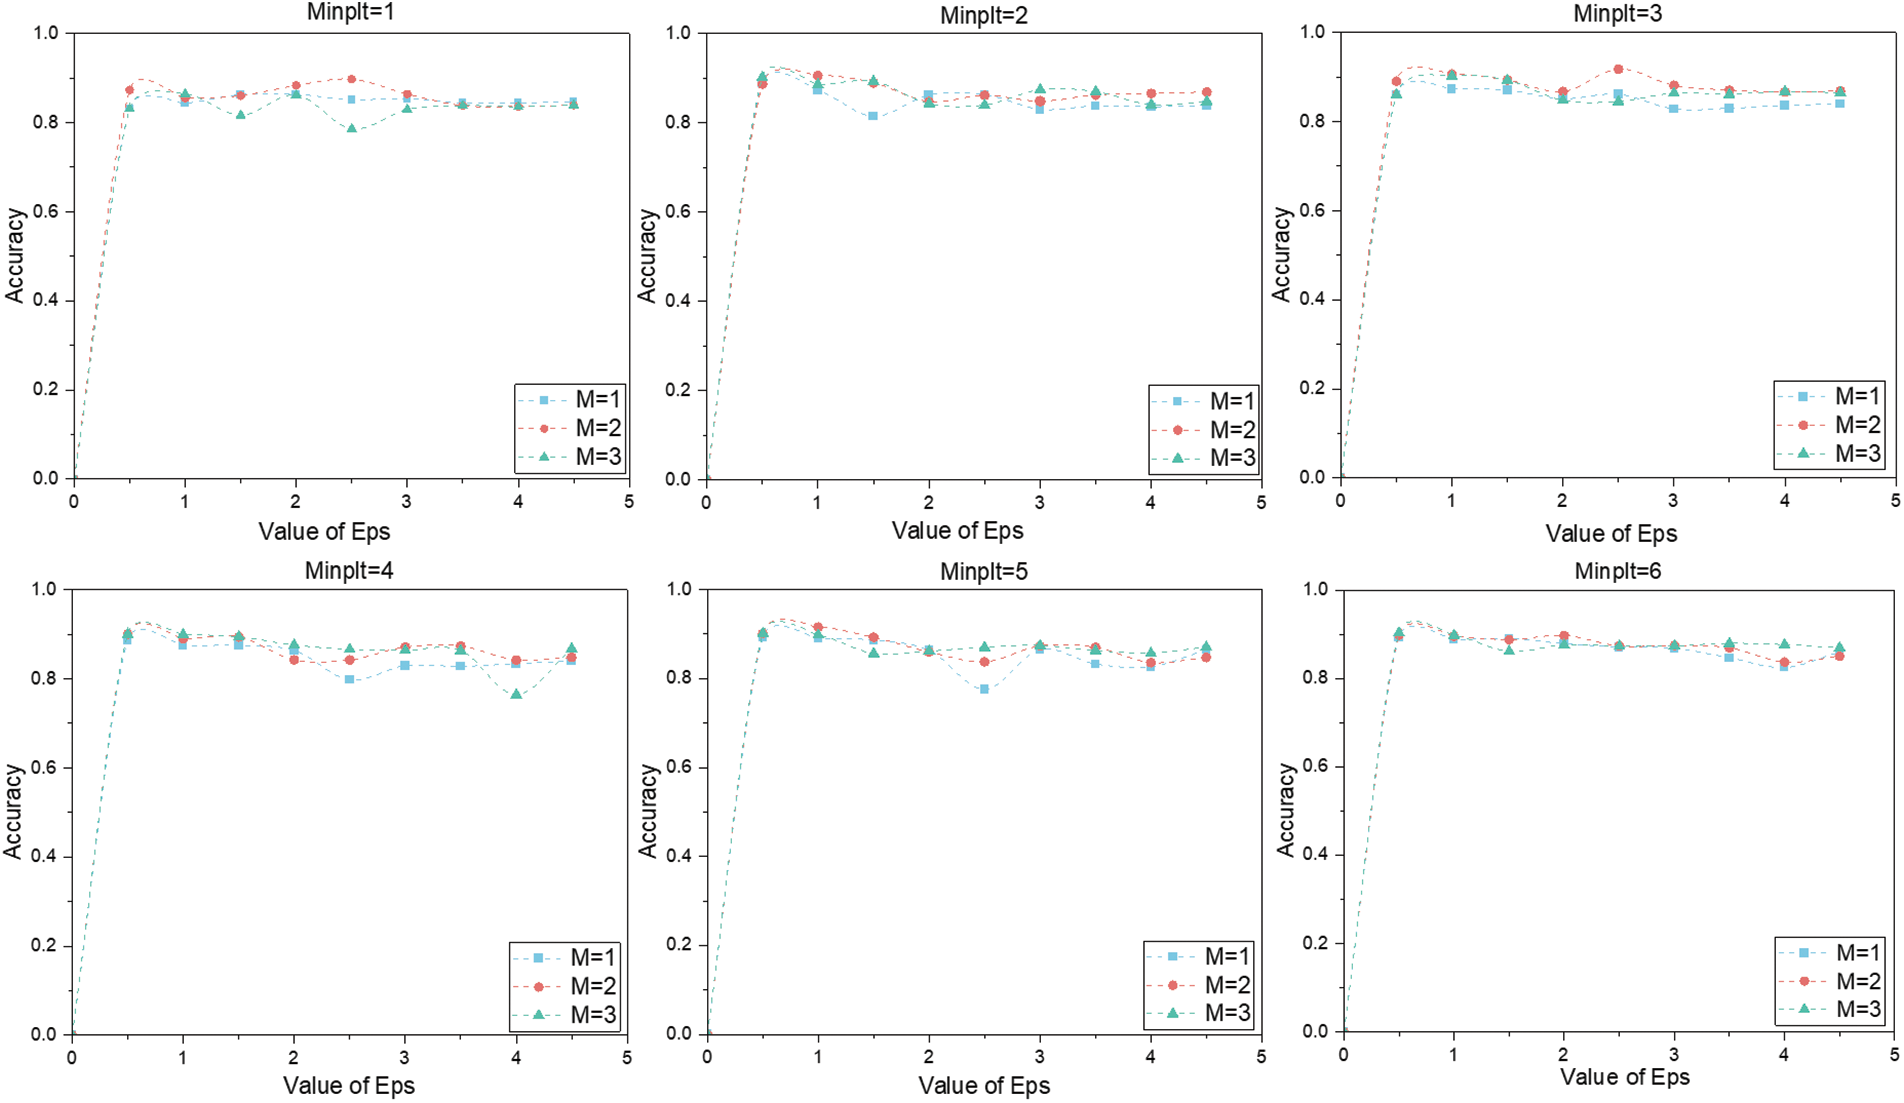
Figure 9: IP identification accuracy at different values of M

To investigate the impact of dataset size on the DC-FIPD method, we conducted experiments by randomly deleting or modifying features and deleting a portion of the data in the IP blacklist. The purpose was to evaluate the stability of the DC-FIPD method under different scenarios, with data deletion and modification ratios of 0%, 5%, 10%, and 15%. Accuracy was used as the evaluation metric, and the experimental results are summarized in Table 5.

In the case of the original dataset, the identification accuracy demonstrated minimal impact during the initial stages as the percentage of data deletion increased. However, as data deletion surpassed a certain threshold, the identification accuracy for fraudulent IPs exhibited a notable downward trend. Specifically, a 15% data deletion had the most substantial impact on the experimental results, leading to a decrease in average accuracy to 85.30%. In contrast, a 5% data deletion had a relatively minor impact, resulting in only a 0.44% decrease in identification accuracy compared to the original dataset.
Beyond accuracy, the impact of data deletion on other performance metrics, including precision, recall, and F1-score, was also evaluated. For instance, with no data deletion, the DC-FIPD method achieved a precision of 86.08%, recall of 45.24%, and an F1-score of 59.31%. As data deletion increased, these metrics showed varying degrees of degradation:
With a 5% data deletion, precision slightly decreased to 85.71%, and with a 10% data deletion, it further dropped to 84.59%. The most significant decrease in precision occurred with a 15% data deletion, where it fell to 79.13%. This reduction in precision suggests that the model becomes less capable of correctly identifying fraudulent IPs as the dataset size diminishes. Recall, which measures the model’s ability to capture all relevant fraudulent IPs, experienced a smaller decrease compared to precision. Initially, the recall was 45.24% with no data deletion. This metric slightly decreased to 44.33% with a 5% data deletion and to 44.50% with a 10% data deletion. A 15% data deletion, however, led to a more noticeable drop in recall to 43.65%. The relatively stable recall with moderate data deletion suggests that the model maintains a fairly consistent ability to identify fraudulent IPs, even with some data loss.
The F1-score, which is the harmonic mean of precision and recall, demonstrated a similar pattern. Initially, the F1-score was 59.31% with no data deletion. This score decreased to 58.43% with a 5% data deletion and to 58.31% with a 10% data deletion. A 15% data deletion had a more significant impact, reducing the F1-score to 56.26%. The decrease in F1-score indicates that both precision and recall are affected by data deletion, leading to a general decline in the model’s overall performance.
These findings suggest that while the accuracy of the DC-FIPD method is closely linked to the quantity of available data, it is not the only metric that is impacted by data deletion. Precision, recall, and F1-score also experience degradation, with precision being particularly sensitive to data loss. In scenarios with significant data loss or smaller datasets, the method’s ability to maintain high performance across all these metrics is compromised. Therefore, for optimal fraudulent IP identification, it is crucial to ensure the availability of a sufficiently large and complete dataset.
To mitigate network fraud incidents and accurately assess the IP risk and category of IPs, we propose the DC-FIPD method. This method is based on homology detection and aims to identify fraudulent IPs effectively. The DC-FIPD method employs a clustering algorithm to calibrate the range of suspicious IP areas using a pre-existing fraudulent IP blacklist. It selects a set of potentially fraudulent IP features, processes the feature data, and utilizes a genetic optimization algorithm to calculate the weights of these features specific to fraudulent IPs. Ultimately, the method determines the risk value of IPs, enabling the identification of IP types. The DC-FIPD method addresses the challenge of low identification accuracy resulting from the difficulty in identifying potential fraudulent IPs and the imbalance in the allocation of feature weights in the network. It offers stability even in datasets with missing or modified data, demonstrating the superiority of its approach. However, the DC-FIPD method does not fully resolve the issue of high false positive rates. High false positive rates can lead to resource wastage, security vulnerabilities, and a subsequent decline in the quality of the security system’s services. This can result in privacy breaches and ultimately erode user trust. In future research work, we plan to utilize the historical IP risk value and combine them with potential IP features such as time change and IP activity, to realize dynamic and real-time IP risk value calculation and IP type identification, while reducing the impact of false positives on users.
Acknowledgement: The authors wish to express their appreciation to the reviewers for their helpful suggestions which greatly improved the presentation of this paper.
Funding Statement: This research was funded by the National Natural Science Foundation of China under Grant No. 62002103, Henan Province Science Foundation for Youths No. 222300420058, Henan Province Science and Technology Research Project No. 232102321064, Teacher Education Curriculum Reform Research Priority Project No. 2023-JSJYZD-011.
Author Contributions: The authors confirm contributions to the paper as follows: study conception and design: Yuanyuan Ma, Ang Chen, and Ruixiang Li; data collection: Ang Chen, Cunzhi Hou, and Ruixia Jin; analysis and interpretation of results: Yuanyuan Ma, Ang Chen, and Jinghui Zhang; draft manuscript preparation: Yuanyuan Ma, and Ang Chen. All authors reviewed the results and approved the final version of the manuscript.
Availability of Data and Materials: In this study, we used a public dataset, which can be downloaded from the website: https://github.com/chenang520/DC-FIPD (accessed on 10 December 2024).
Ethics Approval: Not applicable.
Conflicts of Interest: The authors declare that they have no conflicts of interest to report regarding the present study.
References
1. Y. Huang et al., “Detect malicious IP addresses using cross-protocol analysis,” in 2019 IEEE Symp. Ser. Comput. Intell. (SSCI), Xiamen, China, 2019, pp. 64–672. doi: 10.1109/SSCI44817.201. [Google Scholar] [CrossRef]
2. J. Liu, B. Rahbarinia, R. Perdisci, H. Du, and L. Su, “Augmenting telephone spam blacklists by mining large CDR datasets,” in Proc. 2018 Asia Conf. Comput. Commun. Secur. (ASIACCS ’18), New York, NY, USA, 2018, pp. 273–284. doi: 10.1145/3196494.3196553. [Google Scholar] [CrossRef]
3. UNSPAM, “Project Honeypot,” Accessed: Jul. 15, 2024. [Online]. Available: https://www.projecthoneypot.org [Google Scholar]
4. S. Linford et al., “Spamhaus,” Accessed: Jul. 15, 2024. [Online]. Available: https://www.spamhaus.org [Google Scholar]
5. H. Guo and J. Heidemann, “IP-based IoT device detection,” in Proc. 2018 Work. IoT Secur. Priv. (IoT S&P ’18), New York, NY, USA, 2018, pp. 36–42. doi: 10.1145/3229565.3229572. [Google Scholar] [CrossRef]
6. N. Hu, G. We, W. Huang, and Y. Yang, “The metric of bulk repeated call detection,” in 2010 3rd IEEE Int. Conf. Broadband Netw. Multim. Techn. (IC-BNMT), Beijing, China, 2011, pp. 1192–1196. doi: 10.1109/ICBNMT.2010.5705278. [Google Scholar] [CrossRef]
7. H. Esquivel, A. Akella, and T. Mori, “On the effectiveness of IP reputation for spam filtering,” in 2010 Second Int. Conf. Commun. Syst. Netw. (COMSNETS 2010), Bangalore, India, 2010, pp. 1–10. doi: 10.1109/COMSNETS.2010.5431981. [Google Scholar] [CrossRef]
8. Q. Zhao, K. Chen, T. Li, Y. Yang, and X. F. Wang, “Detecting telecommunication fraud by understanding the contents of a call,” Cybersecurity, vol. 1, no. 1, pp. 1–12, Aug. 2018. doi: 10.1186/s42400-018-0008-5. [Google Scholar] [CrossRef]
9. X. Hu, H. Chen, S. Liu, H. Jiang, G. Chu, and R. Li, “BTG: A bridge to graph machine learning in telecommunications fraud detection,” Future Gener. Comput. Syst., vol. 137, no. 1, pp. 274–287, Dec. 2022. doi: 10.1016/j.future.2022.07.020. [Google Scholar] [CrossRef]
10. T. H. D. Huang, C. Yu, and H. Kao, “Data-driven and deep learning methodology for deceptive advertising and phone scams detection,” in 2017 Conf. Techn. Appl. Artif. Intel. (TAAI), Taipei, Taiwan, 2017, pp. 6–171. doi: 10.1109/TAAI.2017.30. [Google Scholar] [CrossRef]
11. G. Chu et al., “Exploiting spatial-temporal behavior patterns for fraud detection in telecom networks,” IEEE Trans. Depend. Secur. Comput., vol. 20, pp. 4564–4577, 2023. doi: 10.1109/TDSC.2022.3228797. [Google Scholar] [CrossRef]
12. X. Hu, H. Chen, H. Chen, X. Li, J. Zhang and S. Liu, “Mining mobile network fraudsters with augmented graph neural networks,” Entropy, vol. 25, no. 1, Jan. 2023, Art. no. 0150. doi: 10.3390/e25010150. [Google Scholar] [PubMed] [CrossRef]
13. Z. Ma et al., “GraphNEI: A GNN-based network entity identification method for IP geolocation,” Comput. Netw., vol. 235, no. 9, Jul. 2023, Art. no. 109946. doi: 10.1016/j.comnet.2023.109946. [Google Scholar] [CrossRef]
14. R. Li, X. Wang, and X. Luo, “High-accuracy model recognition method of mobile device based on weighted feature similarity,” Sci. Rep., vol. 12, no. 1, Dec. 2022, Art. no. 21865. doi: 10.1038/s41598-022-26518-y. [Google Scholar] [PubMed] [CrossRef]
15. R. Li, R. Xu, Y. Ma, and X. Luo, “LandmarkMiner: Street-level network landmarks mining method for IP geolocation,” ACM Trans. Int. Things, vol. 2, no. 3, pp. 1–22, Jul. 2021. doi: 10.1145/3457409. [Google Scholar] [CrossRef]
16. Z. Ma et al., “GWS-Geo: A graph neural network based model for street-level IPv6 geolocation,” J. Infor. Secur. Appl., vol. 75, no. 9, May 2023, Art. no. 103511. doi: 10.1016/j.jisa.2023.103511. [Google Scholar] [CrossRef]
17. R. Li, Y. Sun, J. Hu, T. Ma, and X. Luo, “Street-level landmark evaluation based on nearest routers,” Secur. Commun. Netw., vol. 1, Jul. 2018, Art. no. 2507293. doi: 10.1155/2018/2507293. [Google Scholar] [CrossRef]
18. F. Zhao, R. Xu, R. Li, M. Zhu, and X. Luo, “Street-level geolocation based on router multilevel partitioning,” IEEE Access, vol. 7, pp. 59237–59248, 2019. doi: 10.1109/ACCESS.2019.2914972. [Google Scholar] [CrossRef]
19. MAXMIND, “MaxMind GeoIP Databases,” Accessed: Jul. 15, 2024. [Online]. Available: https://www.maxmind.com [Google Scholar]
20. IP2LOCATION, “IP2location Databases,” Accessed: Jul. 15, 2024. [Online]. Available: https://www.ip2location.com [Google Scholar]
21. IPIP, “IP Geolocation Databases,” Accessed: Jul. 15, 2024. [Online]. Available: https://www.ipip.net [Google Scholar]
22. Y. Xie, Z. Zhang, Y. Liu, E. Chen, and N. Li, “Evaluation method of IP geolocation database based on city delay characteristics,” Electronics, vol. 13, no. 1, Dec. 2023, Art. no. 15. doi: 10.3390/electronics13010015. [Google Scholar] [CrossRef]
23. M. Ester, H. Kriegel, J. Sander, and X. Xu, “A density-based algorithm for discovering clusters in large spatial databases with noise,” in KDD’96: Proc. Second Int. Conf. Knowl. Discov. Data Min., 1996, vol. 96, no. 34, pp. 226–231. [Google Scholar]
24. P. K. Jain, M. S. Bajpai, and R. Pamula, “A modified DBSCAN algorithm for anomaly detection in time-series data with seasonality,” Int. Arab J. Inf. Technol., vol. 19, no. 1, pp. 23–28, 2022. doi: 10.34028/iajit. [Google Scholar] [CrossRef]
25. APNIC, “APNIC Whois,” Accessed: Jul. 15, 2024. [Online]. Available: https://www.apnic.net [Google Scholar]
26. S. N. Sivanandam and S. N. Deepa, “Genetic algorithm optimization problems,” in Introduction to Genetic Algorithms, Berlin, Heidelberg, Germany: Springer, 2008, pp. 165–209.10.1007/978-3-540-73190-0_7. [Google Scholar] [CrossRef]
27. D. Tominaga, N. Koga, and M. Okamoto, “Efficient numerical optimization algorithm based on Genetic Algorithm for inverse problem,” in Proc. 2nd Annu. Conf. Genetic Evol. Comput. (GECCO’00), San Francisco, CA, USA, 2000, pp. 251–258. [Google Scholar]
28. N. S. Usman et al., “Intelligent dynamic malware detection using machine learning in IP reputation for forensics data analytics,” Future Gener. Comput. Syst., vol. 118, pp. 124–141, 2021. doi: 10.101sss6/j.future.2021.01.004. [Google Scholar] [CrossRef]
Cite This Article
 Copyright © 2024 The Author(s). Published by Tech Science Press.
This work is licensed under a Creative Commons Attribution 4.0 International License , which permits unrestricted use, distribution, and reproduction in any medium, provided the original work is properly cited.


 Submit a Paper
 Propose a Special lssue
 View Full Text
 Download PDF
 Downloads
 Citation Tools