 Open Access
ARTICLE
YOLO-VSI: An Improved YOLOv8 Model for Detecting Railway Turnouts Defects in Complex Environments
School of Computer Science and Technology, Zhejiang Sci-Tech University, Hangzhou, 310018, China
* Corresponding Author: Zhilong Lu. Email:
Computers, Materials & Continua 2024, 81(2), 3261-3280. https://doi.org/10.32604/cmc.2024.056413
Received 22 July 2024; Accepted 24 September 2024; Issue published 18 November 2024
Abstract
Railway turnouts often develop defects such as chipping, cracks, and wear during use. If not detected and addressed promptly, these defects can pose significant risks to train operation safety and passenger security. Despite advances in defect detection technologies, research specifically targeting railway turnout defects remains limited. To address this gap, we collected images from railway inspectors and constructed a dataset of railway turnout defects in complex environments. To enhance detection accuracy, we propose an improved YOLOv8 model named YOLO-VSS-SOUP-Inner-CIoU (YOLO-VSI). The model employs a state-space model (SSM) to enhance the C2f module in the YOLOv8 backbone, proposed the C2f-VSS module to better capture long-range dependencies and contextual features, thus improving feature extraction in complex environments. In the network’s neck layer, we integrate SPDConv and Omni-Kernel Network (OKM) modules to improve the original PAFPN (Path Aggregation Feature Pyramid Network) structure, and proposed the Small Object Upgrade Pyramid (SOUP) structure to enhance small object detection capabilities. Additionally, the Inner-CIoU loss function with a scale factor is applied to further enhance the model’s detection capabilities. Compared to the baseline model, YOLO-VSI demonstrates a 3.5% improvement in average precision on our railway turnout dataset, showcasing increased accuracy and robustness. Experiments on the public NEU-DET dataset reveal a 2.3% increase in average precision over the baseline, indicating that YOLO-VSI has good generalization capabilities.Keywords
Railways are crucial infrastructure for the modern economy and a major mode of public transportation. Railway turnouts, key components for switching train tracks, play a vital role in China’s railway system. With increasing train mileage, railway turnouts inevitably develop defects like chipping, cracks, and wear. If these defects are not promptly detected and addressed, they pose serious threats to train operation safety and passenger security [1,2]. Therefore, timely and accurate detection of railway turnouts defects is essential for ensuring railway operation safety.
Image detection methods for rail surface defects can be broadly classified into two categories: traditional image processing and deep learning-based object detection methods. Conventional approaches, such as the vertical projection method by Franca et al. [3]. Feng et al. [4] use adaptive threshold segmentation for defect region extraction, Most traditional methods rely on the texture and color of defects to locate and identify defects. When the surrounding environment has color and shape features similar to the defects, it will lead to large detection errors. Current mainstream deep learning methods include two-stage Region-CNN(RCNN) series [5,6], single-stage-Single Shot MultiBox Detector(SSD) [7] and You Only Look Once(YOLO) [8–10] series, and Transformer-based Detection with Transformers (DETR) [11,12] series algorithms.
The YOLOv8 network model strikes a favorable trade-off between speed and accuracy. However, in complex railway environments, factors such as weather and shooting angles can make it difficult to extract target features, leading to information loss. Additionally, defect shapes, sizes, and specifications vary greatly. Most images contain small, numerous, and unevenly distributed defects, which can cause false positives and negatives, affecting the overall detection accuracy. This study addresses these challenges by presenting an improved YOLOv8 model-YOLO-VSI. The main contributions are as follows:
1. Constructs a railway turnouts dataset in complex environment, which contains 2100 images and provides data support for model training and testing.
2. Based on YOLOv8s, the backbone network is improved and SSM is introduced to build the C2f-VSS module, which enhances the model’s capacity to identify features in intricate environments and capture long-distance dependencies.
3. The SOUP structure is proposed, which improves the neck layer of the network by introducing the SPDConv and OKM modules. This significantly enhances the model’s small-scale defect detection abilities.
4. To enhance the loss function, we introduce Inner-CIoU with a scale factor ratio in place of CIoU, allowing for dynamic control of auxiliary bounding box sizes, thereby achieving adaptive adjustment of defect detection frames of different scales.
Li et al. [13] embedded the attention mechanism into the YOLOv4 for steel defect detection which greatly enhance the feature extraction capability. Liang et al. [14] proposed a method based on an improved U-Net applied to the public Type-I RSDDs railway track dataset. Zhang et al. [15] present a novel Attention-Guided MultiGranularity Fusion Model to improve the ability to model contextual information. Li et al. [16] used the CSP CrossLayer module and SA attention mechanism to enhance YOLOX, achieving an accuracy of 77% on the NEU-DET dataset. Xie et al. [17] integrated depthwise separable convolutions with YOLO to create a lightweight defect detection model, the FPN was improved to enhance the multi-scale detection layer to improve network accuracy, achieving rapid and accurate end-to-end detection of industrial surface defects. Wang et al. [18] combined the ECA attention mechanism with the SIOU loss function and used a weighted BiFPN structure to improve the YOLO model for steel defect detection, but the number of model parameters and complexity also increased accordingly. Xie et al. [19] designed a lightweight multi-scale mixed convolution module and applied an efficient global attention mechanism to improve the YOLOv8 model, achieving good results in steel defect detection, with a mAP improvement of 4.7%. Guo et al. [20] used a Transformer-based network to integrate overlapping patch merging, efficient self-attention, and a hybrid FFN (Feed-Forward Network) to improve the ability of global and local feature fusion and accurately and effectively detect rail surface defects. Zhang et al. [21] designed a scale adaptability module to achieve the fusion of global and local information. Bai et al. [22] built a rail inspection system, used an inspection vehicle to take close-up pictures of the rails, constructed a dataset of one thousand rail surface defects, and used MobileNetv3 to lightweight the YOLOv4, reducing the number of model parameters by 70%. Wang et al. [23] used SPDConv convolution to replace the original convolution in the backbone network and introduced the EMA (Efficient Multi-Scale Attention) mechanism to enhance the detection ability of small-scale defects. They built a rail dataset of more than 3000 images by cutting online images and open source datasets, and achieved an accuracy of 94.1% on their self-built dataset.
The aforementioned deep learning-based methods have demonstrated good detection performance in steel surface defect detection tasks, primarily by improving detection accuracy through the integration of attention mechanisms and improved feature extraction capabilities. However, challenges remain when applying these methods to the more complex task of detecting railway turnout defects. Firstly, this task involves complex background interference, whereas most of the aforementioned studies focus on environments without such interference. Secondly, the task is conducted in outdoor settings, where varying weather conditions and lighting fluctuations affect image quality. Lastly, the defects in this task are characterized by small scale and variable shapes in the images, further increasing the detection difficulty. This paper primarily addresses these issues through improvements.
YOLOv8 [24] is designed for tasks including object detection, instance segmentation, and image classification. It comes in five versions of increasing size, this study uses the compact YOLOv8s as the baseline model for improvements.
The YOLOv8 model is primarily composed of three components: the backbone, the neck, and the head. The backbone uses Darknet53 as its framework and introduces the gradient-rich C2f module to replace the C3 module from YOLOv5. This significantly improves convergence speed and effectiveness. In the Neck section, YOLOv8 employs the PAN (Pyramid Attention Network)-FPN [25] concept. The model structure diagram is shown in the Fig. 1.
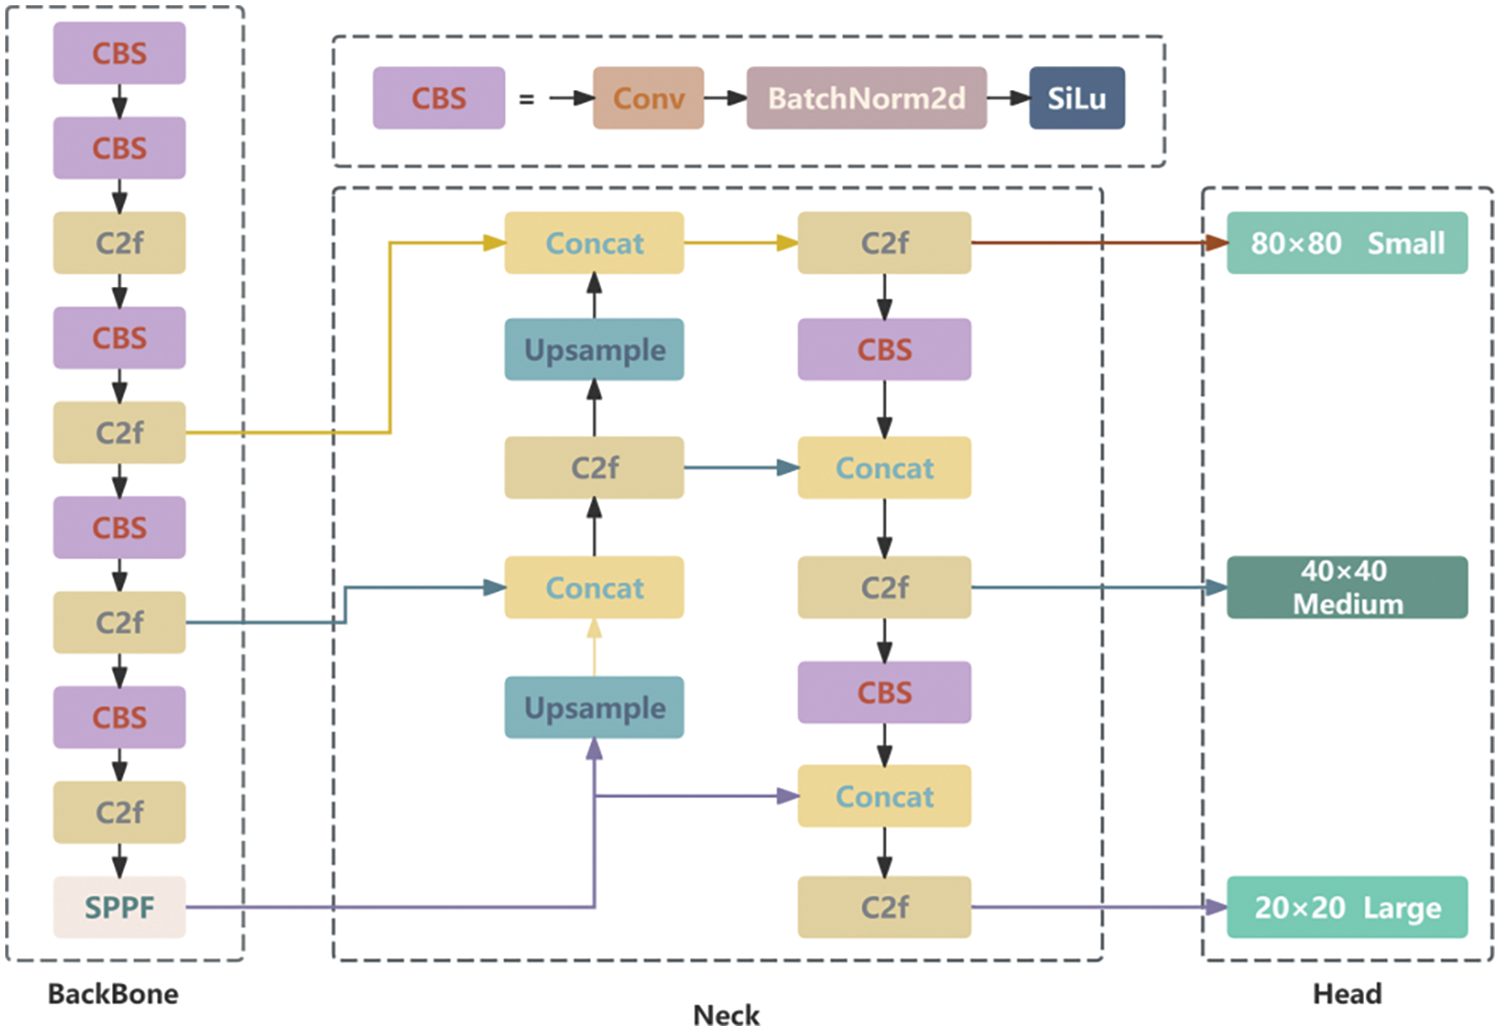
Figure 1: YOLOv8 network
3.1 Construction of Railway Turnouts Defect Dataset
Existing datasets mainly consist of close-up images of railway tracks, its structure is relatively simple, mainly composed of two rails. but due to the more complex structure of railway turnouts, mainly consists of fork core, wing rail, guard rail, and other connecting parts, these existing datasets cannot meet experimental requirements. In order to better complete the defect detection task of railway turnouts, this paper constructs a railway turnouts defect dataset. In this study, railway turnouts images were collected by inspection personnel from a railway company using cameras during their daily inspection. The images were taken in JPEG format, with resolutions ranging from 1200 × 1600 to 3000 × 4000 pixels. The camera angle was overhead, and the distance from the railway turnouts was maintained between 0.5 and 1.5 meters.
To ensure the diversity and usability of the data samples, 500 images were selected, including 450 images with defects and 50 without defects. The images were captured at different times, under various weather conditions, and different lighting environments, as shown in Fig. 2.

Figure 2: Partial view of railway turnouts
We annotated all datasets using labelImg software, and a total of 1343 defects were found. The defect shape distribution is shown in Fig. 3. Most of them are small-scale defects, and the defect boxes are mostly long strips.
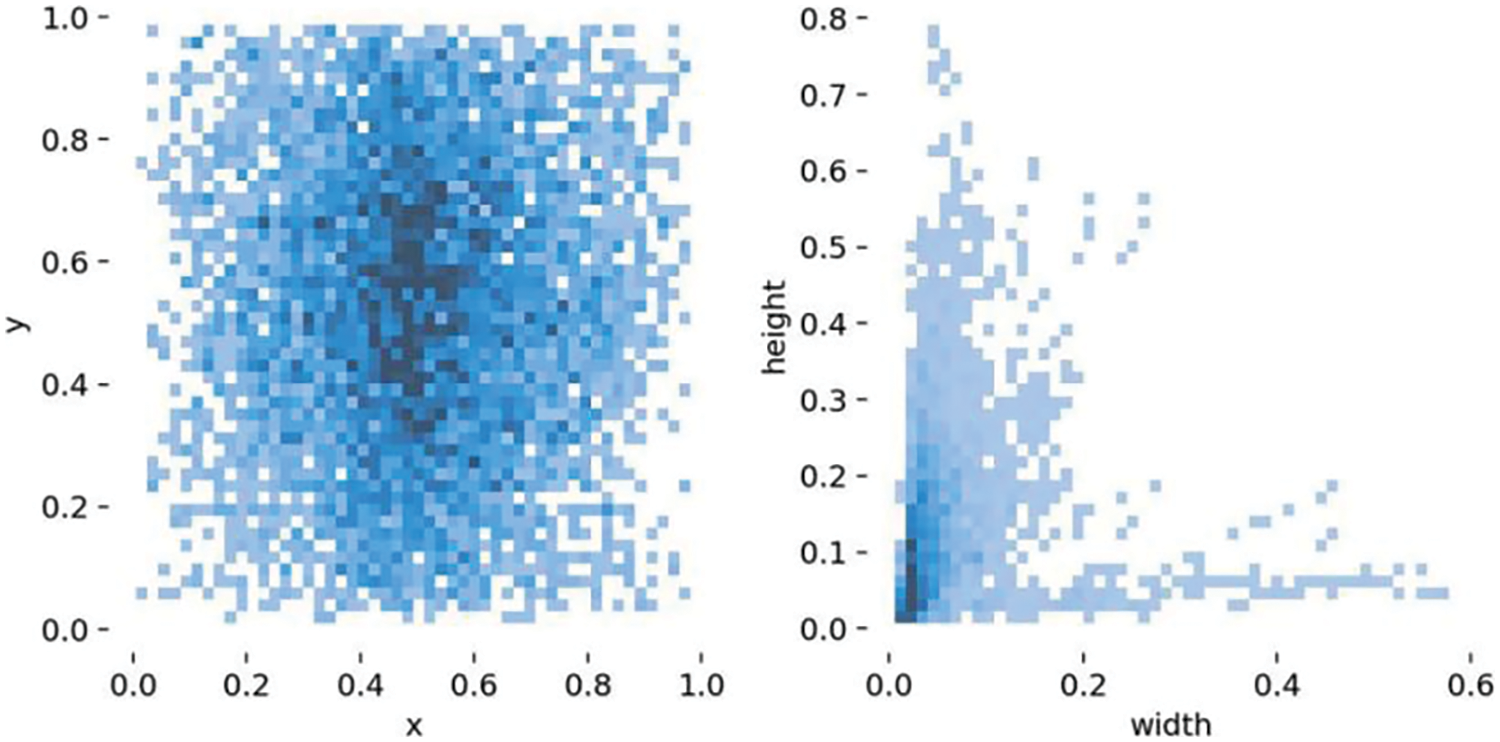
Figure 3: Defect shape distribution diagram
The dataset was divided into training, testing, and validation sets using a 7:2:1 ratio. To expand the dataset and improve the model’s generalization capability, we use random scaling, flipping, brightness enhancement, grayscale transformation and other data enhancement techniques [26] to randomly expand the data of the training set and the validation set. The test set only retains real data to avoid introducing human-caused errors [27]. After enhancement, the training set was expanded to 1750 images and the validation set was expanded to 250 images. Fig. 4 illustrates some of the augmented data samples.
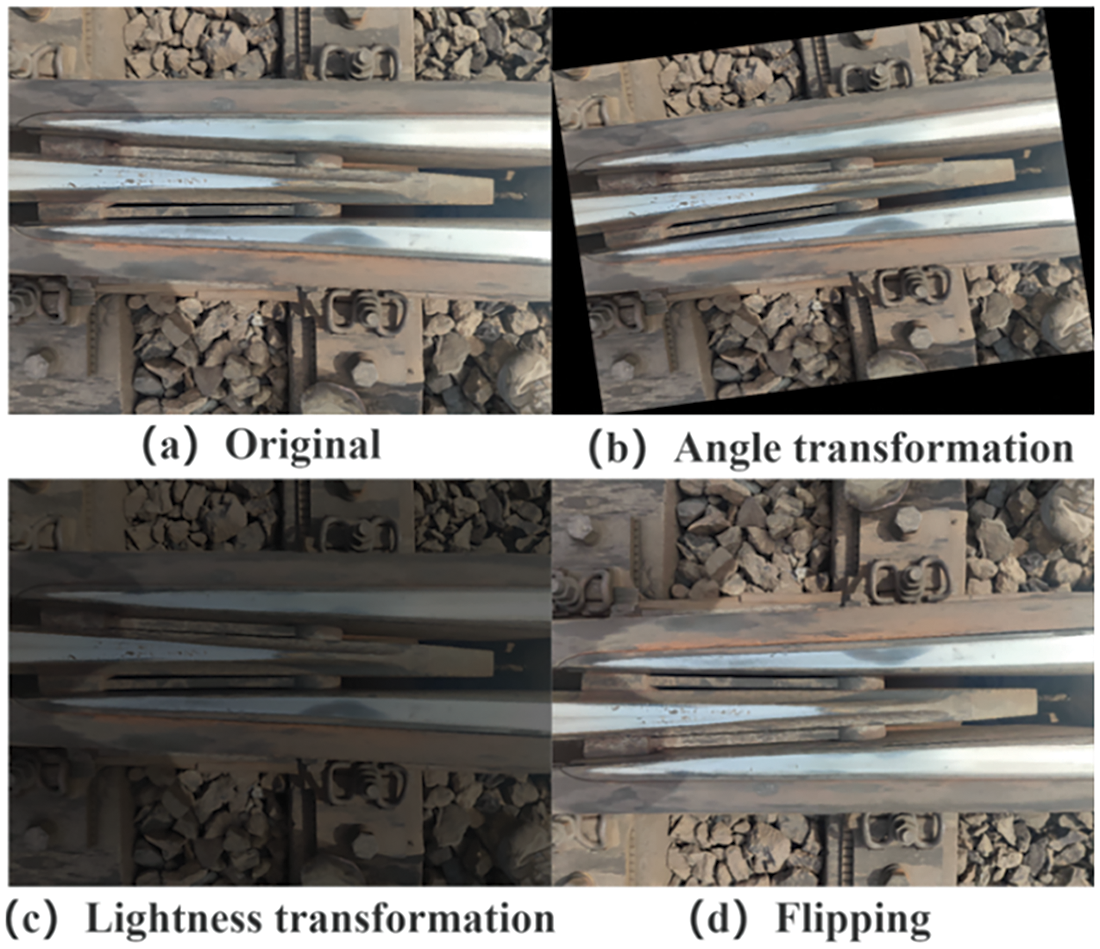
Figure 4: Results after data augmentation
The main features of the dataset include the following: 1) Complex and diverse image backgrounds, including various weather conditions and environmental scenarios. 2) Wide range of defect scales, with significant size differences between defects within the same image, ranging from 30 to 300 px. Small-scale defects predominate. 3) Images captured from multiple angles, this will also cause the shape and size of the defect to be affected by the change in shooting angle, resulting in diversified shapes and the appearance of targets with larger length and width ratios. These features make the dataset challenging and conducive to training models with good generalization performance.
Due to the small pixel size of defect targets, large scale differences between defects, complex background, and similarity between some background and defects in the railway turnouts defect dataset. Regarding the above issues, we propose a new model, YOLO-VSI, for detecting railway turnouts defects, in order to achieve better feature extraction and feature fusion, and enhance the capability to locate and detect small-scale defects.
Compared with the baseline model in Fig. 1, we improve the red part of Fig. 5 based on YOLOv8. First, based on YOLOv8s, we improve the C2f structure in the seventh and ninth layers of the backbone network using VSSBlock, designed C2f-VSS structure. VSSBlock converts the image into four sets of one-dimensional sequences and uses a state-space model (SSM) to capture long-range dependencies and contextual information in the image, enhancing feature extraction in complex environments.
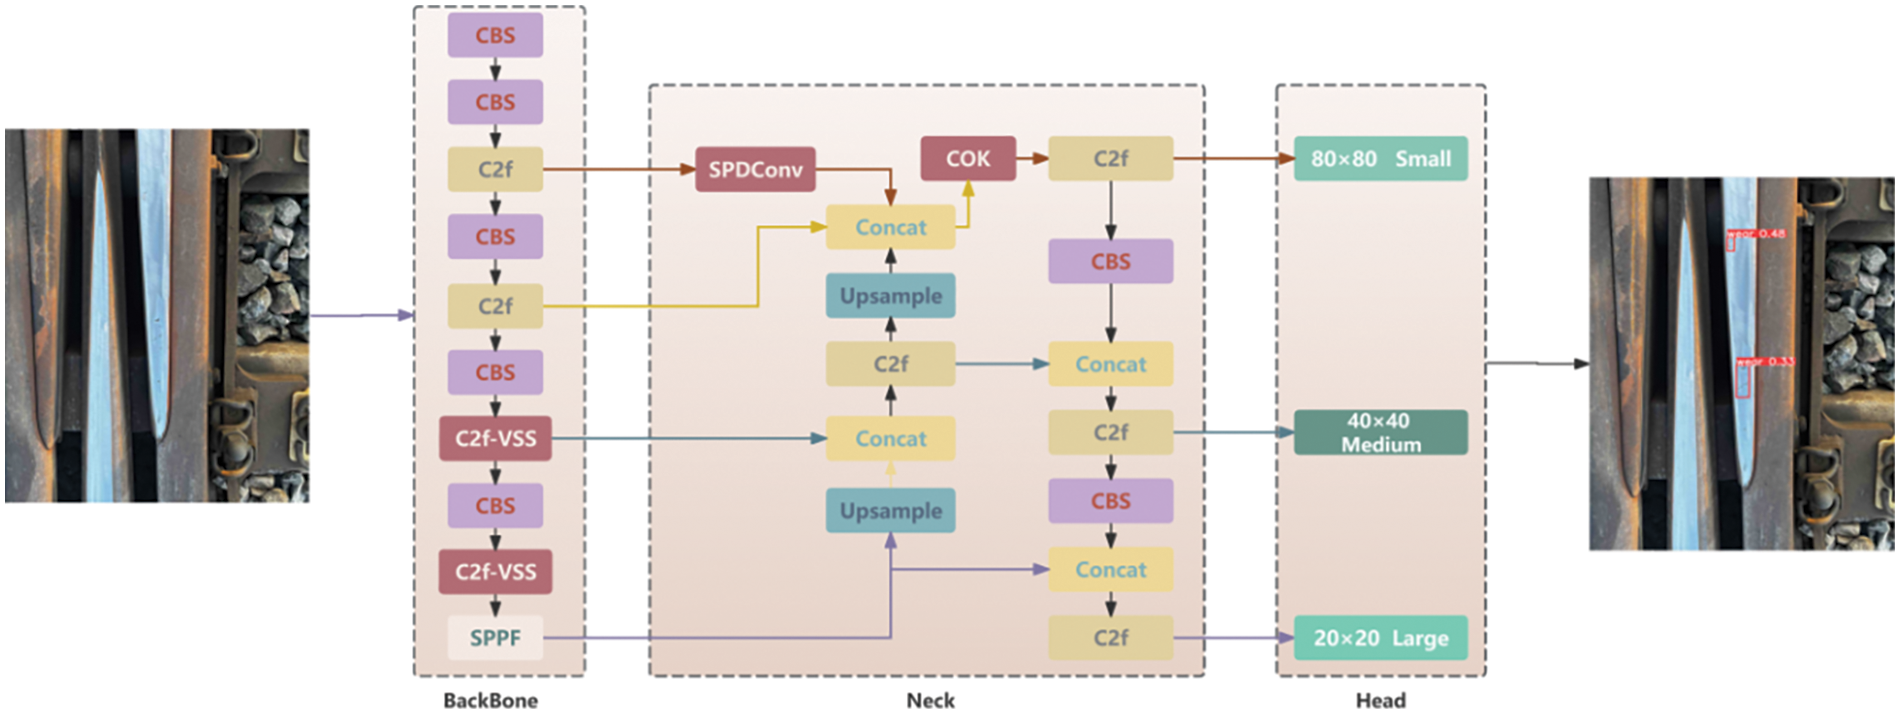
Figure 5: YOLO-VSI network architecture
Second, at the network’s neck layer, the original PAN structure is improved. we introduce the SOUP structure. By incorporating SPDConv and OKM. In the P2 layer of the backbone in Fig. 5 (the first C2f structure), rich in small object information, retain more fine-grained features after passing through SPDConv and are merged with P3 layer (the second C2f structure) features through the COK structure, which includes global, macro, and micro branches, effectively learning features from global to local and improving small-scale defect detection performance.
Finally, Inner-CIoU with scale factor and auxiliary bounding box is used as the loss function to accommodate defects of different shapes and sizes, improve the positioning effect of the detection frame, and further improve the detection accuracy.
The railway turnouts defect dataset is influenced by outdoor environmental factors, resulting in high randomness and less distinct features, making feature extraction challenging and leading to information loss that affects detection accuracy. CNN operations can only perceive local features at each layer, making the capture of long-range dependencies challenging. Transformers [28] excel in global modeling and can effectively capture long-range dependencies, but their self-attention mechanisms requires a lot of computation. To overcome the limitations of CNNs and Transformers, SSMs [29] establish long-range dependencies while maintaining linear complexity. Mamba [30] integrates time-varying parameters into the state-space model, excelling at capturing long-range dependencies and enabling efficient parallel training. VMamba [31] introduces the Mamba architecture into the visual field and performs well in image classification tasks.
This paper incorporates the VSSBlock from VMamba to improve the C2f in YOLOv8, proposing the C2f-VSS module. The SSM-based architecture is applied to YOLO to process one-dimensional data, combined with its advantage of capturing global dependencies, to improve the model’s feature extraction capabilities and understanding of complex scenes, thereby improving the model’s detection accuracy. When processing sequence data, SSM can automatically adjust weights to better capture important information, focus on railway turnouts, reduce the impact of environmental factors, and maintain linear complexity without increasing computational load. The working principle of VSSBlock is shown in Fig. 6. After layer normalization, the input is divided into two independent information streams. One branch passes through a linear layer and SiLU, whereas the next branch undergoes processing via a linear layer, DW Conv, and SiLU before reaching the core component of the VSS block—the 2D Selective Scan Module. The streams are then combined through another layer normalization layer, and the linear layer mixes the features before producing the final output with residual connections, forming the output of the VSS block.
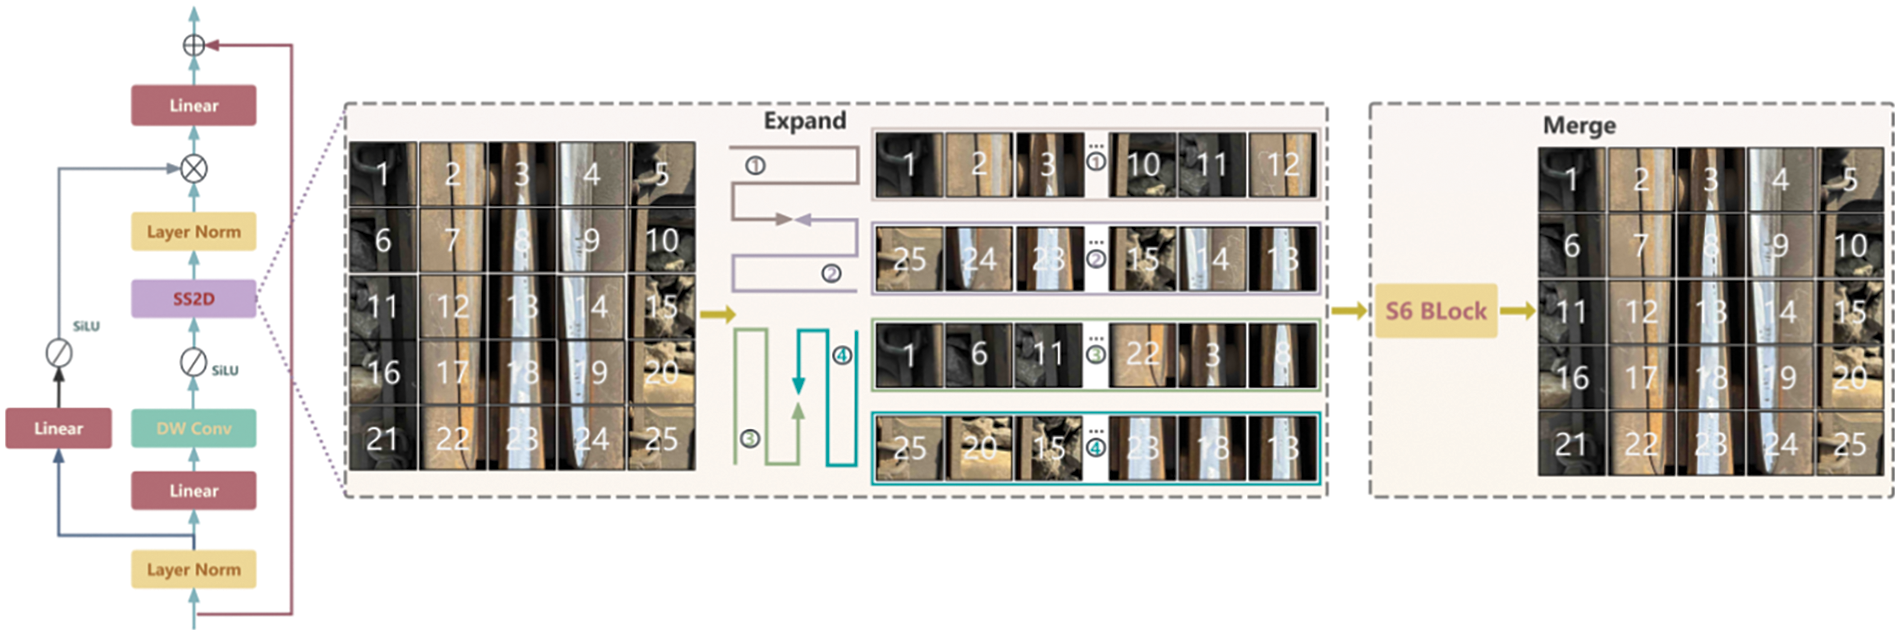
Figure 6: VSSBlock structure diagram
VSSBlock addresses challenges associated with 2D images through SS2D. It unfolds the image into four different sequences, processes each sequence with SSM, and then merges the output features to form a new, complete 2D feature map. Given the input features, the output features of SS2D can be expressed as:
In the formula, v represents the four different scanning directions. The expand operator flattens the input features along these four directions, while the merge operator combines the four sequences. The scanning operation in four directions covers all areas of the image and provides rich multi-dimensional information, which improves the comprehensiveness of capturing image features. The S6 [30] is the core SSM operator in the VSS block, allowing each element in the 1D array to interact with any previously scanned sample through a compressed hidden state.
Using VSSBlock, the BottleNeck structure in the original C2f as shown in Fig. 7 is replaced. The C2f-VSS structure after replacement is shown in Fig. 8. The C2f-VSS module replaces the original C2f at the seventh and ninth layers at the end of the backbone network, enables learning features associated with the defect targets and background, effectively capturing complex details and broader semantic context in images, thereby enhancing detection accuracy.

Figure 7: Original C2f structure diagram

Figure 8: Improved C2f-VSS structure diagram
In the railway turnouts defect detection task, there are many small-scale defects, which are difficult to detect. In the YOLOv8 model, there are only three types of detection heads: small, medium, and large. The downsampling and pooling process in the backbone network can cause the high-level feature maps at the end to have low resolution, resulting in few pixels for small targets in the deep feature maps. Detecting small-scale defects in the normal P3, P4, and P5 detection layers can be challenging, often leading to missed detections. Many researchers have added a fourth layer specifically for small target detection [32], but this significantly increases the parameter count, affecting the model’s efficiency in practical applications. Therefore, we modified the neck layer’s network structure based on the PAFPN and proposed SOUP, improve the model’s capability to detect small-scale defects, as shown in Fig. 9.

Figure 9: SOUP network architecture
We first use the P2 layer’ features which has not been downsampled too much and retains more fine-grained information, and then processed by SPDConv [33], which contain rich small target information, and merge them with P3 layer features. CNN models typically use strided convolutions and pooling to downsample and output feature maps of a specific size, but this can cause loss of fine-grained information. SPDConv consists of space-to-depth and non-strided convolution layers and performs well in low-resolution image and small object detection tasks, as illustrated in Fig. 10.
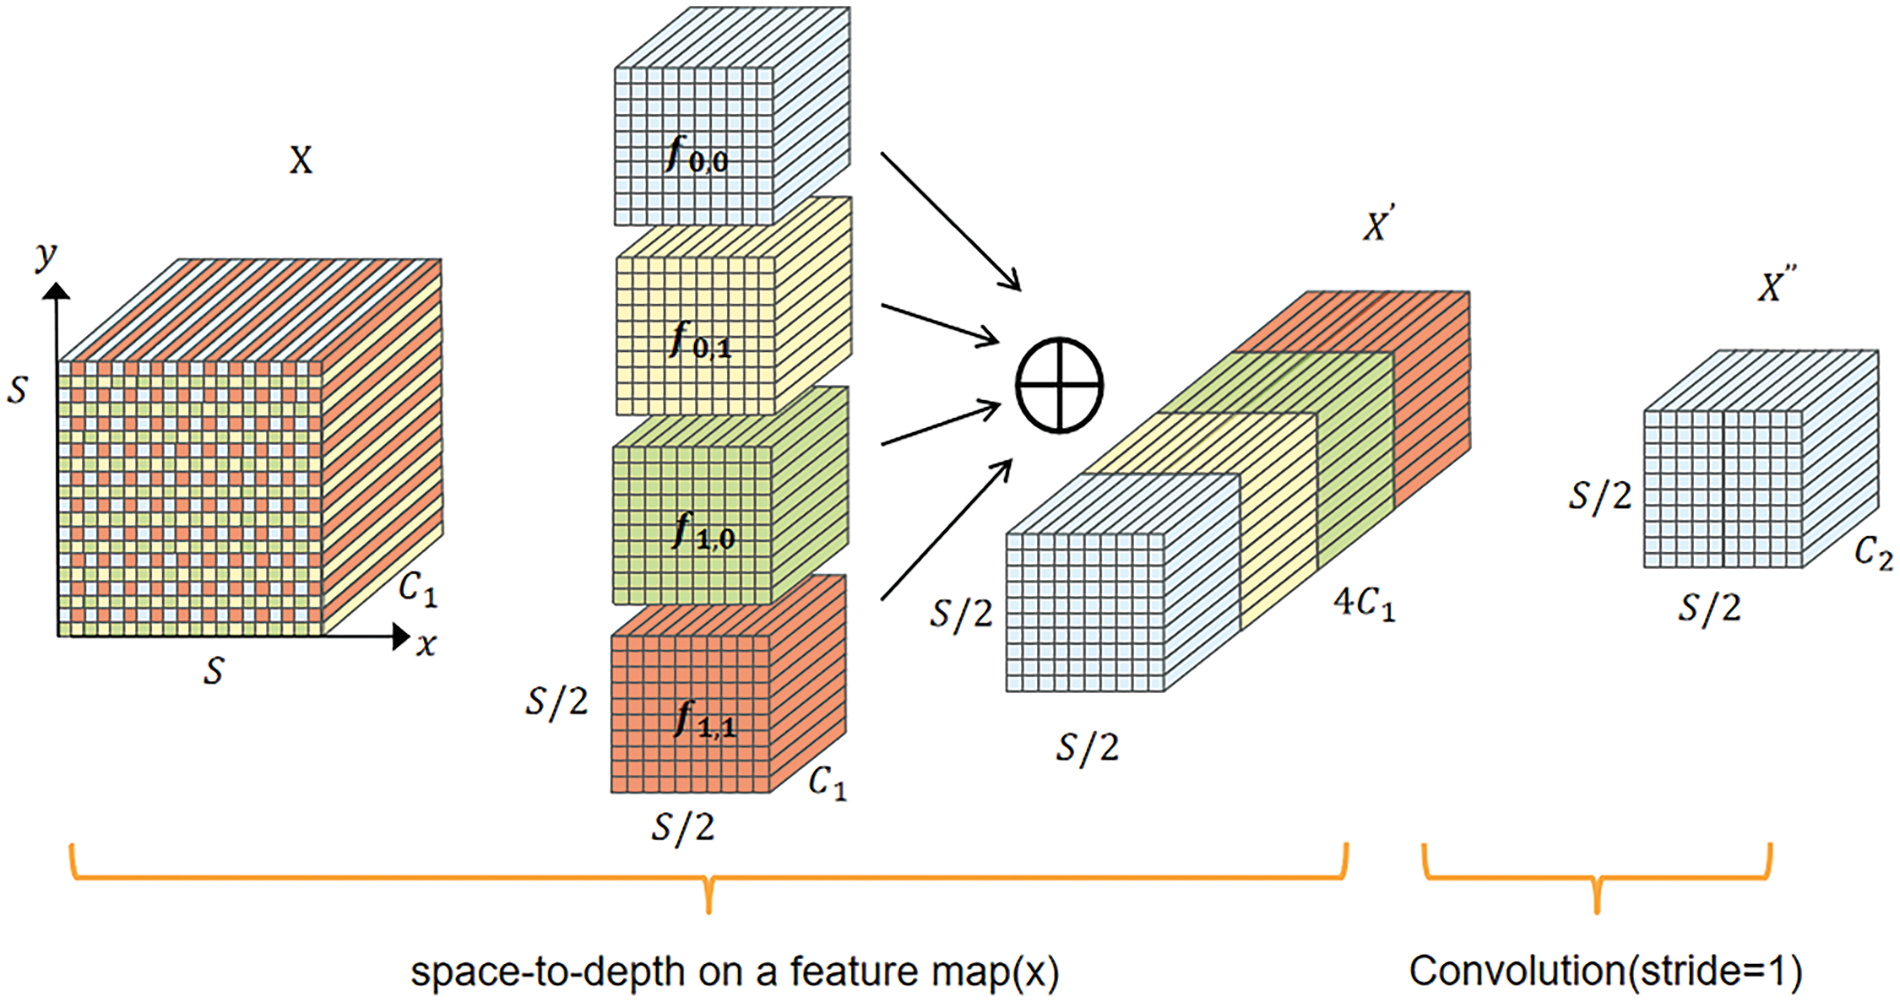
Figure 10: SPDConv principle diagram
As shown in Fig. 8, the SPD layer first inputs the feature map. When downsampling with a scale of 2, the SPD layer divides the feature map into four sub-feature maps along the x and y directions, mapped as shown in Eqs. (4) and (5).
The sub-feature maps are then stitched together to obtain an intermediate feature map
The output feature information from the P2 and P3 layers is then fed into the COK module to enhance feature extraction and fusion capabilities, thereby more effectively capturing and identifying defects. The COK module is improved based on the OKM [34] module and CSP, reducing computational load while retaining more feature information. In the COK module, the input features are divided into two parts. One part is processed by the OKM module and then fused with the unprocessed feature map, which reduces the consumption of some computing resources, as shown in Fig. 11a. The OKM module consists of three branches: global, macro, and micro, effectively learning features from global to local, thus enhancing the detection accuracy of small-scale target defects, as shown in Fig. 11b. In the local branch, local features are extracted through 1 × 1 deep convolution operations to ensure sensitivity to small-scale defects; in the large branch, three larger-scale convolutions are used to enhance the recognition ability of medium- and large-scale targets; In the global branch, the Double Domain Channel Attention Module (DCAM) in Fig. 11c and Frequency-based Spatial Attention Module (FSAM) in Fig. 11d enhance the feature representation of the rail area, enabling the model to focus more on potential defect areas. After the input information passes through the three branches and is fused additively, it captures global context information within a broader scope., improving defect detection accuracy and enhancing the detection capability for small-scale defects.
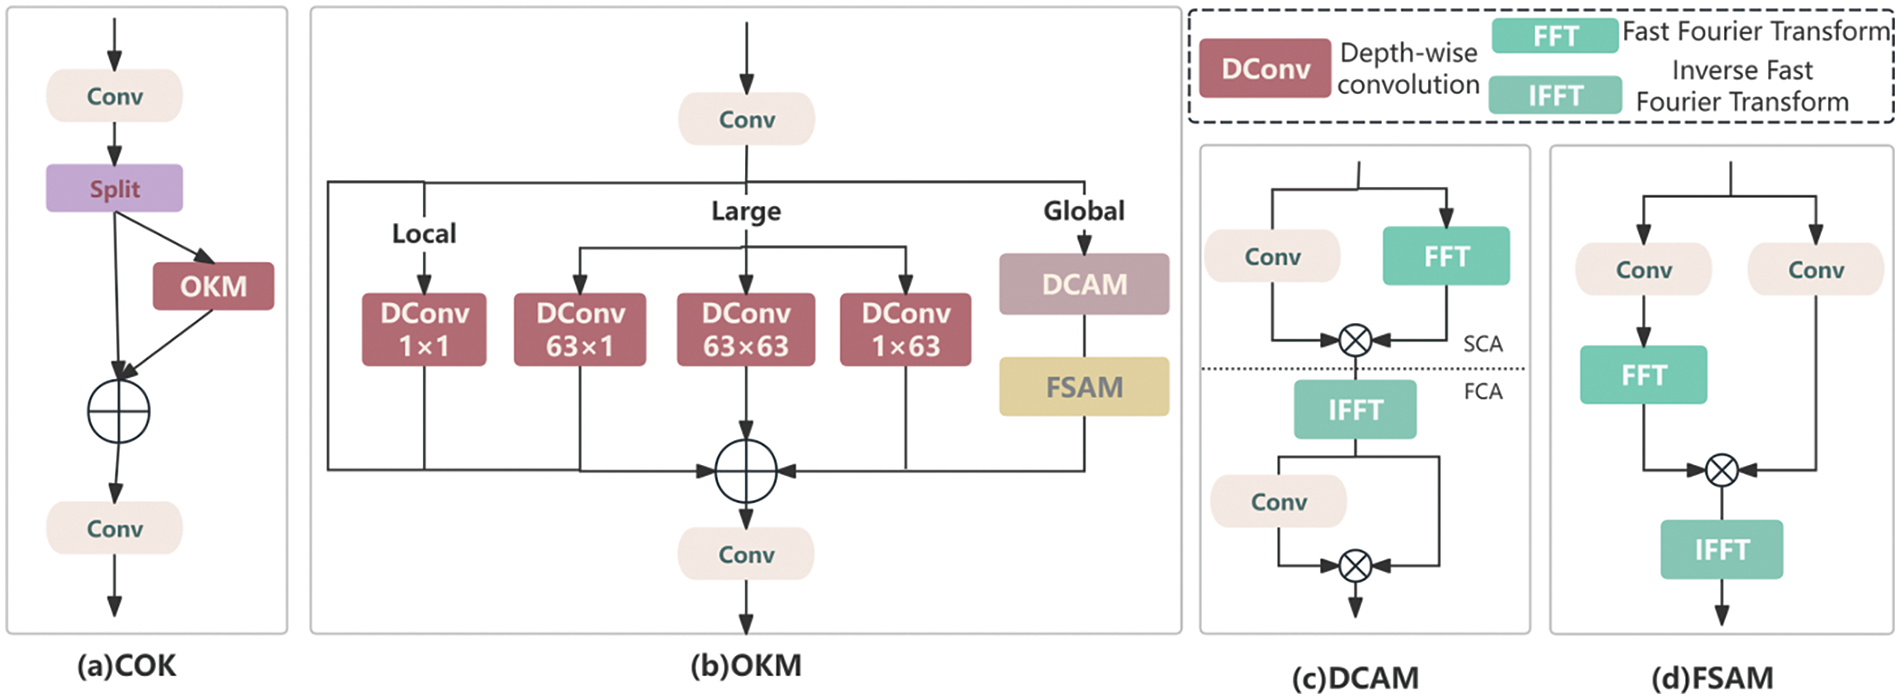
Figure 11: COK network architecture
In YOLOv8, CIoU Loss is used as the loss function for the bounding box task to evaluate the accuracy of bounding box prediction, as shown in Eq. (8).
Among them,
In the formula, the center point of the Ground Truth (GT) box is represented by
When the ratio is less than 1, the auxiliary bounding box size is smaller than the actual bounding box, resulting in a smaller effective regression range than the IoU loss function but producing a larger gradient absolute value. This accelerates the convergence speed for high-IoU samples. Conversely, when the ratio is greater than 1, the auxiliary bounding box size is larger than the actual bounding box. This expands the effective regression range and enhances the regression effect for low-IoU samples. By adjusting the ratio value, the Inner-CIoU loss function can adaptively select suitable auxiliary bounding box sizes based on different sample IoU levels, achieving efficient convergence and improving the model’s generalization ability.
The experimental environment for this study utilized an Ubuntu system. The hardware included an RTX 3080 GPU with 10 GB of memory, 32 GB of RAM. The deep learning framework was Pytorch 2.0.0, with Cuda version 11.8.0, and Python version 3.8. The parameter settings for model training are shown in Table 1.

To evaluate the effectiveness of the model, this paper assesses overall performance using recall, precision, mAP@50/%, parameter count, and computational cost (GFLOPs).
The area under Precision-Recall curve, enclosed by the axes, represents the AP value for a particular class. The mAP is the average of the AP values across all classes, as shown in Eq. (14).
4.3 Comparative Study of Loss Functions
To assess the effectiveness of the Inner-CIoU loss function, this paper conducted comparative experiments with eight groups of loss functions. The experimental results are shown in Table 2. These experiments were based on the integration of VSS and SOUP modules, replacing the original CIoU with SIoU, DIoU, GIoU, and combining CIoU, SIoU, DIoU, GIoU respectively with Inner-IoU. The experimental results show that using different loss functions does not affect the computational complexity of the model parameters. Training with DIoU and GIoU resulted in a decrease in mAP, while using SIoU and CIoU provided better mAP compared to DIoU and GIoU. When CIoU, SIoU, DIoU, and GIoU were combined with Inner-IoU, it was observed that Inner-CIoU improved mAP by 1.2% compared to the original CIoU, achieving the best results among the eight groups of loss functions. Inner-IoU is applied to the CIoU loss function, and the model’s recall rate of 62.6 and accuracy of 78.3 are the highest among several groups of experiments. Inner-CIoU overcomes the shortcomings of CIoU in frog defect detection, which is poor in handling small and slender targets, by introducing an adjustable auxiliary bounding box scale, and improves the positioning ability of the bounding box. In summary, the model using the Inner-CIoU loss function can more accurately detect targets, demonstrating superior performance in the turnout defect detection task.

To assess the impact of the improvements proposed in this study on railway turnouts defect detection based on the YOLOv8s model, eight ablation experiments were conducted as shown in Table 3. VSS module, SOUP module, and Inner-CIoU loss function were individually replaced on the YOLOv8s network.

As shown in Table 3, C2f is improved by using the SSM, VSSBlock converts the two-dimensional image into a one-dimensional sequence and uses the SSM for calculation. Its complexity is linear. While improving the model accuracy, the number of parameters has been reduced reduced by 0.8 M, the model calculation amount is also reduced by 3.7GFLOPs, and the average accuracy is also improved by 1.5%. This indicates that the VSSBlock enhances model accuracy while reducing parameters and improving feature extraction. Modifying the original PAFPN structure by introducing SPDConv and OKM modules significantly improved detection performance. The mAP increased by 1.7%, with a corresponding increase in parameters and computation. However, recall also improved significantly, indicating that these modifications reduced missed detections and enhanced small defect detection. Replacing the loss function with Inner-CIoU boosted mAP by 0.6% without increasing model complexity, the detection accuracy is improved by 1.5, which means that Inner-IoU improves CIoU. The auxiliary frame with the scale factor improves the positioning effect of the model on the detection frame. It shows better robustness when dealing with defects with complex shapes or various scales, thereby improving the overall detection accuracy. Combining VSSBlock with SOUP increased mAP by 2.9% and recall by 3.5%. Integrating SOUP with Inner-CIoU resulted in a 1.7% mAP increase and a 5.4% recall improvement. Merging VSSBlock with Inner-CIoU led to a 2.4% mAP rise and a 1.2% recall gain. Finally, applying the C2f-VSS module, SOUP structure, and Inner-CIoU loss function to the baseline model (YOLOv8s) resulted in slight increases in parameters and computation but significantly improved accuracy, recall, and average precision. The average precision increased by 3.5%, effectively mitigating false positives and missed detections. The mAP50 curves of the YOLOv8 model and YOLO-VSI during training and the predicted box curves of the validation set are visualized. As shown in the Figs. 12 and 13, in the early stage of training, YOLO-VSI has a faster convergence speed, and its mAP50 is higher than that of the YOLOv8 baseline model, and has a lower bounding box prediction loss, showing better learning ability and detection accuracy.
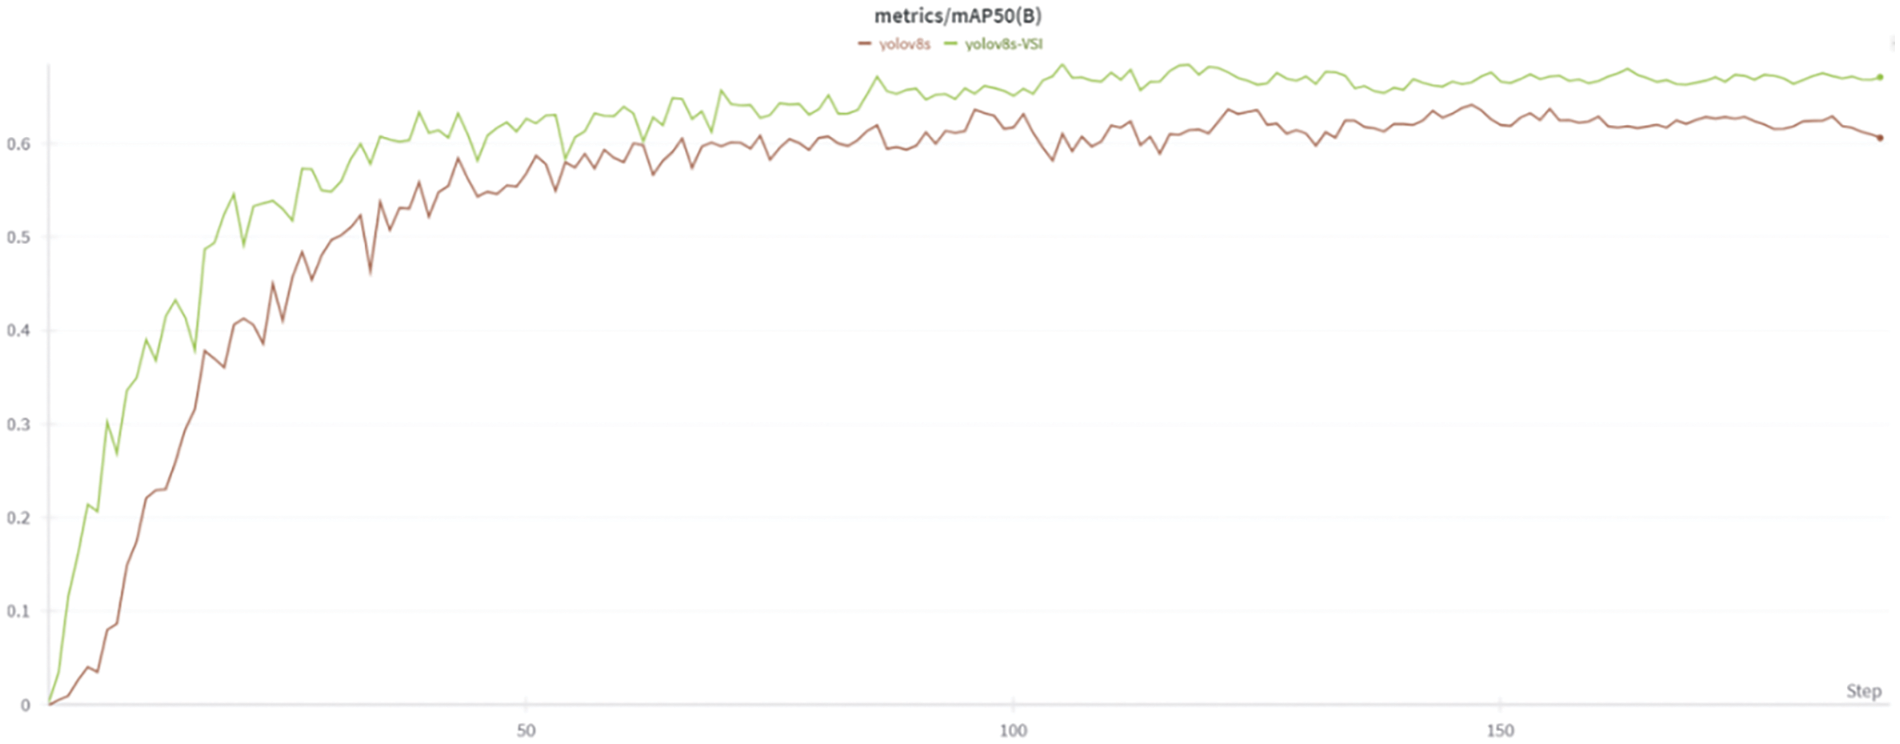
Figure 12: MAP50 curve of training process
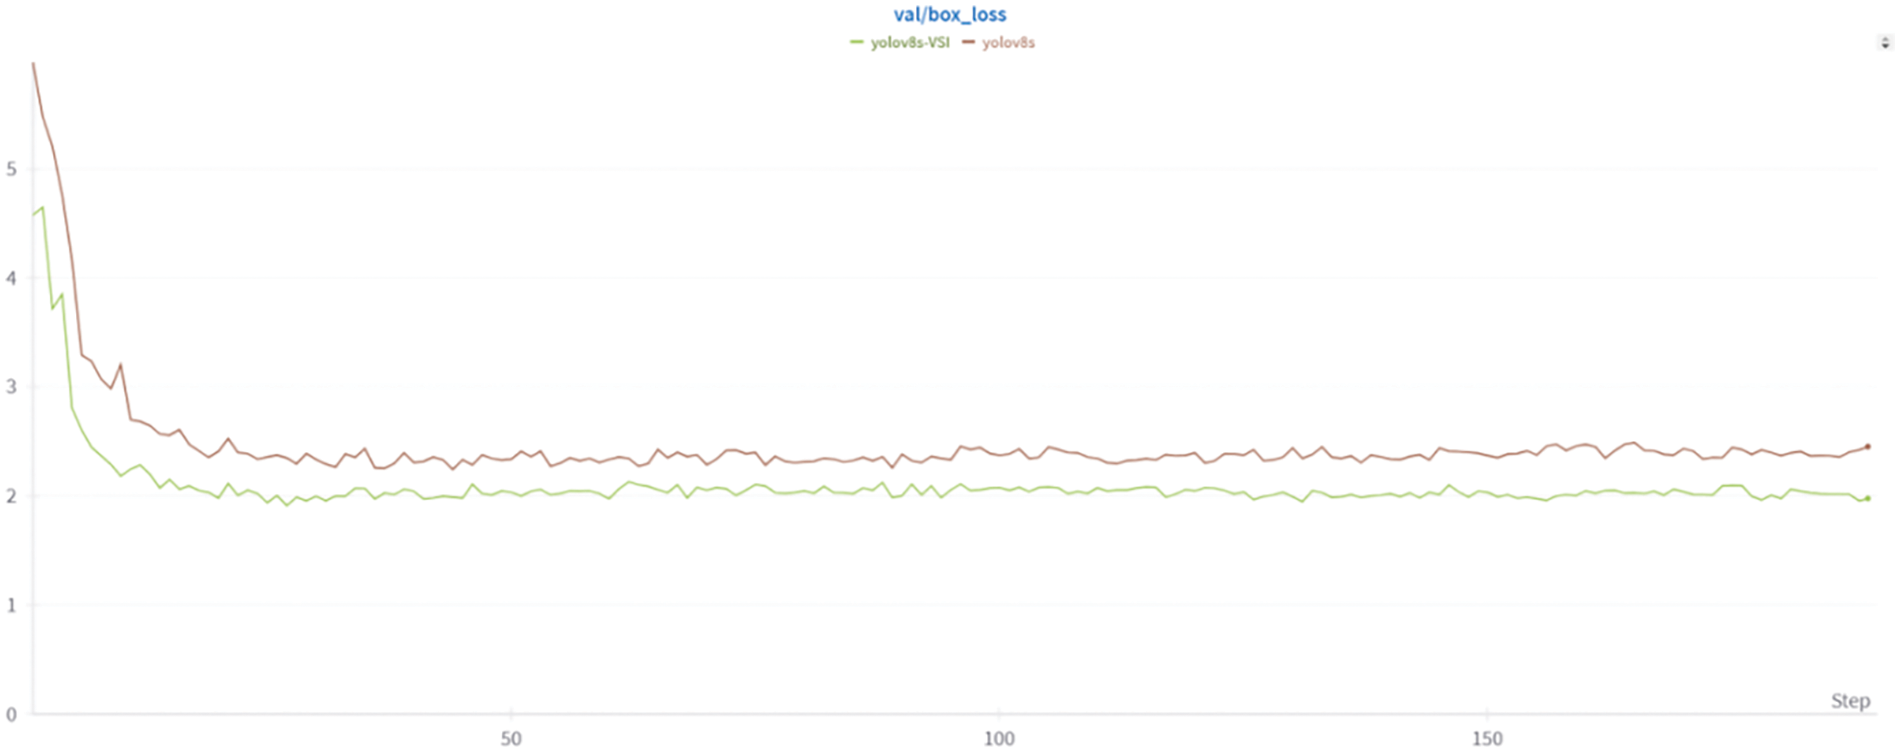
Figure 13: Prediction box loss curve
To further validate the effectiveness of YOLO-VSI, this study compared with other mainstream object detection algorithms under the same experimental conditions, as shown in Table 4.

From the data comparison in the table, classic FasterRCNN and SSD algorithms exhibit characteristics such as slow detection speed, large model size, and lower detection accuracy in this task. Currently, the newer RT-DETR, YOLOv9s, and YOLOv10s algorithms are slightly better than the YOLO baseline model in terms of mAP. Among them, the RT-DETR model has a large amount of computation and volume, and requires a long training time to converge. The YOLOv9s model is 1.3% higher than the YOLOv8 baseline model in mAP, and has a smaller number of parameters and computation. The model algorithm proposed in this study achieves better detection accuracy with only a slight increase in parameter count. It enhances the expressive capability and robustness of the baseline YOLOv8s model and performs best in railway turnouts defect detection tasks.
4.6 Comparison of Detection Performance
To better visually assess the detection performance of YOLO-VSI in railway turnouts defect detection tasks, Fig. 14 shows the comparison of the real annotation box of the railway turnouts with defects, the detection effect of YOLOv8 and YOLO-VSI under normal lighting, snowy days, nighttime and shadow environments.
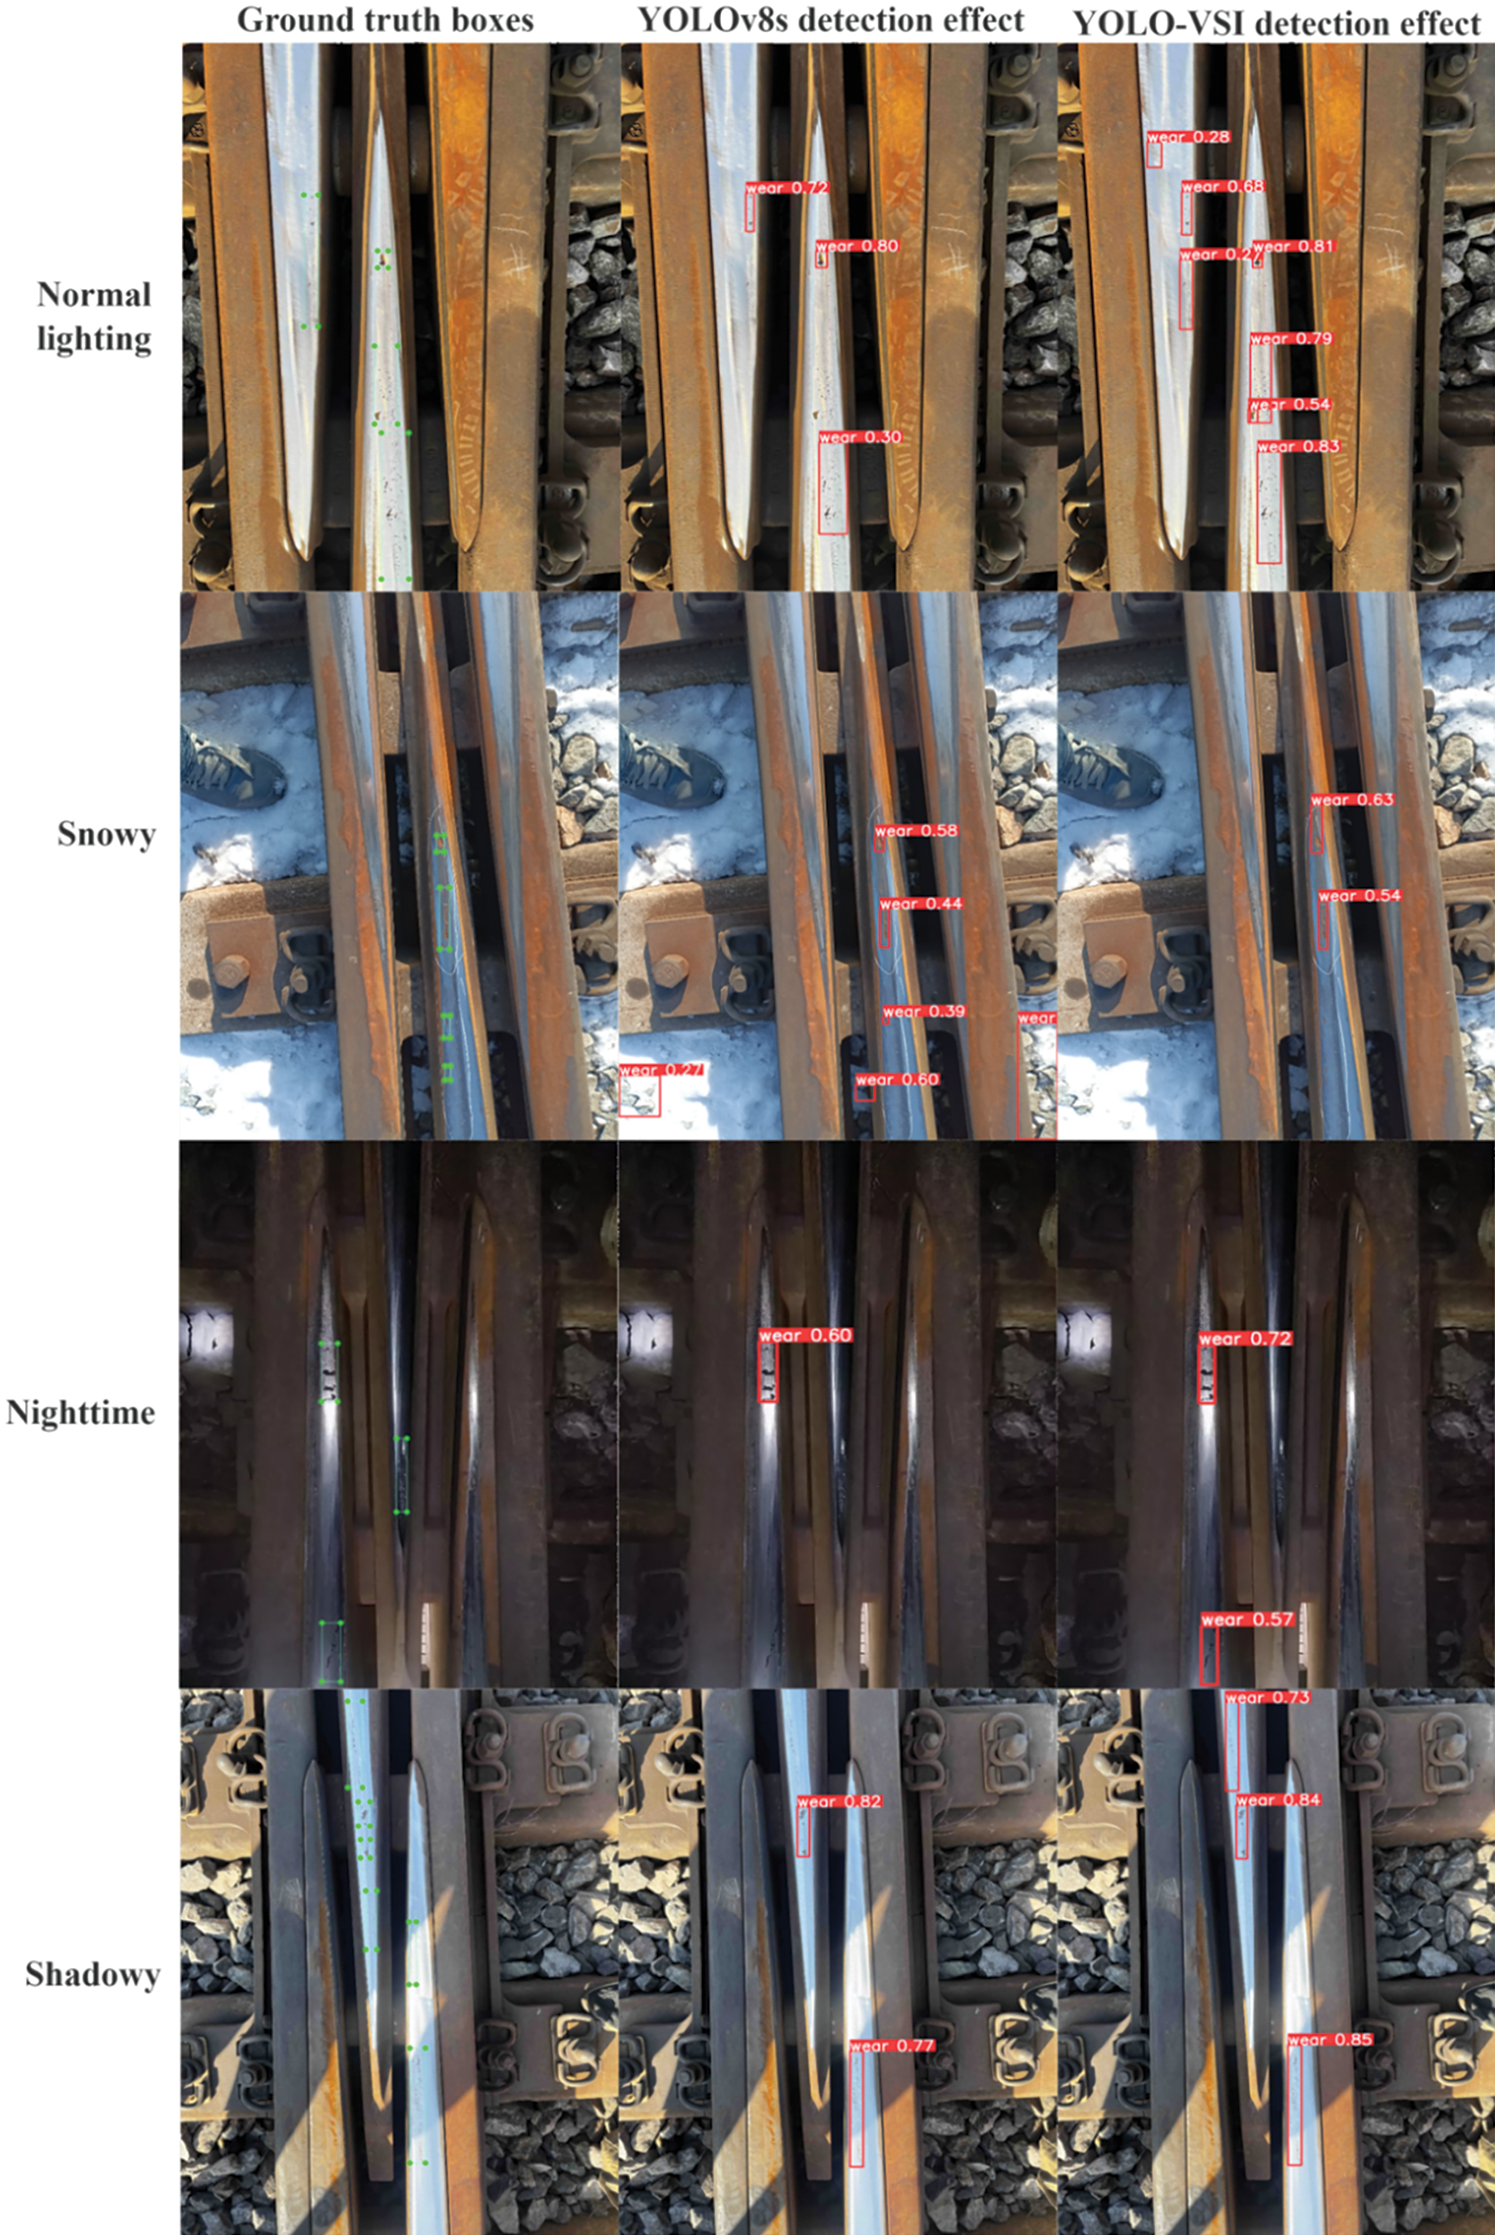
Figure 14: Comparison of defect detection in snowy conditions
From the detection results in the second column of Fig. 14, it is evident that in the complex snowy environment, the baseline model experiences false detections due to the white snowy background and rocks, highlighting the dataset’s inherent complexity. The improved YOLO-VSI mitigates the environmental influences, focusing the model more accurately on the railway turnouts and reducing false detections, thereby increasing detection accuracy. From the detection results in the third row of Fig. 14, it can be seen that in the complex environment at night, the improved model demonstrates greater recognition accuracy compared to the baseline model, but there is still a phenomenon of missed detection of more complex defects. As seen in the first and fourth row of Fig. 14 and supported by the experimental data of YOLO-VSI, the model shows improved detection precision and recall compared to YOLOv8s, addressing issues of missed detections and effectively identifying defects in small targets within the railway turnouts, however, some smaller defects are still missed. In conclusion, the improved model demonstrates enhanced precision in detecting defects in railway turnouts, compared with the baseline model, it is better adapted to complex environments and small-scale defects, though there is still potential for further enhancement.
4.7 Model Generalization Experiments
To verify the model’s generalization, we replaced the railway turnouts dataset with the NEU-DET dataset, which consists of six types of surface defects on hot-rolled steel strips, as shown in Fig. 15. It is widely recognized and reliable, and the related defects it contains are similar to those of railway turnouts. It can provide a fair external benchmark for the experiment to measure the performance of the proposed model on other defect detection tasks. This dataset includes 1800 grayscale images, with each defect type containing 300 samples.

Figure 15: Sample data from the NEU-DET dataset
As shown in Fig. 16 and Table 5, compared to the original YOLOv8 model, the improved model shows an accuracy improvement for each defect category. The recall rate of the model increased by 2.2%, indicating a reduction in the probability of misdetection for multi-scale defects. The overall category accuracy improved by 2.3%. The enhanced YOLO-VSI model also demonstrated better detection performance on this dataset, indicating that the model improvements have a certain degree of generalizability.
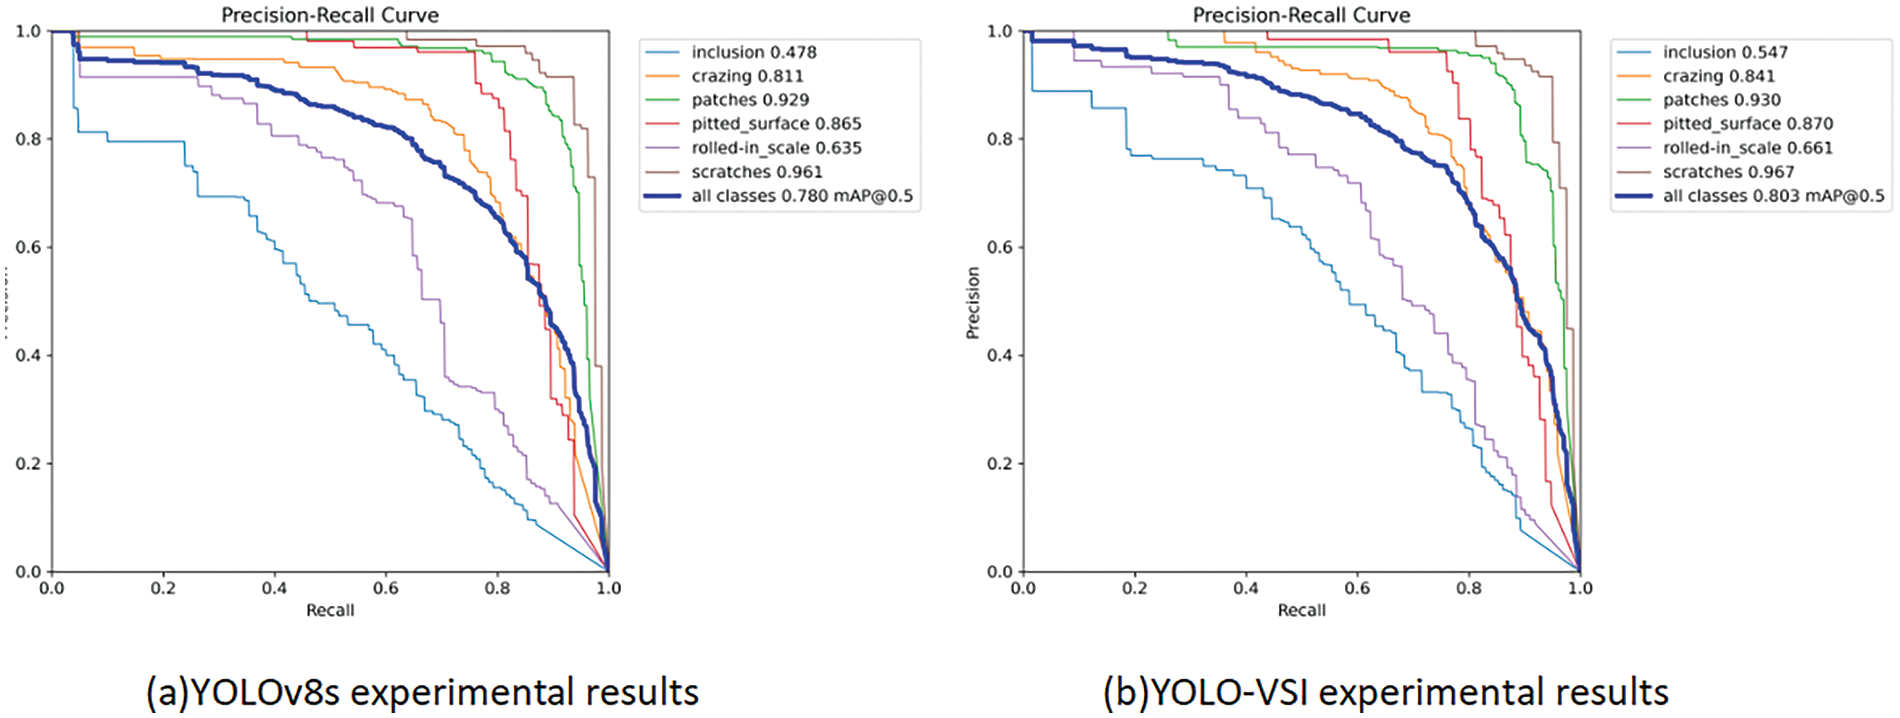
Figure 16: Experimental results on the NEU-DET dataset

An improved YOLO-VSI model is proposed in this paper, designed for detecting railway turnout defects, demonstrating exceptional performance in scenarios involving complex backgrounds, multi-scale defects. Compared to traditional methods, the YOLO-VSI model enhances the C2f module by introducing a selective state space model, which captures long-range dependencies within sequences and improves the model’s capability to extract features in challenging environments. In the neck layer, the SPDConv and OKM modules are introduced to enhance the original PAFPN structure, significantly improving the detection accuracy for small-scale defects. The use of Inner-CIoU instead of CIoU as the loss function enables adaptive adjustment for targets of different sizes. These improvements effectively reduce the false detection rate in railway turnout defect detection tasks. Experimental results show that the YOLO-VSI model outperforms existing methods in terms of both detection accuracy and efficiency, particularly excelling in small-scale defect detection and complex scenarios. Comparative analysis further validates the effectiveness and practical value of the proposed method.
Future research could focus on further optimizing the model’s real-time detection capabilities and making the network more lightweight to meet the higher speed requirements of industrial applications. Additionally, exploring the potential applications of the YOLO-VSI model in other industrial detection fields, such as defect detection in electronic products, is worthwhile. Expanding and optimizing the dataset will also be necessary for subsequent practical detection tasks.
Acknowledgement: We thank all the members who have contributed to this work with us.
Funding Statement: The authors received no specific funding for this study.
Author Contributions: The authors confirm contribution to the paper as follows: study conception and design: Zhilong Lu; data collection: Chenghai Yu; analysis and interpretation of results: Zhilong Lu; draft manuscript preparation: Chenghai Yu. All authors reviewed the results and approved the final version of the manuscript.
Availability of Data and Materials: Data is not available due to commercial restrictions.
Ethics Approval: Not applicable.
Conflicts of Interest: The authors declare that they have no conflicts of interest to report regarding the present study.
References
1. T. A. Finochenko, L. V. Dergacheva, and I. A. Yaitskov, “Risk management in transportation safety system,” IOP Conf. Ser.: Earth Environ. Sci., vol. 666, no. 2, 2021, Art. no. 022050. doi: 10.1088/1755-1315/666/2/022050. [Google Scholar] [CrossRef]
2. D. Baranovskyi, L. Muradian, and M. Bulakh, “The method of assessing traffic safety in railway transport,” IOP Conf. Ser.: Earth Environ. Sci., vol. 666, no. 4, 2021, Art. no. 042075. doi: 10.1088/1755-1315/666/4/042075. [Google Scholar] [CrossRef]
3. A. S. Franca and R. F. Vassallo, “A method of classifying railway sleepers and surface defects in real environment,” IEEE Sens. J., vol. 21, no. 10, pp. 11301–11309, Oct. 2020. doi: 10.1109/JSEN.2020.3026173. [Google Scholar] [CrossRef]
4. W. Feng, H. Liu, D. Zhao, and X. Xu, “Research on defect detection method for high-reflective-metal surface based on high dynamic range imaging,” Optik, vol. 206, no. 8, 2020, Art. no. 164349. doi: 10.1016/j.ijleo.2020.164349. [Google Scholar] [CrossRef]
5. R. Girshick, J. Donahue, T. Darrell, and J. Malik, “Rich feature hierarchies for accurate object detection and semantic segmentation,” presented at the IEEE/CVF Conf. Comput. Vis. Pattern Recognit. (CVPRColumbus, OH, USA, Jun. 23–28, 2014, pp. 580–587. [Google Scholar]
6. R. Girshick, “Fast R-CNN,” presented at the IEEE Int. Conf. Comput. Vis. (ICCVSantiago, Chile, Dec. 11–18, 2015, pp. 1440–1448. [Google Scholar]
7. S. Zhai, D. Shang, S. Wang, and S. Dong, “DF-SSD: An improved SSD object detection algorithm based on DenseNet and feature fusion,” IEEE Access, vol. 8, pp. 24344–24357, 2020. doi: 10.1109/ACCESS.2020.2971026. [Google Scholar] [CrossRef]
8. J. Redmon, S. Divvala, R. Girshick, and A. Farhadi, “You only look once: Unified, real-time object detection,” presented at the IEEE/CVF Conf. Comput. Vis. Pattern Recognit. (CVPRLas Vegas, NV, USA, Jun. 26–Jul. 1, 2016, pp. 779–788. [Google Scholar]
9. C. Y. Wang, A. Bochkovskiy, and H. Y. M. Liao, “YOLOv7: Trainable bag-of-freebies sets new state-of-the-art for real-time object detectors,” presented at the IEEE/CVF Conf. Comput. Vis. Pattern Recognit. (CVPRVancouver, BC, Canada, Jun. 18–22, 2023, pp. 7464–7475. [Google Scholar]
10. C. Y. Wang, I. H. Yeh, and H. Y. M. Liao, “YOLOv9: Learning what you want to learn using programmable gradient information,” 2024, arXiv:2402.13616. [Google Scholar]
11. N. Carion, F. Massa, G. Synnaeve, N. Usuniere, A. Kirillov and S. Zagoruyko, “End-to-end object detection with transformers,” presented at the Eur. Conf. Comput. Vis. (ECCVGlasgow, UK, Aug. 23–28, 2020, pp. 213–229. [Google Scholar]
12. Y. Zhao et al., “DETRs beat YOLOs on real-time object detection,” presented at the IEEE/CVF Conf. Comput. Vis. Pattern Recognit. (CVPRSeattle, WA, USA, Jun. 16–21, 2024, pp. 16965–16974. [Google Scholar]
13. M. Li, H. Wang, and Z. Wan, “Surface defect detection of steel strips based on improved YOLOv4,” Comput. Electr. Eng., vol. 102, no. 6, 2022, Art. no. 108208. doi: 10.1016/j.compeleceng.2022.108208. [Google Scholar] [CrossRef]
14. B. Liang, J. Lu, and Y. Cao, “Rail surface damage detection method based on improved U-Net convolutional neural network,” Laser Optoelectron. P., vol. 58, no. 2, 2021, Art. no. 0215009. doi: 10.3788/lop202158.0215009. [Google Scholar] [CrossRef]
15. Y. Zhang, Y. Liu, and C. Wu, “Attention-guided multi-granularity fusion model for video summarization,” Expert. Syst. Appl., vol. 249, 2024, Art. no. 123568. doi: 10.1016/j.eswa.2024.123568. [Google Scholar] [CrossRef]
16. C. Li, A. Xu, Q. Zhang, and Y. Cai, “Steel surface defect detection method based on improved YOLOX,” IEEE Access, vol. 12, pp. 37643–37652, 2024. doi: 10.1109/ACCESS.2024.3374869. [Google Scholar] [CrossRef]
17. Y. Xie, W. Hu, S. Xie, and L. He, “Surface defect detection algorithm based on feature-enhanced YOLO,” Cong. Comput., vol. 15, no. 2, pp. 565–579, 2023. doi: 10.1007/s12559-022-10061-z. [Google Scholar] [CrossRef]
18. Y. Wang, H. Wang, and Z. Xin, “Efficient detection model of steel strip surface defects based on YOLO-V7,” IEEE Access, vol. 10, pp. 133936–133944, 2022. doi: 10.1109/ACCESS.2022.3230894. [Google Scholar] [CrossRef]
19. W. Xie, X. Sun, and W. Ma, “A light weight multi-scale feature fusion steel surface defect detection model based on YOLOv8,” Meas. Sci. Technol., vol. 35, no. 5, p. 055017, 2024. doi: 10.1088/1361-6501/ad296d. [Google Scholar] [CrossRef]
20. F. Guo, J. Liu, Y. Qian, and Q. Xie, “Rail surface defect detection using a transformer-based network,” J. Ind. Inf. Integr., vol. 38, no. 6, 2024, Art. no. 100584. doi: 10.1016/j.jii.2024.100584. [Google Scholar] [CrossRef]
21. Y. Zhang, T. Liu, P. Yu, S. Wang, and R. Tao, “SFSANet: Multiscale object detection in remote sensing image based on semantic fusion and scale adaptability,” IEEE Trans. Geosci. Remote Sens., vol. 62, pp. 1–10, 2024. doi: 10.1109/TGRS.2024.3453376. [Google Scholar] [CrossRef]
22. T. Bai, J. Gao, J. Yang, and D. Yao, “A study on railway surface defects detection based on machine vision,” Entropy, vol. 23, no. 11, 2021, Art. no. 1437. doi: 10.3390/e23111437. [Google Scholar] [PubMed] [CrossRef]
23. Y. Wang, K. Zhang, L. Wang, and L. Wu, “An improved YOLOv8 algorithm for rail surface defect detection,” IEEE Access, vol. 12, pp. 44984–44997, 2024. [Google Scholar]
24. Ultralytics,“YOLOv8,” 2023, Accessed: Jan. 12, 2024. [Online]. Available: https://github.com/ultralytics/ultralytics [Google Scholar]
25. H. Li, P. Xiong, J. An, and L. Wang, “Pyramid attention network for semantic segmentation,” 2018, arXiv: 1805.10180. [Google Scholar]
26. Y. Huang, Z. Chen, and J. Liu, “Limited agricultural spectral dataset expansion based on generative adversarial networks,” Comput. Electron. Agr., vol. 215, no. 22, 2023, Art. no. 108385. doi: 10.1016/j.compag.2023.108385. [Google Scholar] [CrossRef]
27. C. Yu et al., “Improved YOLOv8 for B-scan image flaw detection of the heavy-haul railway,” Meas. Sci. Technol., vol. 35, no. 7, 2024, Art. no. 076106. doi: 10.1088/1361-6501/ad3a05. [Google Scholar] [CrossRef]
28. K. Han, A. Xiao, E. Wu, J. Guo, C. Xu and Y. Wang, “Transformer in transformer,” Proc. Adv. Neural Inf. Process. Syst., vol. 34, pp. 15908–15919, 2021. [Google Scholar]
29. R. E. Kalman, “A new approach to linear filtering and prediction problems,” J. Basic Eng., vol. 82, no. 1, pp. 35–45, 1960. doi: 10.1109/9780470544334.ch9. [Google Scholar] [CrossRef]
30. A. Gu and T. Dao, “Mamba: Linear-time sequence modeling with selective state spaces,” 2023, arXiv:2312.00752. [Google Scholar]
31. L. Zhu, B. Liao, Q. Zhang, X. Wang, W. Liu and X. Wang, “Vision Mamba: Efficient visual representation learning with bidirectional state space model,” 2024, arXiv:2401.09417. [Google Scholar]
32. W. Xu, C. Cui, Y. Ji, X. Li, and S. Li, “YOLOv8-MPEB small target detection algorithm based on UAV images,” Heliyon, vol. 10, no. 8, 2024. doi: 10.1016/j.heliyon.2024.e29501. [Google Scholar] [PubMed] [CrossRef]
33. R. Sunkara and T. Luo, “No more strided convolutions or pooling: A new CNN building block for low-resolution images and small objects,” presented at the Joint Eur. Conf. Mach. Learn. Knowl. Discov. Databases, Grenoble, France, Sep. 19–23, 2022, pp. 443–459. doi: 10.1007/978-3-031-26409-2_27. [Google Scholar] [CrossRef]
34. Y. Cui, W. Ren, and A. Knoll, “Omni-kernel network for image restoration,” presented at the AAAI Conf. Artif. Intell., Vancouver, BC, Canada, Feb, 2024, vol. 38, no. 2, pp. 1426–1434. [Google Scholar]
35. H. Zhang, C. Xu, and S. Zhang, “Inner-IoU: More effective intersection over union loss with auxiliary bounding box,” 2023,arXiv:2311.02877. [Google Scholar]
Cite This Article
 Copyright © 2024 The Author(s). Published by Tech Science Press.
This work is licensed under a Creative Commons Attribution 4.0 International License , which permits unrestricted use, distribution, and reproduction in any medium, provided the original work is properly cited.


 Submit a Paper
 Propose a Special lssue
 View Full Text
 Download PDF
 Downloads
 Citation Tools