 Open Access
ARTICLE
A Novel YOLOv5s-Based Lightweight Model for Detecting Fish’s Unhealthy States in Aquaculture
1 School of Mechanical Engineering and Rail Transit, Changzhou University, Changzhou, 213164, China
2 School of Microelectronics and Control Engineering, Changzhou University, Changzhou, 213164, China
3 School of Electrical and Information Engineering, Jiangsu University, Zhenjiang, 212013, China
* Corresponding Author: Bing Shi. Email:
Computers, Materials & Continua 2024, 81(2), 2437-2456. https://doi.org/10.32604/cmc.2024.056377
Received 21 July 2024; Accepted 11 September 2024; Issue published 18 November 2024
Abstract
Real-time detection of unhealthy fish remains a significant challenge in intensive recirculating aquaculture. Early recognition of unhealthy fish and the implementation of appropriate treatment measures are crucial for preventing the spread of diseases and minimizing economic losses. To address this issue, an improved algorithm based on the You Only Look Once v5s (YOLOv5s) lightweight model has been proposed. This enhanced model incorporates a faster lightweight structure and a new Convolutional Block Attention Module (CBAM) to achieve high recognition accuracy. Furthermore, the model introduces the α-SIoU loss function, which combines the α-Intersection over Union (α-IoU) and Shape Intersection over Union (SIoU) loss functions, thereby improving the accuracy of bounding box regression and object recognition. The average precision of the improved model reaches 94.2% for detecting unhealthy fish, representing increases of 11.3%, 9.9%, 9.7%, 2.5%, and 2.1% compared to YOLOv3-tiny, YOLOv4, YOLOv5s, GhostNet-YOLOv5, and YOLOv7, respectively. Additionally, the improved model positively impacts hardware efficiency, reducing requirements for memory size by 59.0%, 67.0%, 63.0%, 44.7%, and 55.6% in comparison to the five models mentioned above. The experimental results underscore the effectiveness of these approaches in addressing the challenges associated with fish health detection, and highlighting their significant practical implications and broad application prospects.Keywords
Intensive recirculating aquaculture brings advantages, such as energy efficiency, environmental friendliness, and controllable water quality. However, the most serious disadvantage is that fish become unhealthy and even die due to the deterioration of water quality, the closed breeding system, and high breeding density. Fish mortality is particularly high when abnormal states occur. Currently, fish status detection heavily depends on manual observation and aquaculture personnel’s experiences, it will require more time and labor resources, leading to inefficiency and inaccuracy. Therefore, it is necessary to introduce a method of real-time and accurate detection of fish status to enhance the level of automation in intensive recirculating aquaculture [1].
Computer vision technology, known for its extensive application in image classification, target detection, and tracking, has gained significant traction within the aquaculture industry, encompassing tasks like fish classification, identification, counting, behavior analysis, and prediction of water quality parameters. The researchers from Nanyang Technological University proposed a novel end-to-end deep visual learning pipeline, Aqua3DNet, to estimate fish pose. Additionally, they implemented a depth estimation model utilizing Saliency Object Detection (SOD) masks to track the 3D position of fish, and their method achieved the expected performance [2]. The researchers in [3] employed computer vision technology for the fully automated identification of Atlantic salmon based on the dot patterns on their skin. This approach provides a non-invasive alternative to traditional invasive fish tagging and opens new possibilities for individual management. Their method was tested on 328 individuals, achieving an identification accuracy of 100%. The authors in [4] proposed an automated method for identifying individual brown trouts based on deep learning. They extracted multi-scale convolutional features to capture both low-level attributes and high-level semantic components for embedding space representation and the identification method distinguished individual fish with 94.6% precision and 74.3% recall on a dataset NINA204. Additionally, the authors in [5] introduced a Residual Network50 Long-Short-Term-Memory (Resnet50-LSTM) algorithm designed for identifying fundamental behaviors during fish breeding, demonstrating remarkable detection efficacy, robustness, and effectiveness, particularly in breeding settings characterized by low light intensity, high breeding density, and complex environmental conditions.
With the rapid development of deep learning and the continuous improvement of the accuracy of the target detection algorithm, the improved YOLO algorithm is widely used in aquaculture. To reduce the false detection of small fish and the ability to detect fish appearance in a dynamic environment, researchers from Bangladesh proposed a fish detection model based on deep learning, YOLO-Fish. YOLOv3 has been enhanced by fixing the upsampling step and adding spatial pyramid pooling [6,7]. Researchers from Egypt proposed a combination of color Multi-Scale Retinex color enhancement technology and YOLO algorithm to achieve maximum detection accuracy and combined the box size of detected objects with an optical flow algorithm to extract the trajectory of fish accurately [8–10]. In recent years, by reducing the number of parameters, calculations, and weight size of the model, YOLO’s lightweight structure has gradually become popular. Some researchers, based on YOLOv3, proposed a lightweight target detection network Tuna-YOLO for mobile devices. They used MobileNetv3 as the backbone structure to reduce parameters and the number of calculations. Then, the SENET (Squeeze-and-Excitation Networks) module replaced the CBAM attention module to further improve the feature extraction capability of tuna, but the detection speed decreased [11–13]. Researchers proposed a lightweight and high-precision detection model based on an improved version of the YOLOv5. In this model, GhostConv and C3Ghost modules were integrated into the YOLOv5 network to reduce the number of parameters meanwhile ensuring detection accuracy. In addition, the Sim-SPPF (Simplified SPPF) module was adopted to replace SPPF (Spatial Pyramid Pooling–Fast) in the YOLOv5 backbone network. To improve the computational efficiency and accurate target detection ability, researchers constructed a slim scale detection model to achieve the aims. However, it brought a huge demand for GPU (Graphics Processing Unit) resources [14–16]. To sum up, in the process of target detection, detection speed, and detection accuracy are always the criteria for evaluating a model. Through constructing more deeper network, the improvement of accuracy usually can be obtained bringing with the problem of decreased detection speed, and huge demand for hardware.
In this study, the authors propose an improved YOLOv5s-based lightweight model to balance the detection accuracy, detection speed, and demand for hardware in intensive recirculation aquaculture.
2.1 Descriptions of Data Acquisition
The objective of this study is to detect fish unhealthy states, particularly rollover, during the aquaculture process. Due to the challenge of obtaining a sufficient number of image samples of fish anomalies from existing databases and real farming environments, it is essential to collect and label the data ourselves. In order to gather the real-scene dataset, a modular system is employed for data acquisition, as depicted in Fig. 1.
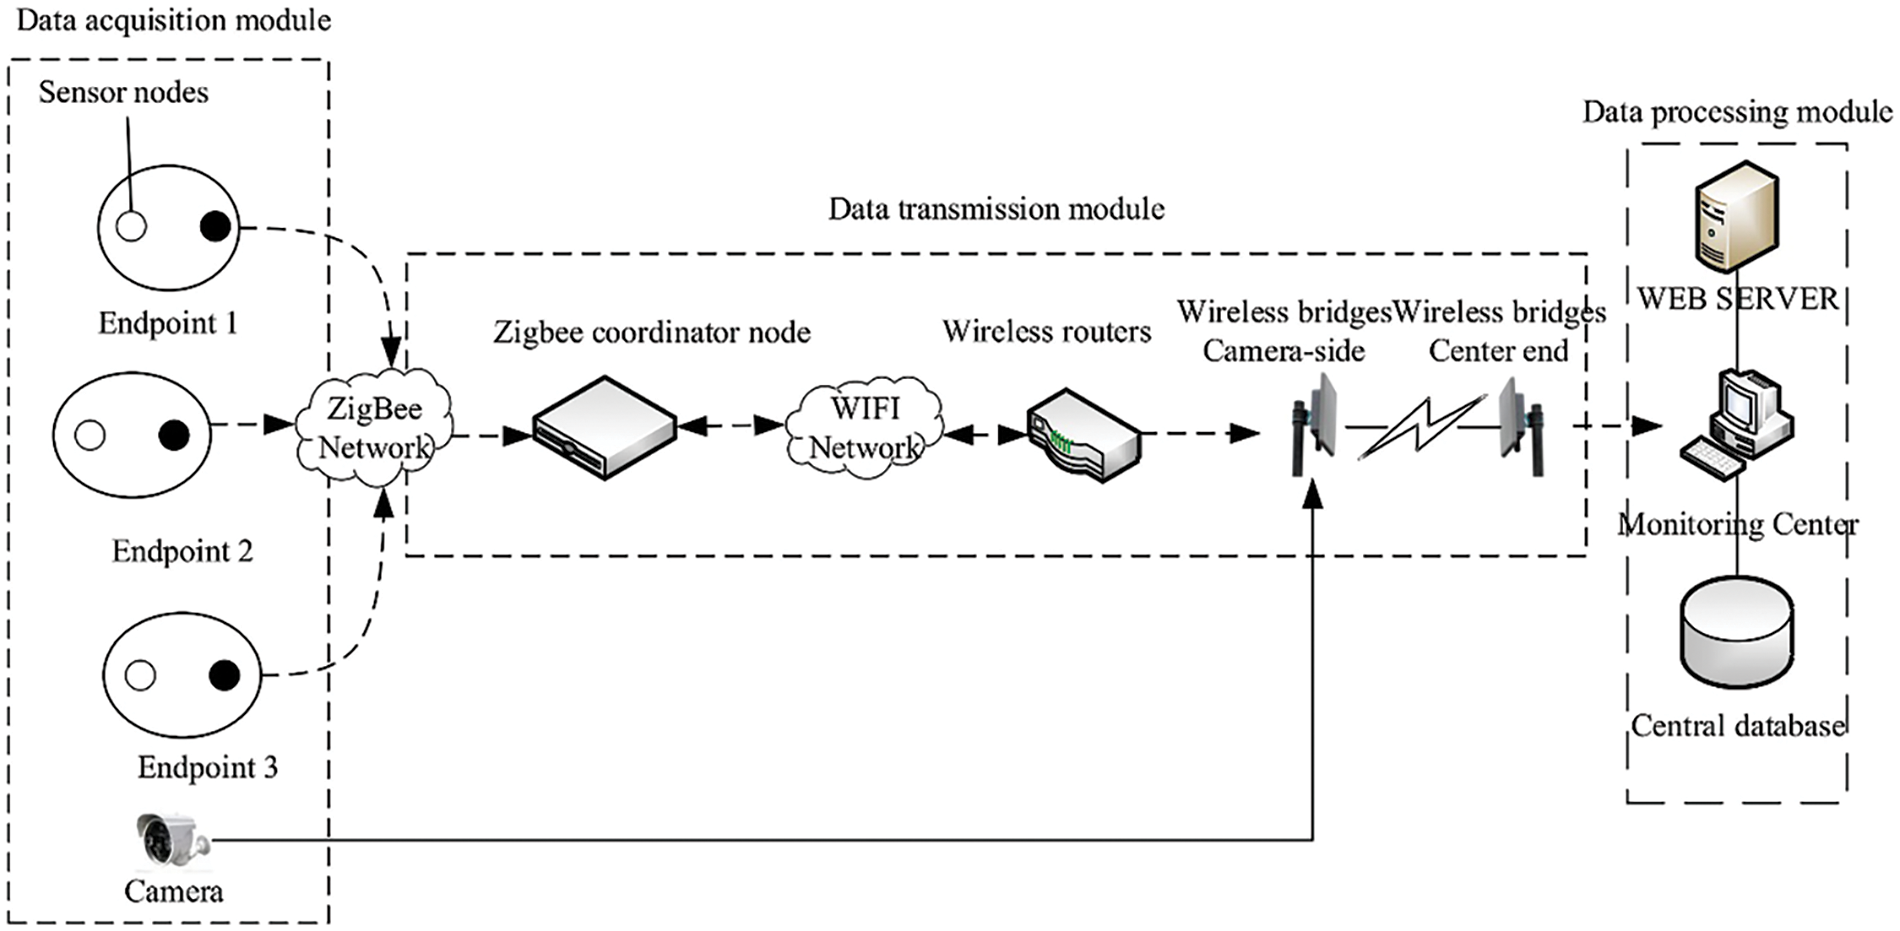
Figure 1: Structure of data acquisition system
This system consists of a data acquisition module, a data transmission module, and a data processing module. Sensor nodes are employed for the real-time monitoring of water quality parameters in aquaculture areas. The collected data is transmitted to ZigBee coordinator nodes, which package it according to predefined protocols. Subsequently, the packed data is sent to the monitoring center via routers and wireless bridges. In parallel, image capture devices with cameras continuously gather real-time images of the aquaculture area, which are then transmitted to the monitoring center through Ethernet ports, routers, and wireless bridges. This comprehensive setup allows aquaculture personnel to monitor crucial information such as water quality, fish population, and other vital factors in real-time. The monitoring center acts as the central hub of the system, responsible for receiving, displaying, and analyzing both sensor data and image information. It assists aquaculture personnel in comprehending and analyzing water quality details, while also enabling control commands for adjusting cameras and monitoring the operation of image capture devices for underwater observation.
The system is deployed at Ruoyu Lake in Changzhou City, China (E119°56′55″, N31°41′15″). A total of 1312 images depicting unhealthy states of fish were obtained. The deployment location and the selections of fish’s unhealthy states are illustrated in Figs. 2 and 3.
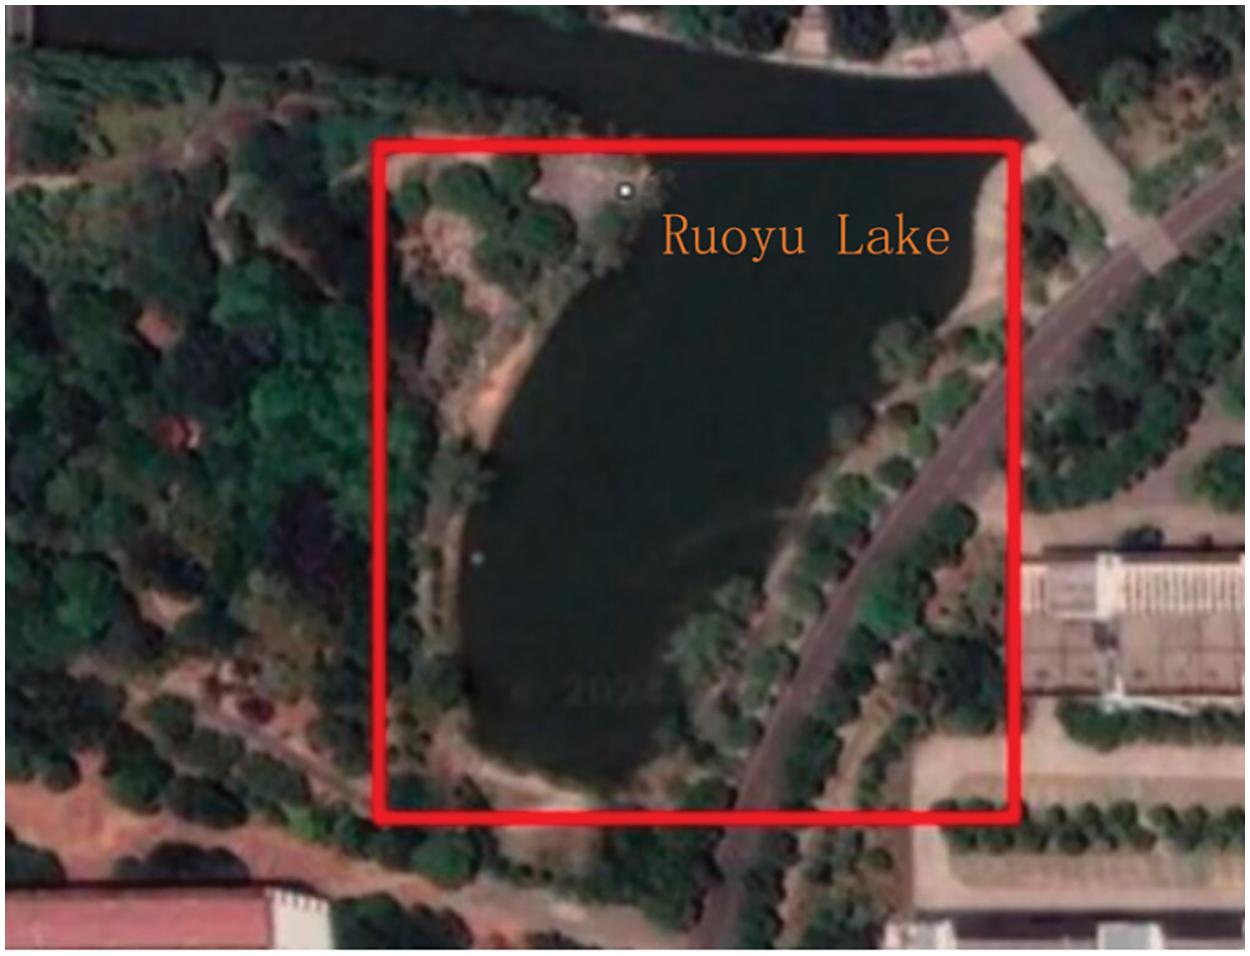
Figure 2: Deployment location

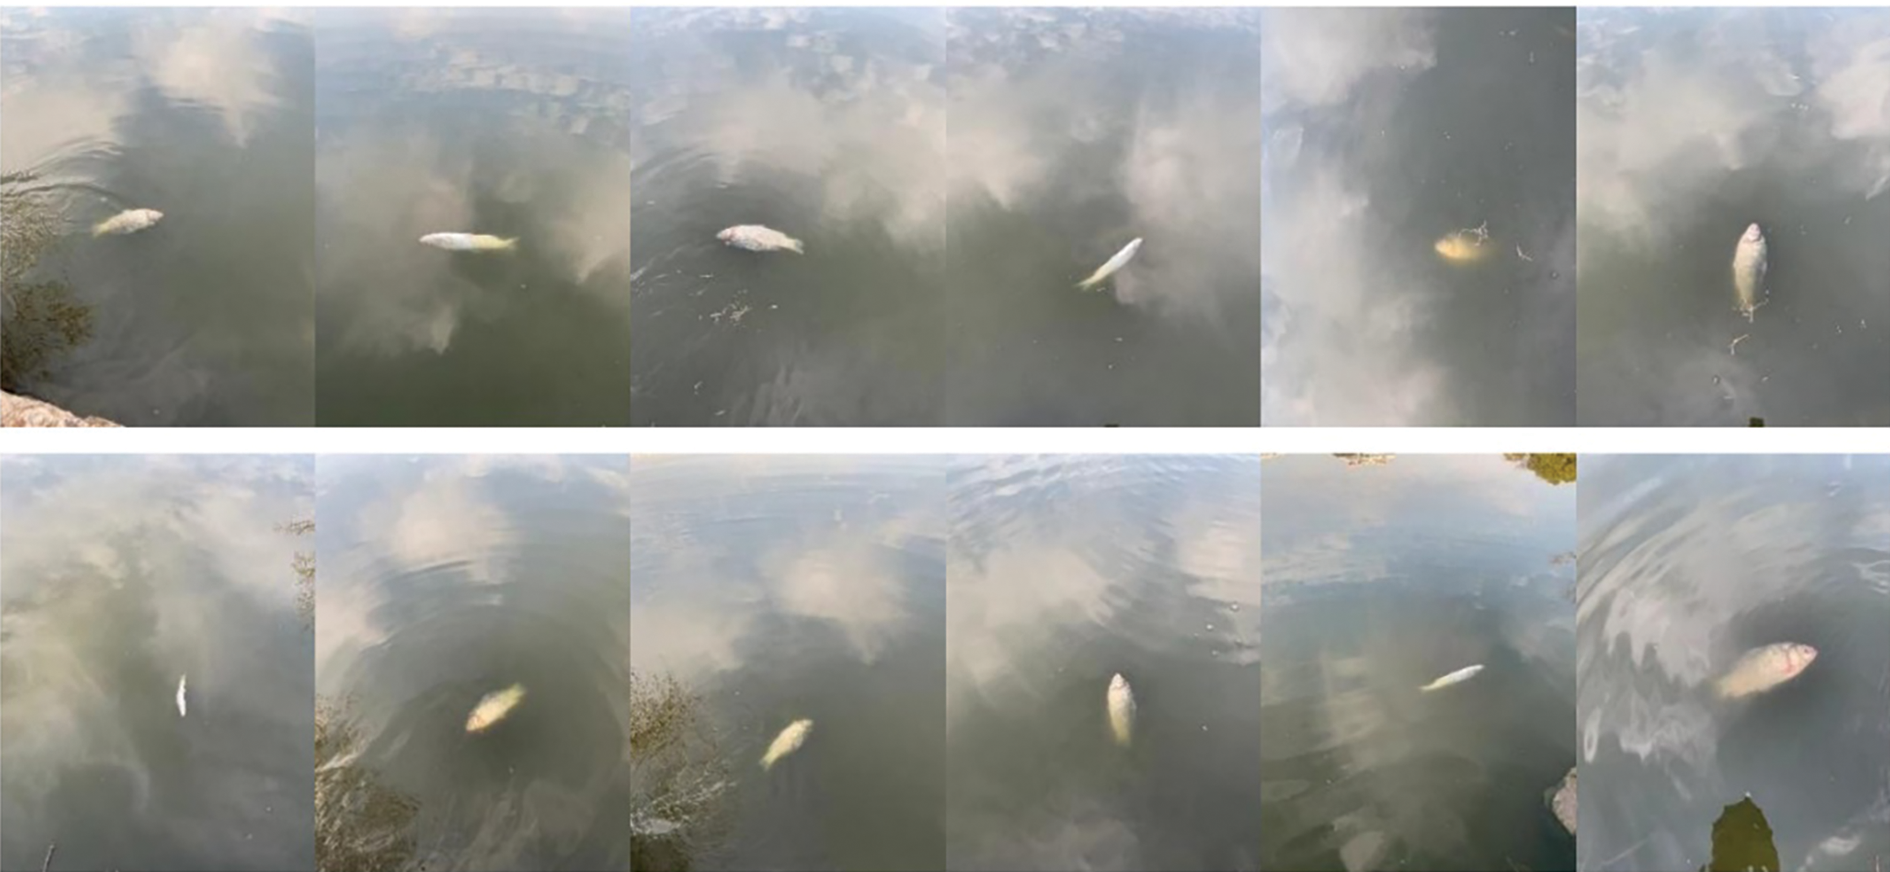
Figure 3: Selections of unhealthy fish
Due to the challenges in acquiring a sufficient number of images for model training, even from well-established datasets such as COCO and ImageNet, suitable training images are often lacking. Consequently, the authors have to create their own dataset. Dying fish were placed in the target lake referenced in the study and utilized a camera connected to a computer to capture images at varying distances and under diverse backgrounds by adjusting the focus. Because of the limited number of target samples collected from images showing fish in unhealthy states, it is essential to augment the dataset to enhance the model’s generalization ability and prevent overfitting. Alongside traditional methods like mirroring, flipping, and rotation, this study simulated environmental factors such as time and weather conditions to expand the dataset to 2000 images. Techniques such as blurring, adding noise, and adjusting brightness were applied for this purpose [17,18]. The acquired images were manually annotated using Labelimg software, and the annotations were formatted in text files suitable for the YOLOv5s algorithm. The label “warning-fish” was assigned to denote instances of fish’s rollover behavior. For the experiment, the dataset was split into 1600 images for training, 200 for validation, and 200 for testing purposes.
2.3 Descriptions of the Methods
In this study, a new model, YOLOv5s-CBAM-BackboneFaster, is proposed for detecting unhealthy (rollover) fish, the construction process of the new model is depicted in Fig. 4.
(1) The model’s backbone network is optimized with the FasterNet module to improve the standard convolutional blocks for lightweight purposes. Furthermore, the new CBAM is introduced before the SPPF feature fusion module to enhance feature extraction capabilities, resulting in the YOLOv5s-CBAM-BackboneFaster model.
(2) To enhance detection accuracy, the α-SIOU loss function is proposed by combining α-IoU and SIOU. α-IoU focuses on precise object localization by penalizing inaccurate bounding box predictions, while SIOU refines object localization by considering the spatial context.
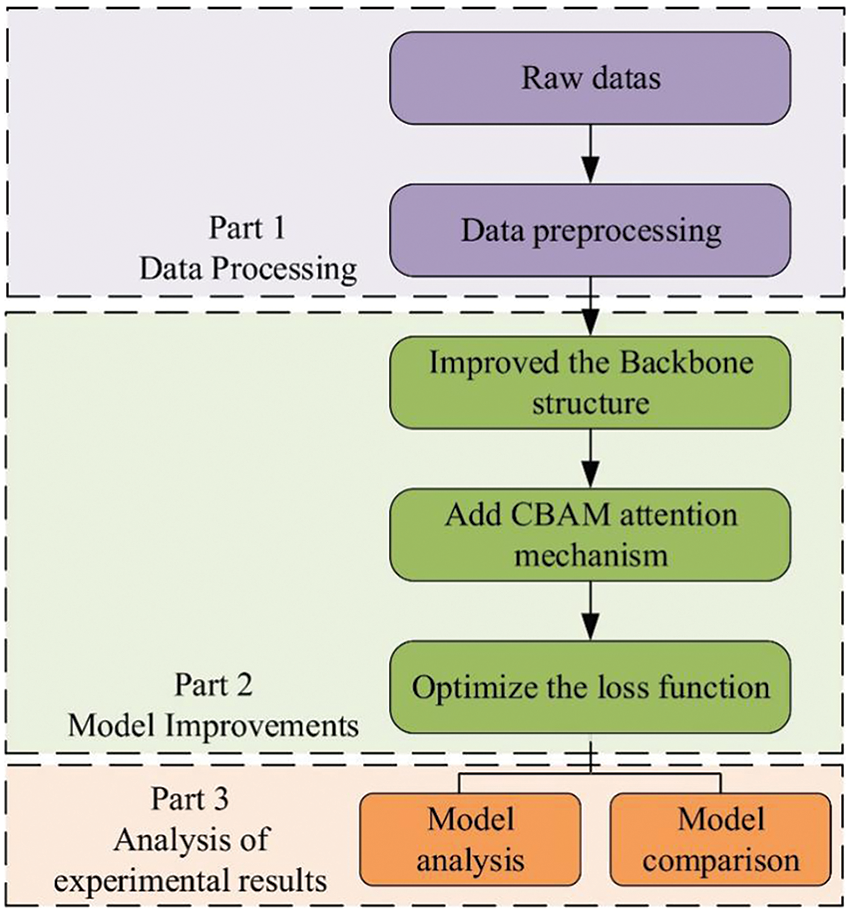
Figure 4: Framework and process of the mode
Enhancements in network architecture and loss function design are essential for enhancing the performance of the YOLOv5s model, which is specifically optimized for detecting fish unhealthy states such as rollovers. This approach not only improves feature extraction capabilities but also fine-tunes the loss function to achieve more precise and reliable unhealthy detection results.
2.3.1 Updated Network for YOLOv5s
The FasterNet module, as depicted in Fig. 5, introduces a new structure called Partial Convolution (PConv). PConv works by applying a regular convolution on a portion of the input channel for spatial feature extraction and leaving the rest of the channels intact. For continuous or regular memory access, the first or last contiguous channel represents the entire feature map. The input and output feature maps have the same number of channels without losing generality. Therefore, the FLOPs (Floating Point Operations) of PConv are only
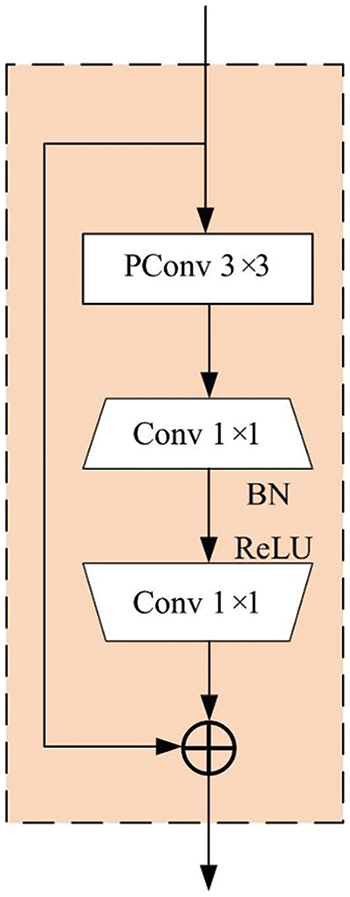
Figure 5: FasterNet module
PConv convolution reduces the amount of memory access, optimizes the number of parameters caused by redundant calculation, and dramatically improves the ability to capture spatial features, as shown in Fig. 6. FasterNet is constructed based on PConv and 1 × 1 convolutional structure, and its types include FasterNet-T0, FasterNet-T1, and FasterNet-T2, and the number of model parameters is from small to large.
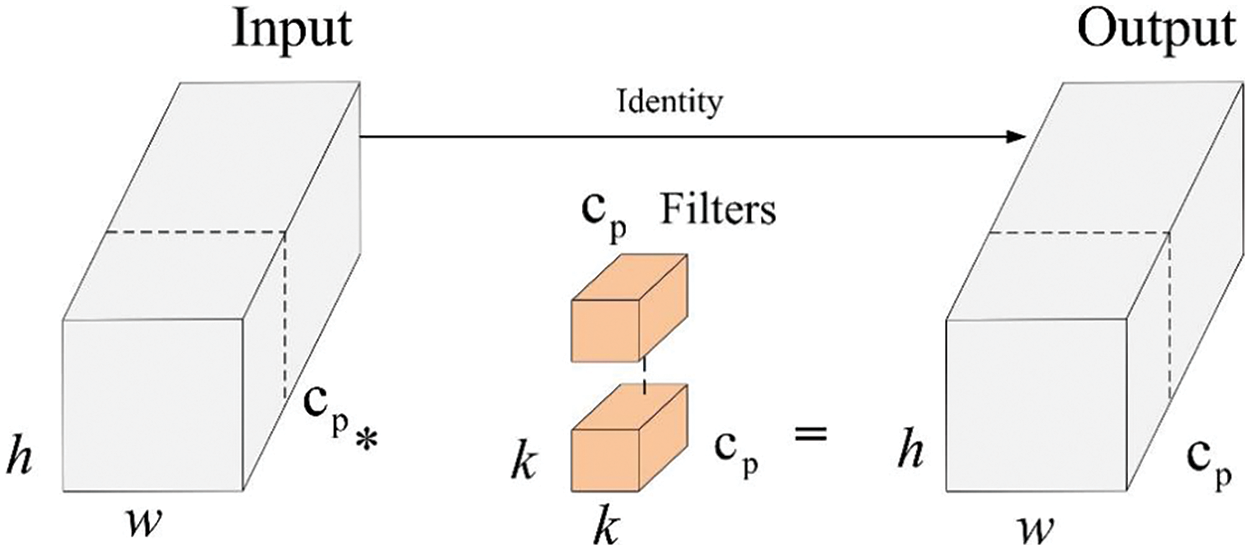
Figure 6: PConv convolution block
CBAM is a module that multiplies attention mapping by input feature mapping for adaptive feature refinement [19,20]. CBAM consists of two sequential submodules: the Channel Attention Module (CAM) and the Spatial Attention Module (SAM), as shown in Fig. 7.

Figure 7: The overview of CBAM
The SAM mainly uses average pooling and maximum pooling to aggregate spatial feature information on the input image to obtain a one-dimensional feature map and bring spatial attention feature map through convolution calculation and sigmoid nonlinear processing
In Eq. (1),
The CAM mainly obtains the feature descriptors of the image through maximum pooling and average pooling:
In Eq. (2),
In this study, a novel detection algorithm, YOLOv5s-CBAM-BackboneFaster, is developed, and the new network structure is illustrated in Fig. 8. Initially, the original Conv module in YOLOv5s is replaced with the FasterNet module. Subsequently, the FasterNet is integrated into the original C3 module, resulting in the creation of a new C3-Faster module. Additionally, the CBAM attention mechanism module is incorporated before the SPPF layer to analyze the feature map generated by the backbone network. The SPPF module comes from the enhanced SPP (Spatial Pyramid Pooling) module utilized in YOLOv4. This improved module substitutes three parallel max-pooling operations with serial ones, employing a 5 × 5 pooling kernel for each operation. This modification significantly reduces computational demands while maintaining detection accuracy. In comparison to the SPP module, the SPPF module enhances the model’s detection speed. Fig. 9 illustrates the structural diagram of the SPPF module. Experimental comparisons reveal that the enhanced YOLOv5s model exhibits significantly improved detection performance and training speed compared to the original model.
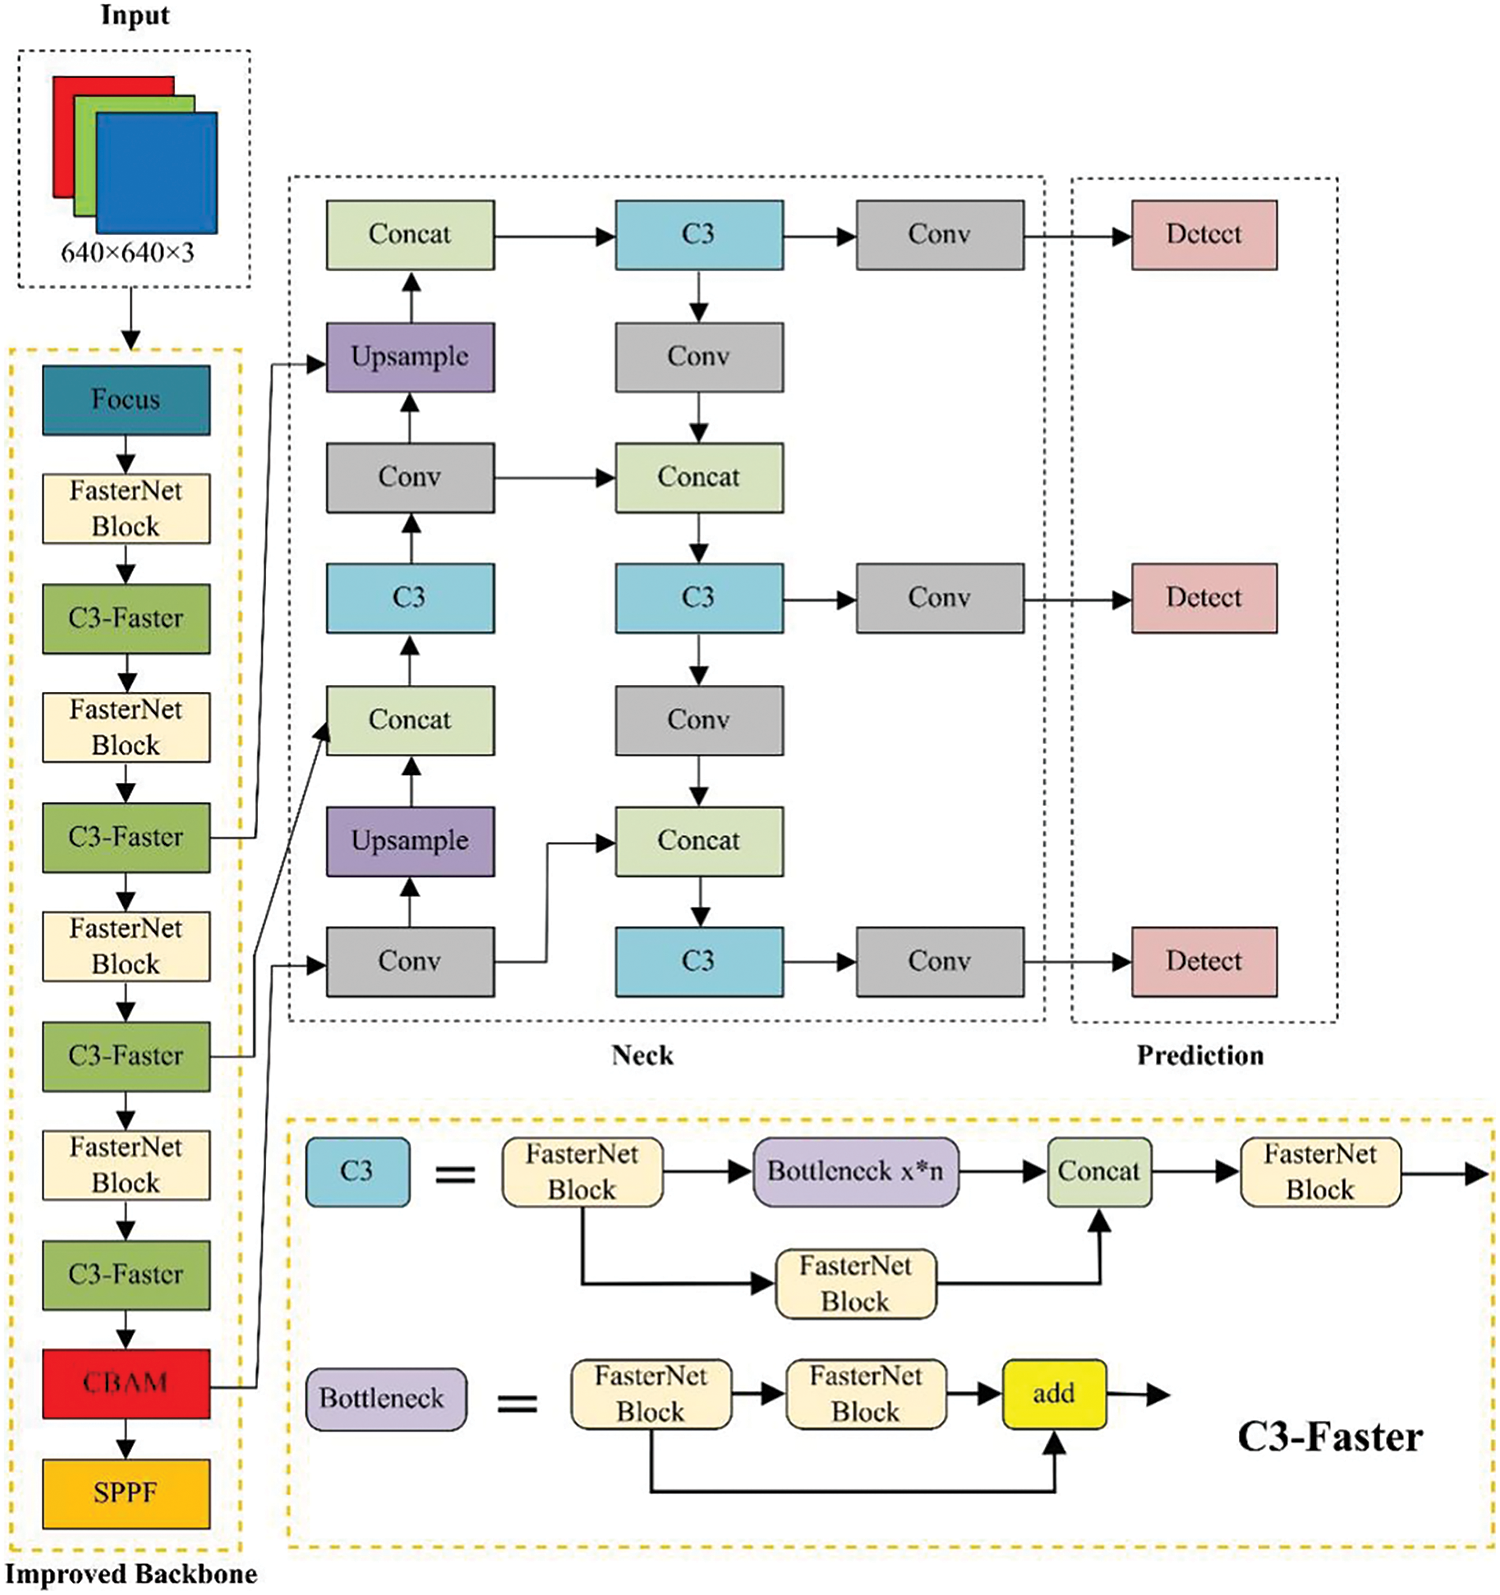
Figure 8: Structure of YOLOv5s-CBAM-BackboneFaster
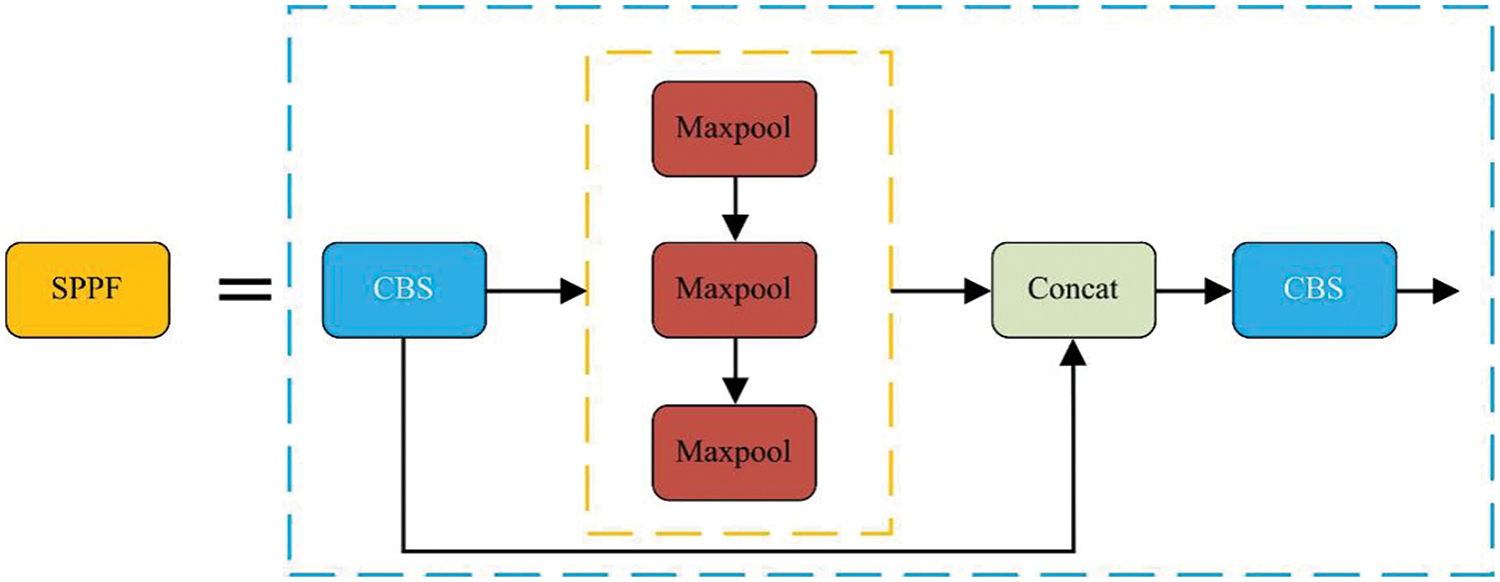
Figure 9: Structure of SPPF
2.3.2 Updated IoU Loss Function for YOLOv5s
In object detection, IoU is used to measure the accuracy of the location information of the prediction result. IoU processes the predicted image by calculating the deviation between the target location indicated by the model and the actual location of the target [21]. As shown in Eq. (3), the more significant the overlap between the exact area of the target and the predicted area, the greater its value, 0 ≤ IoU ≤ 1. The closer the value of IoU is to 1, the better the effect, and the larger the value of IoU, the more accurate the location of the predicted area. In the following formula, A ∩ B represents the overlapping area between the actual and indicated size of the target, A ∪ B represents the space occupied by the exact spot and the predicted area as a whole, and the calculation of the overlap area loss is shown in Eq. (4).
In fish’s states detection, instances arise where two or more regression frames, in proximity to the target, intersect, giving rise to multiple boxes. While considering factors such as the intersection union ratio, center distance, and aspect ratio between the prediction box and the target box, there is a tendency to overlook the actual values of width and height. The effective optimization of the network model can be impeded when the aspect ratio remains constant, but discrepancies exist in the width and height values. Such scenarios pose a challenge to the efficient functioning of the model and underscore the need for a more comprehensive consideration of all relevant factors in fish state detection algorithms. The loss function given in the YOLOv5s model is CIoU (Complete-loU), and its loss function is defined as Eqs. (5)–(7) are descriptions of Eq. (5).
where b is the center point of the prediction box,
In this study, Angle cost, Distance cost and Shape cost, respectively, are presented from Eqs. (8) to (15), respectively.
where
The mathematical definition of the improved LSIoU is shown in Eq. (16). Where Δ stands for Distance cost and Ω stands for Shape cost, as shown in Fig. 10. The loss function
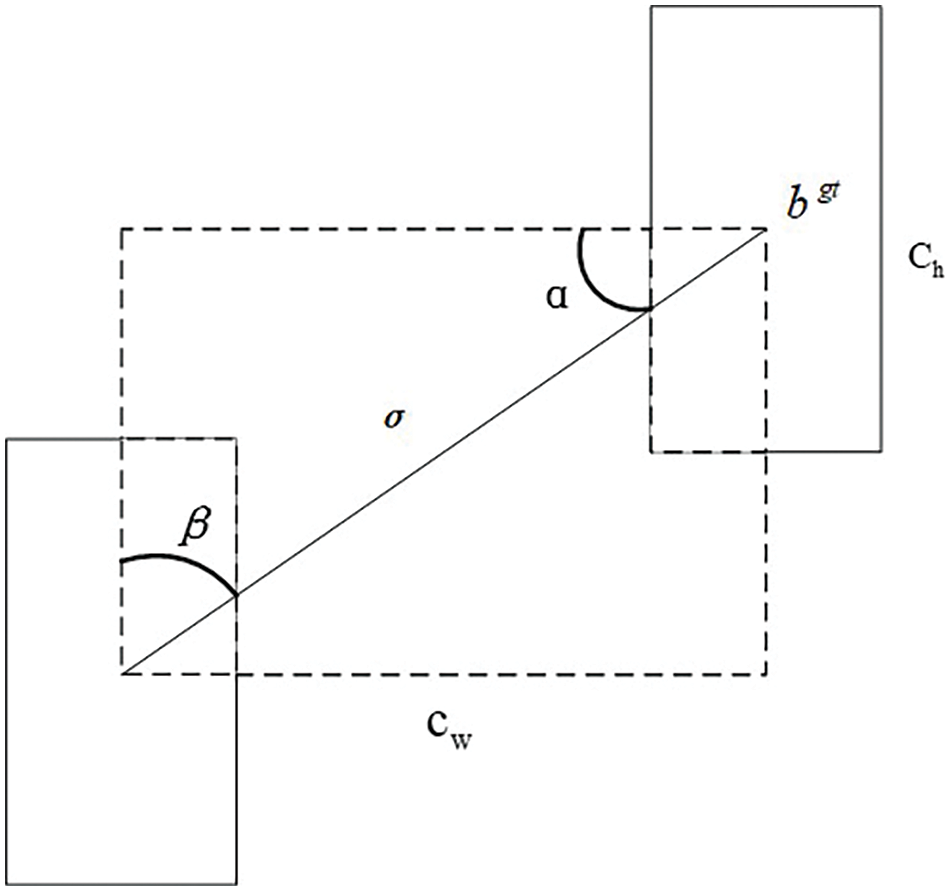
Figure 10: Angle factor in border regression
In this study, the authors employ Precision, Recall, Average Precision (AP), and mean Average Precision (mAP) to assess the training accuracy of the model. Parameters, computation, and model weights characterize the model’s complexity. Frames per second (FPS) serves as a metric for the real-time detection performance of the model [28,29]. Here, Precision signifies the proportion of correctly predicted true positive samples among predicted positive samples, and Recall represents the proportion of correctly predicted true positive samples to all true positive examples, as depicted in Eqs. (19), (20), respectively.
The AP is defined as the area under the Precision-Recall (P-R) curve, while the mAP is calculated as the mean value of AP across the dataset, as depicted in Eqs. (21), (22), respectively.
In the equations, TP denotes the count of samples accurately predicted as positive, FP signifies the count of instances incorrectly anticipated as positive, FN indicates the count of models inaccurately anticipated as unfavorable, and N denotes the total number of classes.
In this study, the proposed model utilizes a Dell Precision 3660 workstation for simulation training. The experiments are conducted using the PyTorch framework, with the detailed information provided in Table 1. The parameters discussed in this study are documented in the PyTorch framework directory located at data/hyp.finetune.yaml. The primary configuration of the network parameters is illustrated in Table 2.


3.1 Training the Proposed Model
Fig. 11 illustrates the outcomes of the enhanced YOLOv5s network model when applied to the training and validation sets. In Fig. 11a, it is observed that the regression loss initially decreases rapidly within the first 20 epochs, followed by a gradual slowdown in the rate of decline, resulting in a relatively stable curve without significant fluctuations. Upon reaching 200 epochs, the regression loss stabilizes, with minimal variance between the training and validation sets, indicating successful fitting by the improved YOLOv5s lightweight model. Fig. 11b presents the recall and precision metrics of the enhanced YOLOv5s lightweight model, demonstrating that both recall and precision, along with average precision, exceed 90%. These results suggest that the model effectively predicts the presence of fish. Fig. 12 demonstrates the utilization of the trained model to test 100 test sets.
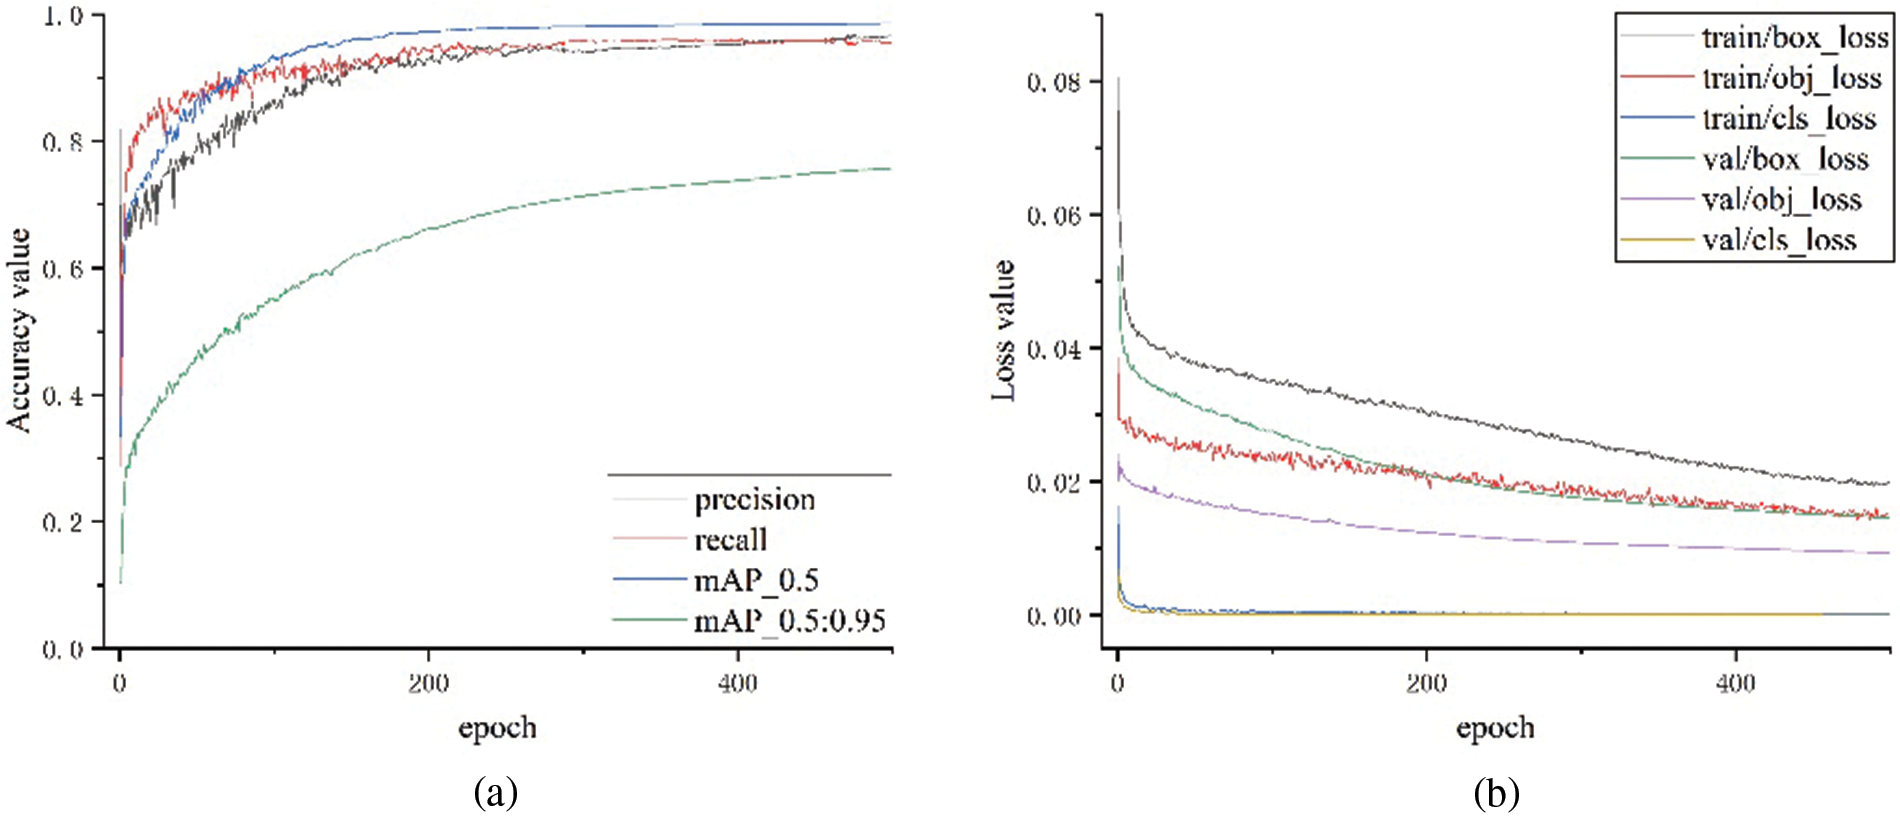
Figure 11: Experimental curve of the improved model: (a) Accuracy value; (b) Loss value
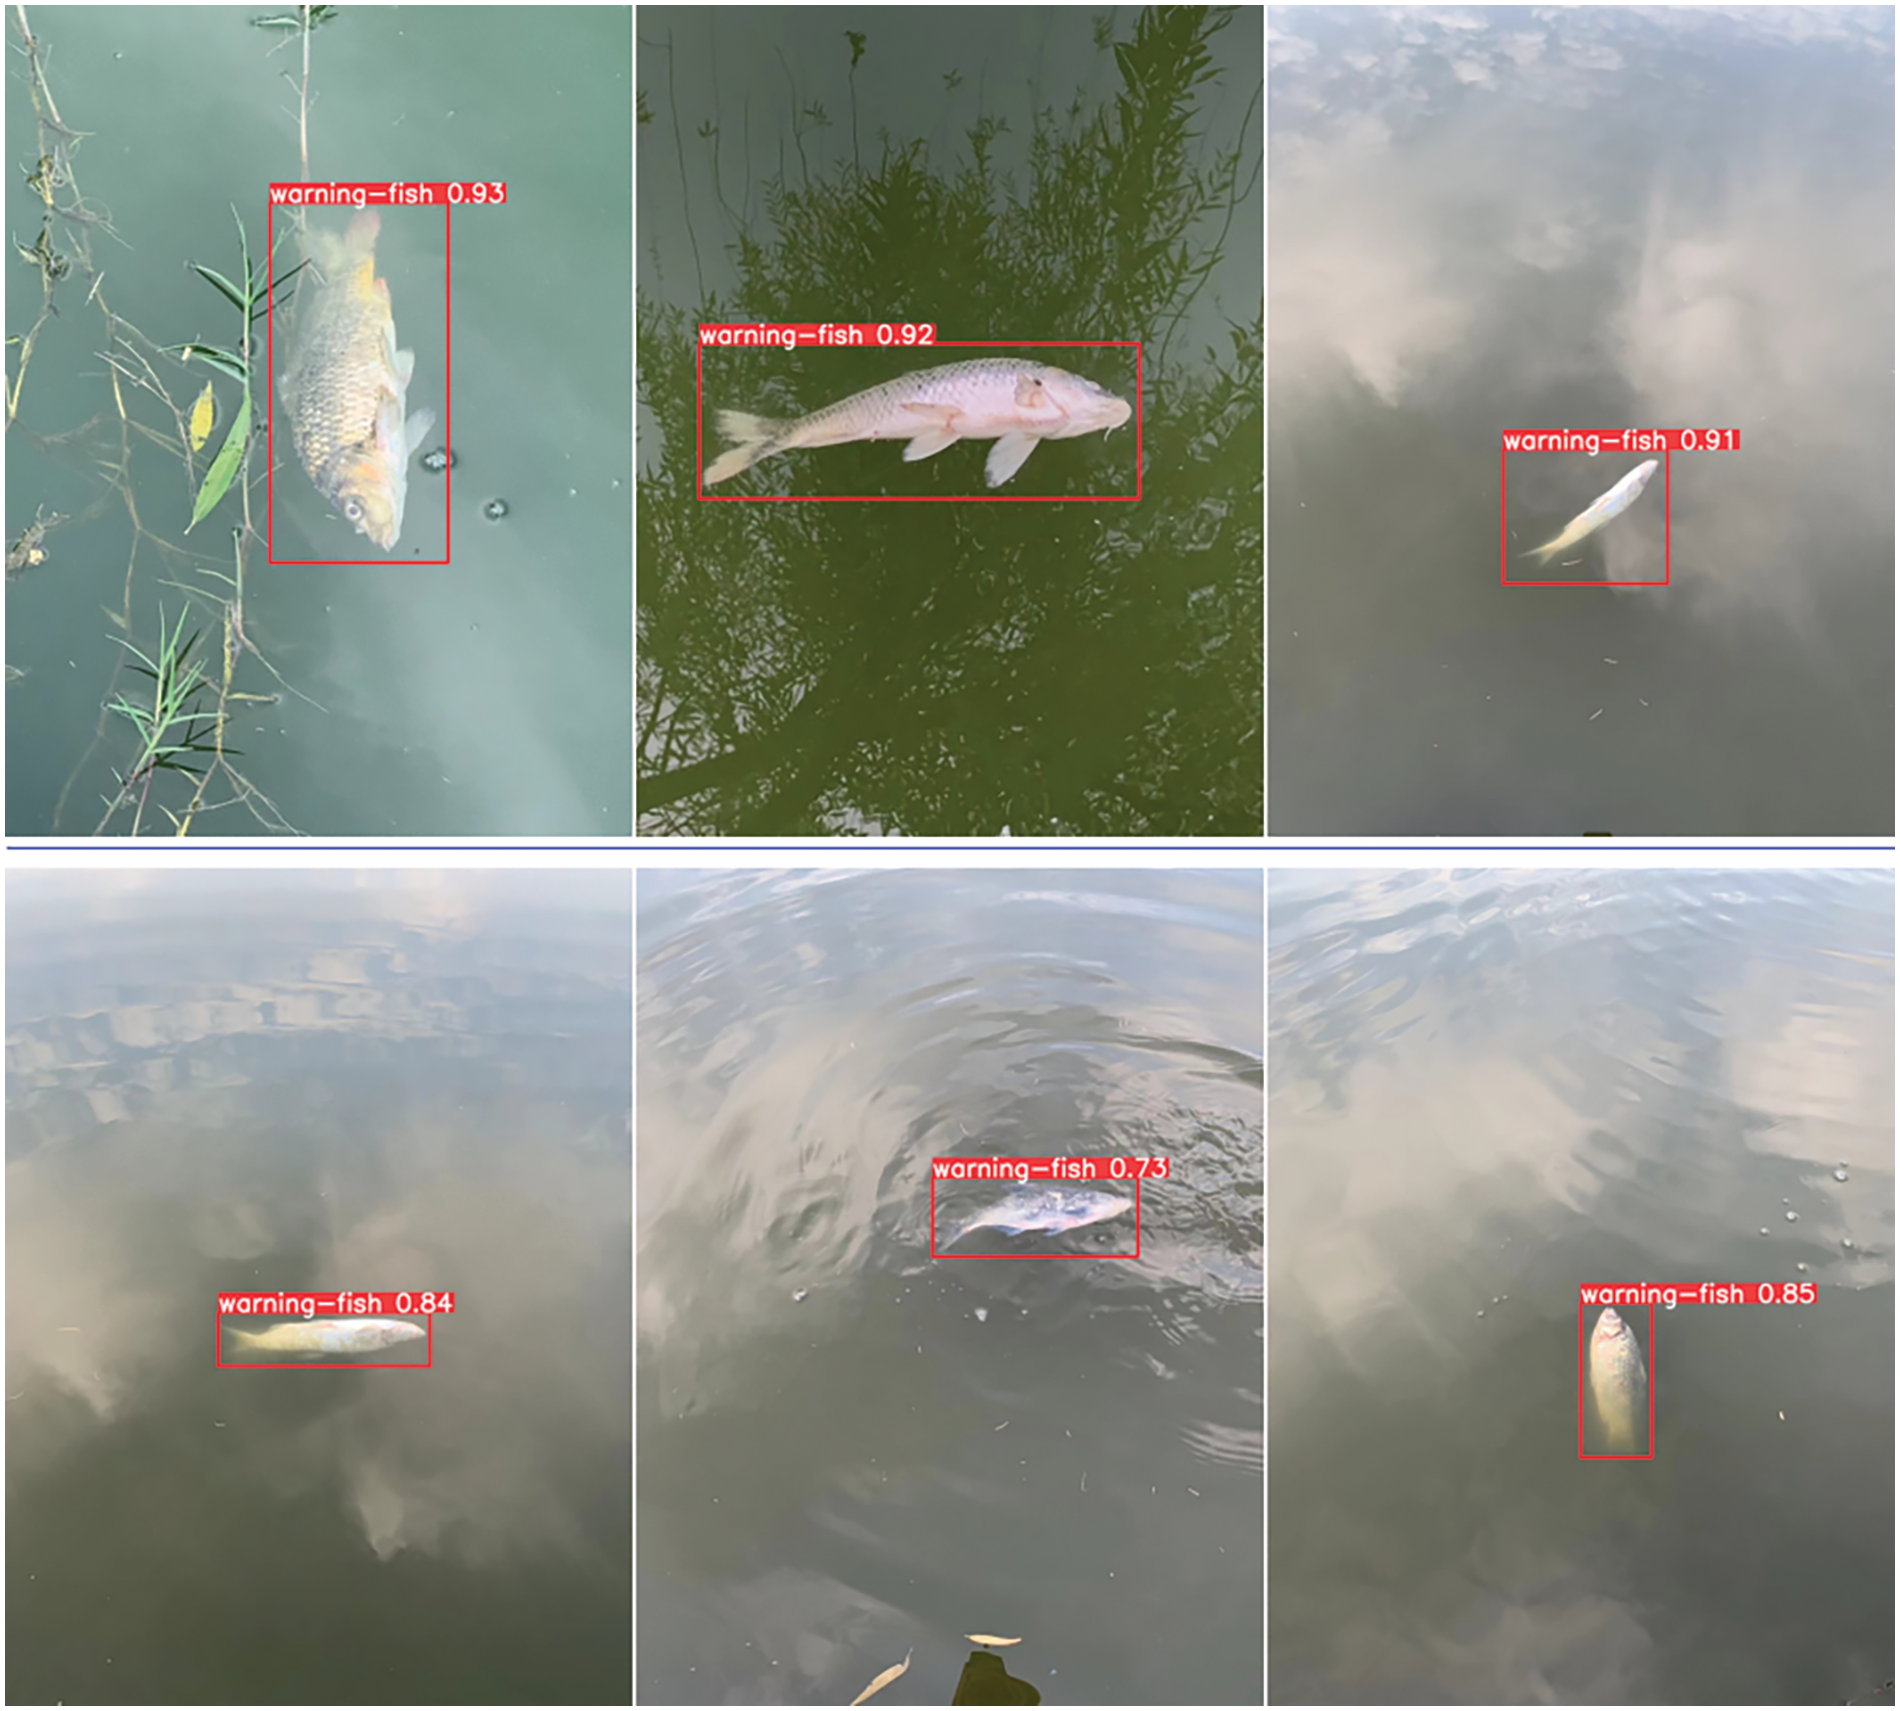
Figure 12: Selections of test results
In order to assess the effectiveness of the improved YOLOv5s model, ablation experiments were conducted on five models using the same dataset. Table 3 presents a comparison of the performance between the original YOLOv5s (Model 1) and upgraded YOLOv5s models (Models 2–5). The second model, which integrates an attention mechanism, demonstrates a 4.8% increase in precision, a 7.7% rise in recall rate, and a 6.2% improvement in average precision compared to the first model. The third lightweight model shows a significant reduction in parameter number and floating-point operations, with a 51.7% decrease in parameters and a 66.9% decrease in floating-point calculations. The fourth model not only incorporates an attention mechanism but also implements lightweight processing. Compared to the original model, the precision rate has increased by 5.5%, the recall rate by 10.1%, and the average precision by 7.6%. Additionally, the number of parameters is reduced to 49.4% of the original model, while the amount of floating point operations has decreased by 47.9%. The fifth model optimized the frame loss function based on the improvements from the fourth group, resulting in a 3.6% precision enhancement, a 2.1% increase in recall rate, and a 1.9% increase in average precision. These enhancements improved detection average precision while maintaining a balance in parameter and floating-point operation additions. The inclusion of the attention mechanism, enhanced FasterNet module, and optimization of the border loss function have all positively impacted the performance and efficiency of the YOLOv5s model.
Table 4 presents the performances of the models on GPUs. The proposed model can infer an image in just 1.6 ms, representing a 61% improvement over the original model’s 4.1 ms. The image processing time is 3 ms, which accounts for only 43.5% of the original YOLOv5s model’s, significantly enhancing detection speed. The enhanced YOLOv5s model has a generated weight file size of 6.8 MB, which is 63% smaller than the original model’s size, facilitating easier deployment due to its reduced weight file size. In conclusion, the enhanced YOLOv5s model demonstrates faster inference speeds and smaller model weight file sizes on GPUs, making it more suitable for deployment and integration into client software.

In order to further evaluate the model’s performance, the proposed algorithm is compared with YOLOv3-tiny, YOLOv4, YOLOv5s, GhostNetYOLOV5, and YOLOv7-tiny algorithms using the same dataset for testing. The results presented in Table 5 indicate that the YOLOv5s-CBAM-BackboneFaster algorithm achieves the highest average precision of 94.2%, respectively increases by 11.3%, 9.9%, 9.7%, 2.5%, and 2.1% as compared with YOLOv3-tiny, YOLOv4, YOLOv5s, GhostNet-YOLOV5, and YOLOv7-tiny, while also maintaining the lowest number of parameters at 3,556,144. Furthermore, the improved model reduces memory size requirements by 59.0%, 67.0%, 63.0%, 44.7%, and 55.6% when compared to the five models previously mentioned.
Fig. 13 illustrates that the performances of several models during training, particularly regarding Precision, Recall, and mAP, meet expectations. These satisfactory results can be attributed to the integration of the lightweight module FasterNet into the backbone network, the implementation of the CBAM attention mechanism, and the optimization of the loss function. The limitations of the original model have been effectively addressed, and the effectiveness of the improved model has been validated through comparative experiments.

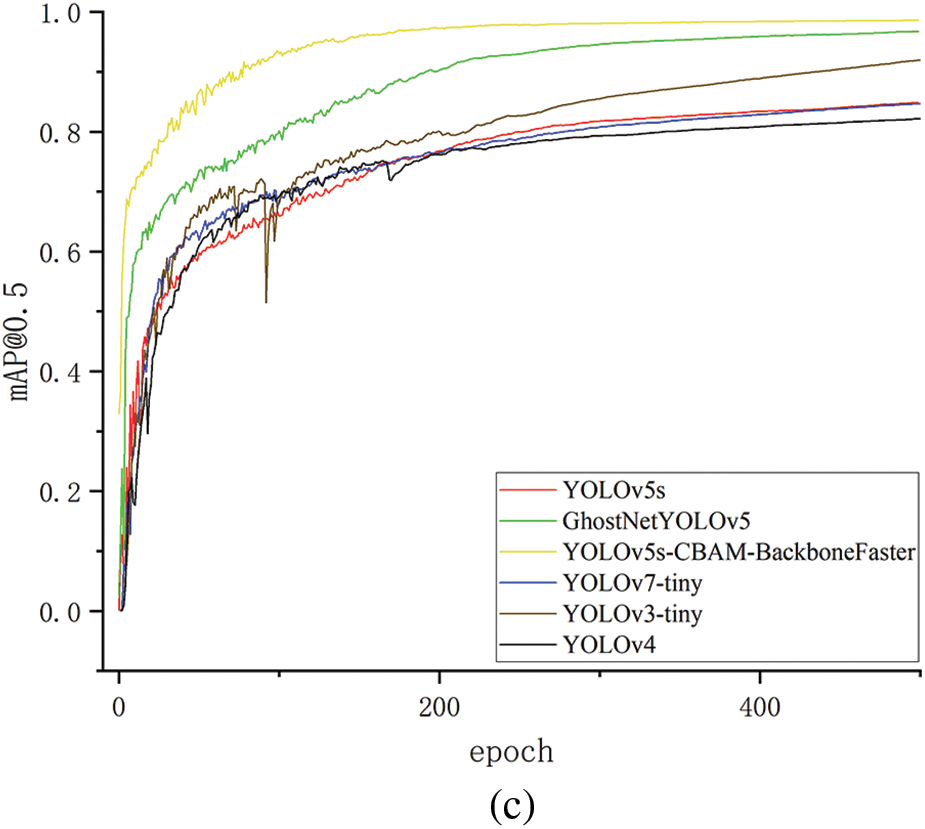
Figure 13: Performance of different YOLO improvement algorithms in the training process (a) Precision; (b) Recall; (c) mAP@0.5
In this study, the authors propose an improved YOLOv5s-based lightweight model for unhealthy fish detection. In this model, the FasterNet structure and CBAM attention mechanism are applied to the original backbone network of YOLOv5, and meanwhile, an α-SIoU loss function is developed to meet the regression accuracy of the prior box at different levels. Experimental results show that the detection average precision of the improved model reaches 94.2%, and the size of running memory occupied by the model is 6.8 MB. The detection accuracy, robustness, and demand for less hardware are all improved as compared with the original YOLOv5. The improved model’s detection speed can also meet the demand for real-time detection, and the whole system could be applied broadly due to its convenience for mobile deployment.
This work examines the conditions of fish exhibiting rolling behavior or mortality. Future studies will investigate the detection of additional abnormal states in fish, such as floating heads due to oxygen deprivation and erratic swimming behavior in injured or sick individuals. Furthermore, the authors aim to integrate models based on physical and mathematical principles, akin to those employed in weather condition prediction, into future research on fish activity prediction to enhance the model’s interpretability. The robustness of the proposed algorithm will also be a focus of future studies.
Acknowledgement: The authors wish to express their gratitude to all members of our research group at Changzhou University, as well as to the members of the Agricultural Engineering Group at Jiangsu University. We also extend our sincere appreciation to the editor and reviewers for their valuable feedback and constructive comments.
Funding Statement: The work is supported by The Agricultural Science and Technology Independent Innovation Fund Project of Jiangsu Province (CX (22) 3111), the National Natural Science Foundation of China Project (62173162), and partly by the Changzhou Science and Technology Support Project (CE20225016). The authors would like to thank all members of Agricultural Engineering Research Group of Changzhou University.
Author Contributions: Bing Shi, Jianhua Zhao: Conceptualization, Software, Writing—original draft. Bin Ma: data collection, editing. Juan Huan: Validation, Writing—review & editing. Bing Shi, Yueping Sun: Funding acquisition, Writing—review & editing. All authors reviewed the results and approved the final version of the manuscript.
Availability of Data and Materials: The authors confirm that the data supporting the findings of this study are available within the article. If necessary, the data that support the findings are also available from the corresponding author.
Ethics Approval: Not applicable.
Conflicts of Interest: The authors declare that there is no known competing financial interests or personal relationships that could have appeared to influence the work reported in this work.
References
1. S. Zhao et al., “Application of machine learning in intelligent fish aquaculture: A review,” Aquaculture, vol. 540, Jul. 2021, Art. no. 736724. doi: 10.1016/j.aquaculture.2021.736724. [Google Scholar] [CrossRef]
2. M. E. Koh, M. W. K. Fong, and E. Y. K. Ng, “Aqua3Dnet: Real-time 3D pose estimation of livestock in aquaculture by monocular machine vision,” Aquacult. Eng., vol. 103, Nov. 2023, Art. no. 102367. doi: 10.1016/j.aquaeng.2023.102367. [Google Scholar] [CrossRef]
3. P. Cisar, D. Bekkozhayeva, O. Movchan, M. Saberioon, and R. Schraml, “Computer vision based individual fish identification using skin dot pattern,” Sci. Rep., vol. 11, no. 1, Aug. 2021, Art. no. 16904. doi: 10.1038/s41598-021-96476-4. [Google Scholar] [PubMed] [CrossRef]
4. M. Pedersen and A. Mohammed, “Photo identification of individual Salmo trutta based on deep learning,” Appl. Sci., vol. 11, no. 19, Oct. 2021, Art. no. 9039. doi: 10.3390/app11199039. [Google Scholar] [CrossRef]
5. L. Du, Z. Lu, and D. Li, “Broodstock breeding behaviour recognition based on ResNet50-LSTM with CBAM attention mechanism,” Comput. Electton. Agr., vol. 202, Nov. 2022, Art. no. 107404. doi: 10.1016/j.compag.2022.107404. [Google Scholar] [CrossRef]
6. A. Al Muksit, F. Hasan, M. F. H. B. Emon, M. R. Haque, A. R. Anwary and S. Shatabda, “YOLO-Fish: A robust fish detection model to detect fish in realistic underwater environments,” Ecol. Inform., vol. 72, Dec. 2022, Art. no. 101847. doi: 10.1016/j.ecoinf.2022.101847. [Google Scholar] [CrossRef]
7. H. Hu, C. Tang, C. Shi, and Y. Qian, “Detection of residual feed in aquaculture using YOLO and Mask R-CNN,” Aquacult. Eng., vol. 100, Feb. 2023, Art. no. 102304. doi: 10.1016/j.aquaeng.2022.102304. [Google Scholar] [CrossRef]
8. H. E. D. Mohamed et al., “MSR-YOLO: Method to enhance fish detection and tracking in fish farms,” in Proc. 11th Int. Conf. Ambient Syst., Netw. Technol. (ANT)/3rd Int. Conf. Emerg. Data Ind. 4.0 (EDI40), Warsaw, Poland, Apr. 6–9, 2020, pp. 539–546. doi: 10.1016/j.procs.2020.03.123. [Google Scholar] [CrossRef]
9. X. Hu et al., “Real-time detection of uneaten feed pellets in underwater images for aquaculture using an improved YOLO-v4 network,” Comput. Electton. Agr., vol. 185, Jun. 2021, Art. no. 106135. doi: 10.1016/j.compag.2021.106135. [Google Scholar] [CrossRef]
10. M. Hamzaoui, M. O. E. Aoueileyine, L. Romdhani, and R. Bouallegue, “An improved deep learning model for underwater species recognition in aquaculture,” Fishes, vol. 8, no. 10, Oct. 2023, Art. no. 414. doi: 10.3390/fishes8100514. [Google Scholar] [CrossRef]
11. Y. Liu et al., “An improved Tuna-YOLO model based on YOLOv3 for real-time tuna detection considering lightweight deployment,” J. Mar. Sci. Eng., vol. 11, no. 3, Mar. 2023, Art. no. 542. doi: 10.3390/jmse11030542. [Google Scholar] [CrossRef]
12. D. Dong et al., “Intelligent detection of marine offshore aquaculture with high-resolution optical remote sensing images,” J. Mar. Sci. Eng., vol. 12, no. 6, Jun. 2024, Art. no. 1012. doi: 10.3390/jmse12061012. [Google Scholar] [CrossRef]
13. D. Liu, P. Wang, Y. Cheng, and H. Bi, “An improved Algae-YOLO model based on deep learning for object detection of ocean microalgae considering aquacultural lightweight deployment,” Front. Mar. Sci., vol. 9, Nov. 2022, Art. no. 1070638. doi: 10.3389/fmars.2022.1070638. [Google Scholar] [CrossRef]
14. R. Arifando, S. Eto, and C. Wada, “Improved YOLOv5-based lightweight object detection algorithm for people with visual impairment to detect buses,” Appl. Sci., vol. 13, no. 9, May 2023, Art. no. 5802. doi: 10.3390/app13095802. [Google Scholar] [CrossRef]
15. S. Zhou et al., “An accurate detection model of Takifugu rubripes using an improved YOLO-v7 network,” J. Mar. Sci. Eng., vol. 11, no. 5, May 2023, Art. no. 1051. doi: 10.3390/jmse11051051. [Google Scholar] [CrossRef]
16. Y. Cai et al., “Rapid detection of fish with SVC symptoms based on machine vision combined with a NAM-YOLO v7 hybrid model,” Aquaculture, vol. 582, Mar. 2024, Art. no. 740558. doi: 10.1016/j.aquaculture.2024.740558. [Google Scholar] [CrossRef]
17. C. Liu, B. Gu, C. Sun, and D. Li, “Effects of aquaponic system on fish locomotion by image-based YOLOv4 deep learning algorithm,” Comput. Electton. Agr., vol. 194, Mar. 2022, Art. no. 106785. doi: 10.1016/j.compag.2022.106785. [Google Scholar] [CrossRef]
18. H. Yang, Y. Shi, and X. Wang, “Detection method of fry feeding status based on YOLO lightweight network by shallow underwater images,” Electronics, vol. 11, no. 23, Dec. 2022, Art. no. 3586. doi: 10.3390/electronics11233856. [Google Scholar] [CrossRef]
19. G. Zhao, S. Zou, and H. Wu, “Improved algorithm for face mask detection based on YOLO-v4,” Int. J. Comput. Int. Sys., vol. 16, no. 1, Jun. 2023, Art. no. 104. doi: 10.1007/s44196-023-00286-7. [Google Scholar] [CrossRef]
20. H. Wang et al., “Fast detection of cannibalism behavior of juvenile fish based on deep learning,” Comput. Electton. Agr., vol. 198, Jul. 2022, Art. no. 107033. doi: 10.1016/j.compag.2022.107033. [Google Scholar] [CrossRef]
21. J. Redmon and A. Farhadi, “YOLO9000: Better, faster, stronger,” in Proc. 2017 IEEE Conf. Comput. Vis. Pattern Recognit. (CVPR), Long Beach, CA, USA, 2017, pp. 6517–6525. doi: 10.1109/CVPR.2017.690. [Google Scholar] [CrossRef]
22. Z. Gevorgyan, “SIoU loss: More powerful learning for bounding box regression,” 2022, arXiv:2205.12740. [Google Scholar]
23. B. Natesan, C. M. Liu, V. D. Ta, and R. Liao, “Advanced robotic system with keypoint extraction and YOLOv5 object detection algorithm for precise livestock monitoring,” Fishes, vol. 8, no. 10, Oct. 2023, Art. no. 524. doi: 10.3390/fishes8100524. [Google Scholar] [CrossRef]
24. D. G. Georgopoulou, C. Vouidaskis, and N. Papandroulakis, “Swimming behavior as a potential metric to detect satiation levels of European seabass in marine cages,” Front. Mar. Sci., vol. 11, Mar. 2024, Art. no. 1350385. doi: 10.3389/fmars.2024.1350385. [Google Scholar] [CrossRef]
25. J. He, S. M. Erfani, X. Ma, J. Bailey, Y. Chi and X. Hua, “Alpha-IOU: A family of power intersection over union losses for bounding box regression,” 2021, arXiv:2110.13675. [Google Scholar]
26. S. Zhao et al., “A lightweight dead fish detection method based on deformable convolution and YOLOv4,” Comput. Electton. Agr., vol. 198, Jul. 2022, Art. no. 107098. doi: 10.1016/j.compag.2022.107098. [Google Scholar] [CrossRef]
27. W. Chen, T. Zhuang, Y. Zhang, T. Mei, and X. Tang, “YOLO-UOD: An underwater small object detector via improved efficient layer aggregation network,” IET Image Process., vol. 18, no. 9, pp. 2490–2505, 2024. doi: 10.1049/ipr2.13112. [Google Scholar] [CrossRef]
28. J. Hu, D. Zhao, Y. Zhang, C. Zhou, and W. Chen, “Real-time nondestructive fish behavior detecting in mixed polyculture system using deep learning and low-cost devices,” Expert Syst. Appl., vol. 178, Sep. 2021, Art. no. 115051. doi: 10.1016/j.eswa.2021.115051. [Google Scholar] [CrossRef]
29. F. S. Lin, P. W. Yang, S. K. Tai, C. H. Wu, J. L. Lin and C. H. Huang, “A machine-learning-based ultrasonic system for monitoring white shrimps,” IEEE Sens. J., vol. 23, no. 19, pp. 23846–23855, Oct. 2023. doi: 10.1109/JSEN.2023.3307284. [Google Scholar] [CrossRef]
30. G. Jocher, “YOLOv5 by Ultralytics,” May 2020. doi: 10.5281/zenodo.3908559. [Google Scholar] [CrossRef]
31. S. Woo, J. Park, J. Y. Lee, and I. S. Kweon, “CBAM: Convolutional Block Attention Module,” in Proc. Comput. Vis.-ECCV 2018, Munich, Germany, Sep. 8–14, 2018, pp. 3–19. doi: 10.1007/978-3-030-01234-2-1. [Google Scholar] [CrossRef]
32. J. Chen et al., “Run, don’t walk: Chasing higher FLOPs for faster neural networks,” in Proc. 2023 IEEE/CVF Conf. Comput. Vis. Pattern Recognit. (CVPR), Los Angeles, CA, USA, 2023, pp. 12021–12031. doi: 10.1109/CVPR52729.2023.01157. [Google Scholar] [CrossRef]
33. P. Adarsh, P. Rathi, and M. Kumar, “YOLO v3-Tiny: Object detection and recognition using one-stage improved model,” in Proc. 2020 6th Int. Conf. Adv. Comput. Commun. Syst. (ICACCS), Chennai, India, 2020, pp. 687–694. [Google Scholar]
34. A. Bochkovskiy, “YOLOv4: Optimal speed and accuracy of object detection,” 2020, arXiv:2004.10934. [Google Scholar]
35. K. Han, Y. Wang, Q. Tian, J. Guo, C. Xu and C. Xu, “GhostNet: More features from cheap operations,” 2020, arXiv:1911.11907. [Google Scholar]
36. C. Y. Wang, A. Bochkovskiy, and H. Y. M. Liao, “YOLOv7: Trainable bag-of-freebies sets new state-of-the-art for real-time object detectors,” 2022, arXiv:2207.02696. [Google Scholar]
Cite This Article
 Copyright © 2024 The Author(s). Published by Tech Science Press.
This work is licensed under a Creative Commons Attribution 4.0 International License , which permits unrestricted use, distribution, and reproduction in any medium, provided the original work is properly cited.


 Submit a Paper
 Propose a Special lssue
 View Full Text
 Download PDF

 Downloads
 Citation Tools