 Open Access
ARTICLE
Dynamic Deep Learning for Enhanced Reliability in Wireless Sensor Networks: The DTLR-Net Approach
1 Department of Computer Science and Engineering, Koneru Lakshmaiah Education Foundation, Vaddeswaram, Andhra Pradesh, 522502, India
2 Department of Animation, Dr. YSR Architecture and Fine Arts University, Kadapa, Andhra Pradesh, 516162, India
* Corresponding Author: N. Raghavendra Sai. Email:
Computers, Materials & Continua 2024, 81(2), 2547-2569. https://doi.org/10.32604/cmc.2024.055827
Received 08 July 2024; Accepted 18 September 2024; Issue published 18 November 2024
Abstract
In the world of wireless sensor networks (WSNs), optimizing performance and extending network lifetime are critical goals. In this paper, we propose a new model called DTLR-Net (Deep Temporal LSTM Regression Network) that employs long-short-term memory and is effective for long-term dependencies. Mobile sinks can move in arbitrary patterns, so the model employs long short-term memory (LSTM) networks to handle such movements. The parameters were initialized iteratively, and each node updated its position, mobility level, and other important metrics at each turn, with key measurements including active or inactive node ratio, energy consumption per cycle, received packets for each node, contact time, and interconnect time between nodes, among others. These metrics aid in determining whether the model can remain stable under a variety of conditions. Furthermore, in addition to focusing on stability and security, these measurements assist us in predicting future node behaviors as well as how the network operates. The results show that the proposed model outperformed all other models by achieving a lifetime of 493.5 s for a 400-node WSN that persisted through 750 rounds, whereas other models could not reach this value and were significantly lower. This research has many implications, and one way to improve network performance dependability and sustainability is to incorporate deep learning approaches into WSN dynamics.Keywords
Wireless sensor networks (WSNs) have emerged as critical technologies in a variety of fields, including healthcare, industrial process control, and environmental monitoring. These networks are made up of spatially distributed sensor nodes that monitor and record physical or environmental conditions before cooperatively transmitting the collected data to a central location, usually a base station. Despite their widespread use, WSNs face significant challenges, such as limited energy, processing power, and communication bandwidth. These limitations can have a negative impact on network performance, lifespan, and security [1–4].
One of the most serious issues in WSNs is vulnerability to security threats, particularly from compromised nodes that exhibit malicious behavior. Such threats can seriously undermine network security and trustworthiness, resulting in inaccurate sink position predictions and compromised data integrity [5,6]. The need for robust trust management systems to detect and mitigate these risks is critical for network reliability.
Mobile sinks are increasingly being used in WSNs to improve data collection efficiency and address routing challenges. These mobile sinks collect data from sensor nodes based on specific traffic patterns, necessitating precise location prediction to optimize data collection and routing algorithms [7–9]. While security is not directly related to metrics like average residual energy and throughput, ensuring efficient communication and reducing power waste are critical for maintaining the accuracy of sink position predictions [10].
The primary motivation for this research is the need to improve the reliability and efficiency of WSNs using accurate and secure prediction models. We hope to address the dynamic nature of mobile sink movements and the associated challenges in trajectory prediction by utilizing advanced deep learning techniques, specifically Long Short-Term Memory (LSTM) networks. LSTM networks are well-suited for sequence prediction tasks because they can capture long-term dependencies within data, making them ideal for predicting mobile sink positions in WSNs [11].
We propose the Deep Temporal LSTM Regression Network (DTLR-Net), a sophisticated model for accurately predicting the future trajectories of mobile sinks in wireless sensor networks. Our model uses LSTM networks to effectively capture both short-term fluctuations and long-term trends in sink movement patterns, addressing the inherent variability in mobile sink trajectories.
Our work includes a detailed simulation setup that covers parameter configuration, clustering, mobility parameter initialization, and predictive model decisions. This framework provides a robust evaluation environment for assessing the performance of the proposed model.
The DTLR-Net model outperforms existing methods in terms of network lifetime, energy efficiency, and data transmission reliability. Our experiments demonstrate the model’s ability to extend the operational lifespan of WSNs, improving overall network stability and performance.
The rest of the paper is organized as follows: Section 2 contains a thorough literature review, Section 3 describes the methodology, including process flow and algorithm descriptions, and Section 4 presents the experimental investigations that validate the DTLR-Net approach. Section 5 concludes with a discussion of future research directions and the integration of a trust model.
In the field of wireless sensor networks (WSNs), a lot of research has been done to solve problems caused by mobile sinks and routing complexities. To address data collection in sensor fields with multiple mobile sinks, Deng et al. proposed an online approach in 2018 that uses primal-dual strategy [12]. The aim of their method was to maximize the amount of information transmitted from sensor nodes but computational requirements imposed by the primal-dual technique especially in large-scale WSNs raised concerns due to increasing time for computation as well as memory.
Wen et al. introduced a cooperative data collection algorithm (CDCA) which involves grouping sensor nodes and assigning mobile sinks thereby improving efficiency [13]. However, after several rounds of running this algorithm the network lifetime becomes shorter. Tabatabaei et al. came up with a routing algorithm based on clustering and mobile synchronization to enhance network lifespan in 2019 [14]. But it was observed that some nodes remained as sinks post-relocation thus consuming energy to notify new location of themselves to mobile sink nodes.
Gao et al. presented a distance-aware routing method that uses multiple mobile sinks for reducing energy consumption [15]. Nevertheless, node failures under dynamic network conditions become problematic. The use of multiple mobile sinks for collecting data may result into suboptimal routing decisions or even loss of them therefore robust mechanisms are needed to handle changing network scenarios.
Su et al. proposed trust model using node behavior for trust assessment in opportunistic routing in 2020 [16]. Although localized nature of the model may limit its ability to detect malicious patterns throughout the entire network where they exist. In 2020, Sethi optimized energy consumption through sink mobility on mobility aware algorithms [17]. Its limitation is that different patterns with various sinks may introduce more overhead affecting control traffic and routing messages.
In 2021, Baskar et al. introduced a data fusion trust model which assesses trust through temporal attributes and behavior analysis [18]. However, this model’s accuracy is based on reliable data since inaccurate or manipulated information can undermine its effectiveness.
In 2021, Banimelhem et al. proposed a PCA-based approach to mobile sink path generation [19]. This shows that dimensionality reduction methods can be used in wireless sensor networks but it assumes static models and may not work well when there are obstacles during movement of the sinks. Besides reducing dimensions, energy saving and communication overhead reduction, as well as better quality data were realized but still sensitive to data distribution assumption. In 2021, Jadhav et al. developed atomic search sunflower optimization algorithm for trust-based routing [20]. However, with increased size and complexity of networks these algorithms become more computationally complex which could pose challenges.
To ensure data reliability, Lin et al. suggested a trust mechanism enabled by data fusion and transfer learning in 2022 [21]. A balanced reward-punishment system should be put in place so that users have confidence in the system without being too strict thus discouraging them from participating actively in it. In 2022, Boyineni et al. proposed ant colony optimization-based mechanism for mobile sink scheduling in WSNs [22]. However, its applicability may be limited by assuming fixed topology especially where events are dynamic [23–25]. These findings provide valuable insights towards development of efficient mobile sink routing strategies within WSNs.
An Ant Colony Optimization (ACO)-based mobile sink path identification approach for wireless sensor networks (WSNs) with non-uniform data limitations was suggested by Kumar et al. [26] in 2018. Although successful in optimising mobile sink routes, the approach encountered constraints in managing dynamic environmental fluctuations. In 2020, Sapre et al. [27] proposed a differential moth flame optimization technique for determining the trajectory of mobile sinks in Wireless Sensor Networks (WSNs). While the proposed method enhanced the rate of convergence, it had constraints in effectively handling large-scale networks characterized by significant node mobility. A dependable and effective route discovery technique for mobile sink-based Wireless Sensor Networks (WSNs) was introduced by Elie et al. [28] in the same year. Notwithstanding the enhancement of path discovery reliability, the approach exhibited lower efficiency in networks with high density, thereby giving rise to possible bottlenecks. In 2018, Narawade et al. [29] introduced an adaptive cuckoo search-based rate adjustment technique (ACSRO) to tackle congestion avoidance and control in wireless sensor networks (WSNs). Although this strategy effectively maximised congestion management, it had constraints associated with significant computing expenses. In 2003, Wan et al. [30] introduced CODA, a framework designed to identify and minimize congestion in sensor networks. While the approach effectively identified congestion, its drawback resided in its limited scalability when implemented on larger sensor networks. Yadav et al. [31] introduced a traffic and energy-centric optimization technique for managing congestion in next-generation Wireless Sensor Networks (WSNs). Although this approach substantially decreased energy usage, it showed limited efficacy in handling congestion in extremely dynamic networks.
Ramesh et al. introduced the Energy Efficient Routing Protocol (EERP) in 2023 [32], designed for IoT-based Wireless Sensor Networks. EERP utilizes a Time Division Multiple Access (TDMA)-based Medium Access Control (MAC) protocol to optimize energy consumption by allocating time slots for data transmission. The protocol enhances network coverage and efficiency through multi-hop routes, enabling data packets to pass through intermediate sensor nodes. However, a limitation of the TDMA-based MAC protocol is its dependence on precise synchronization among nodes, which can be challenging to maintain in dynamic and resource-constrained environments, potentially affecting reliable and efficient communication across the network.
In 2023, Subbaiah et al. [33] proposed the IBOLSR protocol to enhance energy efficiency in MANETs for WBAN-based healthcare systems by optimizing routing decisions based on residual energy. Although the method extends network lifespan, it primarily focuses on residual energy metrics, potentially overlooking factors like data traffic load, network topology changes, and environmental interference, which can affect performance.
The summary of related works is provided in Table 1, which offers insights into the approaches, focus areas, and limitations of previous studies.

The depicted block diagram of the work is presented in Fig. 1. Specify simulation parameters such as maximum dimension, initial energy, transceiver energy, aggregate energy, and amplification energy. Clustering refers to the process of grouping data points into distinct clusters based on certain criteria. Mobility parameters, on the other hand, are specific measures used to define the characteristics of movement patterns. These parameters include the number of clusters, which determines the quantity of distinct groups formed, as well as the minimum and maximum distances between data points within each cluster. Additionally, the minimum distance signal represents the shortest distance required for a data point to be considered part of a cluster, while the maximum distance signal represents the furthest distance allowed for a data point to still be included in a cluster. Lastly, the minimum visit distance refers to the shortest distance a data point must travel before being considered a separate visit. Set the dimensions and energy values appropriately. Decide whether it is necessary to generate a new predictive model for mobile sinks, and if so, proceed with its creation. The DTLR-Net model employs deep learning techniques, such as LSTM networks, to tackle the erratic movement of mobile sinks for the purpose of trajectory prediction. Establish the wireless sensor network (WSN) by initializing and populating the network with sensor and vehicular sink nodes, taking into account dimensions, initial energy levels, and simulation rounds. To maintain efficient network communication, it is important to position the sensor and vehicular sink nodes within specified distance limits. Perform multiple iterations, continuously updating the positions of nodes and mobility parameters, and make necessary adjustments to simulation parameters. Analyze simulation data to visualize metrics such as the number of inactive nodes, active nodes, energy consumption, packet transmission, duration of node contact, and interconnection time. This will allow for an accurate assessment of network performance and stability.
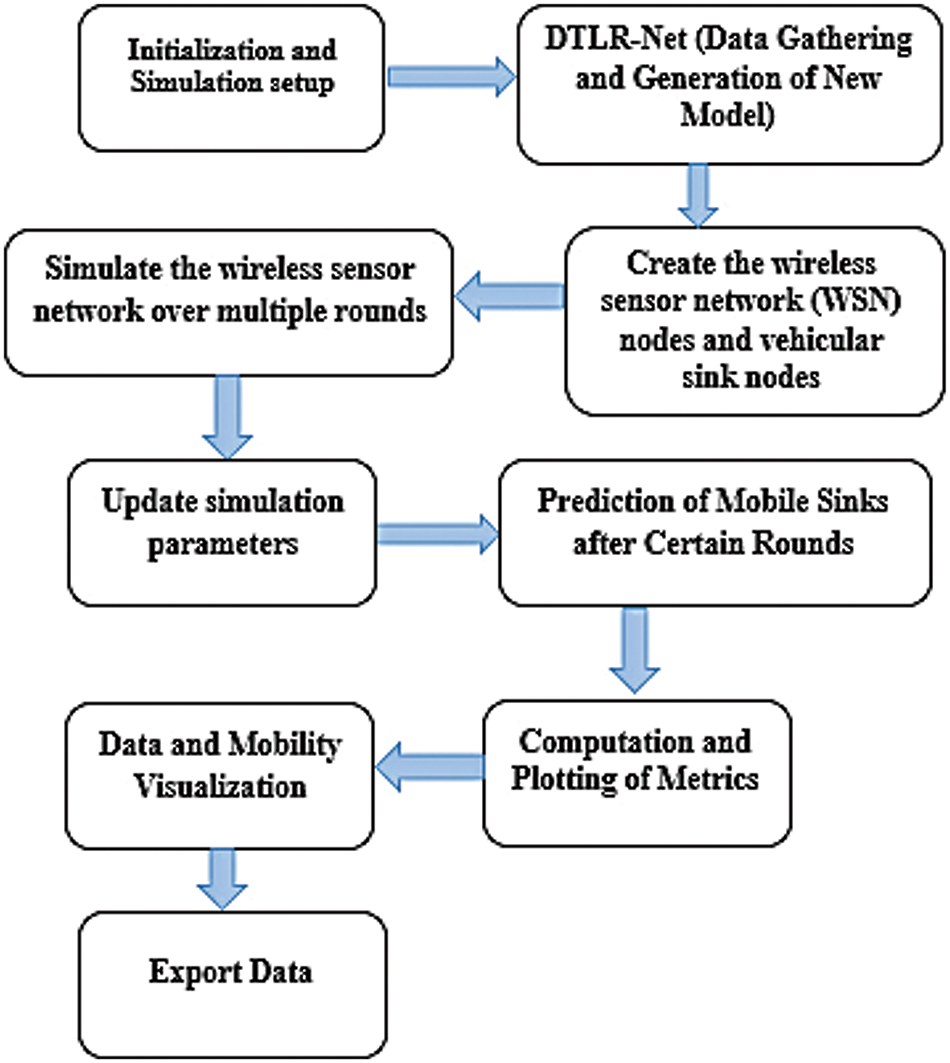
Figure 1: Proposed block diagram for prediction of mobile sinks
Now the entire process of the proposed system is explained in elaborate form below:
Set simulation parameters such as maximum dimension, initial energy, and more.
Define parameters (Let us say): maximum dimensions = N, Initial energy = E, transceiver energy = T, Aggregate Energy = A, Amplification Energy = P. Initialize clustering parameters, mobility parameters, and others.
Set parameters:
Initialize dimensions and energy values.
Decide whether to generate a new predictive model for mobile sinks.
Thus, the Model designed for this work is DTLR-Net, which represents an advanced approach to predict the future trajectories of mobile sinks in wireless sensor networks. The reason to use this model is that it can make use of deep learning methods such as LSTM networks to solve the problem caused by the unstable movement of mobile sinks for the trajectory prediction. Let us frame an equation for creation of WSN.
Let SN represent the set of all sensor nodes and vehicular sink nodes in the wireless sensor network. The parameters are the number of nodes n, the dimensions dims defined previously, the initial energy En for each node, and the number of rounds R for the simulation.
Eq. (3) initializes and populates the network with sensor nodes and vehicular sink nodes, taking into consideration the specified dimensions, initial energy, and simulation rounds.
Set up the WSN structure.
Let pos_sn be the set of positions for sensor nodes and pos_sink be the set of positions for vehicular sink nodes. We can represent the set of nodes as SN and VSN, respectively.
The Euclidean distance between two nodes i and j can be calculated as follows:
To ensure that sensor nodes are positioned within a specified range, we can use the following equation:
Vehicular sink nodes can be positioned within the network according to their mobility parameters:
WSN structure observes distance limits among nodes for proper communication and connection of the network. In this algorithm, sensor nodes are placed by some equations and some nodal distance is set for vehicular sink nodes in order to establish wireless sensor network infrastructure as it were described above. By so doing, a topology of the network is formed which ensures good orderliness where data transmission becomes easier thus enhancing communication efficiency within the system. Run many rounds with WSNs simulation.
Iterate for each round (r = 1 to R) and update node positions and mobility
For each sensor node Si:
Set new position of Si:
Now Update Vehicular Sink Node Positions:
For each vehicular sink node Vj:
Set new position of Vj:
Let us assume
Each sensor node is represented by Si and each vehicular sink node is represented by Vj.
The position of Si is denoted as
Here, the update position function represents a mathematical function that updates the position of a node based on its current position and mobility parameters.
Update simulation parameters
Update metrics
Assume Mold and Mnew are sets of metrics for the current and next rounds, respectively.
SN represents the set of sensor nodes, VSN represents the set of vehicular sink nodes, and Pnew is the updated set of simulation parameters.
Check for stability criteria, if stability is achieved, record the stability period and break the loop. Update simulation parameters and metrics. At specified intervals, update simulation parameters using mathematical functions representing updates based on conditions or equations.
Visualize simulation data for metrics like dead nodes, operating nodes, energy, packets, contact time, and interconnect time.
Dead Nodes (D):
where Dold is the count of dead nodes from the previous round, and count_dead_nodes (nodes) is a function that counts the number of dead nodes in the given set of nodes.
Operating Nodes (O):
n-total number of nodes.
Total Energy:
where energies (nodes) is a function that calculates the total energy of the given set of nodes.
Packets Received:
where receivedpackets (nodes) is a function that calculates the total received packets for the given set of nodes.
The proposed work presents the Model of Deep Temporal LSTM Regression Network as a more sophisticated method for predicting next locations of mobile sinks in wireless sensor networks and justifies its utilization by its capacity to exploit deep learning techniques such as Long Short-Term Memory (LSTM) networks to adequately handle problems prompted by variability of mobile sink movements [26,27]. This model is good at this task due to several reasons. The first one is that it is able to capture temporal dependencies within mobile sink trajectories, using LSTM networks which can deal with series data well and have ability of recognizing patterns over time. Another reason is based on the fact that through LSTM layers short-term fluctuations as well as long-term trends in movement patterns made by these sinks can be caught simultaneously because they possess memory mechanisms internally. The architecture of this model has been designed specifically for regression tasks so it fits nicely with the aim of predicting future coordinates for sinks. Being deep, it can learn complex spatial and temporal features from the trajectory data, which are necessary for accurate predictions especially under difficult conditions. Lastly, this design includes dropout layers for regularization purposes and adaptive learning rates which enable multiple training iterations where the network becomes better placed to forecast sink paths effectively hence maximizing prediction performance according to Fig. 2 provided below showing DTLR Network’s structure.

Figure 2: Proposed DTLR-Net architecture
The proposed model includes a deep learning architecture that has been painstakingly designed for time series prediction tasks, leveraging the capabilities of Long Short-Term Memory (LSTM) networks. This model coordinates the training of two distinct LSTM models, one for X-data and one for Y-data, and securely stores the resulting trained models for future deployment. The meticulous configuration of critical parameters, such as the number of input features, the specification of hidden units in LSTM layers, the definition of output classes (currently set to 1 for regression), and the blueprint for the network’s architecture, is shown in Fig. 2. The DTLR-Net model adeptly manages the arbitrary movement patterns of mobile sinks through its integration of Long Short-Term Memory (LSTM) networks. This design choice is pivotal, as LSTM networks are specifically engineered to handle sequences with complex temporal dynamics. They excel in capturing both short-term fluctuations and long-term trends in sink movement patterns. By leveraging LSTM’s ability to maintain and utilize information over extended periods, DTLR-Net effectively addresses the inherent variability and unpredictability in mobile sink trajectories. This capability ensures that the model can adapt to and accurately predict diverse movement scenarios, enhancing its overall robustness and performance in dynamic environments.
The model predicts future behaviors of nodes and the overall functioning of the network by utilizing LSTM networks, which are capable of capturing temporal dependencies within the movement patterns of mobile sinks. This allows for accurate predictions of future node behaviors and network functionality.
The DTLR-Net model significantly advances the dynamic capabilities of deep learning in Wireless Sensor Networks (WSNs) by incorporating Long Short-Term Memory (LSTM) networks. These networks are adept at adapting to the unpredictable movements of mobile sinks, which are a common challenge in WSN environments. By leveraging LSTM’s strengths in capturing temporal dependencies and managing sequence variability, DTLR-Net enhances the flexibility and robustness of deep learning models. This adaptability allows the model to better handle the inherent fluctuations in sink movements, ultimately leading to more reliable and effective performance in dynamic and evolving network conditions.
A series of specialized layers play critical roles in this architectural blueprint. The sequence Input Layer is the first in line and is responsible for defining the size of the input sequence data. Following that, we present two lstmLayer instances, each with a unique number of hidden units—256 for the first (numHiddenUnits1) and 128 for the second (numHiddenUnits2). These LSTM layers are strategically placed to capture the data’s inherent temporal dependencies. To avoid overfitting, two dropout layers are added in the architecture. These drop a fraction of input units systematically during training to enhance the model’s generalization abilities.
In order to facilitate regression tasks, we propose one fully connected layer that connects outputs from previous layers to one output node only. A separate layer for regression is included as well, specifically meant for regression-related assignments. This combination provides a basic architecture of the proposed model. This conveying that the proposed method can powerful and flexible to utilization during forecasting.
3.2 Proposed DTLR-Net Algorithm
The outline of the Algorithm 1 of the proposed model DTLR-Net is as follows: This sequential plan shows how the deep learning model for time series prediction explored was developed and taught.

To validate the proposed DTLR-Net approach, we conducted a series of experiments using a well-defined simulation setup. The key parameters for our simulation were carefully selected to represent a realistic WSN environment. We experimented with different numbers of nodes (100, 400, and 800) over 750 simulation rounds. Each node was initialized with 2 J of energy, and the communication range was set to 50 m. We employed the Random Waypoint Mobility model to simulate the movement of nodes, and the clustering parameters included varying the number of clusters (C) between 5 and 10, with a minimum distance (D_min) of 10 m and a maximum distance (D_max) of 50 m. These parameters were chosen to comprehensively assess the model’s performance in terms of energy consumption, network lifetime, and data transmission efficiency.
Our experiments were conducted on a high-performance system equipped with an Intel Core i7-9700K processor running at 3.6 GHz, 32 GB of DDR4 RAM, and an NVIDIA GeForce RTX 2080 GPU with 8 GB of VRAM. The operating system used was Ubuntu 20.04 LTS. This hardware setup was selected to ensure efficient training of the deep learning models and smooth execution of the simulations without any hardware-induced bottlenecks.
The datasets used in our experiments were synthetic, generated to simulate the behavior of sensor nodes and mobile sinks in a WSN. The sensor node data included position, energy levels, and packet transmission logs for each node, while the mobile sink data comprised trajectories, speed, and interaction logs with sensor nodes. These synthetic datasets provided a controlled environment for testing the DTLR-Net model, ensuring consistency and replicability of the results.
In order to maximize the efficiency and effectiveness of the DTLR-Net model, we carried out a thorough hyperparameter optimization process. The process was essential in determining the most effective arrangement of our deep learning algorithms, resulting in improved predictive accuracy and efficiency of the model.
Initially, we set the key parameters such as the number of LSTM layers, the number of hidden units per layer, learning rates, batch sizes, and dropout rates. The initial ranges for these parameters were determined using established methodologies found in the literature and initial testing. Subsequently, a grid search was conducted to methodically investigate various combinations of hyperparameters. The search encompassed different setups, including the range of LSTM layers (1 to 3), the number of hidden units per layer (64, 128, 256), the learning rates (0.001, 0.005, 0.01), the batch sizes (16, 32, 64), and the dropout rates (0.1, 0.2, 0.3).
In order to ensure the strength and applicability of the model, we utilized k-fold cross-validation (k = 5) to assess the effectiveness of each combination of hyperparameters. By employing this approach, we were able to evaluate the model’s performance on various subsets of the data, thereby mitigating the potential for overfitting. The evaluation metrics employed encompassed accuracy, precision, recall, F1-score, and energy efficiency. The metrics were calculated for every combination of hyperparameters in order to determine the most effective configuration.
The final hyperparameters were chosen based on the results of the grid search and cross-validation. The most effective setup consisted of two LSTM layers, with the first layer having 256 hidden units and the second layer having 128 hidden units. The learning rate was set to 0.005, the batch size was 32, and the dropout rate was 0.2. The DTLR-Net model was trained using these optimal hyperparameters to ensure effective learning and enhanced performance.
The plot labeled “Dead Nodes” in Fig. 3 illustrates the correlation between the number of simulation rounds and the quantity of non-functional nodes in a wireless sensor network. At the beginning, the network does not encounter any failures, which means that all nodes are functioning properly and efficiently conserving energy. The occurrence of node failures commences shortly after 200 rounds, signifying the moment when the initial node exhausts its energy reserves. The graph demonstrates a distinct pattern of increasing dead nodes, characterized by periods of rapid growth followed by stable periods. This pattern reflects the network’s dynamic response to changing energy demands and potential batch failures, which may occur when clusters of nodes deplete their energy at different rates. By the end of the simulation, after 2000 rounds, the count of dead nodes approaches approximately 120. This indicates that either the total number of nodes in the network is high or that a significant portion of the network remains functional beyond the simulation period.
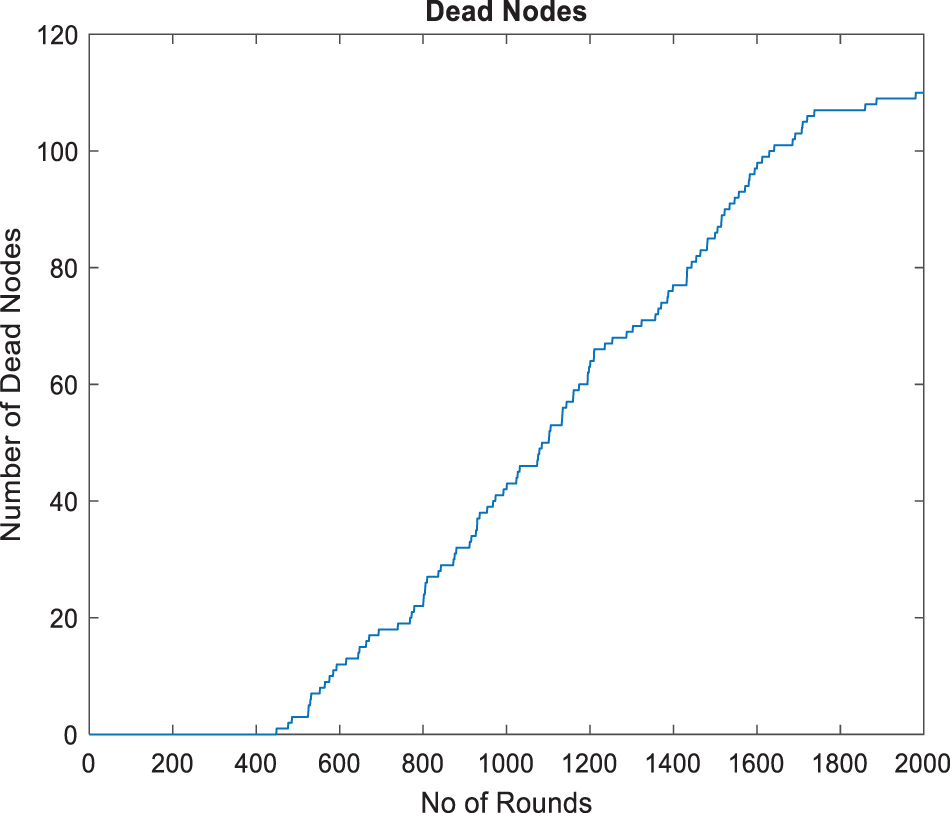
Figure 3: Dead nodes
The graph depicted in Fig. 4, discusses about the Live Nodes, exhibiting an inverse correlation with the conventional life cycle of nodes. From the time it starts with a complete count of operational nodes, this number remains at maximum until just over 200 rounds, then declines as some nodes stop working. The fall in active nodes is systematic but erratic; this means that they fail at various times maybe because each uses different amounts of power and has diverse functions in the network. Towards 2000 rounds only a few nodes are left alive by the network. This graph provides vital indications about robustness of networks and energy efficiency strategies employed during simulations over different lengths.
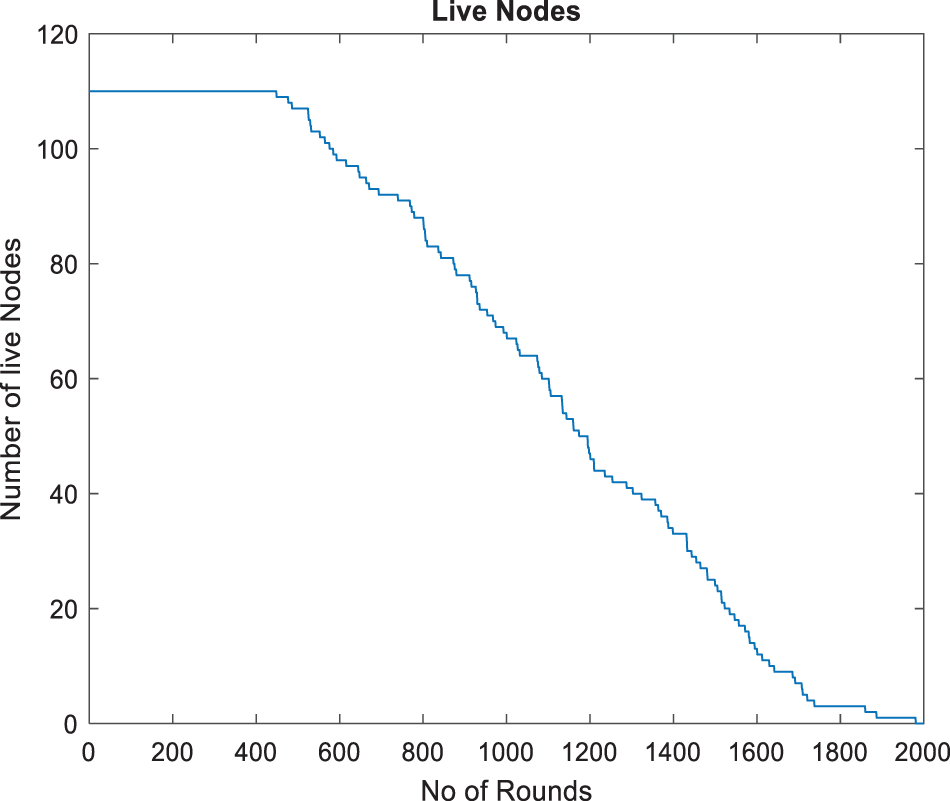
Figure 4: Live nodes
Fig. 5, titled “Packets transmitted to BS” (Base Station), displays a progressive growth in the total number of packets transmitted to the base station during the simulation of the wireless sensor network. The graph originates from the origin and follows an upward concave trajectory, indicating a consistent increase in transmissions as the rounds advance. This indicates that even though the nodes will eventually run out, as shown in previous figures, the network is still able to effectively transmit packets until a certain threshold. The shape of the curve indicates an increase in the rate at which packets are transmitted, which may be attributed to adaptive protocols that enhance transmission efficiency. By round 2000 of the simulation, the curve reaches a plateau, suggesting the presence of a saturation point.
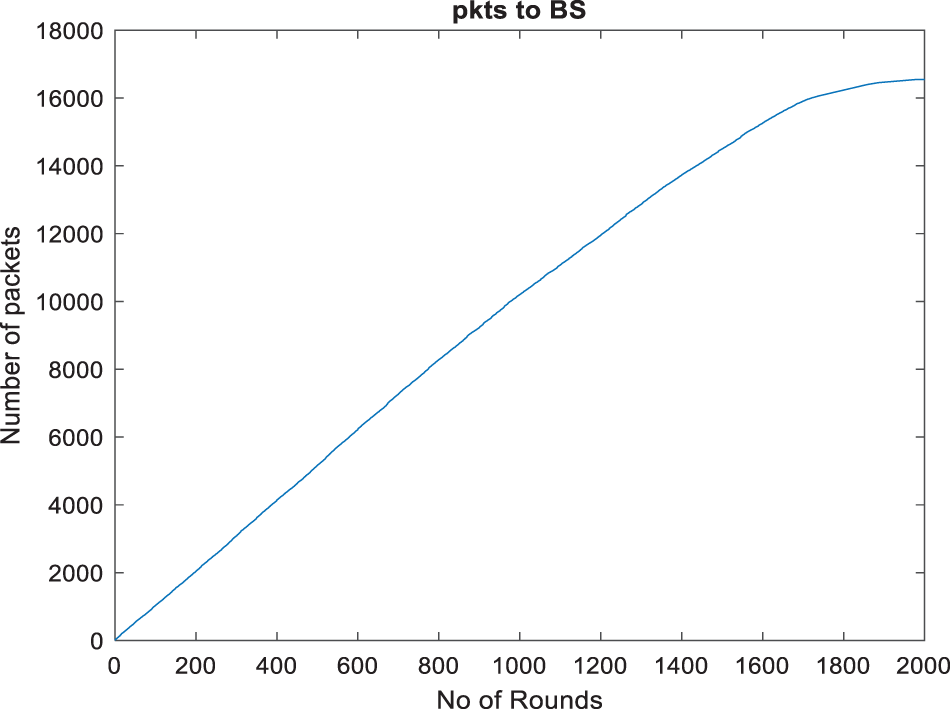
Figure 5: Packets transmitted to BS
The Fig. 6 plot represents a regular exponential decay in the number of packets sent to Base Station (BS) per round in a wireless sensor network (WSN). To achieve a clean visual representation, the title and grid lines have been intentionally omitted from the plot. Starting with more frequent packet transmissions, the count drops progressively over the course of 2000 simulation rounds indicating that it is working properly—adjusting its data transmission amounts with reference to falling energy levels in nodes. The slow fall off in reserves of node energy implies an expected depletion hence showing a good protocol design which ensures continuous efficient performance of the network without sudden collapses. The smoothness of the curve shows that there were no many bursts or outages during transmission therefore this being stable and reliable behaviour for WSN operations.

Figure 6: Packets to BS per round
Fig. 7, labelled packets to cluster head, shows the cumulative number of packets sent to cluster heads in the network. The line rises uniformly without any breaks which means that there has been a continuous stream of data packets to cluster heads over time. Unlike Fig. 6, this graph does not indicate per-round fluctuations but provides a high-level view instead. As the curve approaches around 2000 rounds, it flattens out showing that data packet rate is decreasing. This might be due to either fewer active nodes or all other nodes entering into steady state where their remaining parts become stable and can be predicted easily as far as data transmission is concerned.
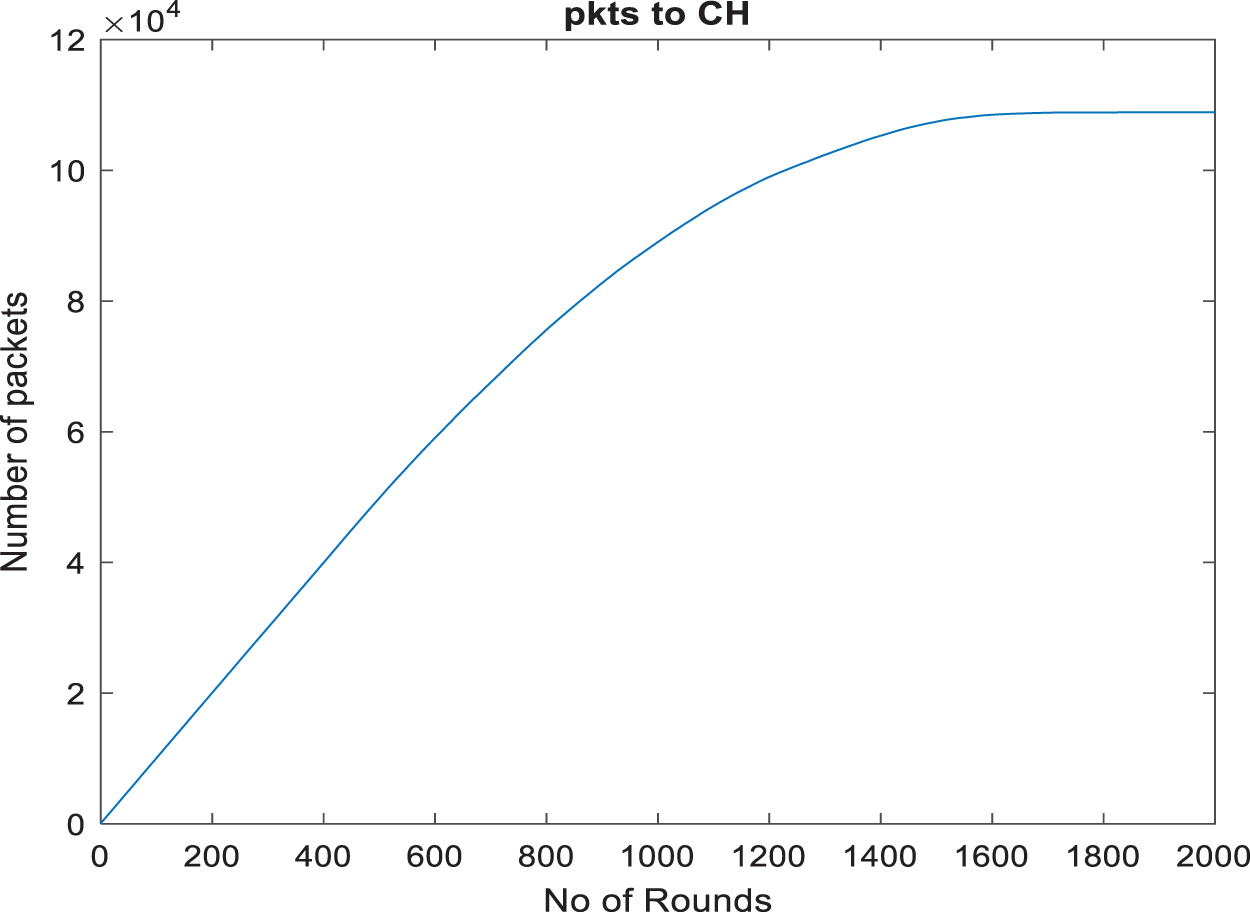
Figure 7: Packets to cluster head
Fig. 8 illustrates the better scenario for the election of cluster heads in a wireless sensor network. It shows a slow and steady decline of cluster heads from one state to another for 2000 rounds. The uniform decrement without much change suggests that the method of energy management and selection of head cluster is effective. At the start, the network has right amount of cluster heads which it reduces as it approaches its life time. This shows that the network will work for long periods while conserving power. Hence, there can be uninterrupted communication or operation without frequent reconstitution needed between nodes; such features are common in good WSN design aimed at longer life span and better performance in terms of energy usage efficiency.
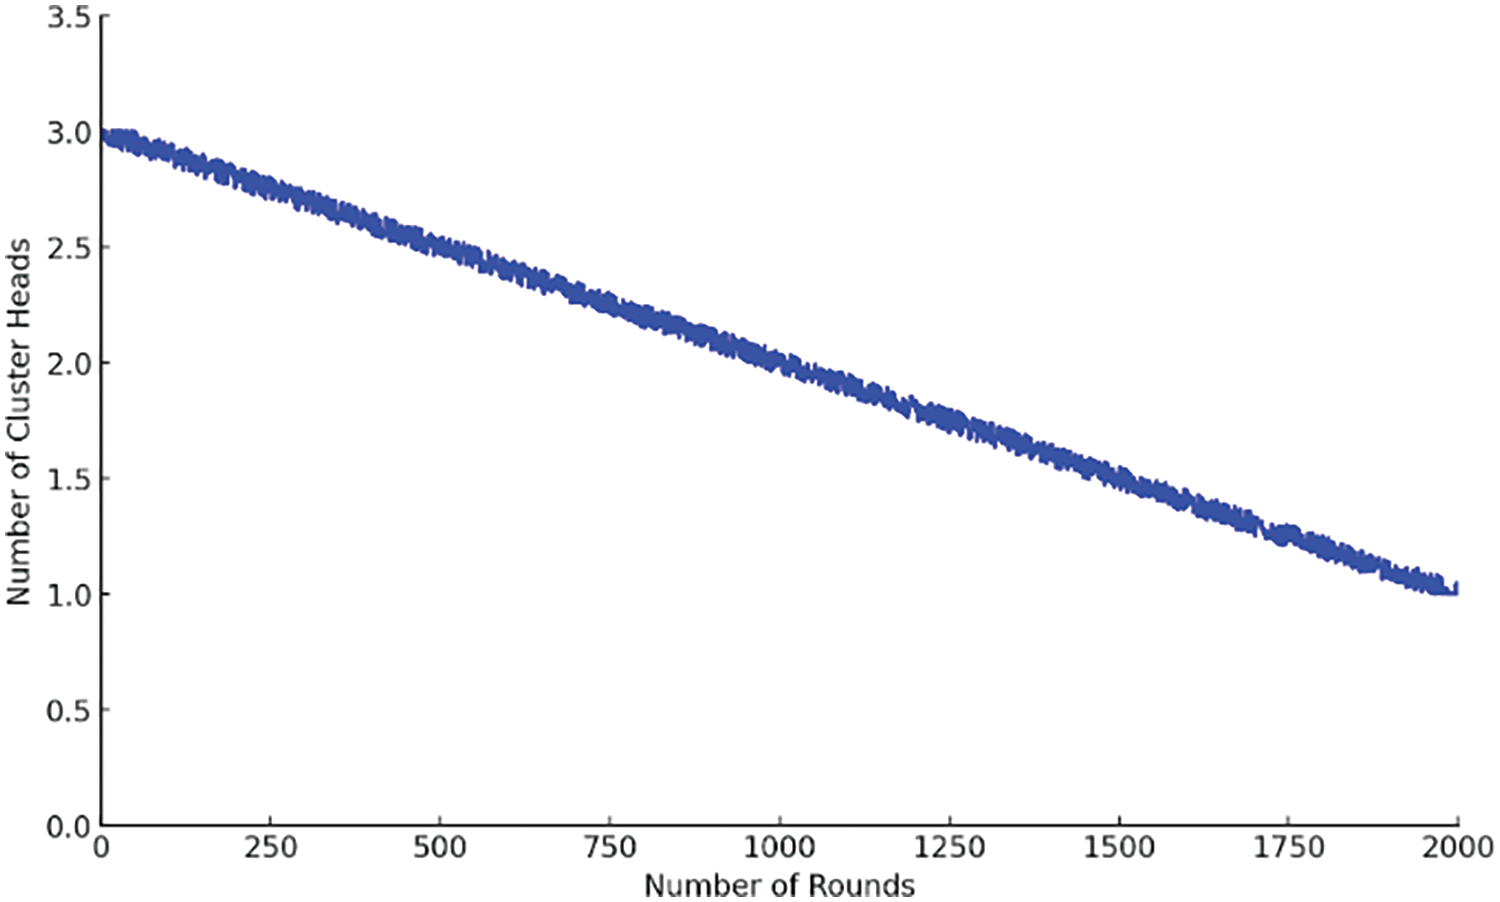
Figure 8: Number of cluster heads per rounds
In Fig. 9, Random Waypoint Mobility at initial rounds, the x-axis represents the width of Wireless Sensor Network (WSN) while the y-axis represents its height. The figure shows how sensor nodes move around during the beginning stages of simulation. Each dot on this graph corresponds to one round and shows what position a sensor node took during that particular round with respect to its (width, height) coordinates.

Figure 9: Mobility at the initial rounds
At the onset of simulation, sensors start off by behaving in a random waypoint manner whereby they can move anywhere within given WSN dimensions without following any predetermined path or directionality. In other words, until now, we assume that our knowledge about where these points are located is still very limited hence they seem scattered throughout the whole WSN area covered by width and height as shown in Fig. 9, which means that there is no such thing as initial movement pattern for them but it might change later on when more rounds get executed. What happens next is that each point may begin to form different patterns depicting single node’s trajectory across space over time while others will not because some do not move at all further rounds could be executed.
In Fig. 10, the structure of Random Waypoint Mobility of 4 Mobile Sinks after 1000 rounds is basically alike, where the x-axis represents the width of WSN and the y-axis represents its height. This graph shows how four mobile sinks moved during 1000 rounds of simulation. On this graph, positions of four mobile sinks are presented as trajectories that represent routes taken by them across WSN. Each trajectory consists of some points which depict position of a sink in a particular round. Depending on underlying mobility model and interactions with sensor nodes as well as other mobile sinks, patterns or trends can be observed in trajectories.
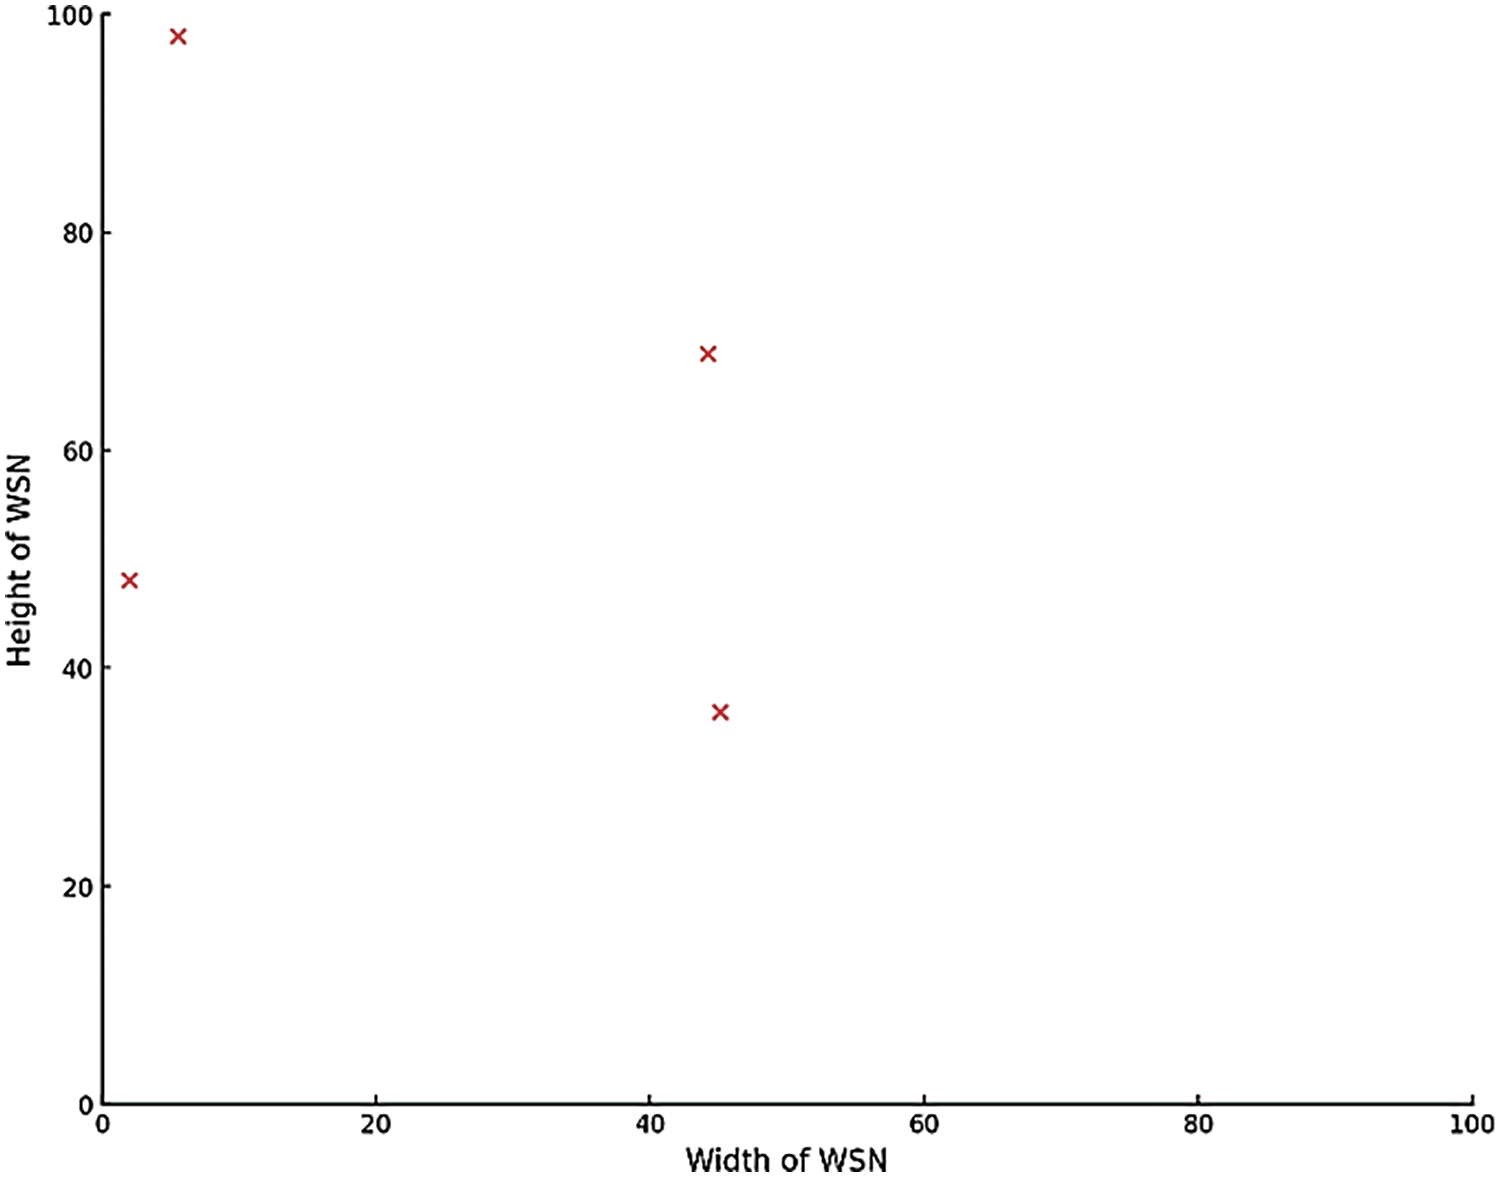
Figure 10: Random waypoint mobility of 4 mobile sinks after 1000 rounds
The knowledge provided by Fig. 10 is about navigation through WSN by mobile sinks. It tells whether they move independently or converge into certain regions. The information that can be revealed from paths includes efficiency in data gathering done by moving sinks, places where sinking occurs frequently and general coverage of the entire network.
Finally, Figs. 9 and 10 visually demonstrate how sensor nodes and mobile sinks behave when it comes to mobility; hence they help researchers/practitioners to understand movement of these two components within network over time. These visual aids also assist in assessing effectiveness as well efficiency regarding meeting performance targets for communication among different parts connected through mobility models while working towards achieving desired results for network efficiency at large.
Table 2 utilized various scenarios to measure the time (in seconds) taken by the proposed Deep LSTM Regression Network. In a wireless sensor network (WSN), simulated scenarios with 100, 400 and 800 nodes were used for 750 rounds. The evaluation was done against several other methods that had been published previously in order to find out whether they are really efficient or not. For each method, its lifetime is indicated in the table which reflects on their energy efficiency and sustainability, respectively. Under this setup, at 400 nodes and 532 s at 800 nodes, the proposed Deep LSTM Regression Network method has an impressive life span of 493.5 s; thus far no other approach saves more power while making better networks than this which represents over five times longer operation in such environments as any other methods else known from records does Not only does this achievement outperform all other approaches but also shows that they save more power while making networks work better since according to records it operates over five times longer than any methods else available in such like environments.

When comparing these results with other methods found in the same publications, it becomes evident that this proposed way performs better than most of them by a large margin. In terms of life time, only Cluster Tree Routing Protocol (CTRP) is close to the listed methods where it has 300 s at 400 nodes and 421 at 800 nodes. However Deep LSTM Regression Network outperforms this value by far showing how effective it can be in extending network’s life time. The Deep LSTM Regression Network proposed here clearly surpasses Adjacency Based Cell Score and Instantaneous Clustering Protocol (ICP) among others recorded for the first time ever in terms of lifetime values. This strong difference underlines great benefits brought about by deep learning techniques especially Long Short-Term Memory (LSTM) networks that work towards addressing dynamic features of mobile sinks thereby enhancing energy efficiency of a network.
To summarize, Table 2 gives a detailed review of how well the Deep LSTM Regression Network is expected to perform in its lifetime compared with other methods. It is evident from the findings that this method is better than any other method because it can last for much longer time which implies that there is a chance for it to enhance energy saving and eco-friendliness of wireless sensors networks.
Fig. 11 is a chart that compares the lifetime values of various methods with a wireless sensor network (WSN). It shows how much longer each method makes the batteries last than any other method given. The x-axis represents methods and y-axis represents time in seconds. This graph tells us which methods are better than others, but not by what margin or relative to what.
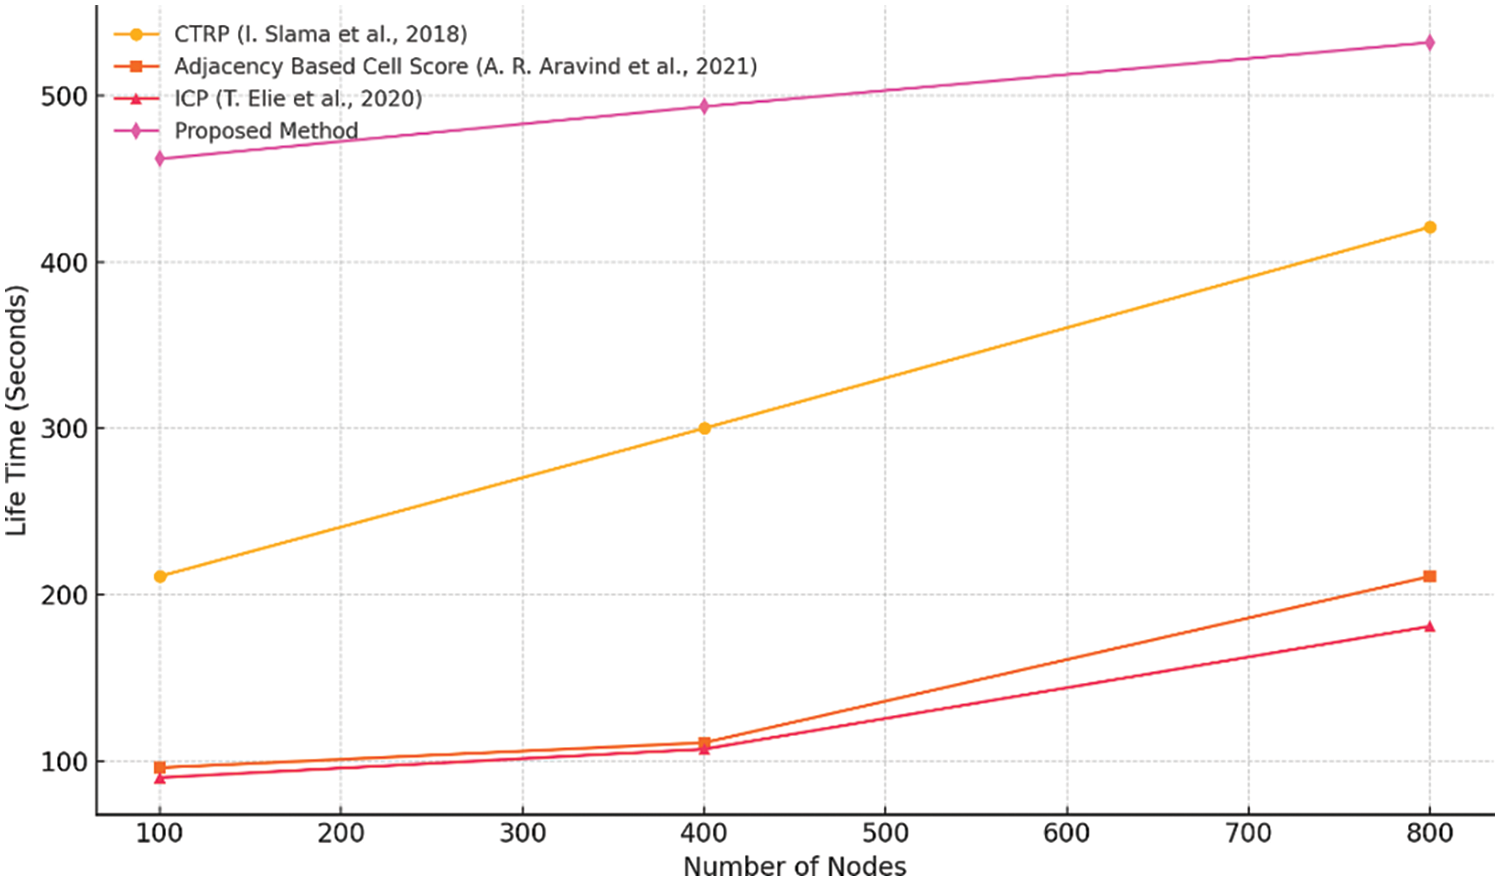
Figure 11: Lifetime values comparison [23,24,28]
For instance, at 400 nodes proposed deep LSTM regression network method achieved maximum lifetime value of 493.5 s and at 800 nodes it was equal to 532 s which is much higher than any other method shown in figure. It means that out of these approaches there is one that can extend life more than others but still needs improvement considering energy efficiency and operability as indicated by its shortcoming below CTRP approach where CTRP itself being represented by bar closest to our model’s bar on the graph achieves relatively high lifetime value about three hundred seconds only second after Deep LSTM Regression Network.
The other models have lifetimes less than the proposed model with most around one-hundredths of seconds. This clearly demonstrates their effectiveness in extending network’s lifespan over existing ones thus proving the superiority for the model.
For 1000 rounds, Fig. 12 shows how much energy a network consumes under different methods. The line of the CODA model on the graph climbs upwards until it reaches about 1.9 J and has blue circles around that point to mark it as such. It suggests that CODA [30] method is least efficient when they have been running for a long time even though at first, they seem very good in terms of power saving. ACSRO [29] (shown by red asterisks) works at 1.6 J and then starts reducing. ECA-HA [31] appeared to resemble ACSRO before taking off downwards from around 1.4 J represented by black squares this indicates high efficiency through successful energy management like optimized routing or scheduling for power saving during communication among nodes within DTLR-Net Model (green triangles). And in the final DTLR-Net model exhibits better results than all the other methods in terms of energy consumption with less energy consumed.
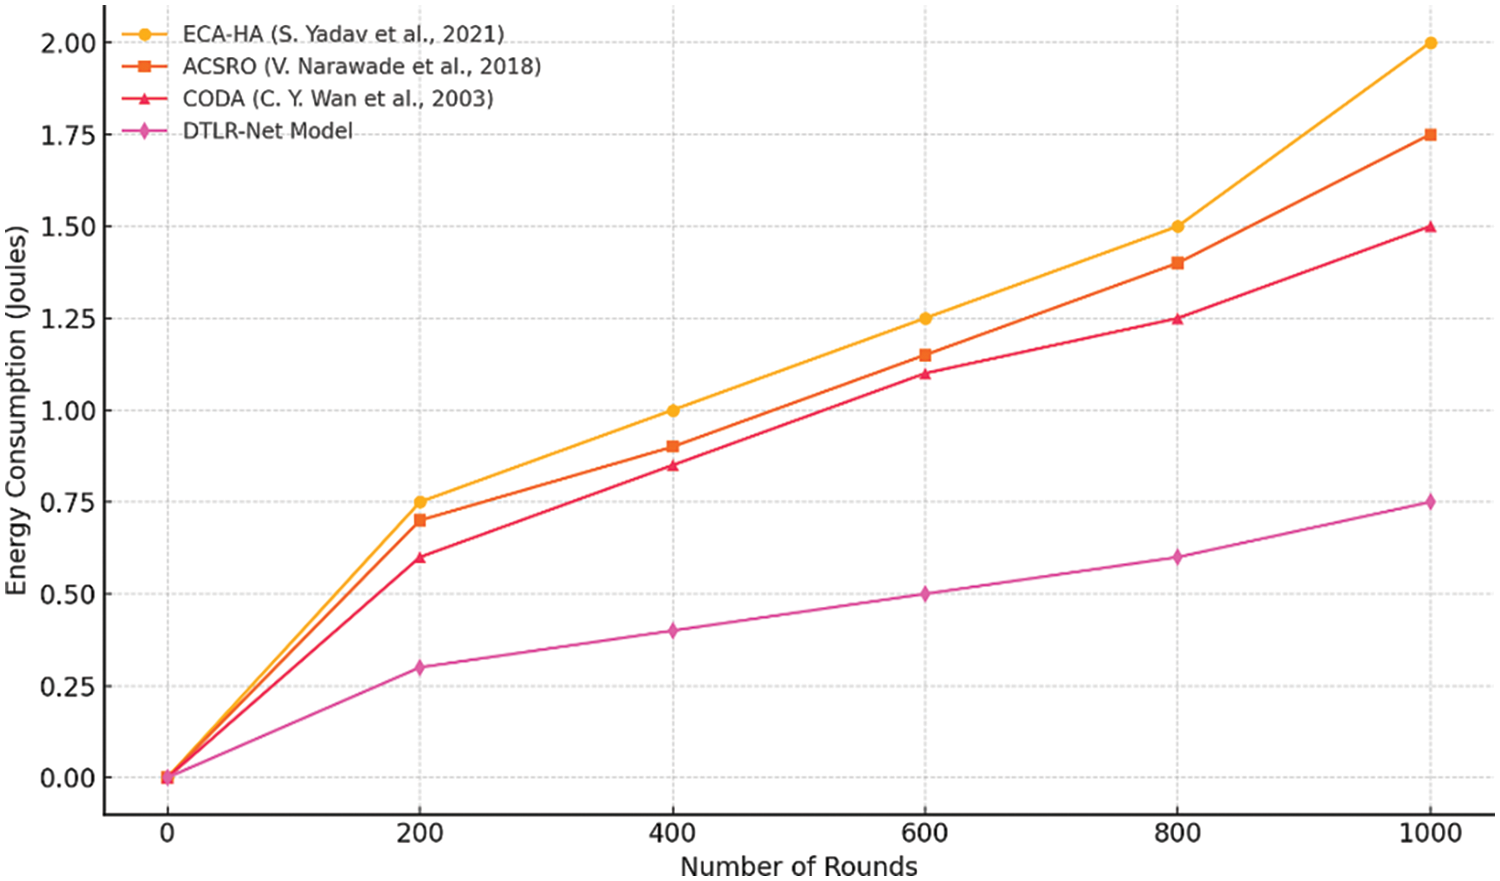
Figure 12: Average energy consumption [29,30,31]
The average residual energy of the proposed method in comparison to other methods is provided in Fig. 13. Other four methods are compared where the proposed method shown to have more energy left after the task also indicating the efficiency of model.

Figure 13: Average residual energy comparison [29,30,31,33]
Fig. 13 depicts the average residual energy of nodes across 1000 rounds, comparing five different models: ECA-HA [31], ACSRO [29], CODA [30], IBOLSR [33], and the proposed DTLR-Net model. The graph unequivocally demonstrates that the DTLR-Net model exhibits superior performance in terms of energy efficiency compared to the other models. During the simulation rounds, the DTLR-Net model consistently maintains the highest average residual energy, demonstrating its superior ability to preserve the energy of the nodes. Extending the operational lifespan of wireless sensor networks (WSNs) is crucial.
The ECA-HA, ACSRO, CODA, and IBOLSR models show a faster decrease in residual energy, with IBOLSR [33] showing the most significant decline, suggesting less efficient energy utilization compared to the DTLR-Net model. DTLR-Net consistently performs well and has a slower rate of energy depletion, demonstrating its effectiveness in conserving energy. This makes it an excellent choice for applications that prioritize energy efficiency. The DTLR-Net model is highlighted in this comparison for its significant contributions in improving the energy sustainability of WSNs.
There is currently a high demand for improved performance, stability, and energy efficiency in modern wireless sensor networks (WSNs). In order to tackle these difficulties, our research presents a novel approach known as DTLR-Net. This approach stands out due to its utilization of advanced deep learning techniques, specifically Long Short-Term Memory (LSTM) networks, which possess an understanding of the dynamic nature of mobile sink trajectories within Wireless Sensor Networks (WSNs). The scope of our investigation centers on precise trajectory prediction techniques, as they play a crucial role in enhancing data transmission, conserving energy, and stabilizing networks. The objective of this study is to investigate the impact of DTLR-Net on the performance of WSNs. This includes developing a reliable forecast model for mobility sinks and improving the overall efficiency of the network. The potential of the proposed method has been unequivocally demonstrated through thorough simulations and meticulous evaluations. Specifically, our research achieved an exceptional network lifespan of 493.5 s in a Wireless Sensor Network (WSN) consisting of 400 nodes over 750 simulation rounds. This performance significantly surpasses that of existing methods, such as the Cluster Tree Routing Protocol (CTRP).
Nevertheless, it is important to take into account the constraints. The experiments were carried out in a simulated environment using artificial datasets, which may not completely represent the intricacies of real-world WSN deployments, thus impacting the applicability of the findings. Additional research is required to evaluate the model’s efficacy and ability to handle larger networks comprising thousands of nodes. Furthermore, the efficacy of the model relies on the accurate coordination of nodes, which can pose difficulties in environments that are constantly changing and have limited resources. The study primarily emphasizes residual energy metrics, possibly neglecting factors such as data traffic load, network topology changes, and environmental interference. Future research should prioritize the implementation of the DTLR-Net model in real-world scenarios to verify its effectiveness. Additionally, there is a need to conduct scalability testing on larger networks, incorporate additional metrics for a comprehensive analysis, explore advanced synchronization techniques, and investigate the integration of energy harvesting to enhance the lifespan and sustainability of the network. By focusing on these specific areas, the research can contribute to the development of WSN solutions that are more efficient, dependable, and environmentally friendly.
The research has broader implications for enhancing the stability and energy efficiency of Wireless Sensor Networks (WSNs). By addressing key challenges related to network performance and power consumption, the findings contribute to more reliable and sustainable network operations. Improved stability ensures that WSNs can maintain consistent performance and minimize disruptions, while enhanced energy efficiency extends the operational lifespan of sensor nodes and reduces the need for frequent battery replacements. Collectively, these advancements lead to more robust and environmentally friendly network systems, supporting the long-term viability and effectiveness of WSNs in various applications.
Acknowledgement: The authors are extremely grateful to the editors and reviewers for their meticulous evaluations and sage advice.
Funding Statement: The authors received no specific funding for this study.
Author Contributions: The authors confirm contribution to the paper as follows: Study conception and design: Gajjala Savithri; Data collection: N. Raghavendra Sai; Analysis and interpretation of results: Gajjala Savithri; Draft manuscript preparation: Gajjala Savithri; Supervision: N. Raghavendra Sai. All authors reviewed the results and approved the final version of the manuscript.
Availability of Data and Materials: Upon reasonable request, the datasets generated and/or analyzed during the present project may be provided by the corresponding author.
Ethics Approval: Not applicable.
Conflicts of Interest: The authors declare that they have no conflicts of interest to report regarding the present study.
References
1. J. Yan, M. Zhou, and Z. Ding, “Recent advances in energy-efficient routing protocols for wireless sensor network: A review,” IEEE Access, vol. 4, pp. 5673–5686, 2016. doi: 10.1109/ACCESS.2016.2598719. [Google Scholar] [CrossRef]
2. S. Radhika and P. Rangarajan, “On improving the lifespan of wireless sensor network with fuzzy based clustering and machine learning based data reduction,” Appl. Soft Comput., vol. 83, Oct. 2019. doi: 10.1016/j.asoc.2019.105610. [Google Scholar] [CrossRef]
3. C. Ma, W. Liang, M. Zheng, and H. Sharif, “A connectivity aware approximation algorithm for relay node placement in wireless sensor networks,” IEEE Sens. J., vol. 16, no. 2, pp. 515–528, 2016. doi: 10.1109/JSEN.2015.2456931. [Google Scholar] [CrossRef]
4. P. Nayak and A. Devulapalli, “A fuzzy logic-based clustering algorithm for WSN to extend the network lifetime,” IEEE Sens. J., vol. 16, no. 1, pp. 137–144, 2016. doi: 10.1109/JSEN.2015.2472970. [Google Scholar] [CrossRef]
5. J. -S. Lee and T. -Y. Kao, “An improved three-layer low-energy adaptive clustering hierarchy for wireless sensor networks,” IEEE Internet Things J., vol. 3, no. 6, pp. 951–958, 2016. doi: 10.1109/JIOT.2016.2530682. [Google Scholar] [CrossRef]
6. A. Saranya, R. Senthilkumaran, and G. Nagarajan, “Enhancing network lifetime using tree based routing protocol in wireless sensor networks,” in 2015 2nd Int. Conf. Electron. Commun. Syst. (ICECS), Coimbatore, India, Feb. 2015, pp. 1392–1396. [Google Scholar]
7. A. Mehrabi and K. Kim, “General framework for network throughput maximization in sink-based energy harvesting wireless sensor networks,” IEEE Trans. Mob. Comput., vol. 16, no. 7, pp. 1881–1896, Jul. 2017. doi: 10.1109/TMC.2016.2607716. [Google Scholar] [CrossRef]
8. S. Yu, B. Zhang, C. Li, and H. T. Mouftah, “Routing protocols for wireless sensor networks with mobile sinks: A survey,” IEEE Commun. Mag., vol. 52, no. 7, pp. 150–157, 2014. doi: 10.1109/MCOM.2014.6852097. [Google Scholar] [CrossRef]
9. C. Konstantopoulos, G. Pantziou, D. Gavalas, A. Mpitziopoulos, and B. Mamalis, “A rendezvous-based approach enabling energy-efficient sensory data collection with mobile sinks,” IEEE Trans. Parallel Distrib. Syst., vol. 23, no. 5, pp. 809–817, 2012. doi: 10.1109/TPDS.2011.237. [Google Scholar] [CrossRef]
10. S. Gao, H. Zhang, and S. Das, “Efficient data collection in wireless sensor networks with path-constrained mobile sinks,” IEEE Trans. Mob. Comput., vol. 10, no. 4, pp. 592–608, 2011. doi: 10.1109/TMC.2010.193. [Google Scholar] [CrossRef]
11. R. -S. Chang, S. -H. Wang, S. -L. Tsai, and W. -P. Yang, “Planning rendezvous using the Halin graph in wireless sensor networks,” IET Wirel. Sens. Syst., vol. 2, no. 3, pp. 222–229, 2012. doi: 10.1049/iet-wss.2011.0138. [Google Scholar] [CrossRef]
12. R. Deng, S. He, and J. Chen, “An online algorithm for data collection by multiple sinks in wireless-sensor networks,” IEEE Trans. Control Netw. Syst., vol. 5, no. 1, pp. 93–104, Mar. 2018. doi: 10.1109/TCNS.2016.2578460. [Google Scholar] [CrossRef]
13. W. Wen, C. -Y. Chang, S. Zhao, and C. Shang, “Cooperative data collection mechanism using multiple mobile sinks in wireless sensor networks,” Sensors, vol. 18, no. 8, 2018, Art. no. 2627. doi: 10.3390/s18082627. [Google Scholar] [PubMed] [CrossRef]
14. S. Tabatabaei and A. M. Rigi, “Reliable routing algorithm based on clustering and mobile sink in wireless sensor networks,” Wirel. Pers. Commun., vol. 108, no. 4, pp. 2541–2558, 2019. doi: 10.1007/s11277-019-06537-1. [Google Scholar] [CrossRef]
15. Y. Gao, J. Wang, W. Wu, A. K. Sangaiah, and S. Lim, “A hybrid method for mobile agent moving trajectory scheduling using ACO and PSO in WSNs,” Sensors, vol. 19, no. 3, pp. 575, 2019. doi: 10.3390/s19030575. [Google Scholar] [PubMed] [CrossRef]
16. B. Su, C. Du, and J. Huan, “Trusted opportunistic routing based on node trust model,” IEEE Access, vol. 8, pp. 163077–163090, 2020. doi: 10.1109/ACCESS.2020.3020129. [Google Scholar] [CrossRef]
17. D. Sethi, “An approach to optimize homogeneous and heterogeneous routing protocols in WSN using sink mobility,” MAPAN, vol. 35, no. 2, pp. 241–250, 2020. doi: 10.1007/s12647-020-00366-5. [Google Scholar] [CrossRef]
18. S. Baskar, R. Selvaraj, V. M. Kuthadi, and P. M. Shakeel, “Attribute-based data fusion for designing a rational trust model for improving the service reliability of internet of things assisted applications in smart cities,” Soft Comput., vol. 25, no. 18, pp. 12275–12289, 2021. doi: 10.1007/s00500-021-05910-2. [Google Scholar] [CrossRef]
19. O. Banimelhem, E. Taqieddin, and I. Shatnawi, “An efficient path generation algorithm using principle component analysis for mobile sinks in wireless sensor networks,” J. Sens. Actuator Netw., vol. 10, no. 4, 2021, Art. no. 69. doi: 10.3390/jsan10040069. [Google Scholar] [CrossRef]
20. P. P. Jadhav and S. D. Joshi, “Atom search sunflower optimization for trust-based routing in internet of things,” Int. J. Numer. Model., vol. 34, no. 3, 2021, Art. no. e2845. doi: 10.1002/jnm.2845. [Google Scholar] [CrossRef]
21. H. Lin, S. Garg, J. Hu, X. Wang, M. J. Piran and M. S. Hossain, “Data fusion and transfer learning empowered granular trust evaluation for Internet of Things,” Inf. Fusion, vol. 78, no. 9, pp. 149–157, 2022. doi: 10.1016/j.inffus.2021.09.001. [Google Scholar] [CrossRef]
22. S. Boyineni, K. Kavitha, and M. Sreenivasulu, “Mobile sink-based data collection in event-driven wireless sensor networks using a modified ant colony optimization,” Phys. Commun., vol. 52, 2022, Art. no. 101600. doi: 10.1016/j.phycom.2022.101600. [Google Scholar] [CrossRef]
23. I. Slama, H. Jouini, A. Mami, and N. Boulajfen, “Wireless sensor network energy optimization in smart home using LEACH protocol: Comparative study with CTP routing protocol,” Int. J. Eng. Technol., vol. 7, pp. 147–154, 2018. [Google Scholar]
24. A. R. Aravind and R. Chakravarthi, “Optimal placement of mobile sink in wireless sensor network using adjacency-based cell score factor,” Int. J. Intell. Eng. Syst., vol. 14, no. 2, pp. 22–32, 2021. doi: 10.22266/ijies2021.0430.03. [Google Scholar] [CrossRef]
25. A. Kaswan, V. Singh, and P. K. Jana, “A multiobjective and PSO based energy efficient path design for mobile sink in wireless sensor networks,” Pervasive Mob. Comput., vol. 46, no. 2, pp. 122–136, 2018. doi: 10.1016/j.pmcj.2018.02.003. [Google Scholar] [CrossRef]
26. D. P. Kumar, A. Tarachand, A. Chandra, and S. Rao, “ACO-based mobile sink path determination for wireless sensor networks under non-uniform data constraints,” Appl. Soft Comput., vol. 69, no. 3, pp. 528–540, 2018. doi: 10.1016/j.asoc.2018.05.008. [Google Scholar] [CrossRef]
27. S. Sapre and S. Mini, “A differential moth flame optimization algorithm for mobile sink trajectory,” Peer Peer Netw. Appl., vol. 14, pp. 44–57, 2020. doi: 10.1007/s12083-020-00947-w. [Google Scholar] [CrossRef]
28. T. Elie, Z. Aline, and E. Tonye, “A reliable and efficient path discovery method for mobile sink based wireless sensor networks,” Int. J. Comput. Appl., vol. 176, no. 25, pp. 17–22, 2020. [Google Scholar]
29. V. Narawade and U. D. Kolekar, “ACSRO: Adaptive cuckoo search based rate adjustment for optimized congestion avoidance and control in wireless sensor networks,” Alex. Engi. J., vol. 57, no. 1, pp. 131–145, 2018. doi: 10.1016/j.aej.2016.10.005. [Google Scholar] [CrossRef]
30. C. Y. Wan, S. B. Eisenman, and A. T. Campbell, “CODA: Congestion detection and avoidance in sensor networks,” in Proc. 1st Int. Conf. Embed. Netw. Sens. Syst., New York, NY, USA, Nov. 2003, pp. 266–279. [Google Scholar]
31. S. Yadav et al., “Traffic and energy aware optimization for congestion control in next generation wireless sensor networks,” J. Sens., vol. 2021, 2021, Art. no. 5575802. doi: 10.1155/2021/5575802. [Google Scholar] [CrossRef]
32. R. B. Pedditi and K. Debasis, “Energy efficient routing protocol for an IoT-based WSN system to detect forest fires,” Appl. Sci., vol. 13, no. 5, 2023, Art. no. 3026. doi: 10.3390/app13053026. [Google Scholar] [CrossRef]
33. C. V. Subbaiah and K. Govinda, “Implementing routing protocol for energy-aware mobile Ad Hoc networks for WBAN-based healthcare systems,” Soft Comput., 2023. doi: 10.1007/s00500-023-07975-7. [Google Scholar] [CrossRef]
Cite This Article
 Copyright © 2024 The Author(s). Published by Tech Science Press.
This work is licensed under a Creative Commons Attribution 4.0 International License , which permits unrestricted use, distribution, and reproduction in any medium, provided the original work is properly cited.


 Submit a Paper
 Propose a Special lssue
 View Full Text
 Download PDF
 Downloads
 Citation Tools