 Open Access
ARTICLE
Research on Defect Detection of Wind Turbine Blades Based on Morphology and Improved Otsu Algorithm Using Infrared Images
1 School of Mechanical and Control Engineering, Baicheng Normal University, Baicheng, 137000, China
2 School of Information and Control Engineering, Jilin Institute of Chemical Technology, Jilin, 132022, China
* Corresponding Author: Wenwen Li. Email:
Computers, Materials & Continua 2024, 81(1), 933-949. https://doi.org/10.32604/cmc.2024.056614
Received 26 July 2024; Accepted 26 August 2024; Issue published 15 October 2024
Abstract
To address the issues of low accuracy and high false positive rate in traditional Otsu algorithm for defect detection on infrared images of wind turbine blades (WTB), this paper proposes a technique that combines morphological image enhancement with an improved Otsu algorithm. First, mathematical morphology’s differential multi-scale white and black top-hat operations are applied to enhance the image. The algorithm employs entropy as the objective function to guide the iteration process of image enhancement, selecting appropriate structural element scales to execute differential multi-scale white and black top-hat transformations, effectively enhancing the detail features of defect regions and improving the contrast between defects and background. Afterwards, grayscale inversion is performed on the enhanced infrared defect image to better adapt to the improved Otsu algorithm. Finally, by introducing a parameter K to adjust the calculation of inter-class variance in the Otsu method, the weight of the target pixels is increased. Combined with the adaptive iterative threshold algorithm, the threshold selection process is further fine-tuned. Experimental results show that compared to traditional Otsu algorithms and other improvements, the proposed method has significant advantages in terms of defect detection accuracy and reducing false positive rates. The average defect detection rate approaches 1, and the average Hausdorff distance decreases to 0.825, indicating strong robustness and accuracy of the method.Keywords
Monitoring and maintaining the health of WTB has long been one of the challenges facing the global wind energy industry [1]. The blade is one of the core components of a wind turbine [2]. The normal service life of a WTB is about 20 years [3]. Damage to WTBs significantly affects the efficiency of power generation, leading to increased maintenance costs and potentially causing safety risks and environmental issues. Severe damage to the blades may result in fracture or detachment, endangering the surrounding environment and personnel safety, while also potentially increasing noise pollution and adversely affecting the ecological environment. Therefore, timely and effective damage detection of WTB is crucial to avoid failures, formulate maintenance plans, and ensure the sustainable operation of wind turbines. Common detection techniques such as acoustic emission, ultrasound, and infrared thermography can effectively monitor the health status of the blades and prevent potential problems. Furthermore, implementing a healthy maintenance management strategy can not only reduce labor costs and minimize downtime but also prevent unnecessary replacements, thereby improving energy harvesting efficiency [4].
In recent years, the field of defect detection has widely adopted deep learning and neural network technologies [5–8]. Deng et al. [9] developed an enhanced S-U-Net network for denoising wind turbine rotor blade images, employing weakly supervised convolutional neural network (CNN) and visual geometry group 16 (VGG16) for feature extraction, and used an enhanced particle swarm optimization (PSO) algorithm with K-means clustering algorithm for defect classification, enabling early defect detection. Masita et al. [10] developed a high-accuracy defect detection technique for WTBs using ResNet-based Convolutional Neural Networks (Res-CNN3), which processes drone-captured laser and RGB images through a residual network and CNN, predicting defect areas with a selective search algorithm to enhance maintenance strategies. Qiu et al. [11] introduced an effective small target detection method using a YOLO model for the automatic visual inspection of WTBs. This approach combines CNN with the YOLO framework to create a deep learning structure designed for precise defect recognition. To address the challenge of detecting tiny defects, they developed YOLO-based small object detection approach (YSODA), a YOLO-based technique that employs a multi-scale feature pyramid to improve detection accuracy by leveraging features from various depths in the network.
Otsu and its improved methods of defect detection techniques are widely used due to their simplicity and efficiency, and they do not require the large amount of training data that deep learning methods need, making them more practical compared to deep learning approaches. Otsu’s method, also known as the maximum interclass variance method, was proposed by Otsu in 1978 traditional Otsu thresholding method may fail. To address this challenge and improve the accuracy of target segmentation, researchers have proposed various improved schemes. Mishra et al. [12] introduced an improved Otsu thresholding technique that combines the IHS color space and a cylindrical model to facilitate the integration and feature extraction of multi-sensor satellite images. They further refined the selection of Otsu thresholds using a genetic algorithm and enhanced spatial details within the cylindrical model to reduce bias indices. Researchers such as Hu et al. [13] proposed a quadtree-based variant of the Otsu algorithm specifically for detecting cracks in caliper images. This algorithm first divides the image, then calculates the second-order moment of the grayscale histogram to characterize the complexity of image textures, selecting those regions with higher complexity as candidate regions. The algorithm iterates over these regions to find blocks where the foreground-to-background ratio is close, performing threshold operations to determine the optimal threshold. Truong et al. [14] proposed a new improved algorithm based on Otsu’s method. This algorithm utilizes entropy theory and does not require manual parameter adjustment, effectively detecting defect regions that are extremely small compared to the product surface area. Xie et al. [15] primarily introduced an Improved Whale Optimization Algorithm (IWOA), which was applied to the two-dimensional Otsu image segmentation method in order to enhance the accuracy of steel plate surface defect image segmentation. However, if the image is affected by uneven illumination, these methods may produce erroneous segmentation results.
The curved geometric structure of WTB leads to uneven illumination in infrared images, and the infrared images obtained under active thermal excitation have low clarity and blurred details, which affect defect identification and accurate assessment. This study addresses the challenges of using infrared images to detect defects in WTBs by proposing a non-destructive testing method that combines mathematical morphology with an improved Otsu algorithm. The method involves preprocessing the images using differential multi-scale top-hat operations and grayscale inversion to highlight defects, followed by optimizing the Otsu algorithm by increasing the target weight and using adaptive iterative thresholding. Experimental results show that this method significantly improves defect detection accuracy and reduces false positives, demonstrating its robustness and precision.
In the second section of this paper, we explore techniques related to image enhancement. The third section provides a detailed description of the improved Otsu algorithm. Experimental results and their analysis, based on infrared images, are presented in the fourth section. The final part of the paper discusses the experimental findings and considers the potential impacts and significance of this research in the future.
The main contributions of this paper can be summarized as follows: (1) Introduced the use of differential multi-scale white top-hat and black top-hat operations from mathematical morphology to enhance the infrared images of wind turbine blades. (2) Utilized entropy as an objective function to guide the iterative process of image enhancement, ensuring that the enhancement highlights defect characteristics effectively. (3) Modified the traditional Otsu algorithm by introducing a parameter K to adjust the inter-class variance calculation, increasing the weight of target pixels, thus enabling the algorithm to distinguish between defects and background more accurately. (4) Integrated an adaptive iterative thresholding algorithm to further fine-tune the threshold selection process, improving its precision and adaptability.
2.1 Morphological Enhancement Operator
In the field of mathematical morphology, the dilation regions in an image by moving the dilation process expands the bright regions in an image by moving a structuring element (SE) and selecting the maximum values; conversely, the erosion process reduces these regions by choosing the minimum values. Opening involves first eroding the image and then dilating it on the basis of the erosion; while closing involves first dilating followed by erosion. These two operations provide crucial functions for image processing. Here are the specific definitions of opening and closing [16]:
where,
The top-hat transform is a technique used to extract image details by utilizing basic morphological operations such as erosion, dilation, opening, and closing. In morphological processing, the white top-hat transform extracts bright details by calculating the difference between the original image and the image processed by the opening operation. Conversely, the black top-hat transform extracts dark details by subtracting the image processed by the closing operation from the original image. The combination of these two transforms effectively captures fine features in the image. The following formula represents the enhancement operator [17]:
where,
where,
where,
In this section, the author discusses how to select an appropriate scale for structural elements to achieve optimal image enhancement. Different scales of morphological enhancement operators need further optimization to ensure the selection of the appropriate scale size. In the research on one-dimensional signal operating, References [19–23] provided a thorough discussion on the performance of structural elements with different sizes in extracting signal features. The findings indicate that as the size of these structural elements increases, their ability to extract signal characteristics initially improves and then gradually declines.
Román et al. [24] conducted a study in the field of two-dimensional image processing, exploring the application of entropy ‘E’ in multi-scale morphological image enhancement. They proposed E as a metric to evaluate the capability of image feature extraction. This paper selected infrared images of laboratory-manufactured bubble defects and infrared thermal images of damaged WTBs as test subjects to verify the applicability of entropy in this study of enhancing defect images. Fig. 1 illustrates the trend of changes in E.
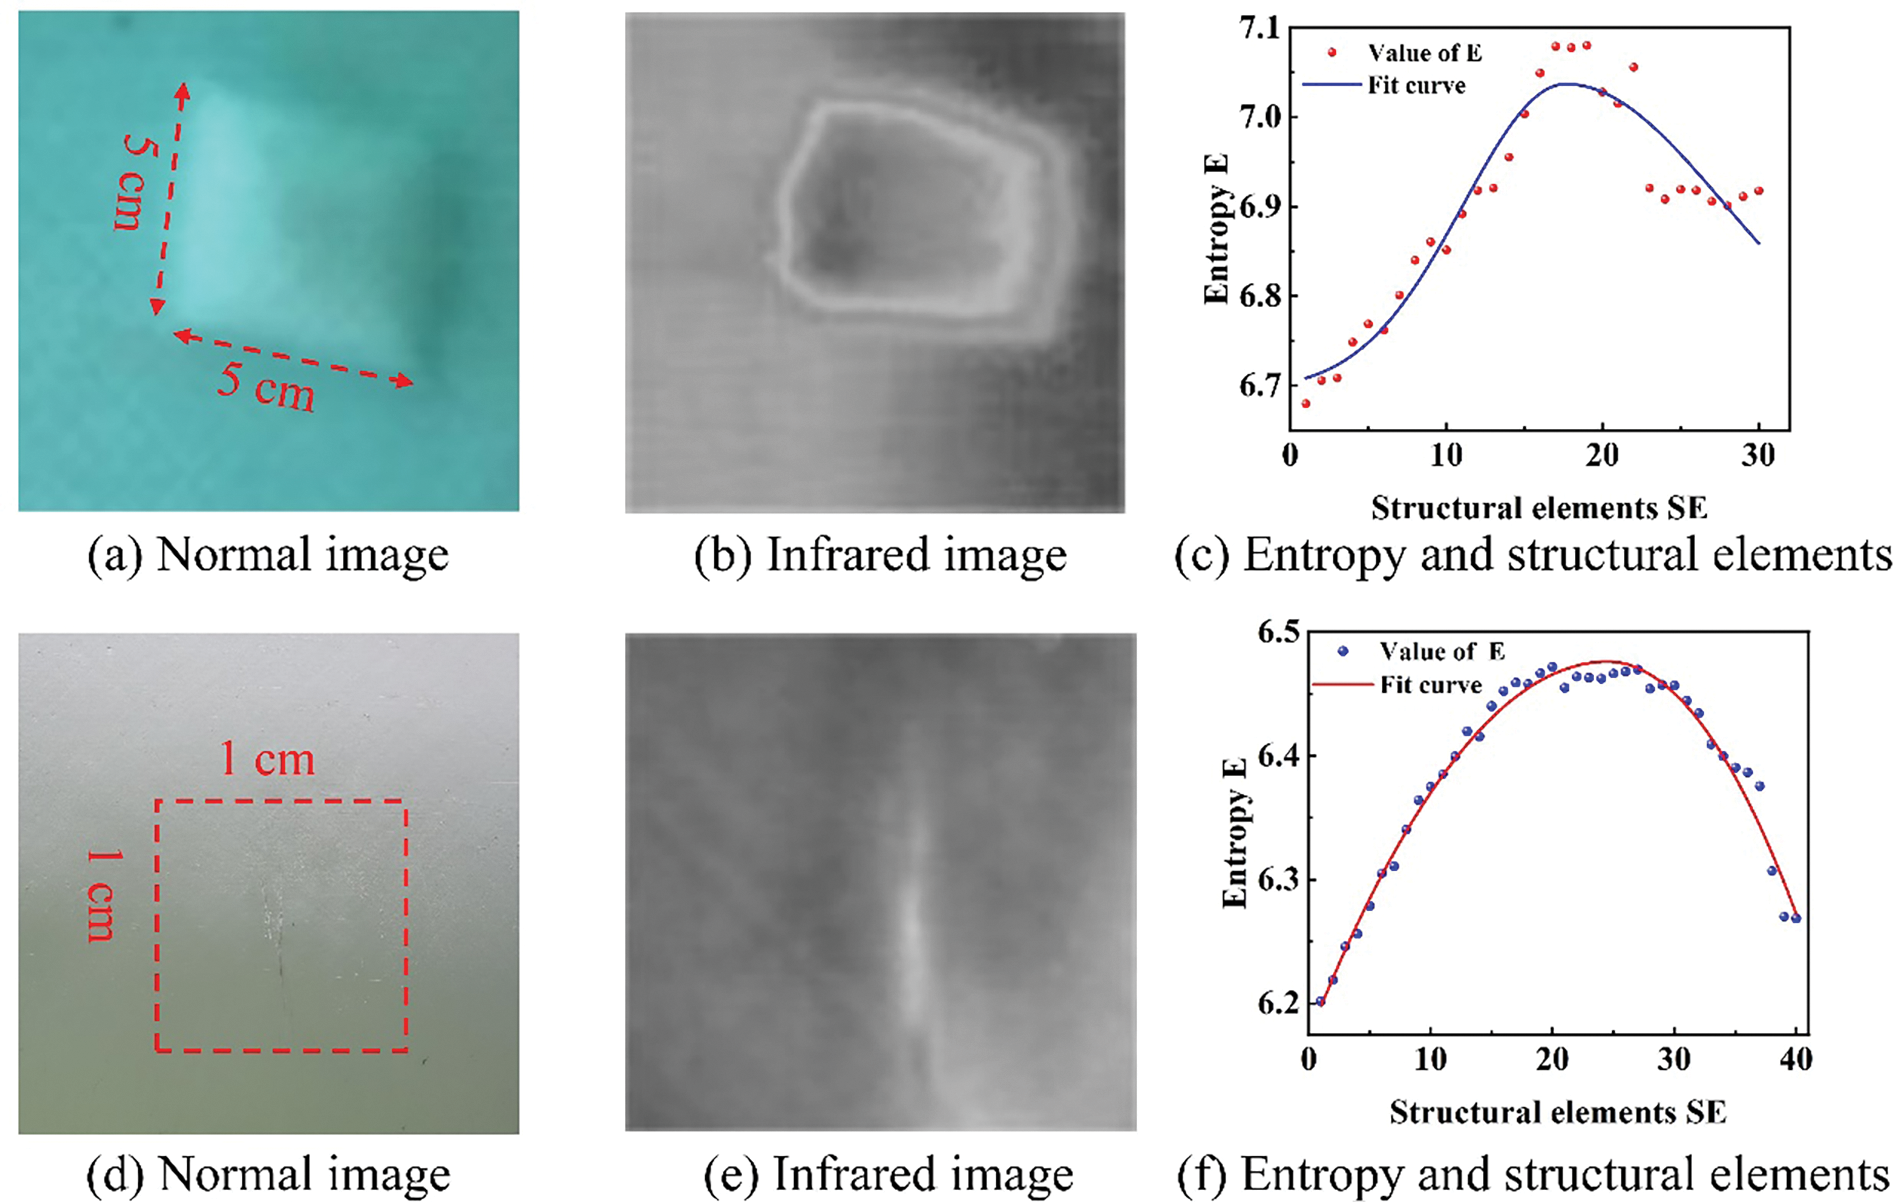
Figure 1: The trend of entropy with changes in SE (a) Normal image. (b) Infrared image. (c) Entropy and structural elements. (d) Normal image. (e) Infrared image. (f) Entropy and structural elements
Fig. 1a,b respectively shows the normal image and infrared thermal image of a premade bubble defect, while Fig. 1d,e respectively displays the normal image and infrared thermal image of a blade crack defect. As demonstrated in Fig. 1, images captured using traditional camera techniques exhibit certain limitations in revealing defects, with defect characteristics being notably obscure. This may impact subsequent analysis and judgment processes. In light of this, the present study employs infrared acquisition as a supplementary method. Infrared imaging technology, with its sensitivity to temperature and thermal variations, effectively detects defects that are not easily identifiable in the visible spectrum. The application of this method significantly enhances the accuracy and reliability of defect detection, particularly when diagnosing surface and sub-surface damage in materials, where its advantages are even more pronounced. Fig. 1c,f shows the fitted curves of entropy variations as the structural elements gradually increase. The experimental results indicate that the trend of entropy is similar to the trend of signal feature extraction capability. As the structural elements increase, the image feature extraction capability first increases and then decreases, with an optimal scale range existing.
Entropy, as a metric to gauge the richness of information in an image, is employed here as the objective function for the adaptive differential multi-scale morphological enhancement algorithm. Its core aim is to control the termination conditions of the iterative image enhancement process by quantifying the amount of information in the image. This method leverages the characteristics of entropy to adjust the degree of image enhancement, with the goal of optimizing image quality and the readability of the information. High entropy values typically indicate that an image contains more details and information, while low entropy values suggest that the image content is relatively uniform, with less information. During the image enhancement process, by monitoring and controlling the entropy of the image, the iteration can be effectively guided, ensuring that the image maintains detail integrity and avoids noise amplification due to over-enhancement. Thus, entropy, as an objective function, provides a precise control mechanism for image enhancement, aiming to achieve the best possible image quality and information readability. Therefore, this paper proposes an iterative thresholding method based on entropy to select the appropriate scale. Entropy is a measure used to quantify the degree of disorder or complexity in an image. It is determined by calculating the histogram distribution of the image to find the probability of occurrence for each pixel intensity value. The formula is as follows [25]:
where, f represents the original image,
The experimental results indicate that determining the scale
When the measure of contrast enhancement
2.3 Adaptive Differential Multiscale Enhancement Algorithm Flow
The method proposed in this paper enhances image detail features by iteratively adjusting the threshold of the objective function E to obtain the optimal scale interval. The specific process are as follows:

Note: The selection of the constant ζ follows these principles: Keeping the difference scale
To better adapt to the defect detection algorithm, the enhanced image needs to undergo grayscale inversion. The preprocessed image is shown in Fig. 2.

Figure 2: Preprocessed images (a) Original image. (b) Enhanced image. (c) Greyscale inversion
From Fig. 2b, it can be seen that morphological processing not only enhances the image contrast but also improves the detail features, making the edge features of defects more prominent. Additionally, grayscale inversion further optimizes the image quality, providing more suitable conditions for subsequent threshold segmentation.
3.1 The Traditional Otsu Algorithm
The Otsu method is a technique used to separate the target and background in an image. It finds an optimal threshold by calculating the method that maximizes the between-class variance, effectively separating the target and background pixels. During the segmentation process, the Otsu method can automatically select the optimal threshold, thereby achieving image segmentation and detection processing. The between-class variance is represented as [26]:
where ω1 and ω2 are the weights of the target defect pixels and background pixels, respectively. μ1 are μ2 the mean gray levels of the target pixels and background pixels, respectively.
If the between-class variance reaches its peak, the corresponding gray level is the threshold T determined by the Otsu method. The specific mathematical expression is as follows [26]:
When detecting defects in infrared images of WTBs, the original Otsu thresholding method has significant limitations. Due to the non-uniform brightness in the captured infrared images, the Otsu method, which is based on grayscale contrast, struggles to accurately segment the defect areas from the background on the blades. The segmentation result using the original Otsu algorithm is shown in Fig. 3.
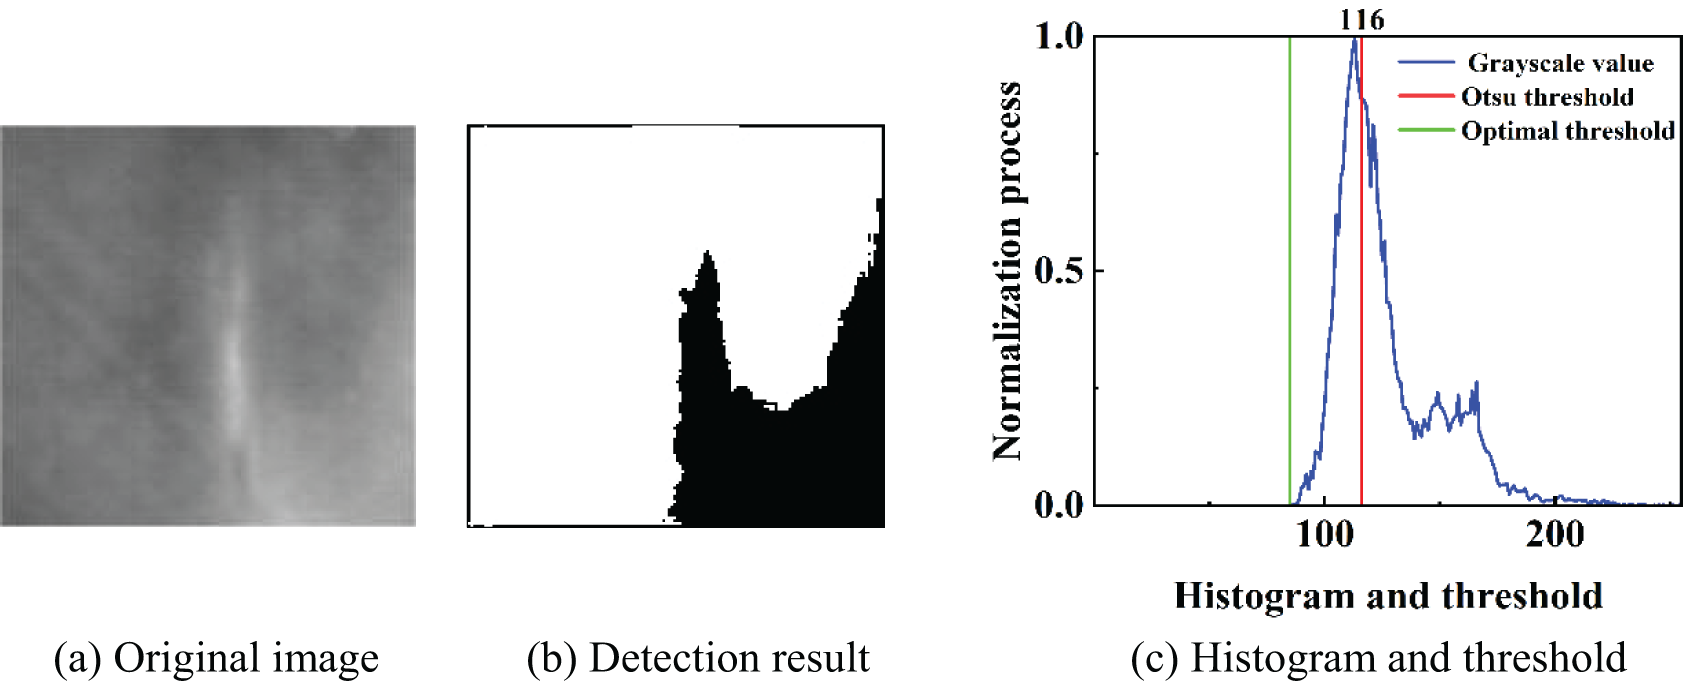
Figure 3: Detection results of WTB cracks using the original Otsu algorithm (a) Original image. (b) Detection result. (c) Histogram and threshold
As shown in Fig. 3, the segmentation effect of the original Otsu algorithm is not ideal. The segmentation threshold of this method is located on the right side of the peak in the histogram, while the predicted optimal threshold is at the green line at the bottom left of the histogram. Consequently, this algorithm incorrectly classifies some background pixels as crack targets, failing to accurately separate the cracks.
To improve the accuracy of defect detection and reduce the impact of uneven brightness, this study optimized the Otsu algorithm by increasing the weight of the target pixels. This adjustment makes the threshold closer to the actual grayscale value of the defects, resulting in a more accurate display of the defect locations and contours in the detection results. The calculation method of the inter-class variance for the optimized algorithm is as follows:
where k represents the cumulative gradient of the grayscale values.
Cumulative gradient refers to accumulating the histogram of the image to form a cumulative gradient histogram. The peak in the cumulative histogram reflects the prominent features of the original histogram. By examining the cumulative histogram, one can more accurately identify important features in the image, thereby providing a more reliable basis for threshold selection. The calculation process for k is as follows:
where,
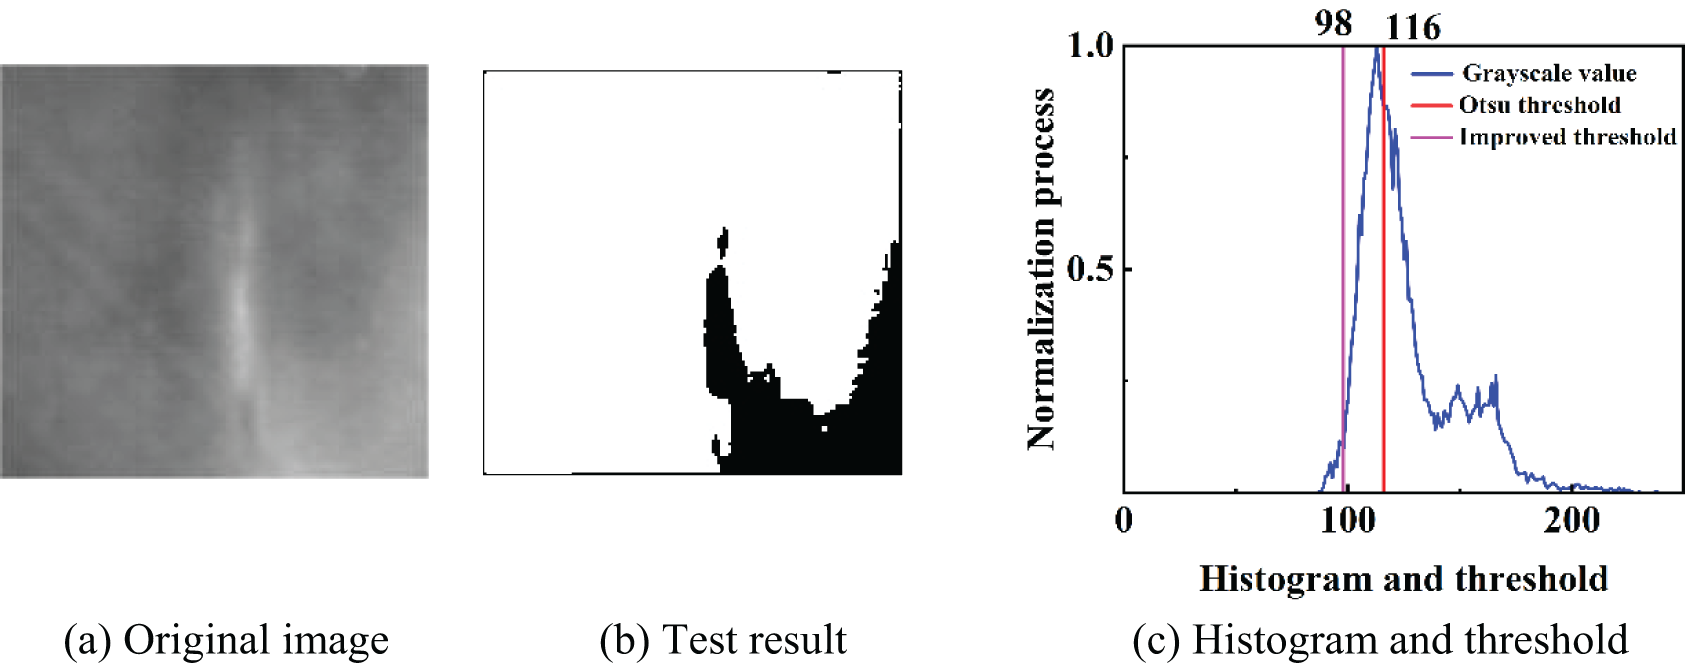
Figure 4: Segmentation results of the improved Otsu algorithm (a) Original image. (b) Test result. (c) Histogram and threshold
As shown in Fig. 4, the results processed by the improved algorithm are superior to those of the original algorithm. Fig. 4c demonstrates that the segmentation threshold of the improved algorithm shifts to the left, closer to the optimal threshold. However, due to the low grayscale contrast between cracks and the background in infrared images, as well as the presence of uneven brightness, accurate segmentation of cracks cannot always be achieved. When the threshold is set too high, the detected cracks may merge with the brighter parts of the background. To address this issue, this paper proposes an adaptive threshold segmentation method to reduce the impact of uneven illumination, ensuring perfect separation of the target and background during detection. Adaptive threshold computation is widely used in the field of statistical signal processing, optimizing signal detection performance by dynamically adjusting the threshold [16,17,27]. The main process of the algorithm is as follows:
Step 1: Perform image preprocessing using differential morphological enhancement and grayscale inversion to enhance image detail features and reduce uneven brightness;
Step 2: Optimize the threshold selection process by using the threshold obtained from the improved Otsu algorithm as the initial value, denoted as
Step 3: Divide the infrared defect image into two categories, target and background, based on the threshold TS, denoted as t and b, respectively;
Step 4: Calculate the average grayscale values of t and b, denoted as
Step 5: The formula for the adaptive threshold calculation is as follows:
where,
Step 6: If
As observed from Fig. 5, the defect detection rate exhibits a trend with respect to the changes in α and β. An increase in α leads to a decrease in the defect detection rate, while an increase in β results in an enhancement of the defect detection rate. Although a lower value of α may yield marginally improved evaluation metrics, it could also compromise the complete detection of defects in images with low contrast. In order to balance these considerations, this study has opted for an
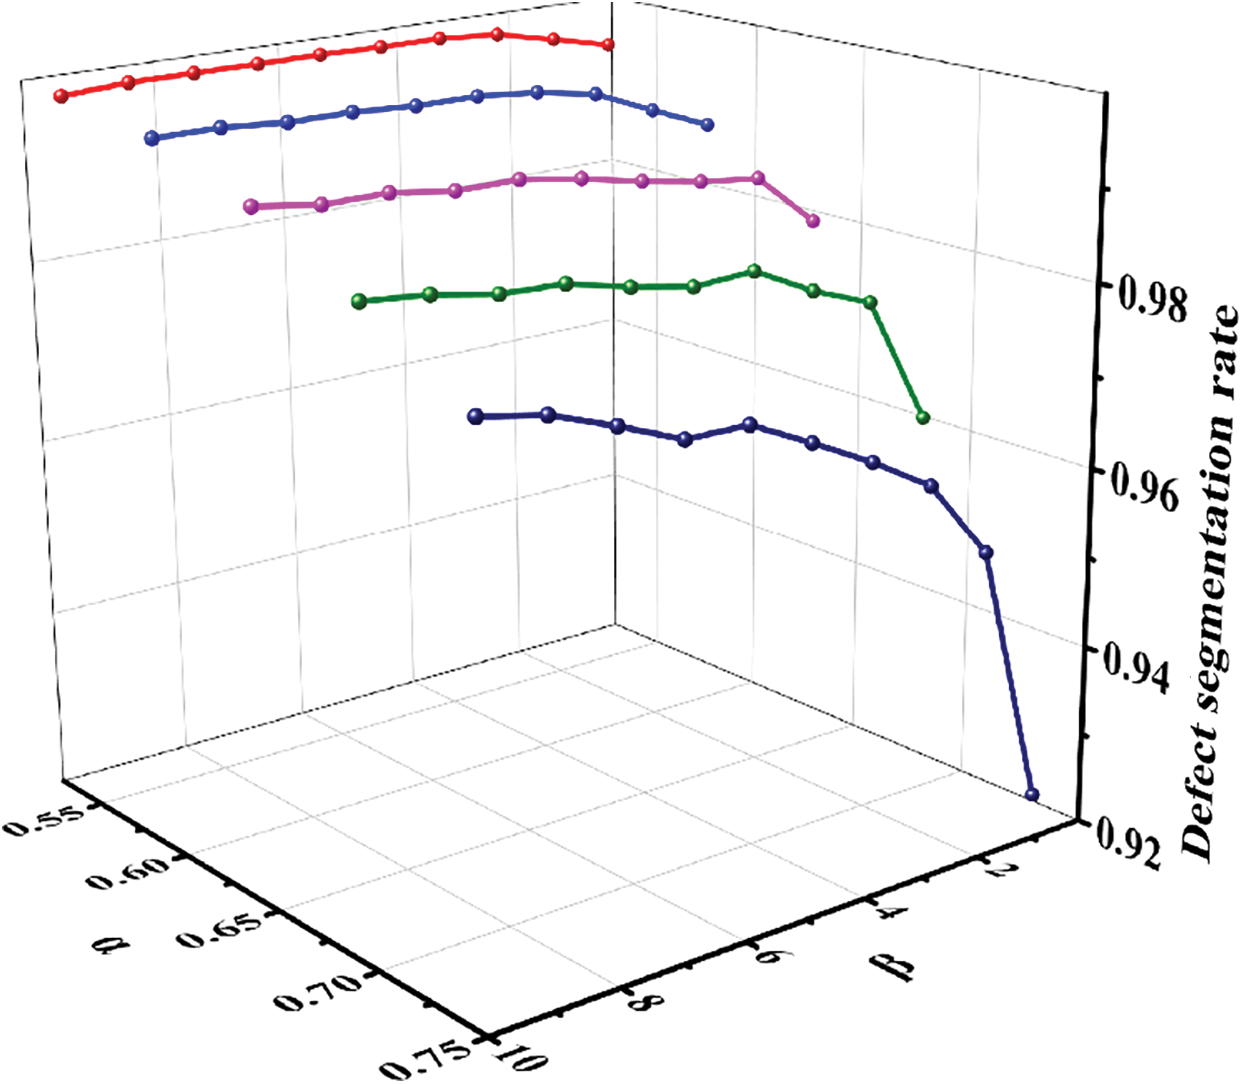
Figure 5: The trend of defect segmentation rate with respect to α and β
By applying the adaptive threshold segmentation using the improved Otsu algorithm, the segmentation effect of the improved algorithm in this paper is shown in Fig. 6.
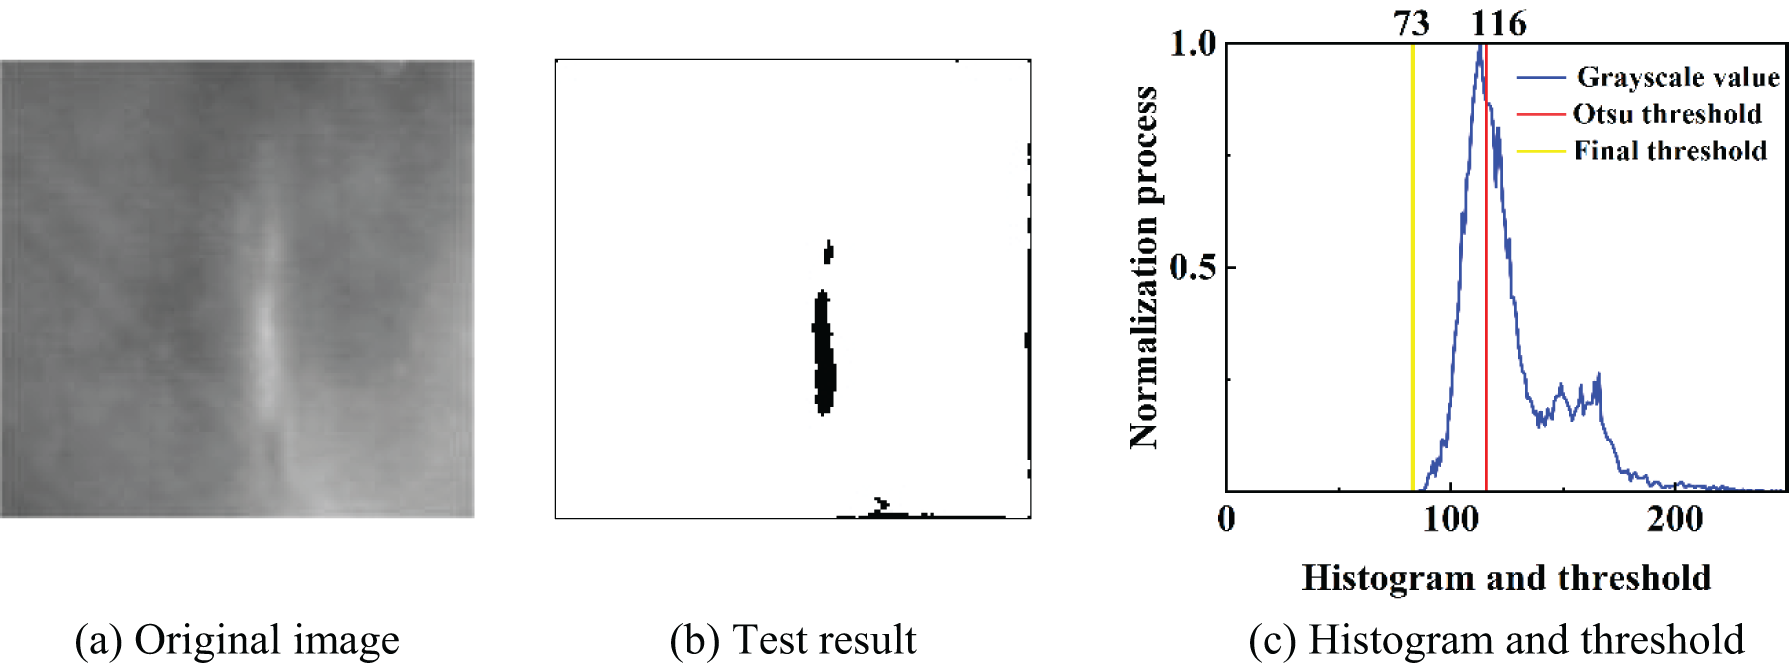
Figure 6: Crack detection results of the improved algorithm in this paper (a) Original image. (b) Text result. (c) Histogram and threshold
As shown in Fig. 6, the improved algorithm not only clearly identifies the cracks but also ensures that the final threshold meets the optimal threshold criteria. Additionally, the algorithm demonstrates strong robustness when processing infrared images under conditions of uneven brightness, significantly enhancing the accuracy of defect detection in WTBs.
To verify the effectiveness of the improved algorithm proposed in this paper for detecting defects in WTBs, a comparison was made with the Otsu algorithm and the improved Otsu methods proposed by References [14,15,28] and the improved algorithm proposed in this paper. A comprehensive evaluation was conducted from both subjective and objective perspectives.
4.1 Experimental Apparatus and Dataset
The experimental dataset for this study was sourced from on-site collections at wind farms in the Inner Mongolia region, as well as from pre-prepared samples in the laboratory. The dataset encompasses a variety of blade defect types, specifically including cracks, wrinkles, and bubbles. These defect types were captured using high-precision image acquisition devices to facilitate in-depth analysis. This dataset provides detailed information under both practical and controlled conditions for research into wind turbine blade damage detection techniques, thereby aiding in the development and validation of algorithms and detection methods.
Our team has developed and manufactured a continuous thermal excitation infrared non-destructive testing device, which is primarily used for blade inspection in wind farms. The experimental setup consists of the following components:
a. Two halogen lamps (with a power of 1 kW) for providing the necessary thermal energy.
b. A specialized heatproof lamp cover to ensure safety and minimize heat loss.
c. An electronic control system to regulate and manage the operation of the entire device.
d. A small motor to drive any movable parts within the equipment.
e. A computer equipped with an i7 processor for data processing and analysis.
f. An infrared thermal recorder, model NECR300W2, was used to capture thermal images of the inside of the blade.
To evaluate the performance of different algorithms in WTB detection. This study conducted a comparative analysis using the Otsu method, Xiong’s algorithm, Truong’s algorithm and Xie’s algorithm, and the improved algorithm proposed in this paper. The detection results of various methods are shown from Figs. 7–10.
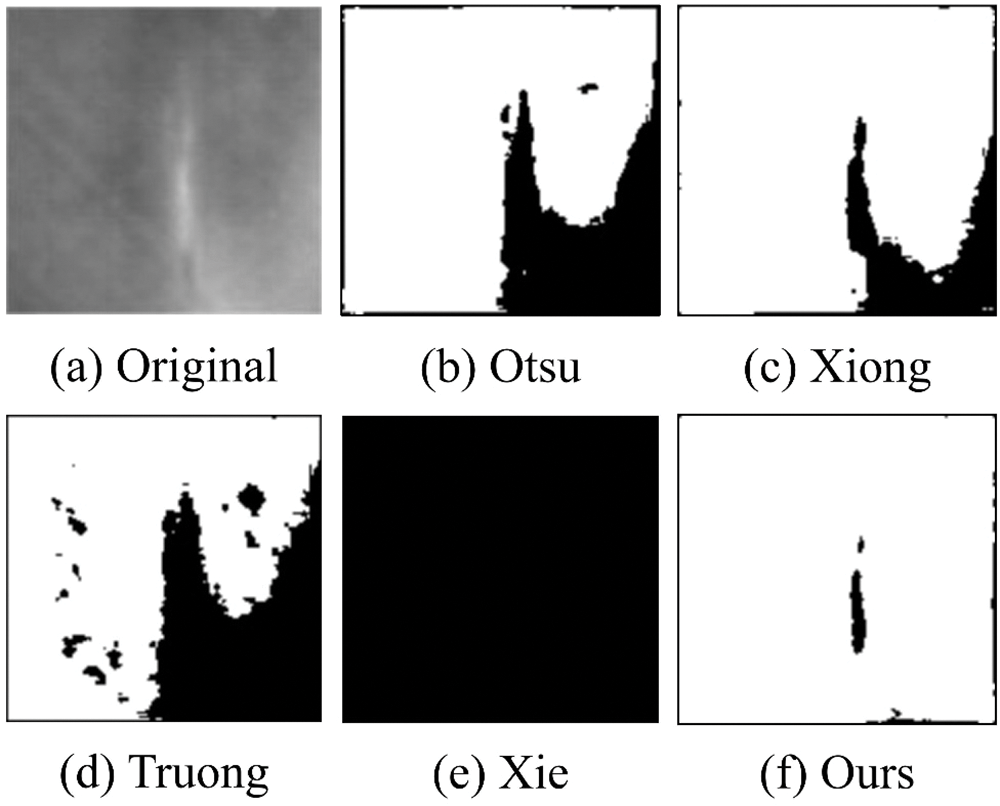
Figure 7: WTB crack detection results (a) Original. (b) Otsu. (c) Xiong. (d) Truong. (e) Xie. (f) Ours
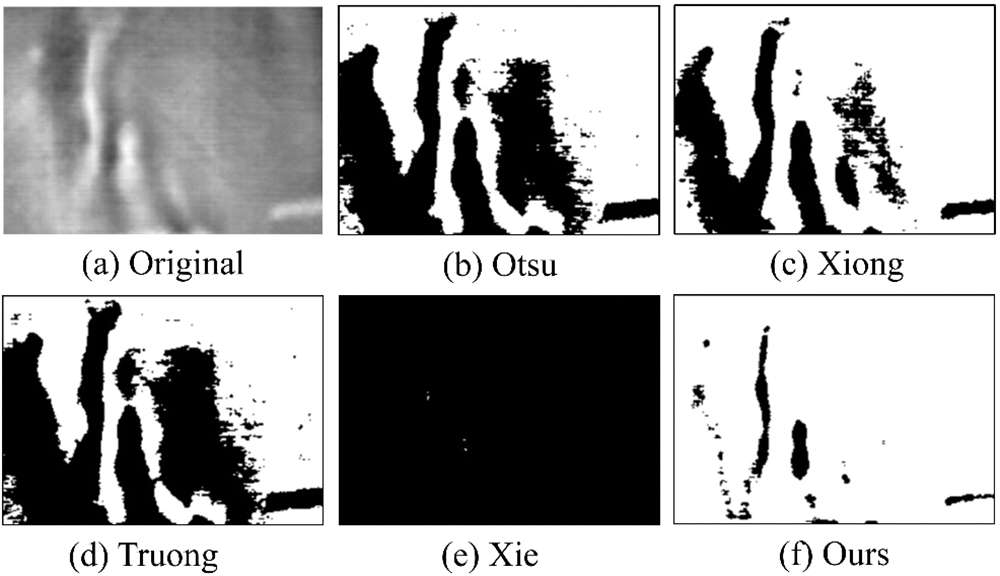
Figure 8: WTB wrinkle detection results (a) Original. (b) Otsu. (c) Xiong. (d) Truong. (e) Xie. (f) Ours
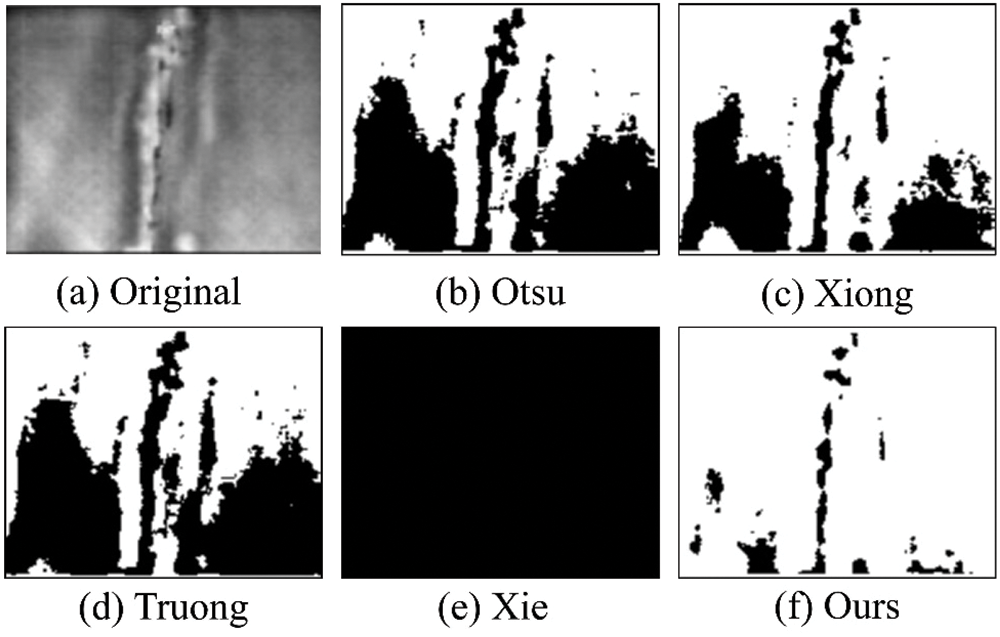
Figure 9: WTB crack detection results (a) Original. (b) Otsu. (c) Xiong. (d) Truong. (e) Xie. (f) Ours
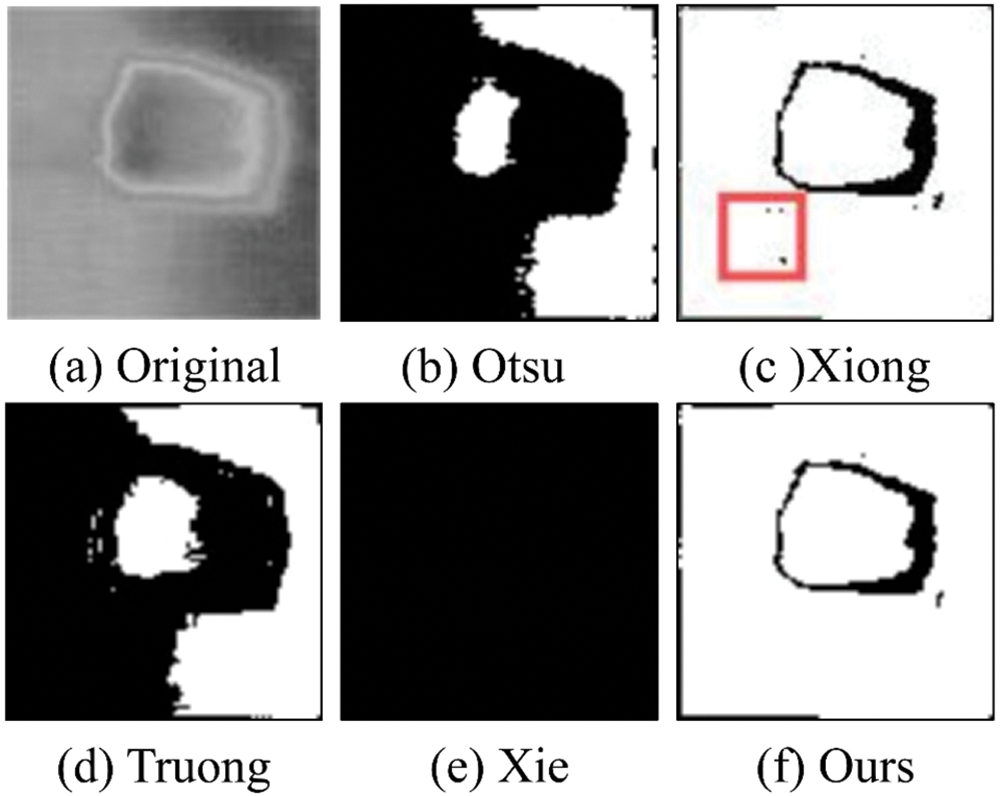
Figure 10: WTB bubble detection results (a) Original. (b) Otsu. (c) Xiong. (d) Truong. (e) Xie. (f) Ours
From Fig. 7, it can be observed that due to the low contrast between the cracks and the background as well as the presence of uneven brightness, all three comparison methods resulted in the cracks blending with the background, failing to effectively detect the crack defects. Fig. 7e is particularly inapplicable, completely failing to detect any defects. In contrast, the method proposed in this paper can effectively segment the cracks and avoid the issue of uneven brightness. However, due to the small difference in grayscale values between the upper part of the crack and the background, it is difficult for the algorithm to distinguish effectively. Although this issue affects the performance of the method under specific circumstances, our approach still demonstrates good overall performance in most standard tests.
In Figs. 8 and 9, in scenarios where there is a high contrast between leaf defects and their background, the first three detection methods are all capable of identifying defects. However, these methods retain excessive background pixels in their detection results. Notably, Figs. 8e and 9e still fail to achieve effective defect detection. Compared to the other four detection techniques, the enhanced Otsu algorithm proposed in this study demonstrates superior performance in detecting WTB defects.
In Fig. 10, due to the high brightness of the background area on the left side of the original image, the algorithms in Fig. 10b,d only barely reveal the bubble contours, and their detection performance is extremely poor; the algorithm in Fig. 10e fails to detect the bubble defects. The algorithm in Fig. 10c detected the bubble defects’ contours well but included some false noise points within the red rectangular box compared to our method; the algorithm in Fig. 10f. Our method clearly detected the bubble contours without including noise points.
This study employs the Average Hausdorff Distance (ADH), Defect Segmentation Rate (DSR), Misclassification Error (ME) and structural similarity (SSIM) as evaluation metrics to objectively assess the performance of the proposed algorithm. Unlike other metrics based on confusion matrices, the Hausdorff Distance (HD) is a spatial distance-based metric. HD measures the distance between actual and predicted segmentations by focusing on contour similarity. Since HD is sensitive to outliers, most applications use the Average Hausdorff Distance. The defect segmentation rate quantifies the effectiveness of segmenting defect areas, with values ranging from 0 to 1; higher values indicate better detection performance. The higher the misclassification error, the worse the detection performance. If the ME value is 1, it means that no defects were detected, whereas an ME value of 0 indicates excellent detection performance. In the table, bold values represent the best metric values.
4.3.1 Average Hausdorff Distance
The Average Hausdorff Distance is a method for measuring the greater value between the directed Hausdorff Distance
where,

4.3.2 Defect Segmentation Rate and Misclassification Error
The defect segmentation rate [25] is a key metric for evaluating the performance of an algorithm, primarily used to measure the accuracy of the algorithm in identifying and locating defect areas. The DSR assesses detection effectiveness by comparing the overlap between the defect areas detected by the algorithm and the actual defect areas. The calculation formula is as follows:
The misclassification error [29] represents the percentage of target pixels incorrectly classified as background pixels or background pixels incorrectly classified as target pixels. Its mathematical expression is as follows:
where,
SSIM [30] is the primary metric used to evaluate the similarity between an original defect image and a detected image. Its value ranges from 0 to 1, with a value of 1 indicating that the two images are identical, and a value of 0 indicating no similarity between the two images. The expression for SSIM is defined as follows:
where,
Table 1 provides a detailed comparison of the performance of five different algorithms, including Otsu, Xiong, Truong, Xie, and our proposed algorithm, in detecting defects in WTB infrared thermal images. The evaluation metrics cover five key aspects: AHE, DSR, ME, SSIM, and runtime. Among these metrics, our method significantly outperforms the others in four major performance indicators: AHE, DSR, ME, and SSIM. Specifically, the AHE value is only 0.825, indicating the smallest average deviation between the segmentation results and the actual targets; the DSR value is as high as 0.975, indicating a very high detection success rate; and the ME value is 0.017, indicating very few misclassifications.
Regarding the ME metric, our method achieved an 88.03% reduction compared to the Xiong method, representing a significant improvement. In terms of the SSIM metric, our method also performed best, reaching 0.571, which is a 33.41% improvement over the Xiong method. In terms of runtime, our method achieved a time of 0.984 s, faster than all compared methods except the Truong method. Although the Truong method has a shorter runtime, its results are far inferior to ours. Overall, our proposed method significantly improves the accuracy and robustness of defect detection while maintaining a high processing speed, reducing misclassifications, and demonstrating clear advantages and potential applications in the field of WTB infrared thermal image defect detection.
To address the common issues of uneven brightness and blurred edges in infrared images of WTBs, this study utilizes a differential multi-scale morphological enhancement operator to significantly improve the contrast of defect areas and make defect edges clearer. Subsequently, grayscale inversion processing is performed to adapt to the detection algorithm proposed in this study. On this basis, an improved Otsu algorithm is used to detect defects in infrared images of WTBs. Experimental results verify that this algorithm effectively overcomes the high false detection rate problem of the traditional Otsu algorithm in infrared image detection, significantly improving the accuracy and reliability of detection.
This method, with its efficient and accurate characteristics, shows broad application prospects. With continuous optimization of technology and improvement of computing power, this technology will be able to identify small defects in WTBs more quickly and accurately in the future, achieving early intervention and reducing potential failure risks. At the same time, this technology will make breakthroughs in intelligence and automation, combining artificial intelligence and machine learning technologies to achieve automation and intelligence in the defect detection process, reducing the need for manual operation and providing more stable and reliable detection results.
Acknowledgement: The authors would like to express his sincere gratitude to all the anonymous reviewers and the editorial team for their valuable comments and suggestions.
Funding Statement: This work was supported by Natural Science Foundation of Jilin Province (YDZJ202401352ZYTS).
Author Contributions: Shuang Kang, as the first author, elucidated the core concepts of the article and managed the writing process. Yinchao He, the second author, conducted the experiments, created the figures, and contributed to the writing of the article. Wenwen Li, the third author, was responsible for collecting and organizing the data. Sen Liu, as the fourth author, provided important suggestions and feedback. All authors reviewed the results and approved the final version of the manuscript.
Availability of Data and Materials: The data that support the findings of this study are available from the corresponding author Wenwen Li upon reasonable request.
Ethics Approval: Not applicable.
Conflicts of Interest: The authors declare that they have no conflicts of interest to report regarding the present study.
References
1. S. Ding, C. Yang, and S. Zhang, “Acoustic-signal-based damage detection of wind turbine blades—a review,” Sensors, vol. 23, no. 11, May 2023, Art. no. 4987. doi: 10.3390/s23114987. [Google Scholar] [PubMed] [CrossRef]
2. N. Zhang, W. Bian, and B. Pan, “The application of ultrasonic phased array technology in wind turbine blade defect detection system,” IOP Conf. Ser.: Earth Environ. Sci., vol. 675, no. 1, Feb. 2021, Art. no. 12077. doi: 10.1088/1755-1315/675/1/012077. [Google Scholar] [CrossRef]
3. M. Leon et al., “Leading edge erosion of wind turbine blades: Understanding, prevention and protection,” Renew. Energy, vol. 169, pp. 953–969, May 2021. doi: 10.1016/J.RENENE.2021.01.044. [Google Scholar] [CrossRef]
4. Y. Du, S. Zhou, X. Jing, Y. Peng, H. Wu and N. Kwok, “Damage detection techniques for wind turbine blades: A review,” Mech. Syst. Signal. Process., vol. 141, Jul. 2020, Art. no. 106445. doi: 10.1016/j.ymssp.2019.106445. [Google Scholar] [CrossRef]
5. Y. Liu, W. Gao, T. Zhao, Z. Wang, and Z. Wang, “A rapid bridge crack detection method based on deep learning,” Appl. Sci., vol. 13, no. 17, Aug. 2023, Art. no. 9878. doi: 10.3390/app13179878. [Google Scholar] [CrossRef]
6. Y. Wu, Q. Han, Q. Jin, J. Li, and Y. Zhang, “LCA-YOLOv8-Seg: An improved lightweight YOLOv8-Seg for real-time pixel-level crack detection of dams and bridges,” Appl. Sci., vol. 13, no. 19, Sep. 2023. doi: 10.3390/app131910583. [Google Scholar] [CrossRef]
7. B. E. Jaeger, S. Schmid, C. U. Grosse, A. Gögelein, and F. Elischberger, “Infrared thermal imaging-based turbine blade crack classification using deep learning,” J. Nondestruct. Eval., vol. 41, no. 4, 2022, Art. no. 74. doi: 10.1007/s10921-022-00907-9. [Google Scholar] [CrossRef]
8. M. F. Rabbi et al., “A novel approach for defect detection of wind turbine blade using virtual reality and deep learning,” The University of Texas at El Paso, USA, 2023. [Google Scholar]
9. L. Deng, S. Liu, W. Shi, and J. Xu, “Defect detection and classification of offshore wind turbine rotor blades,” Nondestruct. Test. Eval., vol. 39, no. 4, pp. 954–975, May 2024. doi: 10.1080/10589759.2023.2234554. [Google Scholar] [CrossRef]
10. K. Masita, A. Hasan, and T. Shongwe, “Defects detection on 110 MW AC wind farm’s turbine generator blades using drone-based laser and RGB images with Res-CNN3 detector,” Appl. Sci., vol. 13, no. 24, Dec. 2023, Art. no. 13046. doi: 10.3390/app132413046. [Google Scholar] [CrossRef]
11. Z. Qiu, S. Wang, Z. Zeng, and D. Yu, “Automatic visual defects inspection of wind turbine blades via YOLO-based small object detection approach,” J. Electron. Imag., vol. 28, no. 4, Jul. 2019, Art. no. 043023. doi: 10.1117/1.JEI.28.4.043023. [Google Scholar] [CrossRef]
12. V. K. Mishra, R. Kumar, U. Nareti, T. Pant, and P. K. Soni, “Pansharpening using IHS method on multi-sensor data and multiple feature extraction using modified Otsu thresholding,” J. Indian Soc. Remote Sens., vol. 52, no. 1, pp. 139–151, Jan. 2024. doi: 10.1007/s12524-023-01806-w. [Google Scholar] [CrossRef]
13. D. Hu, P. Qiu, J. Zhou, and B. Li, “Gap detection of vernier caliper based on improved Otsu algorithm,” (in Chinese), Mach. Tools Hydraul., vol. 50, no. 14, pp. 8–13, 2022. [Google Scholar]
14. M. T. N. Truong and S. Kim, “Automatic image thresholding using Otsu’s method and entropy weighting scheme for surface defect detection,” Soft Comput., vol. 22, no. 13, pp. 4197–4203, Jul. 2018. doi: 10.1007/s00500-017-2709-1. [Google Scholar] [CrossRef]
15. Q. Xie, W. Zhou, L. Ma, Z. Chen, W. Wu and X. Wang, “Improved whale optimization algorithm for 2D-Otsu image segmentation with application in steel plate surface defects segmentation,” Signal Image Video Process., vol. 17, no. 4, pp. 1653–1659, 2023. doi: 10.1007/s11760-022-02375-0. [Google Scholar] [CrossRef]
16. S. Kang, C. Chen, S. Zhao, Y. Luo, and X. Kong, “Study on infrared image enhancement of wind turbine blades based on adaptive differential multiscale morphology (ADMM),” (in Chinese), Chinese Mech. Eng., vol. 32, no. 7, pp. 786–792, 2021. doi: 10.3969/i.issn.1004-132X.2021.07.004. [Google Scholar] [CrossRef]
17. S. Kang, C. Chen, S. Liu, B. Zhou, and W. Tang, “Study on defect detection of morphological infrared images based on optimal multiscale set,” J. Sol. Energy, vol. 43, no. 6, pp. 145–152, Jun. 2022. doi: 10.19912/i.0254-0096.tynxb.2022-0051. [Google Scholar] [CrossRef]
18. Y. He, S. Kang, W. Li, H. Xu, and S. Liu, “Advanced enhancement technique for infrared images of wind turbine blades utilizing adaptive difference multi-scale top-hat transformation,” Sci. Rep., vol. 14, no. 1, Jul. 2024, Art. no. 15604. doi: 10.1038/s41598-024-66423-0. [Google Scholar] [PubMed] [CrossRef]
19. Y. Li, G. Li, Y. Yang, X. Liang, and M. Xu, “A fault diagnosis scheme for planetary gearboxes using adaptive multi-scale morphology filter and modified hierarchical permutation entropy,” Mech. Syst. Signal. Process., vol. 105, no. 1, pp. 319–337, May 2018. doi: 10.1016/j.ymssp.2017.12.008. [Google Scholar] [CrossRef]
20. B. Li, P. Zhang, Z. Wang, S. Mi, and D. Liu, “A weighted multi-scale morphological gradient filter for rolling element bearing fault detection,” ISA Trans., vol. 50, no. 4, pp. 599–608, Oct. 2011. doi: 10.1016/j.isatra.2011.06.003. [Google Scholar] [PubMed] [CrossRef]
21. J. Lv and J. Yu, “Average combination difference morphological filters for fault feature extraction of bearing,” Mech. Syst. Signal. Process., vol. 100, no. 5, pp. 827–845, Feb. 2018. doi: 10.1016/j.ymssp.2017.08.020. [Google Scholar] [CrossRef]
22. X. Yan, M. Jia, W. Zhang, and L. Zhu, “Fault diagnosis of rolling element bearing using a new optimal scale morphology analysis method,” ISA Trans., vol. 73, no. 7, pp. 165–180, Feb. 2018. doi: 10.1016/j.isatra.2018.01.004. [Google Scholar] [PubMed] [CrossRef]
23. B. Li, P. Zhang, Z. Wang, S. Mi, and Y. Zhang, “Gear fault detection using multi-scale morphological filters,” Measurement, vol. 44, no. 10, pp. 2078–2089, Dec. 2011. doi: 10.1016/j.measurement.2011.08.010. [Google Scholar] [CrossRef]
24. J. C. M. Roman, J. L. V. Noguera, H. Legal-Ayala, D. P. Pinto-Roa, S. Gomez-Guerrero and M. G. Torres, “Entropy and contrast enhancement of infrared thermal images using the multiscale top-hat transform,” Entropy, vol. 21, no. 3, Mar. 2019, Art. no. 244. doi: 10.3390/e21030244. [Google Scholar] [PubMed] [CrossRef]
25. X. Guan, L. He, M. Li, and F. Li, “Entropy based data expansion method for blind image quality assessment,” Entropy, vol. 22, no. 1, 2020, Art. no. 60. doi: 10.3390/e22010060. [Google Scholar] [PubMed] [CrossRef]
26. Q. Fan, Y. Ma, P. Wang, and F. Bai, “Otsu image segmentation based on a fractional order moth-flame optimization algorithm,” Fractal Fract., vol. 8, no. 2, Jan. 2024, Art. no. 87. doi: 10.3390/fractalfract8020087. [Google Scholar] [CrossRef]
27. L. Yang, “A review of threshold-based image segmentation algorithms: Principles, classification and typical algorithms,” (in Chinese), J. Shenyang Norm. Univ. (Nat. Sci. Ed.), vol. 41, no. 6, pp. 526–529, 2023. doi: 10.3969/j.issn.1673-5862.2023.06.007. [Google Scholar] [CrossRef]
28. L. Xiong, Q. Qian, and S. Zhang, “Bridge crack detection method based on improved Otsu,” Semicond. Optoelectron., vol. 44, no. 6, pp. 965–971, Dec. 2023. doi: 10.16818/i.issn1001-5868.2023080101. [Google Scholar] [CrossRef]
29. Y. Guo and A. Şengür, “A novel image segmentation algorithm based on neutrosophic similarity clustering,” Appl. Soft Comput., vol. 25, no. 9, pp. 391–398, Dec. 2014. doi: 10.1016/j.asoc.2014.08.066. [Google Scholar] [CrossRef]
30. S. I. Alshathri, D. J. Vincent, and V. S. Hari, “Denoising letter images from scanned invoices using stacked autoencoders,” Comput. Mater. Contin., vol. 71, no. 1, pp. 1371–1386, Apr. 2022. doi: 10.32604/cmc.2022.022458. [Google Scholar] [CrossRef]
Cite This Article
 Copyright © 2024 The Author(s). Published by Tech Science Press.
This work is licensed under a Creative Commons Attribution 4.0 International License , which permits unrestricted use, distribution, and reproduction in any medium, provided the original work is properly cited.


 Submit a Paper
 Propose a Special lssue
 View Full Text
 Download PDF
 Downloads
 Citation Tools