
 Submit a Paper
 Propose a Special lssue
 Open Access
ARTICLE

Stroke Electroencephalogram Data Synthesizing through Progressive Efficient Self-Attention Generative Adversarial Network
College of Electronic Information Engineering, Taiyuan University of Technology, Taiyuan, 030024, China
* Corresponding Author: Suzhe Wang. Email:
Computers, Materials & Continua 2024, 81(1), 1177-1196. https://doi.org/10.32604/cmc.2024.056016
Received 12 July 2024; Accepted 09 September 2024; Issue published 15 October 2024
 View Full Text
 Download PDF
Abstract
Early and timely diagnosis of stroke is critical for effective treatment, and the electroencephalogram (EEG) offers a low-cost, non-invasive solution. However, the shortage of high-quality patient EEG data often hampers the accuracy of diagnostic classification methods based on deep learning. To address this issue, our study designed a deep data amplification model named Progressive Conditional Generative Adversarial Network with Efficient Approximating Self Attention (PCGAN-EASA), which incrementally improves the quality of generated EEG features. This network can yield full-scale, fine-grained EEG features from the low-scale, coarse ones. Specially, to overcome the limitations of traditional generative models that fail to generate features tailored to individual patient characteristics, we developed an encoder with an effective approximating self-attention mechanism. This encoder not only automatically extracts relevant features across different patients but also reduces the computational resource consumption. Furthermore, the adversarial loss and reconstruction loss functions were redesigned to better align with the training characteristics of the network and the spatial correlations among electrodes. Extensive experimental results demonstrate that PCGAN-EASA provides the highest generation quality and the lowest computational resource usage compared to several existing approaches. Additionally, it significantly improves the accuracy of subsequent stroke classification tasks.Keywords
Stroke is a serious condition resulting from the sudden rupture or obstruction of brain vessels within a few hours, leading to high rates of mortality and disability. It is mainly categorized into two classes: ischemic stroke and hemorrhagic stroke, with ischemic stroke accounting for over 70% of cases [1–3]. Therefore, it is necessary to diagnose stroke early for the patient. Electroencephalography (EEG) is an effective solution which could capture the electrical interactions among brain cells, offering valuable insight into neuronal activity [4]. This signal pattern is non-invasive and cost-effective, providing abundant data on brain functions and diseases.
Researchers have adopted various machine learning methods for this type of medical signal to extract nonlinear and high-dimensional features, among which deep learning methods are particularly famous [5–7]. The deep features of the extensive data could contribute to a more comprehensive understanding and diagnosis of neurological conditions. Therefore, they not only improve stroke diagnosis and classification performance but also advance neuroscience research. However, the collection and preprocessing of EEG data are labor-intensive and time-consuming [8], which hinders the training data provision. Moreover, data sharing between hospitals is another obstacle for data supply. Thirdly, the low proportion of stroke patient EEG data will lead to an unbalanced dataset and a decline in the learning ability of the deep model. Therefore, these issues slow down the development of intelligent-driven aided diagnosis technologies and fail to reduce the workload of doctors effectively.
Over the past decades, several studies have explored methods to generate medical data. One common approach involves geometric transformations [9]. But it is important to note that these transformed EEG features may not be inherently compatible with the original ones, as they can alter the internal time domain characteristics. Another method introduces noise into the training data [10]. However, unlike images, this technique can amplify the noise in the EEG, leading to training instability. A third approach is oversampling the minority class. Yet, the data obtained by resampling is prone to overfitting.
Lately, Generative Adversarial Networks (GANs) have become increasingly more effective for medical data generation. This deep generative model is proposed by Goodfellow et al. [11], creates novel data by data sampling. Regarding data augmentation, some researchers have studied different GANs for biological signal [12]. Although these methods can compensate for the shortage of training data and reduce category imbalance, the generated quality still needs to be improved to support high diagnosis precision. Despite the recent success of attention architecture such as Transformer, which has improved the results of many generative tasks, its optimal configurations for the EEG domain and GANs have not been fully explored. Therefore, the shortcomings of these studies can be summarized as follows:
• Existing literatures lack research on high quality EEG features generation.
• The additional attention mechanism will increase the computational complexity of the deep model when the input feature dimensions increase.
• Limited literatures are presented on the loss function design of across layers and EEG spatial domain.
To address these challenges, we present a progressive GAN framework with efficient approximating self-attention (PCGAN-EASA), designed to incrementally improve generation quality while reducing the overall computational intensity of the model. The primary novelties of this research are summarized as:
• A dual-layer auto-encoding conditional GAN framework is proposed to enhance the representation capability of EEG features across different scales. This structure captures and generates features of stroke EEG from coarse to fine, producing high quality across different scales.
• A lightweight linear effective attention module based on deep sampling approximation is employed in the encoding network. This module automatically extracts style constraint information from each patient’s features while simplifying the computational intensity.
• In the design of the loss function, the cross-layer information is considered to compensate for the information degradation during the generation process. In addition, by introducing EEG spatial information reconstruction loss, the values at the electrodes are more natural and consistent.
Unbalanced EEG data often result in overfitting and low prediction accuracy when predicting strokes. In recent years, deep generative models based on GAN have brought fresh perspectives for EEG data augmentation [13–15]. In one of the earliest studies, Abdelfattah et al. [16] utilized GANs to augment the limited EEG Motor imagery dataset, embedding a Recurrent Neural Network (RNN) into the discriminator to capture the time dependencies. Similarly, Pascual et al. [17] employed a GAN-based strategy to generate more realistic epilepsy EEG data, enabling the model to transform ictal seizure samples into comparatively refined signals. To elevate the quality of the generated EEG, Kadri et al. [18] utilized an adapted form of the Deep Convolutional Generative Adversarial Networks (DCGAN) architecture, where fully connected layers and techniques such as batch normalization contributed to generating more realistic Alzheimer’s EEG signals. In another study [19], Fahimi et al. adopted the DCGAN framework for brain-computer interface tasks, producing EEG signals that closely resemble the original signals in both features and style.
As GANs have advanced, researchers have increasingly focused on the diversity of generated data styles. One approach is the use of conditional GANs. Zhang et al. [20] used this model to create subject-specific EEG features. Another effective technique is the Wasserstein GAN (WGAN). To address the issue of mode collapse, Bouallegue et al. [21] applied WGAN to gain the classification accuracy of autistic patients by enhancing training datasets. Similarly, Luo et al. [22] introduced the Wasserstein distance GAN (WGAN) with a loss function that integrates spatial and temporal information to reconstruct motor-related EEG data. The EEG data generated by this network significantly improved subsequent classification tasks. Furthermore, to generate high-quality multi-channel EEG data, Panwar et al. [23] employed the Wasserstein GAN with Gradient Penalty (WGAN-GP) architecture with a gradient penalty for data augmentation in affective EEG. Additionally, Zheng et al. [24] introduced three data augmentation techniques rooted in generative approaches to address data scarcity in EEG emotion identification. These methods, namely cWGAN (Conditional Wasserstein GAN), sVAE (Selective VAE), and sWGAN (Selective WGAN), demonstrated superior performance compared to alternatives like cVAE (Conditional VAE) and rotational data augmentation. However, these models need more network layers, which complicates the generation of high-quality EEG signals. Increasing the number of layers in each part of GANs can lead to training instability [25] and produce negligible results.
In recent years, integrating self-attention mechanisms into GAN networks has emerged as an effective approach for enhancing the generation of features with long-distance dependencies [26–28]. Concerning image generation, Tang et al. [29] incorporated a position-aware attention module into the GAN generator to amplify high-frequency features. Similarly, Kuo et al. [30] utilized the self-attention GAN model (SAGAN) to produce more detailed insomnia EEG data samples, significantly improving sleep assessment classification accuracy. In the area of EEG denoising, Yin et al. [31] achieved better performance on error-related metrics by incorporating both Transformer and CNN structures into the GAN generator, capturing both global and local correlations in EEG signals. However, these approaches face the challenge of rapidly increasing module parameters and computational load with growing input dimensions, adding burden to the model.
3.1 PCGAN-EASA Architecture Design
To improve the quality of synthetic EEG features, this study presents a progressive data generation framework named PCGAN-EASA. The architecture of PCGAN-EASA is shown in Fig. 1. This model comprises a dual-layer generative network similar to CGAN [32]. However, it differs in that it does not require a real patient labelfor conditional mode information. Instead, the characteristics of each patient are autonomously extracted via an encoding module. The generating process of the PCGAN-EASA can be split into two main steps, each step contains three sub-steps. We will detail it as follows:
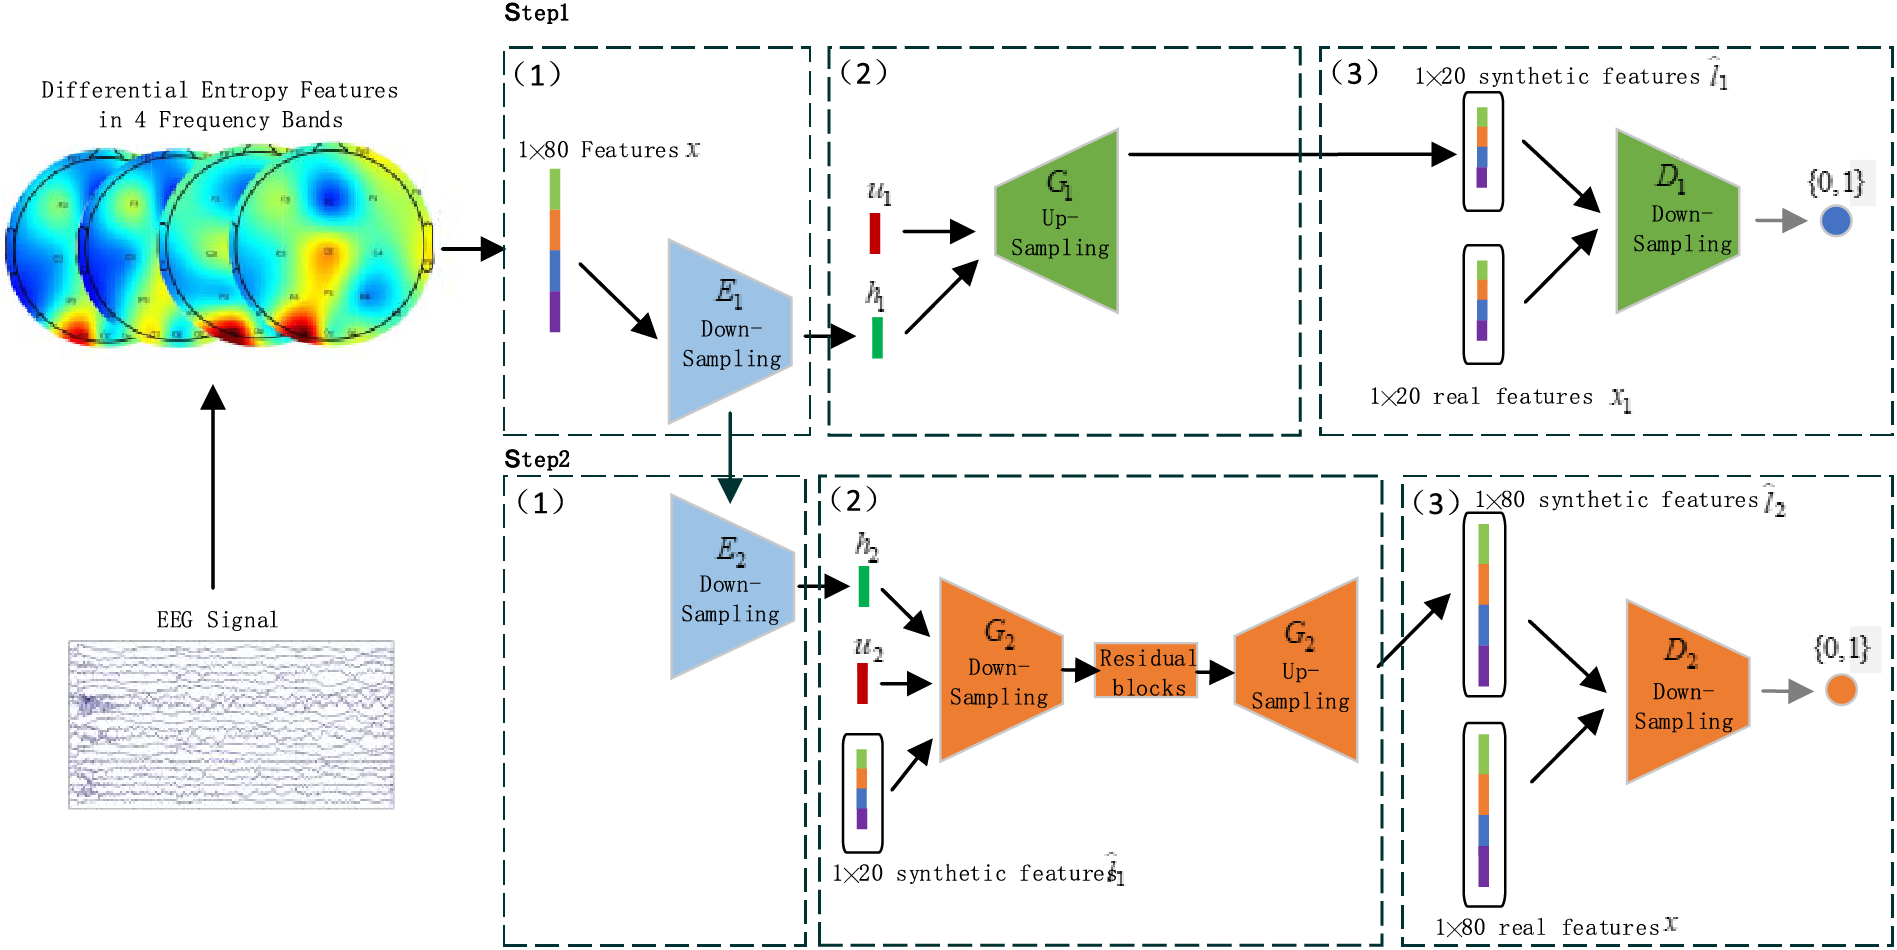
Figure 1: Overview of the PCGAN-EASA method
Step 1: Generation of Skeleton EEG Feature Data.
The first step involves parts
Sub-step 1: Case-specific conditional feature extraction. The EASA encoder
Sub-step 2: Generation of fake features. The generator
Sub-step 3: Discrimination of sample authenticity. The discriminator
Step 2: Improvement of Generated Stroke Data.
This step uses components
3.2 PCGAN-EASA Architecture Design
The PCGAN-EASA model employs two encoders to extract latent style features that closely match the minority class distribution. The extracted conditional vector is smoother and more continuous than traditional one-hot encoding. The construction of the EASA encoder is shown in Fig. 2.
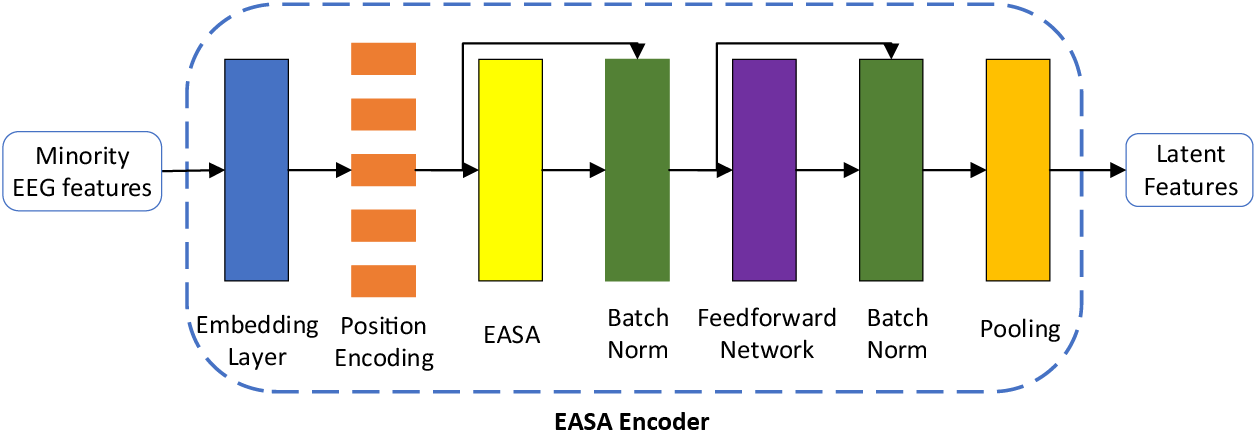
Figure 2: The architecture of the EASA encoder
The embedding layer firstly maps the minority class sample
In the formula,
Next, the vector
Next, we apply a residual connection and layer normalization for
3.2.1 Efficient Approximating Self-Attention Mechanism
This section elaborates on the Efficient Approximating Self-Attention mechanism. Traditional attention models divide input features into multiple groups, calculate the weight for each group, and average these weights to synthesize an aggregate feature representation. Scaled Dot-Product Attention (SDA) is a well-known implementation of this technique, as detailed in the Reference [35]. SDA calculates the similarity between pairs of feature vectors using the dot product, then uses this similarity as the weight for averaging. The fundamental formula is presented as (3).
In Eq. (3), the extent of the series
By incorporating the explicit equation of the softmax function into Eq. (3), we can reformulate the equation as follows:
Here, the term
We aim to improve SDA by introducing an Efficient Approximating Self-Attention Mechanism (EASA), which reduces computational complexity to
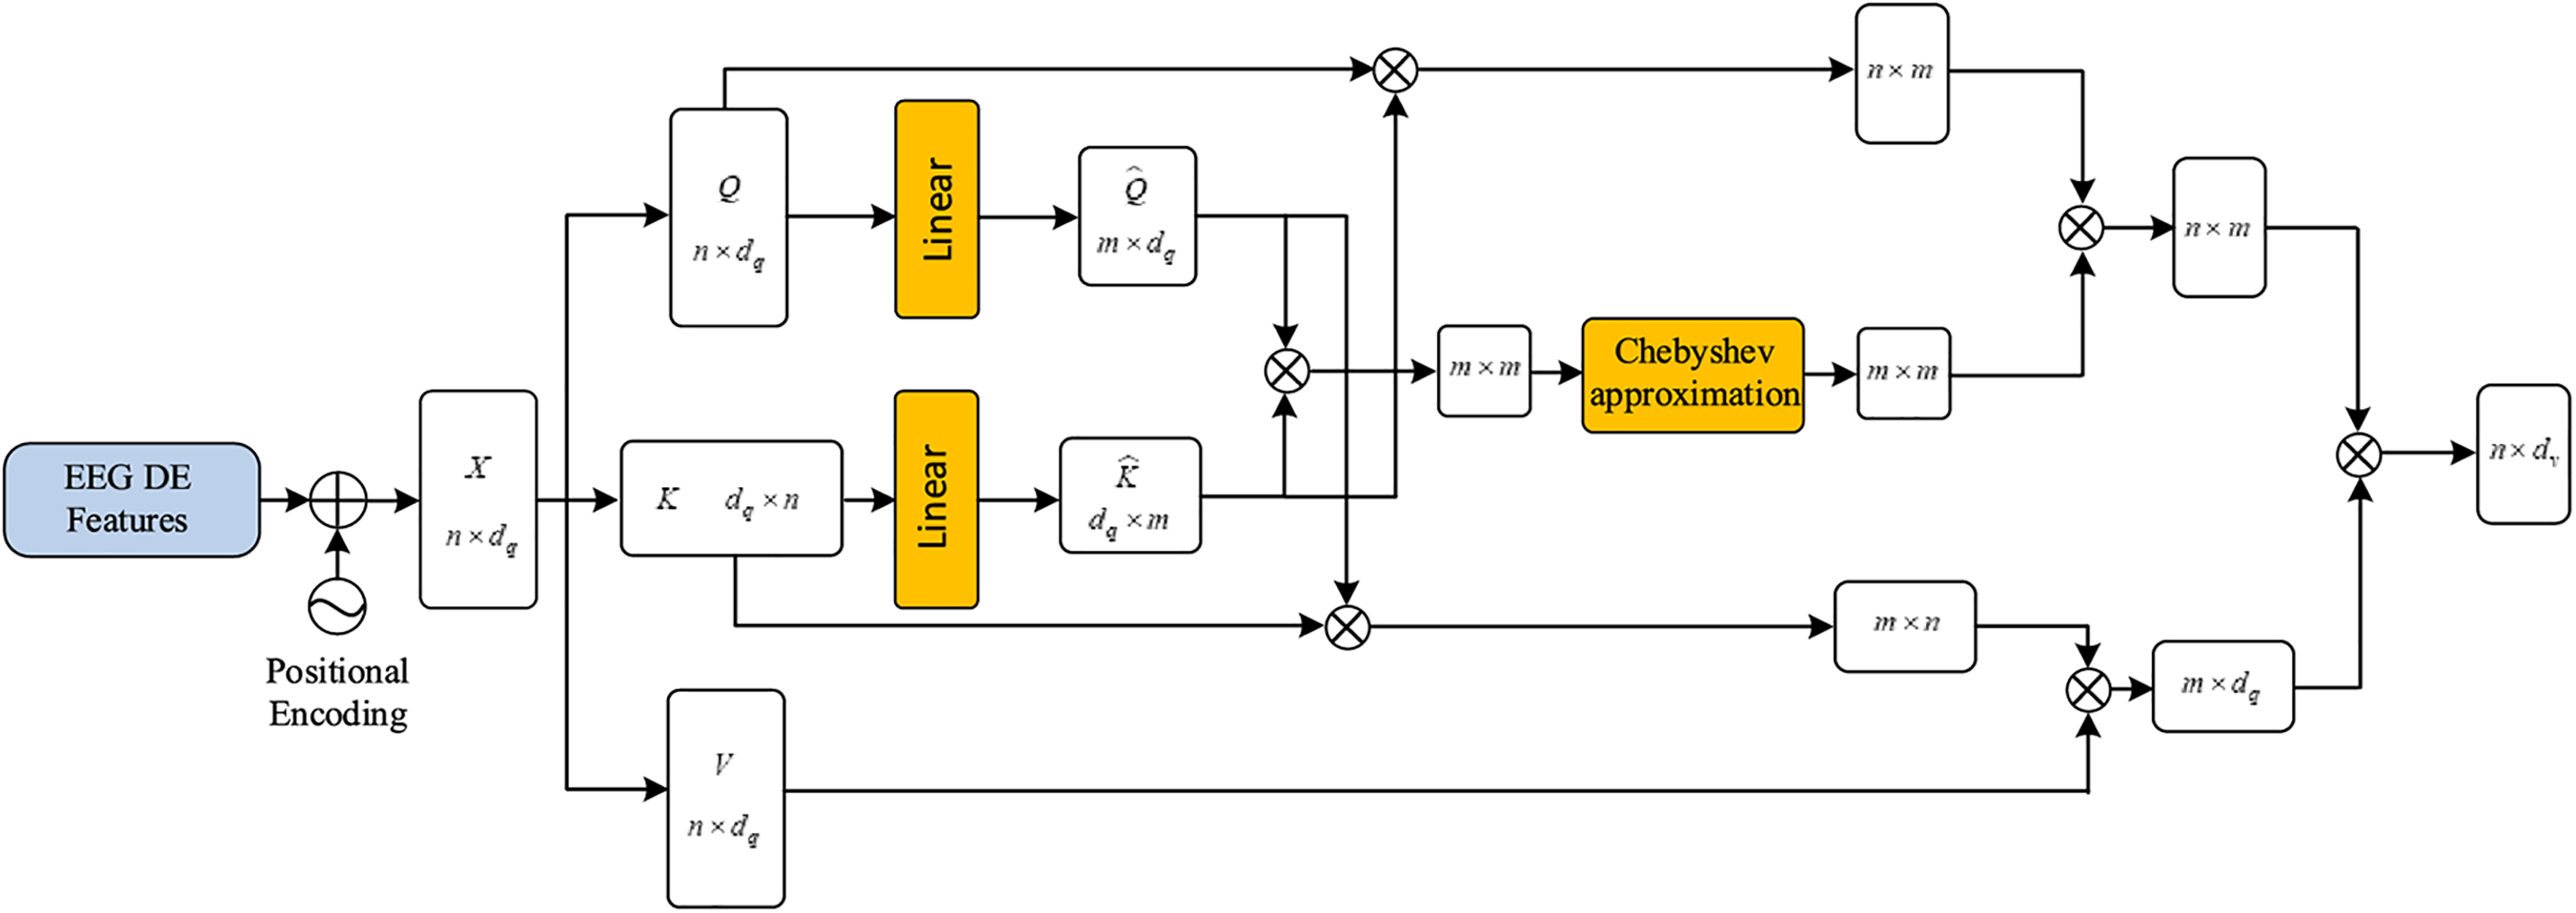
Figure 3: Illustration of the efficient approximating self-attention (EASA) mechanism
Initially, the EASA module adopts the Nyström approximation concept. The classic Nyström approximation algorithm [36] commonly treats the term
In the formula, the
Then matrix
In the equation,
Based on this decomposition approach, to ensure that the dimensions of the decomposed
In the expression, FC stands for a fully connection process. The acquisition of the landmark matrix
According to the block matrix
To compute the Moore-Penrose pseudoinverse
Subsequently, we will prove that
Theorem 1. For the matrix
Proof of Theorem 1.
For any non-singular matrix
Subsequently, the difference
Subsequently, the
Because
Finally, the proof is completed.
By approximating
We will now analyze the time complexity of the EASA mechanism. The algorithm’s total complexity primarily includes the computation of the pseudoinverse and matrix multiplication. The peak complexity for the iterative approximation of the Moore-Penrose pseudoinverse is
Apart from the EASA attention module, the computations in PCGAN-EASA model occur in fully connected and convolutional layers. For the
For the
Finally, the time complexity of the PCGAN-EASA is:
The loss function for the PCGAN-EASA model
In this equation,
The adversarial loss part
Here,
In the second step, the coarse-grained stroke features
Moreover, to enhance the detail in the EEG feature generation, a reconstruction loss term
where
Given the inherent correlation among EEG signals from adjacent electrodes, we divide the generated and real data within the training batch into four segments to calculate the Pearson correlation coefficient. Four segments were found to be optimal through experimentation. The improved Charbonnier loss function is then obtained as follows:
where
Additionally, to ensure smoother generated feature signals, we combine the modified Charbonnier loss with the MSE loss function, and describe the reconstruction part
Here,
The validation of the PCGAN-EASA model involved two primary stages. First, during the ablation study phase, we fine-tuned the EASA layers number in the encoder to determine the optimal structural configuration. Following this, the efficacy of the EASA encoder was benchmarked against other established attention mechanisms, highlighting its unique advantages and efficiency. To address the issue of data insufficiency, particularly in minority stroke case classification tasks, we employed a multi-faceted evaluation approach. This approach included generating additional training instances using various generative adversarial network (GAN) architectures and testing with different quantities and proportions of synthetic data to assess performance improvement after data augmentation comprehensively.
The study utilized the EEG data collected from the Neurology Department of Shanxi Provincial People’s Hospital, China. There are 204 participants, with 106 males and 98 females, aged between 29 and 73 years old.
Under the supervision of the ethics committee, the data were utterly anonymized before training. All participants were informed about the purpose and scope of data usage, and the synthetic data were only used for the diagnosing the stroke-related diseases. During the recording, the psychological states of the participants were closely paid attention to avoid any potential negative impacts.
All participants initially lay supine in a quiet room. After a 5-min relaxation, which established a baseline EEG, the participants were instructed to close their eyes for a 10-min recording. Every 3 min, they were asked to open their eyes and rest for 20 s to maintain focus. Each participant was recorded for at least half an hour.
The EEG signals were sampled at a frequency of 500 Hz using 20 electrodes. The original data was divided into multiple 60-s segments, resulting in a total of 4444 samples, with 1034 from acute ischemic stroke patients and 3410 from healthy individuals. The dataset had a degree of imbalance of 1:3.3. To enhance the quality of the EEG samples, several preprocessing methods were applied, including electrode localization, noise reduction, and artifact removal. Differential entropy features were extracted from the
To comprehensively evaluate the quality of the synthetic EEG features, we employed five metrics: Mean Correlation Coefficient (MCC), Root Mean Square Error (RMSE), Mean Absolute Error (MAE), Peak Signal-to-Noise Ratio (PSNR), and Structural Similarity Index Measure (SSIM) [39]. Additionally, the model’s complexity and memory demands were quantified using the number of parameters (Params) and Floating Point Operations Per Second (FLOPs) [40]. For assessing the performance of subsequent stroke classification tasks, a series of evaluation metrics were used, including Accuracy (Acc), Sensitivity (Se), Specificity (Sp), F1 score (F1), and Geometric Mean (G-mean, Gm).
4.3 Experimental Environment and Parameter Configuration
During the PCGAN-EASA training process, the dataset was divided into training, validation, and testing sets in a ratio of 8:1:1. The Nadam optimizer was used for parameter updates, with a learning rate of 0.0001. Training was conducted with a batch size of 64 over 200 epochs.
The hardware configuration for the experiment included a computer with a 3.6 GHz Intel 12700 K processor, 32 GB of memory, and a GeForce RTX 3090 graphics card. The software environment consisted of Windows 10 OS, with Python 3.8 and TensorFlow used for model development. To ensure consistency in the results, each experimental method was executed five times, and the average outcome of these repetitions was recorded as the final result.
4.4.1 The Layers Number in EASA Encoding
In the PCGAN-EASA architecture, the encoder plays a crucial role in capturing the case-specific style from the input EEG data. The depth of the EASA affects the complexity and detail of the information it captures. Therefore, the study focused on the impact of varying the number of EASA layers in the encoder on the quality of synthetic EEG features. The number of layers was adjusted from 1 to 5, and the results of these adjustments are quantitatively presented in Table 1.

It was observed that the metrics for feature generation consistently improved as the number of EASA layers increased from one. The optimal generation quality was achieved with a three-layer EASA, where MCC and SSIM peaked at 91.64 and 91.26, respectively. However, further increasing the number of layers resulted in a noticeable decline in the quality of EEG feature generation. This decline is attributed to overfitting, which arises from the increased complexity and computational cost of the model. In summary, appropriately selecting the number of attention encoding layers increases PCGAN-EASA’s learning and representation capabilities, allowing it to extract more representative style information from EEG features. This style of information, through the interaction between the generator and discriminator, helps make the generated EEG features more realistic.
4.4.2 Comparison of Experimental Results Generated by Different Encoders
To further examine the competence of the EASA module, we compared it against the lightweight deep neural network structure MobileNet, the Transformer module incorporating conventional Self-Dot Attention (SDA), and the Linformer module, which implements lightweight, low-rank factorized self-attention. The evaluation metrics included the previously mentioned generation quality indicators, as well as the number of Params and FLOPs of the overall model under different modules to assess computational efficiency. The results, presented in Table 2, show that incorporating attention mechanism modules significantly improved the similarity index of generation effects. Notably, the model with the EASA module achieved an average improvement of approximately 6% over the Transformer and Linformer modules, yielding the best generative performance. Additionally, the EASA module demonstrated a similar trend in improving computational efficiency. For example, the total number of network parameters with EASA is only 48% and 85% of those with SDA and Linformer, respectively, and the computational performance improved by at least 10% compared to the Transformer and Linformer modules.

To further validate the computational efficiency gains provided by the EASA module, we compared the training times across generative models that utilized various encoding modules, under increasing dimensions of EEG feature inputs, ranging from a single
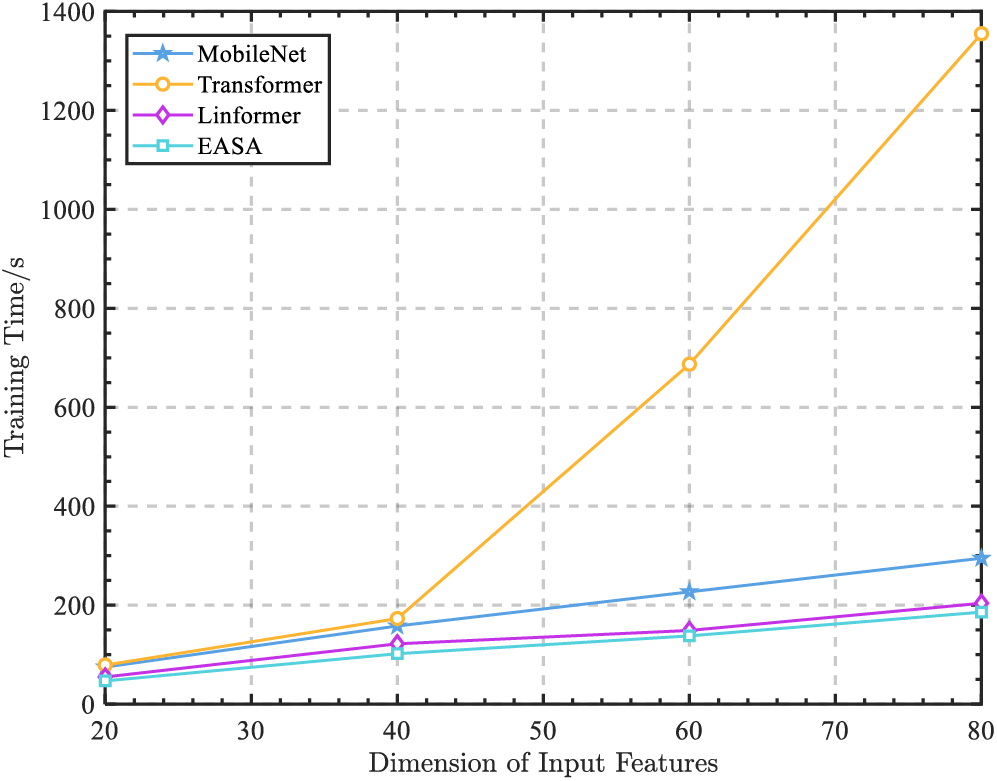
Figure 4: The training time of each encoder with EEG feature dimensions increasing
In Fig. 5, the data from Table 2 is visually represented. The first column of images displays topographic maps illustrating the differential entropy characteristics of EEG across four frequency bands for a stroke patient. The subsequent columns, from the second to the fifth, sequentially show the EEG topographic feature maps generated by the PCGAN-EASA network architecture after integrating various encoding modules. Comparative analysis reveals that without the attention mechanism—specifically when using only MobileNet—there are significant deviations in feature values across multiple frequency bands compared to the original images, particularly in the theta and beta frequency bands. Although integrating attention mechanisms like Transformer and Linformer resulted in feature maps that more closely resemble the original data, considerable differences in feature values remain in certain brain regions, which may adversely affect the accuracy of subsequent disease diagnosis by classifiers. Among all comparisons, the proposed EASA module demonstrated the highest similarity in feature values to the original data across different electrode positions and frequency bands. This indicates a more authentic and natural enhancement effect, further confirming the EASA module’s superior performance in capturing the details of EEG features.
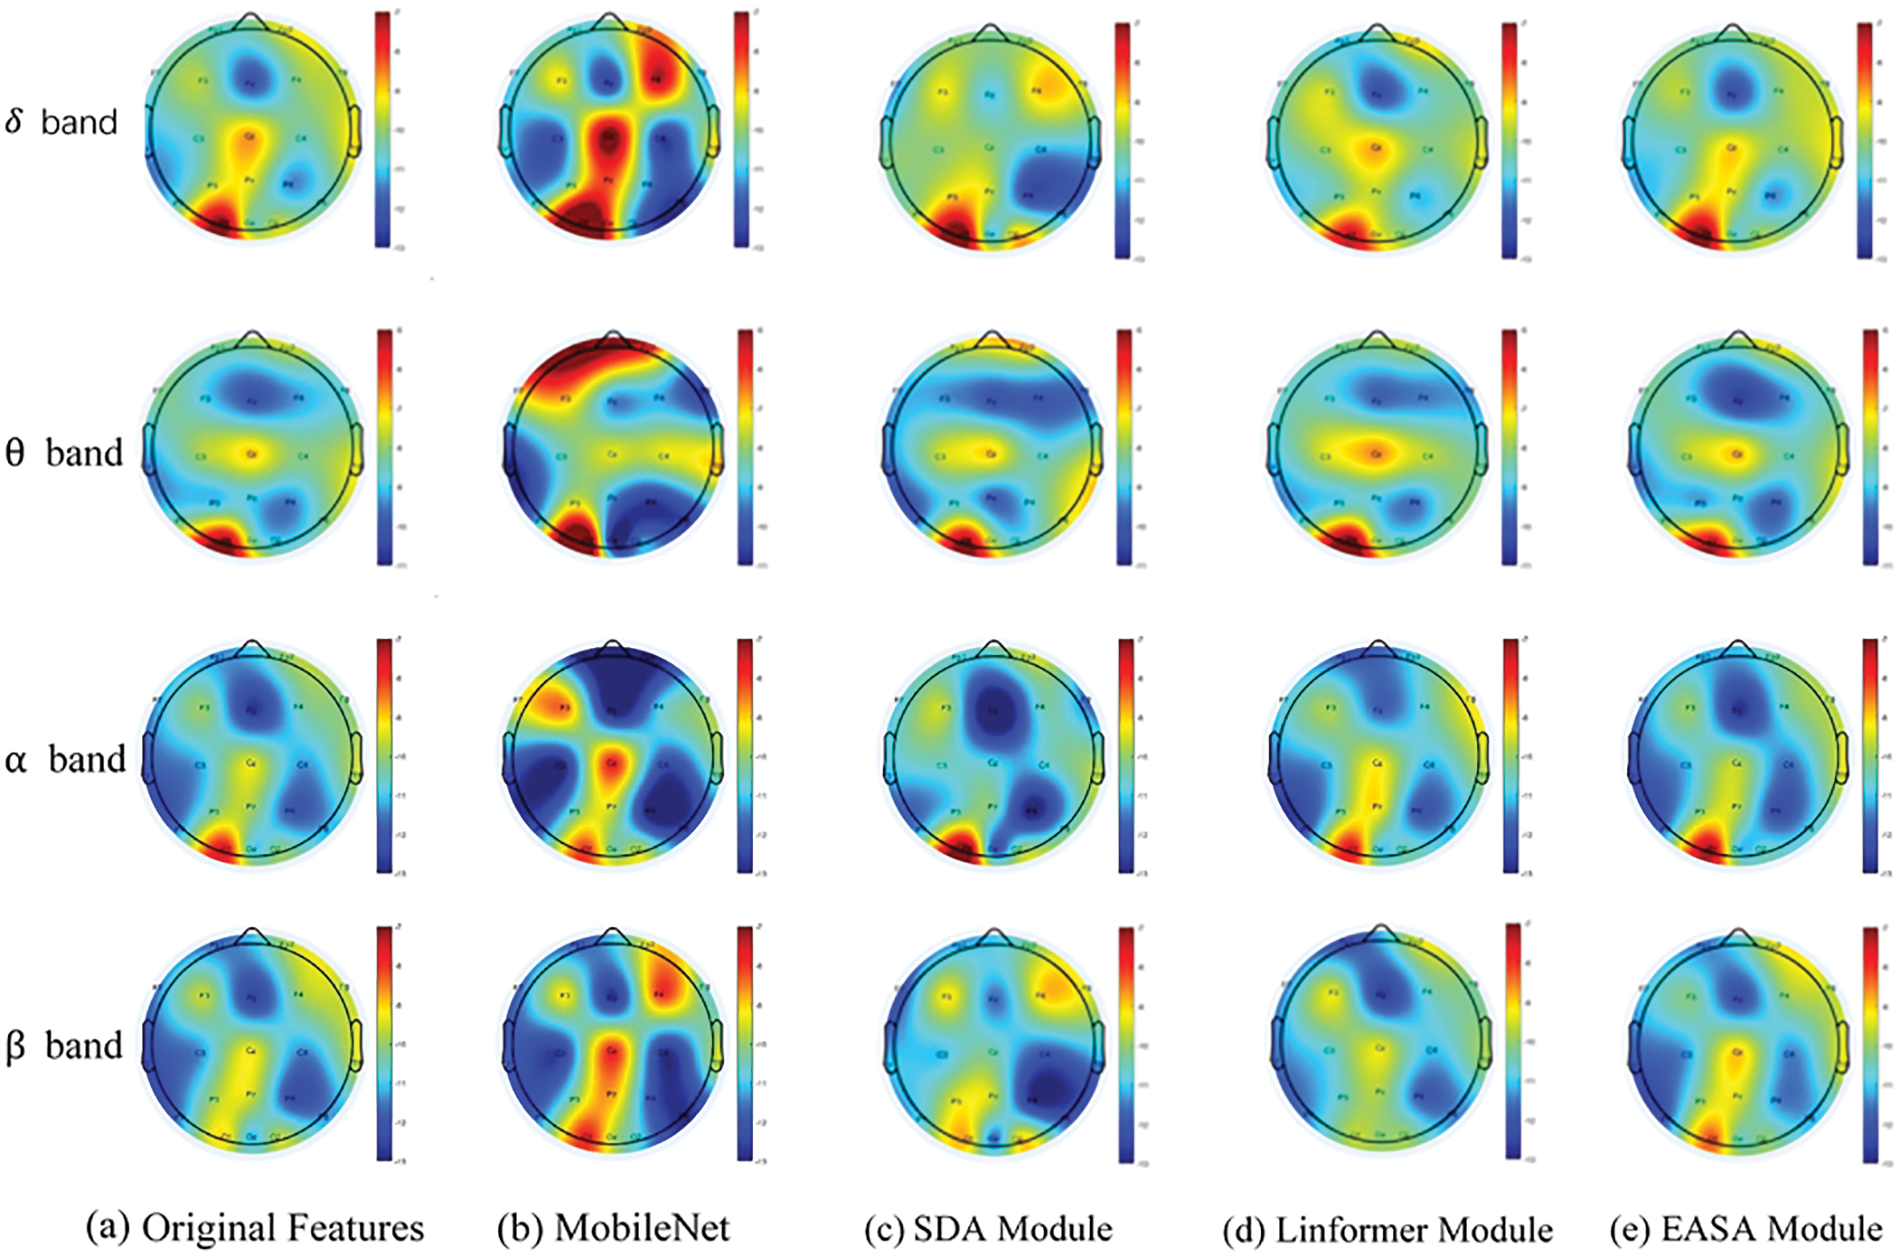
Figure 5: Visualization of EEG feature generation across four frequency bands by different encoding modules
4.4.3 Comparison of Generative Models for Stroke Classification Effectiveness
To quantitatively evaluate the impact of the PCGAN-EASA generative model on enhancing stroke classification efficiency, this study employed a five-fold cross-validation strategy to partition the initial dataset. We utilized a range of standard Generative Adversarial Networks, including DCGAN [41], WGAN [42], E-WACGAN [43], SA-GAN [28], Transformer-CGAN, and PCGAN-EASA, to augment an imbalanced EEG dataset. Subsequently, for the balanced training sets after augmentation, a CNN was used as the classifier. The performance of each model is presented in Table 3. It is clear from the table that PCGAN-EASA outperformed the others in overall performanceh assessment, followed by SA-CGAN. Comparatively, WGAN’s performance in data enhancement was not as strong as DCGAN’s, but E-WACGAN demonstrated higher sample quality and model robustness due to its improved loss function. Notably, PCGAN-EASA achieved optimal results in sensitivity, geometric mean, and F1 score, with values of 97.79%, 98.04%, and 97.91%, respectively. These results reflect its significant impact on increasing sample diversity and enhancing the quality of minority class samples. PCGAN-EASA was not only successful in generating high-quality minority class samples but also achieved 98.59% accuracy and 97.82% specificity, fully demonstrating its ability to improve the classifier’s efficacy. Of course, in the stroke EEG samples, a few training samples are inherently very similar to normal EEG features, or the deep features extracted by EASA are not enough, even after applying data augmentation. This increases the risk of undetected stroke patients.

4.4.4 Influence of Different Ratios of Generated Data on Stroke Classification
Fig. 6 illustrates the performance of stroke classification when the training set is mixed with varying proportions of synthetic samples. The results show that as the proportion of synthetic stroke data increases, all classifiers exhibit improved ability to identify EEG signals. The most significant prediction performance is observed when synthetic data comprises 70% of the total training set. However, when the proportion of synthetic samples becomes excessively high, the data distribution of the training set can become skewed, leading to overfitting to the artificial samples and ultimately impairing the accuracy of real data classification.
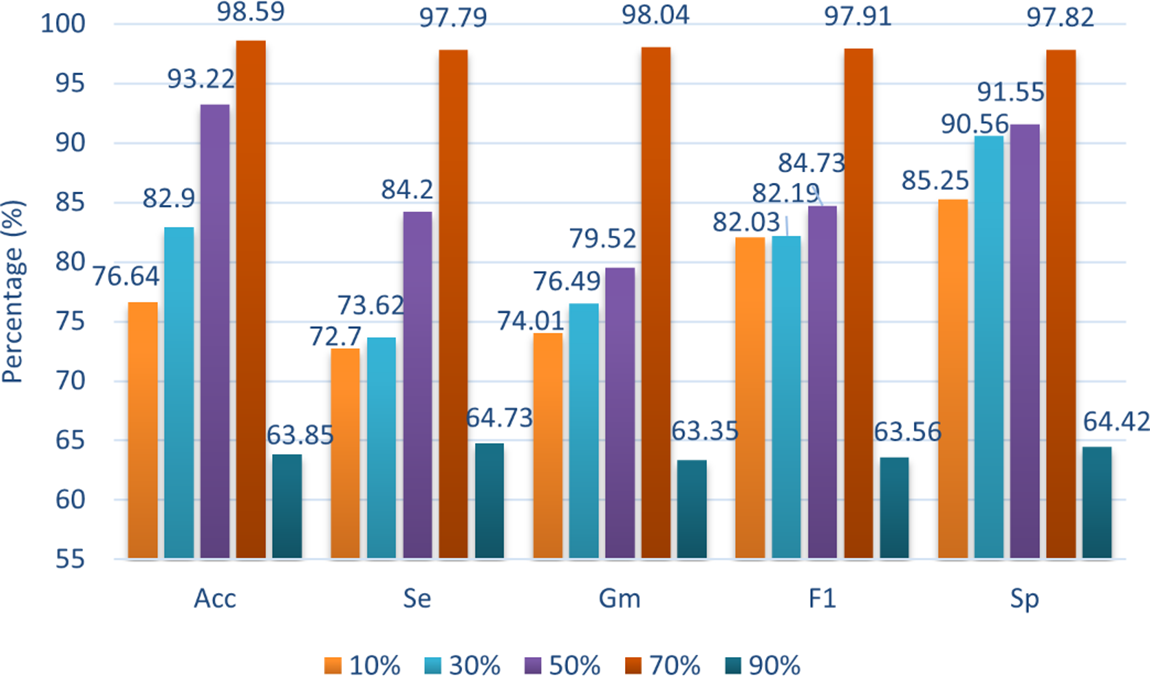
Figure 6: Comparison of training times for each encoder across different feature dimensions
In general, the proposed GANs augmentation algorithm for feature datasets has played a significant role in improving the imbalance in stroke datasets.
From the perspective of advantages, based on the experimental results, this algorithm has effectively alleviated the problem of stroke data scarcity in deep diagnostic model, providing the possibility for independent deployment in other hospitals. Meanwhile, with the reduced training time and computational resources, the hardware configuration pressure on future service providers will also decrease, which is conducive to providing more cost-effective solutions. Thirdly, using the automatic patient feature extraction module may also inspire a future controlled generation of case signals in other GAN architectures.
In terms of disadvantages, although the PCGAN-EASA can effectively increase accuracy, the diagnostic efficiency is still insufficient because neurologists or radiologists in actual diagnostics need to face multiple possible disease types simultaneously. If the models for all the disease types have to be stored, it would increase the storage space and computation time. Recently proposed general-purpose large models [44] may be one of the effective means to solve these problems. Additionally, although the generative effects of GAN models are relatively sound, the complexity of the training process leads to decreased training stability, making the model prone to issues such as mode collapse and gradient vanishing. Therefore, it is necessary to explore methods such as Wasserstein loss functions [45] or automated architecture search [46] in future research to make adjustments.
In response to the challenges faced by deep generative models in generating high-quality stroke EEG signals while managing computational resource consumption, this study introduces a novel feature augmentation technique based on an efficient attention mechanism. The model refines the EEG feature generation process by constructing a progressive conditional generative network, addressing the instability issues commonly encountered in traditional deep network training. During the model’s encoding phase, an efficient approximating self-attention mechanism based on Nyström approximation is introduced, enabling deeper extraction of case-specific information from stroke EEG features while reducing the computational resources typically required by traditional scaled dot-product attention mechanisms. PCGAN-EASA outperforms traditional generative models across various evaluation metrics, demonstrating its effectiveness in refining EEG signal feature generation and enhancing the accuracy of stroke patient classification.
Future research will focus on addressing the challenges posed by imbalanced stroke EEG data with multiple categories and limited samples per category. Developing deep neural network models that can more effectively extract features from EEG signals will be central to this research. Additionally, integrating other modalities, such as image data, with EEG signal features to improve sample generation quality is a key direction for future efforts. Furthermore, these methodologies could be extended to super-resolution generation of EEG signals, semi-supervised learning, and domain adaptation, offering significant potential for related applications.
Acknowledgement: None.
Funding Statement: This work is supported by the General Program under grant funded by the National Natural Science Foundation of China (NSFC) (No. 62171307), and the Basic Research Program of Shanxi Province under grant funded by the Department of Science and Technology of Shanxi Province (China) (No. 202103021224113).
Author Contributions: Conceptualization and methodology, Suzhe Wang and Xueying Zhang; formal analysis, Suzhe Wang, Xueying Zhang, Fenglian Li and Zelin Wu; software, validation and writing—original draft, Suzhe Wang and Xueying Zhang; writing—review and editing and data curation, Suzhe Wang, Xueying Zhang and Fenglian Li; supervision and funding acquisition, Suzhe Wang, Xueying Zhang and Fenglian Li. All authors reviewed the results and approved the final version of the manuscript.
Availability of Data and Materials: Data not available due to ethical restrictions.
Ethics Approval: Ethical approvals for this research were obtained from the Ethics Committees of Taiyuan University of Technology and Shanxi Provincial People’s Hospital (approval numbers: TYUT-2023122501 and 1911140805). The study was conducted in accordance with the Declaration of Helsinki. Informed consent was obtained from the participants and informed consent was obtained from Shanxi Provincial People’s Hospital.
Conflicts of Interest: The authors declare that they have no conflicts of interest to report regarding the present study.
References
1. K. D. Seo, M. J. Kang, G. S. Kim, J. H. Lee, S. H. Suh and K. Y. Lee, “National trends in clinical outcomes of endovascular therapy for ischemic stroke in South Korea between 2008 and 2016,” J. Stroke, vol. 22, no. 3, pp. 412–415, Sep. 2020. doi: 10.5853/jos.2020.01928. [Google Scholar] [PubMed] [CrossRef]
2. J. Y. Kim and H. J. Bae, “Spontaneous intracerebral hemorrhage: Management,” J. Stroke, vol. 19, no. 1, pp. 28–39, Jan. 2017. doi: 10.5853/jos.2016.01935. [Google Scholar] [PubMed] [CrossRef]
3. M. P. Kate et al., “Pre-hospital triage of suspected acute stroke patients in a mobile stroke unit in the rural alberta,” Sci. Rep., vol. 11, no. 1, pp. 88–93, Mar. 2021. doi: 10.1038/s41598-021-84441-0. [Google Scholar] [PubMed] [CrossRef]
4. J. I. Doerrfuss, T. Kilic, M. Ahmadi, M. Holtkamp, and J. E. Weber, “Quantitative and qualitative EEG as a prediction tool for outcome and complications in acute stroke patients,” Clin. EEG Neurosci., vol. 51, no. 2, pp. 121–129, Sep. 2019. doi: 10.1177/1550059419875916. [Google Scholar] [PubMed] [CrossRef]
5. D. M. Michels, L. C. Van Dijk, and D. L. J. Tavy, “Perioperative stroke during carotid endarterectomy: Benefits of multimodal neuromonitoring-A case report,” BMC Neurol., vol. 22, no. 1, Aug. 2022, Art. no. 325. doi: 10.1186/s12883-022-02835-7. [Google Scholar] [PubMed] [CrossRef]
6. P. D. Barua et al., “Multilevel hybrid accurate handcrafted model for myocardial infarction classification using ECG signals,” Int. J. Mach. Learn. Cyb., vol. 14, no. 5, pp. 1651–1668, 2023. doi: 10.1007/s13042-022-01718-0. [Google Scholar] [PubMed] [CrossRef]
7. A. Subasi, S. Dogan, and T. Tuncer, “A novel automated tower graph based ECG signal classification method with hexadecimal local adaptive binary pattern and deep learning,” J. Amb. Intel. Hum. Comp., vol. 14, no. 2, pp. 711–725, 2023. doi: 10.1007/s12652-021-03324-4. [Google Scholar] [CrossRef]
8. X. Liu, “Detection and classification of ADHD using deep learning based on EEG signals,” Highlig. Sci., Eng. Technol., vol. 91, pp. 191–199, 2024. doi: 10.54097/12cjyf16. [Google Scholar] [CrossRef]
9. M. Xu et al., “BWGAN-GP: An EEG data generation method for class imbalance problem in RSVP tasks,” IEEE Trans. Neural Syst. Rehab. Eng., vol. 30, pp. 251–263, 2022. doi: 10.1109/TNSRE.2022.3145515. [Google Scholar] [PubMed] [CrossRef]
10. C. He, J. Liu, Y. Zhu, and W. Du, “Data augmentation for deep neural networks model in EEG classification task: A review,” Front. Hum. Neurosci., vol. 15, no. 1, pp. 1–14, Dec. 2021. doi: 10.3389/fnhum.2021.765525. [Google Scholar] [PubMed] [CrossRef]
11. I. Goodfellow et al., “Generative adversarial networks,” Commun. ACM, vol. 63, no. 11, pp. 139–144, Oct. 2020. doi: 10.1145/3422622. [Google Scholar] [CrossRef]
12. A. G. Habashi, A. M. Azab, S. Eldawlatly, and M. A. Gamal, “Generative adversarial networks in EEG analysis: An overview,” J. NeuroEng. Rehabil., vol. 20, no. 40, pp. 1–24, 2023. doi: 10.1186/s12984-023-01169-w. [Google Scholar] [PubMed] [CrossRef]
13. Z. Zhang, S. Zhong, and Y. Liu, “Beyond mimicking under-represented emotions: Deep data augmentation with emotional subspace constraints for EEG-based emotion recognition,” presented at AAAI Conf. Artif. Intell., Vancouver, BC, Canada, Feb. 22–25, 2024, pp. 22–25. [Google Scholar]
14. C. Wang, L. Liu, W. Zhuo, and Y. Xie, “An epileptic EEG detection method based on data augmentation and lightweight neural network,” IEEE J. Transl. Eng. He., vol. 12, no. 8, pp. 22–31, Aug. 2023. doi: 10.1109/JTEHM.2023.3308196. [Google Scholar] [PubMed] [CrossRef]
15. X. Du et al., “Electroencephalographic signal data augmentation based on improved generative adversarial network,” Brain Sci., vol. 14, no. 4, Apr. 2024, Art. no. 367. doi: 10.3390/brainsci14040367. [Google Scholar] [PubMed] [CrossRef]
16. S. M. Abdelfattah, G. M. Abdelrahman, and M. Wang, “Augmenting the size of EEG datasets using generative adversarial networks,” presented at the 2018 Int. Jt. Conf. Neural Networks, Rio de janeiro, Brazil, Jul. 08–13, 2018. [Google Scholar]
17. D. Pascual, A. Amirshahi, A. Aminifar, D. Atienza, P. Ryvlin and R. Wattenhofer, “Epilepsygan: Synthetic epileptic brain activities with privacy preservation,” IEEE Trans. Biomed. Eng., vol. 68, no. 8, pp. 2435–2446, Dec. 2020. doi: 10.1109/TBME.2020.3042574. [Google Scholar] [PubMed] [CrossRef]
18. R. Kadri, M. Tmar, B. Bouaziz, and F. Gargouri, “Alzheimer’s disease detection using deep ECA-ResNet101 network with DCGAN,” presented at the 2021 Int. Jt. Conf. Hybrid Intell. Syst., Ottawa, ON, Canada, Dec. 14–16, 2021, pp. 14–16. [Google Scholar]
19. F. Fahimi, Z. Zhang, W. B. Goh, K. K. Ang, and C. Guan, “Towards EEG generation using GANs for BCI applications,” presented at the 2019 Int. Jt. Conf. Biomed. Health. Inf., Chicago, IL, USA, May 19–22, 2019. [Google Scholar]
20. A. Zhang, L. Su, Y. Zhang, Y. Fu, L. Wu and S. Liang, “EEG data augmentation for emotion recognition with a multiple generator conditional Wasserstein GAN,” Complex Intell. Syst., vol. 8, no. 4, pp. 1–13, 2021. doi: 10.1007/s40747-021-00336-7. [Google Scholar] [CrossRef]
21. G. Bouallegue and R. Djemal, “EEG data augmentation using Wasserstein GAN,” presented at the 2020 Int. Conf. Sci. Tech. Autom., Monastir, Tunisia, Dec. 20–22, 2020. [Google Scholar]
22. T. Luo, Y. Fan, L. Chen, G. Guo, and C. Zhou, “EEG signal reconstruction using a generative adversarial network with wasserstein distance and temporal-spatial-frequency loss,” Front. Neuroinform., vol. 14, Apr. 2020, Art. no. 15. doi: 10.3389/fninf.2020.00015. [Google Scholar] [PubMed] [CrossRef]
23. S. Panwar, P. Rad, T. -P. Jung, and Y. Huang, “Modeling EEG data distribution with a Wasserstein generative adversarial network to predict RSVP events,” IEEE Trans. Neural Syst. Rehab. Eng., vol. 28, no. 8, pp. 1720–1730, Aug. 2020. doi: 10.1109/TNSRE.2020.3006180. [Google Scholar] [PubMed] [CrossRef]
24. W. Zheng and H. Zhao, “Cost-sensitive hierarchical classification for imbalance classes,” Appl. Intell., vol. 50, no. 8, pp. 2328–2338, Mar. 2020. doi: 10.1007/s10489-019-01624-z. [Google Scholar] [CrossRef]
25. V. Kushwaha and G. C. Nandi, “Study of prevention of mode collapse in generative adversarial network (GAN),” presented at the 2020 Int. Conf. Inf. Commun. Tech., Changchun, China, May 24–26, 2020. [Google Scholar]
26. X. Wang, Z. Cao, R. Wang, Z. Liu, and X. Zhu, “Improving human pose estimation with self-attention generative adversarial networks,” IEEE Access, vol. 7, pp. 119668–119680, 2019. doi: 10.1109/ACCESS.2019.2936709. [Google Scholar] [CrossRef]
27. G. Sun, S. Ding, T. Sun, and C. Zhang, “SA-CapsGAN: Using capsule networks with embedded self-attention for generative adversarial networks,” Neurocomputing, vol. 423, no. 5, pp. 399–406, Jan. 2021. doi: 10.1016/j.neucom.2020.10.092. [Google Scholar] [CrossRef]
28. P. F. de Araujo-Filho, M. Naili, G. Kaddoum, E. T. Fapi, and Z. Zhu, “Unsupervised GAN-based intrusion detection system using temporal convolutional networks and self-attention,” IEEE Trans. Netw. Serv., vol. 20, no. 4, pp. 4951–4963, Dec. 2023. doi: 10.1109/TNSM.2023.3260039. [Google Scholar] [CrossRef]
29. J. Tang, B. Zou, C. Li, S. Feng, and H. Peng, “Plane-wave image reconstruction via generative adversarial network and attention mechanism,” IEEE Trans. Instrum. Meas., vol. 70, pp. 1–15, 2021. doi: 10.1109/TIM.2021.3087819. [Google Scholar] [CrossRef]
30. C. E. Kuo, T. H. Lu, G. T. Chen, and P. Y. Liao, “Towards precision sleep medicine: Self-attention GAN as an innovative data augmentation technique for developing personalized automatic sleep scoring classification,” Comput. Biol. Med., vol. 148, Sep. 2022, Art. no. 105828. doi: 10.1016/j.compbiomed.2022.105828. [Google Scholar] [PubMed] [CrossRef]
31. J. Yin, A. Liu, C. Li, R. Qian, and X. Chen, “A GAN guided parallel CNN and transformer network for EEG denoising,” IEEE J. Biomed. Health., vol. 5, pp. 1–12, 2024. doi: 10.1109/JBHI.2023.3277596. [Google Scholar] [PubMed] [CrossRef]
32. X. Ding, Y. Wang, Z. Xu, Z. J. Wang, and W. J. Welch, “Distilling and transferring knowledge via cGAN-generated samples for image classification and regression,” Expert Syst. Appl., vol. 213, no. 4, 2023, Art. no. 119060. doi: 10.1016/j.eswa.2022.119060. [Google Scholar] [CrossRef]
33. H. Zhao, J. Jia, and V. Koltun, “Exploring self-attention for image recognition,” presented at the 2020 Proc. Int. Conf. Comput. Vis. Pattern Recog., Seattle, WA, USA, Jun. 14–19, 2020. [Google Scholar]
34. A. Vaswani et al., “Attention is all you need,” presented at Adv. Neural Inf. Process. Syst., Long Beach, CA, USA, Dec. 4–9, 2017. [Google Scholar]
35. G. Chen and Y. Maday, “Directed message passing based on attention for prediction of molecular properties,” Comp. Mater. Sci., vol. 229, no. 3, Oct. 2023, Art. no. 112443. doi: 10.1016/j.commatsci.2023.112443. [Google Scholar] [CrossRef]
36. K. Zhang, I. W. Tsang, and J. T. Kwok, “Improved Nyström low-rank approximation and error analysis,” presented at the 2020 Proc. Int. Conf. Mach. Learn., Vienna, Austria, Jul. 12–18, 2020. [Google Scholar]
37. M. He, Z. Wei, and J. R. Wen, “Convolutional neural networks on graphs with Chebyshev approximation, revisited,” Adv. Neural Inf. Process. Syst., vol. 35, no. 3, pp. 7264–7276, 2022. doi: 10.1016/j.commatsci.2023.112443. [Google Scholar] [CrossRef]
38. J. T. Barron, “A general and adaptive robust loss function,” presented at the 2019 Proc. Int. Conf. Comput. Vis. Pattern Recog., Long Beach, CA, USA, Jun. 15–20, 2019. [Google Scholar]
39. S. Cao, “Choose a transformer: Fourier or Galerkin,” presented at the 2021 Proc. Int. Conf. Adv. Neural Inf. Process. Syst., Dec. 8–14, 2021. [Google Scholar]
40. K. Rasheed, J. Qadir, T. J. O’Brien, L. Kuhlmann, and A. Razi, “A generative model to synthesize EEG data for epileptic seizure prediction,” IEEE Trans. Neural Syst. Rehab. Eng., vol. 29, pp. 2322–2332, 2021. doi: 10.1109/TNSRE.2021.3125023. [Google Scholar] [PubMed] [CrossRef]
41. Q. Wu, Y. Chen, and J. Meng, “DCGAN-based data augmentation for tomato leaf disease identification,” IEEE Access, vol. 8, pp. 98716–98728, 2022. doi: 10.1109/ACCESS.2020.2997001. [Google Scholar] [CrossRef]
42. Q. Wang et al., “WGAN-based synthetic minority over-sampling technique: Improving semantic fine-grained classification for lung nodules in CT images,” IEEE Access, vol. 7, pp. 18450–18463, 2019. doi: 10.1109/ACCESS.2019.2896409. [Google Scholar] [CrossRef]
43. Q. Jin, R. Lin, and F. Yang, “E-WACGAN: Enhanced generative model of signaling data based on WGAN-GP and ACGAN,” IEEE Syst. J., vol. 14, no. 3, pp. 3289–3300, Sep. 2020. doi: 10.1109/JSYST.2019.2935457. [Google Scholar] [CrossRef]
44. Y. Chen et al., “Generative adversarial networks in medical image augmentation: A review,” Comput. Biol. Med., vol. 6, no. 1, Nov. 2023, Art. no. 105382. doi: 10.1038/s41746-023-00958-w. [Google Scholar] [CrossRef]
45. S. H. Gobato and A. Moradi, “A novel loss function for neural network models exploring stock realized volatility using wasserstein distance,” Dec. Anal. J., vol. 10, no. 3, May 2024, Art. no. 100369. doi: 10.1016/j.dajour.2023.100369. [Google Scholar] [CrossRef]
46. A. Heuillet, A. Nasser, H. Arioui, and H. Tabia, “Efficient automation of neural network design: A survey on differentiable neural architecture search,” ACM Comput. Surv., vol. 56, no. 11, pp. 1–36, Jun. 2024. doi: 10.1145/3665138. [Google Scholar] [CrossRef]
Cite This Article
 Copyright © 2024 The Author(s). Published by Tech Science Press.
This work is licensed under a Creative Commons Attribution 4.0 International License , which permits unrestricted use, distribution, and reproduction in any medium, provided the original work is properly cited.
 Downloads
 Citation Tools