
 Submit a Paper
 Propose a Special lssue
 Open Access
ARTICLE

ResMHA-Net: Enhancing Glioma Segmentation and Survival Prediction Using a Novel Deep Learning Framework
1 Department of Computer Science, School of Engineering and Technology, Islamic University of Science and Technology, Awantipora, 192122, India
2 Faculty of Computing and Technology, Al-Baha University, Alaqiq, 65779-7738, Saudi Arabia
3 Research Groups in Intelligent Machines, National School of Engineers of Sfax, University of Sfax, Sfax, 3038, Tunisia
4 Department of Electrical Engineering, College of Engineering, King Khalid University, Abha, 61421, Saudi Arabia
5 Department of Computer Science and Engineering, Thapar Institute of Engineering and Technology, Patiala, 147004, Punjab
6 Department of Electrical and Instrumentation Engineering, Thapar Institute of Engineering and Technology, Patiala, 147004, Punjab
7 Department of AI and Software, Gachon University, Seongnam-si, 13120, Republic of Korea
* Corresponding Authors: Novsheena Rasool. Email: ; Muhammad Shahid Anwar. Email:
(This article belongs to the Special Issue: Medical Imaging Based Disease Diagnosis Using AI)
Computers, Materials & Continua 2024, 81(1), 885-909. https://doi.org/10.32604/cmc.2024.055900
Received 10 July 2024; Accepted 28 August 2024; Issue published 15 October 2024
 View Full Text
 Download PDF
Abstract
Gliomas are aggressive brain tumors known for their heterogeneity, unclear borders, and diverse locations on Magnetic Resonance Imaging (MRI) scans. These factors present significant challenges for MRI-based segmentation, a crucial step for effective treatment planning and monitoring of glioma progression. This study proposes a novel deep learning framework, ResNet Multi-Head Attention U-Net (ResMHA-Net), to address these challenges and enhance glioma segmentation accuracy. ResMHA-Net leverages the strengths of both residual blocks from the ResNet architecture and multi-head attention mechanisms. This powerful combination empowers the network to prioritize informative regions within the 3D MRI data and capture long-range dependencies. By doing so, ResMHA-Net effectively segments intricate glioma sub-regions and reduces the impact of uncertain tumor boundaries. We rigorously trained and validated ResMHA-Net on the BraTS 2018, 2019, 2020 and 2021 datasets. Notably, ResMHA-Net achieved superior segmentation accuracy on the BraTS 2021 dataset compared to the previous years, demonstrating its remarkable adaptability and robustness across diverse datasets. Furthermore, we collected the predicted masks obtained from three datasets to enhance survival prediction, effectively augmenting the dataset size. Radiomic features were then extracted from these predicted masks and, along with clinical data, were used to train a novel ensemble learning-based machine learning model for survival prediction. This model employs a voting mechanism aggregating predictions from multiple models, leading to significant improvements over existing methods. This ensemble approach capitalizes on the strengths of various models, resulting in more accurate and reliable predictions for patient survival. Importantly, we achieved an impressive accuracy of 73% for overall survival (OS) prediction.Keywords
The human brain is incredibly complex and powerful, with around 86 billion interconnected neurons. It makes us conscious and self-aware, allowing us to think, solve problems, and be creative. The brain can adapt and change, which helps us learn and recover from injuries [1]. It also controls our emotions and social interactions, enabling us to form relationships and understand others. However, it is susceptible to arrange of diseases, among which brain tumors are significant [2]. These tumors, arising from abnormal cell growth within the brain, can manifest in various forms, benign or malignant, and originate from different brain tissue types. The exact cause of brain tumors is not always clear, but they can develop due to genetic mutations, exposure to radiation, or a family history of brain tumors [3]. Early detection of brain tumors is crucial because it increases the chances of successful treatment and can help prevent the tumor from growing and causing more severe symptoms or complications [4]. Gliomas, a heterogeneous group of brain tumors, present significant challenges due to their varying grades and complex compositions, including necrosis/core tumor (CT), enhancing tumor and non-enhancing tumor components (ET/NET), and edema (ED). Magnetic resonance imaging (MRI) is a cornerstone in the diagnostic process, offering detailed imaging of brain structures without invasive procedures [5]. This non-invasive technique utilizes powerful magnetic fields and radio waves to generate precise images, aiding in gliomas’ detection, characterization, and monitoring. Integrating advanced 3D MRI modalities is pivotal in diagnosing and managing brain tumors, providing detailed insights into tissue characteristics and tumor extent [6]. T1-weighted (T1) imaging delineates normal and abnormal brain structures, crucial for identifying tumors and surrounding tissues [7]. Post-contrast T1-weighted imaging (T1ce) enhances visualization of tumor vascularization and contrast enhancement, distinguishing benign from malignant lesions effectively. T2-weighted (T2) imaging highlights differences in tissue water content, aiding in edema detection and understanding tumor impact on brain structures [8]. Fluid-attenuated inversion recovery (FLAIR) imaging suppresses cerebrospinal fluid signals, improving abnormality visualization and subtle tumor changes detection [9]. These modalities not only support initial tumor diagnosis but also guide surgical planning by accurately mapping tumor location and extent, thereby minimizing damage to healthy brain tissue during interventions. Manual segmentation of glioma brain tumors is a critical process in medical imaging and diagnosis, involving the meticulous delineation of tumor boundaries on brain scans by expert radiologists [10]. This procedure typically uses MRI scans, which provide detailed and high-contrast images of brain tissues, allowing for precise identification of tumor regions. Radiologists carefully examine each MRI slice to outline the tumor, differentiating it from healthy tissues and other abnormalities. This process is time-consuming and requires expertise, as accurate segmentation is crucial for treatment planning, disease progression monitoring, and research studies. Deep neural networks (DNN) have emerged as revolutionary tools in various domains [11–14], particularly for brain tumor segmentation. Techniques such as DeepMedic [15], SegNet [16], RescueNet [17], and convolutional neural networks (CNN) [18] represent significant advancements over traditional manual methods [19–21]. These advanced methods enhance the precision and efficiency of segmentation, offering notable improvements. Furthermore, survival prediction is a crucial aspect of neuro-oncology, aiming to estimate a patient’s expected lifespan following a diagnosis [22]. Accurate prediction of survival outcomes helps clinicians tailor treatment plans, manage patient expectations, and improve decision-making. However, predicting survival in brain tumor cases remains challenging due to the tumors’ complex and heterogeneous nature, variability in treatment responses, and the impact of genetic, molecular, and environmental factors on disease progression. Emerging advanced machine learning techniques offer powerful tools for predicting patient survival with greater accuracy, presenting significant potential for personalized medicine and new treatment strategies. By providing a clearer picture of a patient’s prognosis, machine learning facilitates the creation of individualized treatment plans, enhancing patient outcomes. It also allows for more efficient clinical trials by grouping patients with similar prognoses, leading to faster and more targeted testing of new therapies. This paper presents ResMHA-Net, a novel deep-learning model combining a multi-head attention mechanism with a ResNet U-Net architecture to improve brain tumor segmentation. Our method effectively segments three key regions of gliomas: the core tumor, surrounding edema, and enhancing tumor region. Additionally, we employ a novel voting-based ensemble model for more efficient survival prediction compared to state-of-the-art methods. The workflow of the proposed methodology begins with preprocessing MRI images to prepare them for analysis. We then develop the ResMHA-Net model to segment key tumor regions. Following segmentation, we apply post-processing techniques to enhance image quality by refining boundaries and removing artifacts. From these improved images, we extract radiomic features and perform feature selection to retain the most relevant features, discarding any redundant or less informative ones. These selected features are then combined with each patient’s clinical data, including age, resection status, and survival duration, to create a comprehensive dataset integrating both imaging and clinical information. Finally, this dataset is used in an ensemble model for survival prediction, which classifies patients into long, short, and mid-term survival groups. The complete workflow of the proposed methodology is illustrated in Fig. 1.
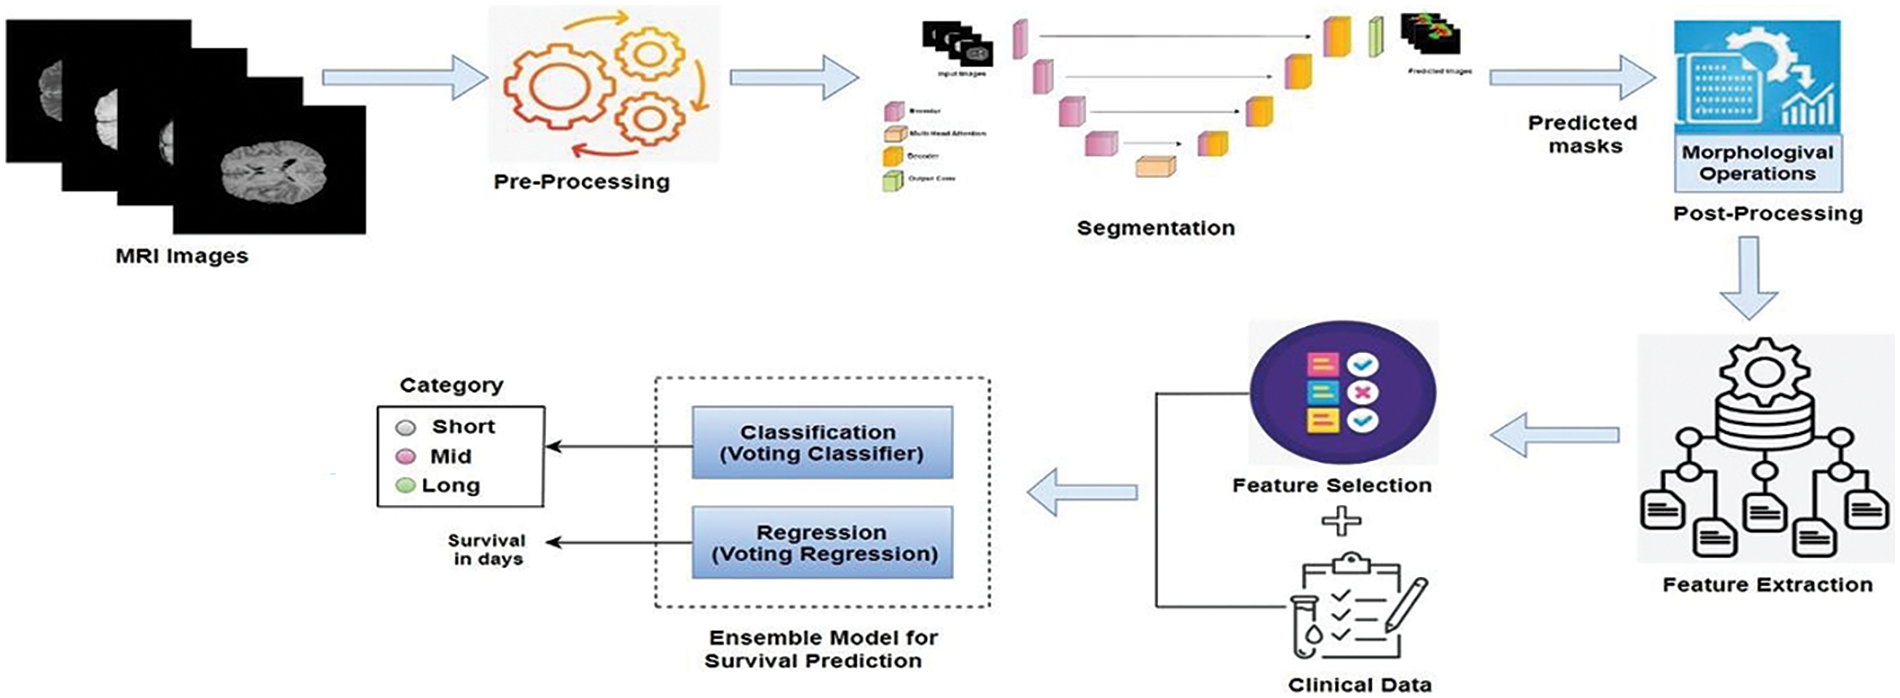
Figure 1: Workflow for brain tumor segmentation and survival predictions
Contribution
a) We propose a novel architecture that integrates ResNet and UNet strengths, enhanced by a multi-head attention mechanism. This model achieves precise multiclass segmentation of gliomas, effectively distinguishing distinct tumor sub-regions.
b) We introduce an innovative machine learning-based voting ensemble method for predicting patient survival using predicted masks from Task 1. Our proposed survival prediction model offers a more robust and accurate estimation of patient survival compared to existing methods, achieving an impressive accuracy of 73%.
The paper is organized into 7 sections. Section 1 highlights the significance of brain tumor segmentation and survival prediction, addressing the challenges in glioma segmentation and forecasting survival outcomes. Section 2 reviews relevant literature. Section 3 details the proposed methodology for brain tumor segmentation. Section 4 presents the results of the segmentation. Section 5 covers the methodology for overall survival prediction. Section 6 focuses on the statistical analysis related to both brain tumor segmentation and survival prediction. Finally, Section 7 summarizes the key findings, demonstrating the effectiveness of our proposed architecture for precise glioma segmentation and survival prediction, and outlines future directions.
Recent advancements in brain tumor segmentation have led to several innovative deep-learning models, each introducing unique mechanisms to enhance accuracy and reliability in analyzing medical images. Zhu et al. [23] combined deep semantic information and edge details from multimodal MRI scans using a Swin Transformer, CNNs with an “edge spatial attention block,” and a “multi-feature inference block” based on graph convolution. Their method outperformed existing state-of-the-art techniques on the BraTS benchmarks. Rehman et al. [24] introduced RAAGR2-Net, an encoder-decoder architecture featuring a residual spatial pyramid pooling (RASPP) module and an attention gate (AG) module. This model outperformed BraTS benchmarks by enhancing segmented outputs and retaining location information. Cao et al. [25] developed MBANet, a 3D convolutional neural network that integrates optimized shuffle units and a novel 3D Shuffle Attention (SA) module for enhanced feature processing. MBANet achieved significant performance on BraTS datasets, with high dice scores for various tumor categories. Malhotra et al. [26] introduced CB-D2RNet, a model that effectively bridges the contextual gap between the encoder and decoder, addressing computational complexity and excessive model parameters. It demonstrated competitive performance on BraTS benchmarks with a minimal parameter count. Wu et al. [27] developed AGGN, an MRI-focused attention glioma grading network leveraging a dual-domain attention mechanism to weigh channel and spatial information. AGGN’s extensive experiments validated its effectiveness, superiority, and robustness over other advanced models. Yang et al. [28] developed a 2D DenseUNet model incorporating a ResBlock mechanism and Gaussian noise layer for data augmentation, replacing conventional 2D convolutional layers with pooling layers. Their model, tested on 200 MRI images, demonstrated superior performance and reliability in clinical treatment strategies. Rehman et al. [24] proposed RAAGR2-Net, a deep learning model for brain tumor segmentation. It includes preprocessing steps like N4 bias correction and z-score normalization, with critical modules RASPP for spatial pooling and AG for attention-based refinement. RAAGR2-Net outperforms existing methods on BraTS benchmarks for segmentation tasks. Berkley et al. [29] developed a 3D U-Net model using BraTS data for glioma segmentation and tested it on clinical MRIs from their institution. The model, despite variations in imaging quality and tumor types, achieved competitive dice scores: 0.764 for whole tumor (WT), 0.648 for core tumor (CT), and 0.61 for enhancing tumor (ET). Vinod et al. [30] introduced a novel brain tumor segmentation approach that combines a U-Net model, a Convolutional Neural Network (CNN), and a Self-Organizing Feature Map (SOFM) in an ensemble technique, tested on the BRATS 2020 dataset. The model achieved an accuracy of 96.5%, an IoU of 0.546, and a dice coefficient of 0.992 during validation phase, leading to an overall segmentation accuracy of 98.28%. Mazher et al. [31] proposed a method combining deep learning and radiomics for predicting brain tumor patient survival. Their approach uses advanced features from a segmentation model, integrates these with clinical data, and applies various regression techniques. Their method outperforms existing approaches in predicting survival days for glioma patients. Akter et al. [32] created a deep learning system combining a CNN for classifying brain images and a U-Net for segmenting them. They tested their system on six datasets and found that using segmentation improved classification accuracy, achieving up to 98.8% accuracy. Their approach, with up to 97.7% accuracy on individual datasets, shows potential for clinical use in automatically identifying and segmenting brain tumors from MRI scans.
The BraTS (Multimodal Brain Tumor Segmentation Challenge) datasets, spanning 2018 to 2021, have become a cornerstone for glioma research. Each year offers a significant number of cases: 285 in 2018 [33], 335 in 2019 [34], 369 in 2020 [35], and 1251 in 2021 [36]. These cases encompass high-grade gliomas (HGG) and low-grade gliomas (LGG). Each case has four MRI modalities (T1, T1ce, T2, and FLAIR) and their respective masks with consistent dimensions (
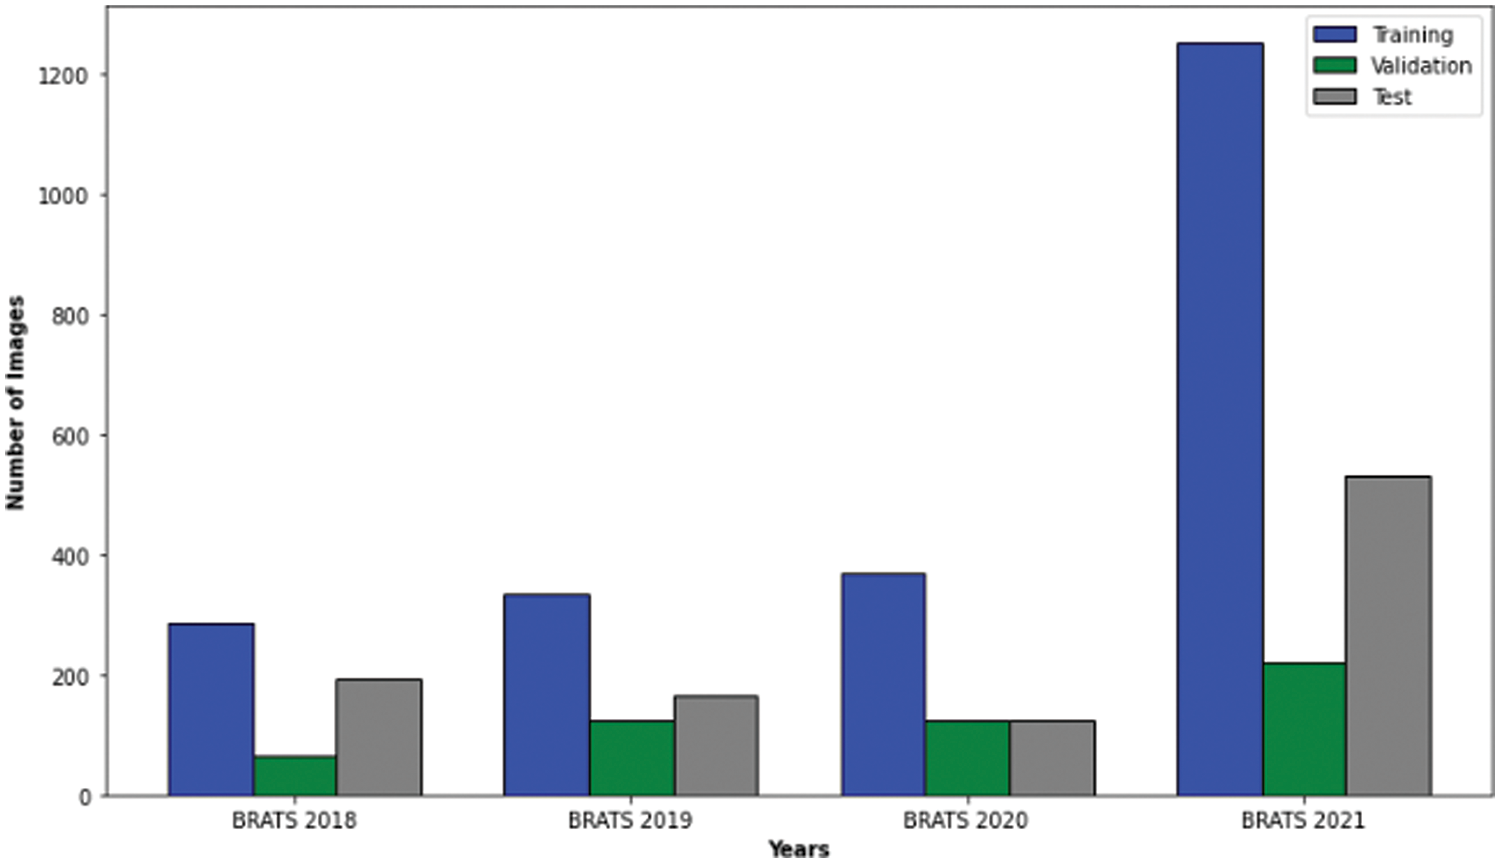
Figure 2: Case numbers in brats 2018, 2019, 2020 and 2021 datasets
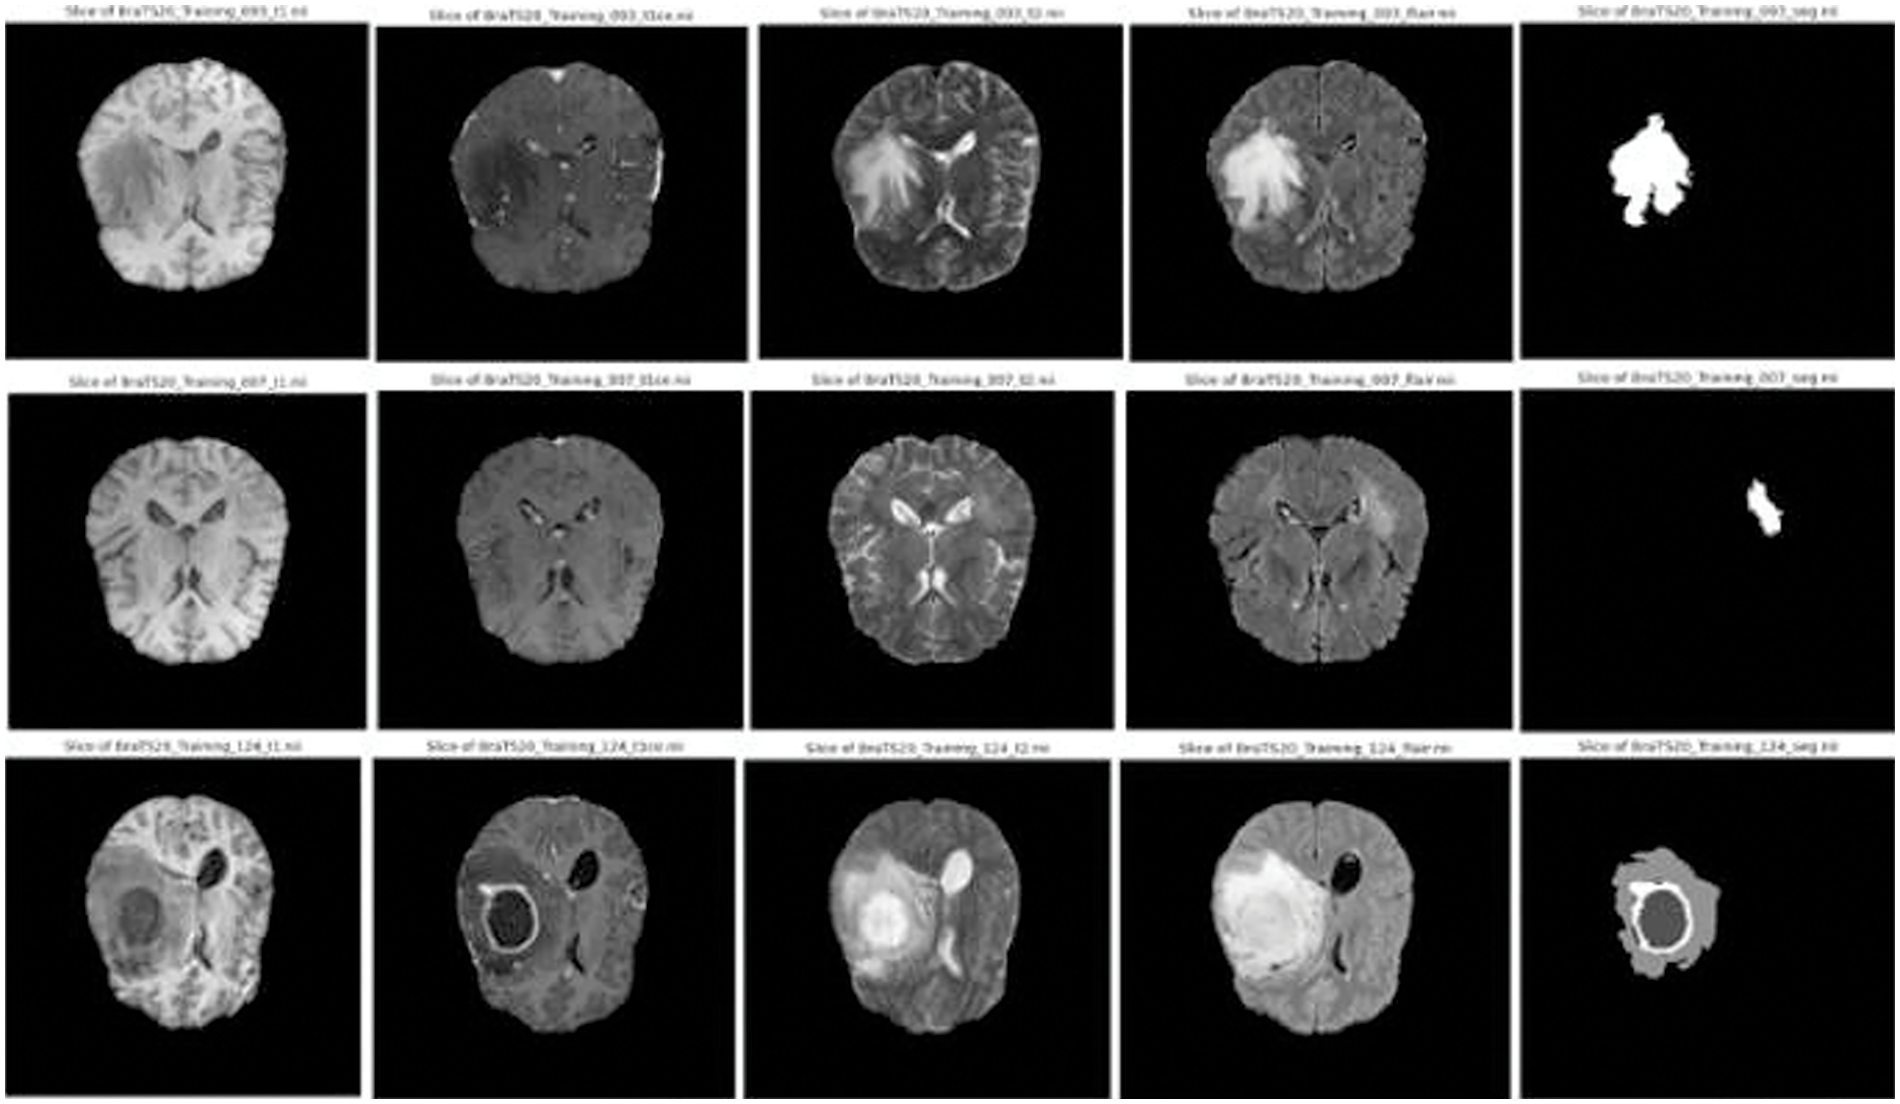
Figure 3: Sample images and corresponding segmentation masks in brats’ dataset
Accurate segmentation of brain tumors in MRI scans is vital for effective diagnosis and treatment planning [37]. In this study, the pre-processing pipeline was designed to ensure high-quality, standardized MRI data for analysis. Bias field correction was initially applied to address intensity inhomogeneities from different scanners or protocols, which improved data consistency but did not significantly enhance segmentation accuracy. Recognizing this, intensity normalization was emphasized to adjust scans to a common intensity scale, which reduced variability and improved data consistency. This led to better segmentation performance, as indicated by higher dice similarity coefficients (DSC) and overall accuracy across tumor classes, demonstrating the effectiveness of intensity normalization in enhancing segmentation outcomes. Following normalization, we leveraged the rich information captured by four distinct MRI modalities–T1, T1ce, T2, and FLAIR. By stacking these individual images into a comprehensive multi-channel image, we created a powerful representation that encapsulates intricate details of brain structure and potential pathologies, providing a more comprehensive view than analyzing each modality in isolation. To balance computational efficiency and the capture of relevant anatomical details, we strategically cropped a central volume of dimensions
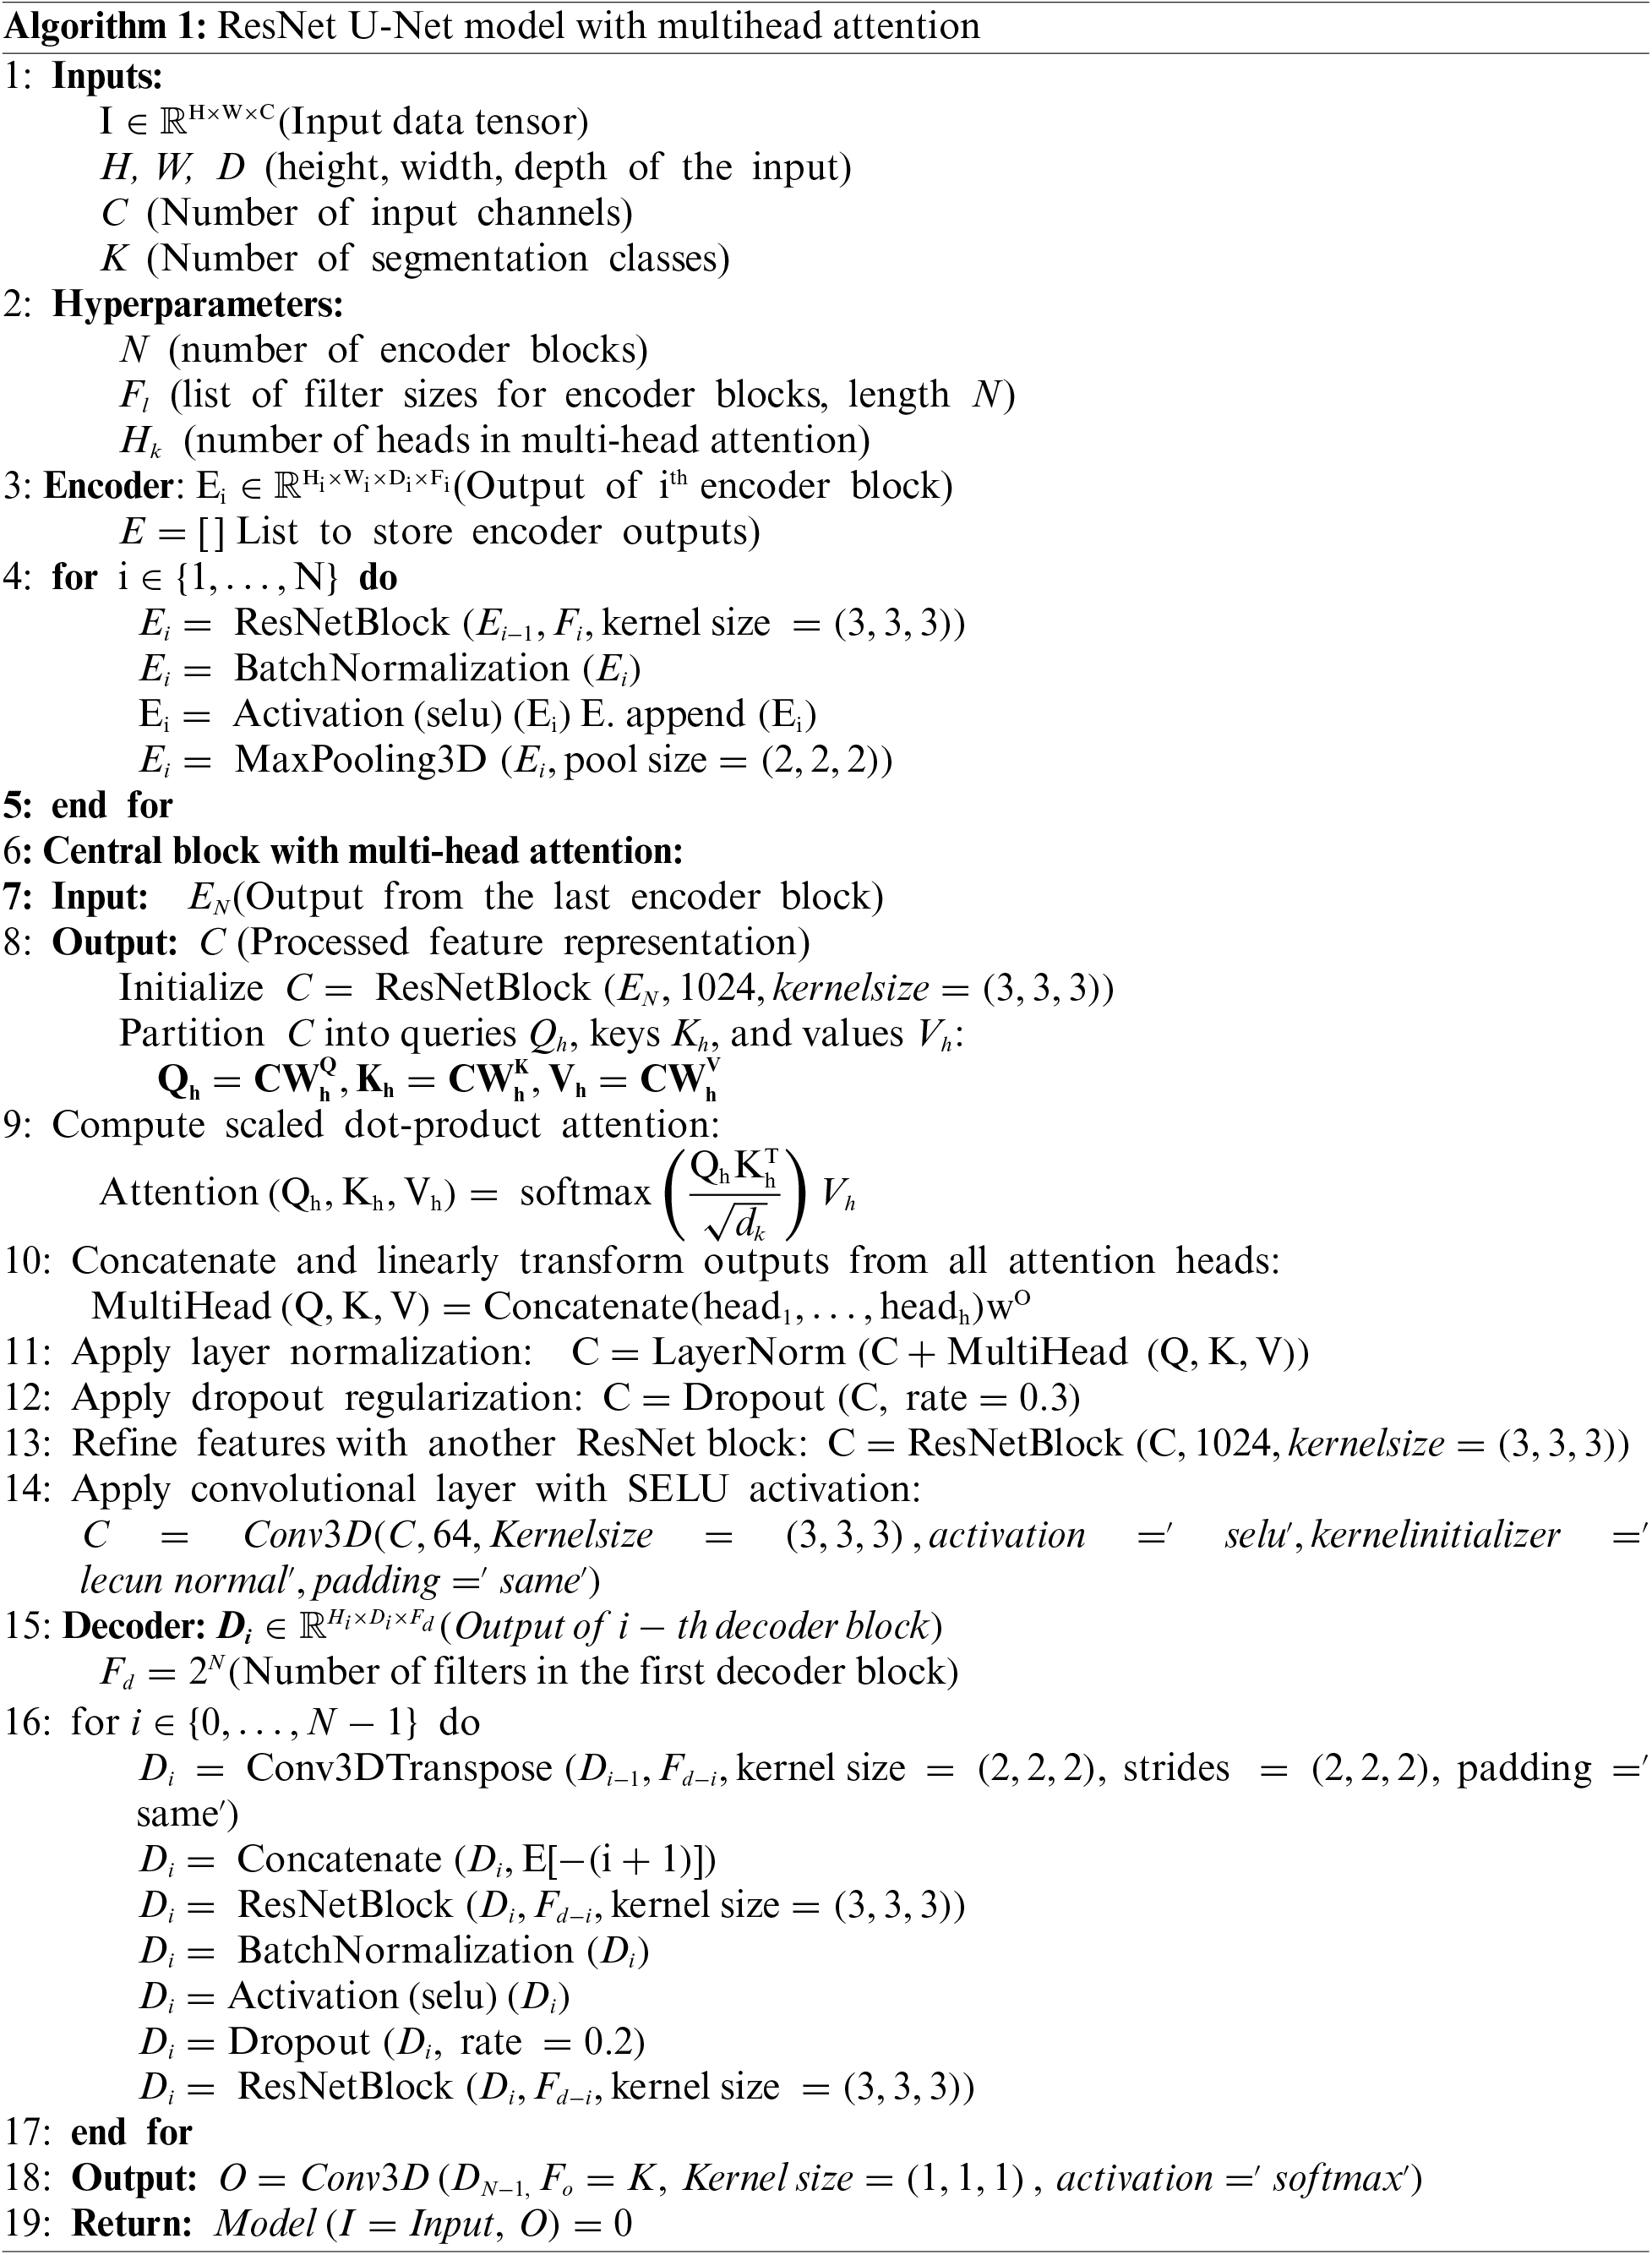
We developed ResMHA-Net, a novel ResNet U-Net model with a multi-head attention mechanism for semantic segmentation of glioma brain tumors from MRI data (see Fig. 4). The model integrates ResNet blocks into the U-Net architecture and a multi-head attention mechanism to enhance feature representation. It consists of three main parts: the encoder, the central block with multi-head attention, and the decoder. ResNet blocks with 3D convolutions, Batch Normalization, and SELU activation extract hierarchical features in the encoder, while max pooling reduces spatial dimensions. The central block refines features from the final encoder output through additional ResNet processing and a multi-head attention mechanism to capture long-range dependencies. Crucially, the output of the multi-head attention block is passed directly as input to the decoder. This interaction is pivotal, as the attention-enhanced features are upsampled using transposed convolution layers in the decoder. The decoder also incorporates skip connections from the encoder to combine these upsampled features with high-resolution features from earlier layers, enabling more accurate segmentation. Additional ResNet blocks in the decoder refine these combined features, ensuring precise feature transfer and segmentation. Detailed algorithmic discussion is given below:
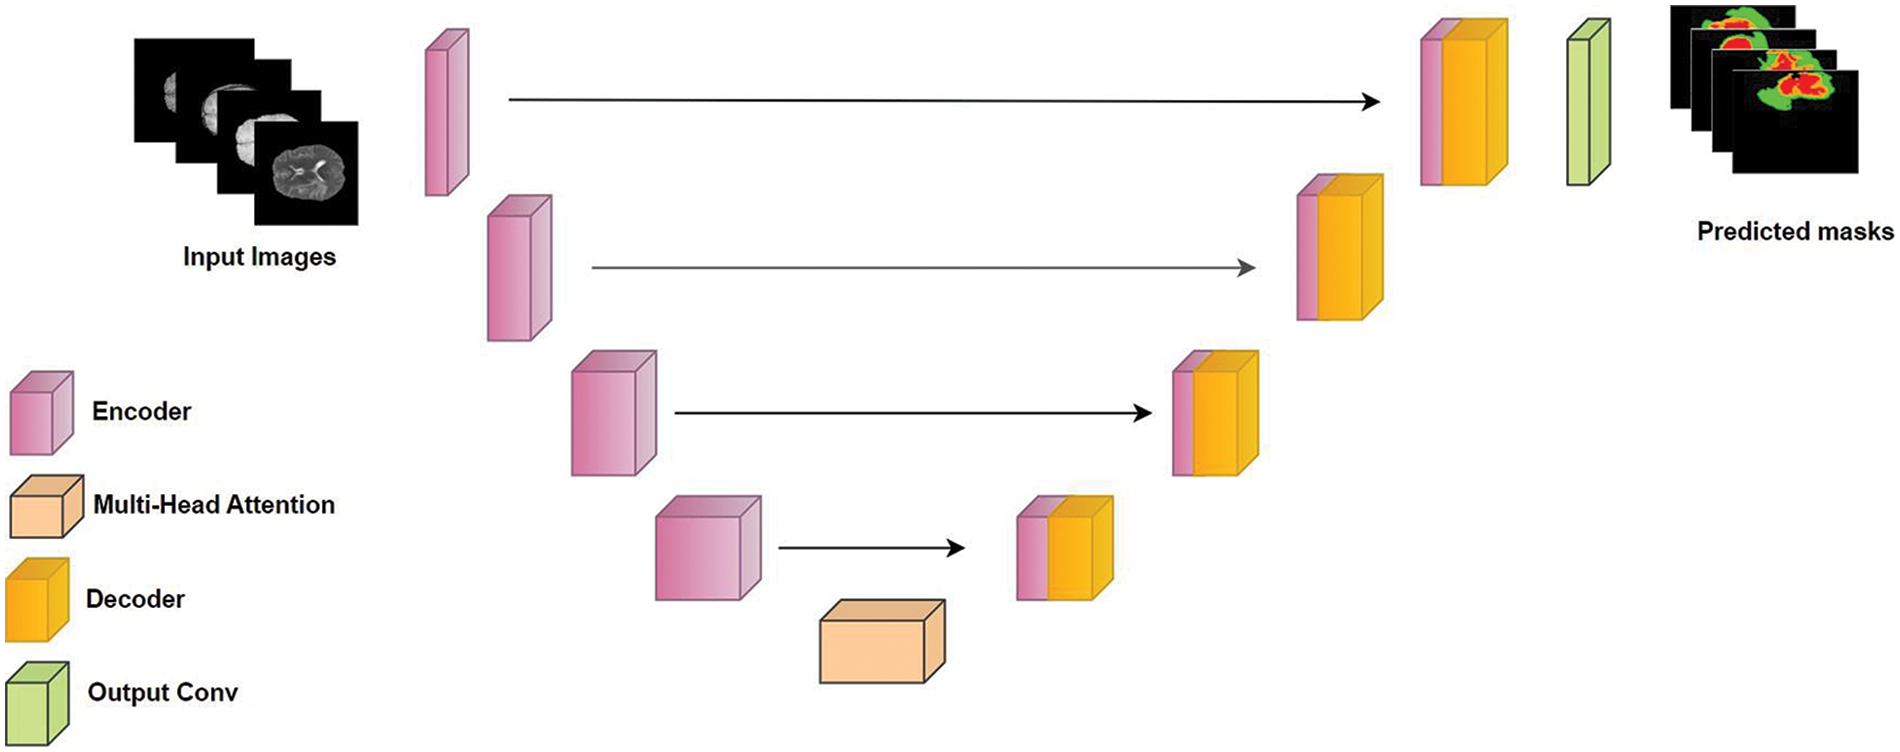
Figure 4: Proposed ResMHA-Net architecture for brain tumor segmentation
The algorithm initializes an input tensor I with dimensions specified for image height (H), width (W), depth (D), channels (C), and classes (K), specifically
3.4 MultiHead Attention Mechanism
The central block of our ResNet U-Net with multi-head attention begins with the output
Next, we employ a multi-head attention mechanism to enhance feature interaction and capture long-range dependencies across different parts of the feature space. This mechanism partitions C into queries Q, keys K, and values V, each transformed via learned weight matrices
where h denotes the head index in the multi-head attention mechanism. The model can jointly attend to information from different representation subspaces at other positions using multiple heads. Each head h computes a separate set of queries, keys, and values, allowing the model to capture various features and relationships within the data. This approach enables a richer and more nuanced understanding of the feature space, which is beneficial for glioma tumor segmentation. Consequently, this leads to improved accuracy in identifying and delineating tumor regions, enhancing the overall performance of the segmentation task. The scaled dot-product attention mechanism calculates attention scores by computing the dot product between
The outputs from all attention heads are concatenated and linearly transformed using another learned weight matrix WO to produce the final multi-head attention output MultiHead (Q, K, V):
Subsequently, layer normalization is applied to stabilize the output and facilitate training:
To enhance generalization and prevent overfitting, dropout regularization is employed, randomly dropping units from the output tensor during training:
Finally, another ResNet block refines the features further:
A convolutional layer with SELU activation and appropriate padding concludes this stage:
This central block effectively integrates multi-head attention to enhance feature interactions and capture complex dependencies across the input space, crucial for accurate glioma brain tumor segmentation.
Decoder: The decoder part of the network plays a pivotal role in converting encoded features, including those refined by the multi-head attention block, into the final segmentation output through a structured process. Operating in a reverse hierarchical manner compared to the encoder, it employs Conv3DTranspose layers with decreasing filter sizes (512, 256, 128, and 64) to progressively upsample feature maps, reconstructing spatial dimensions essential for accurate segmentation. Initialized with Di, where i denotes each decoder block, and
We applied binary erosion and dilation as post-processing techniques to our predicted masks. These operations were implemented using a structured element with a kernel size of (3, 3, 3). Erosion was used to contract the boundaries of segmented regions, eliminating small, isolated pixel groups that could represent noise or artifacts. This process helped smooth the edges of segmented structures, ensuring uniformity and regularity in boundaries, which is crucial for accurately delineating anatomical features and pathological regions. Conversely, dilation expanded the boundaries of segmented areas to fill in small gaps or holes within structures, thereby restoring details that might have been lost during erosion. This step ensured the continuity and integrity of segmented regions, maintaining the structural coherence necessary for precise analysis.
To advance the state of brain tumor segmentation, we developed an innovative deep-learning architecture incorporating a multi-head attention mechanism. This model was rigorously tested using the BraTS datasets from 2018 to 2021.Each dataset was divided into training and validation sets using a 70–30 ratio. After removing images and their corresponding masks that do not contain all four labels (0, 1, 2, and 4), the distribution of each MRI dataset used in our experimentation is shown in Fig. 5.
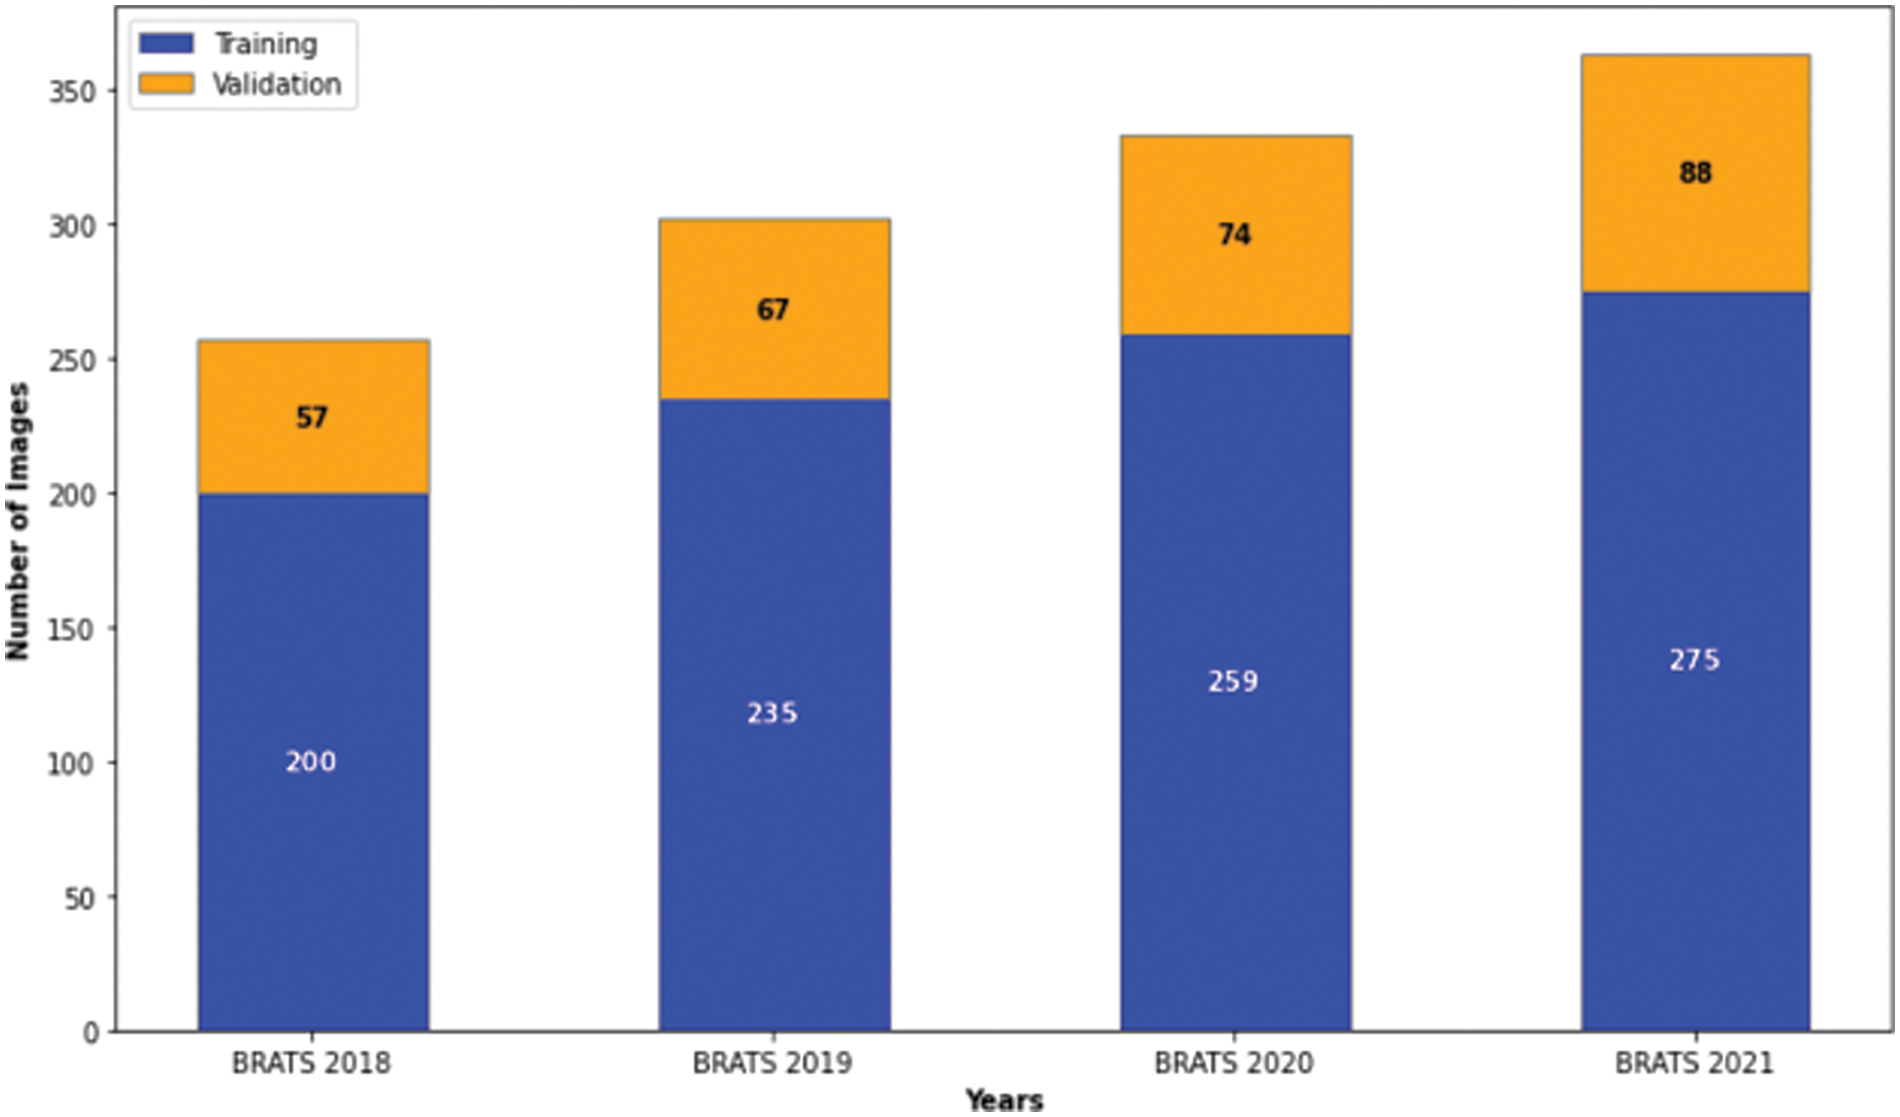
Figure 5: Distribution of images in the brats 2018–2021 datasets for our study
We conducted separate training and validation processes on each dataset and achieved superior results on the BraTS 2021 dataset, attributable to its larger case volume compared to earlier years, as illustrated in Table 1. Figs. 6 and 7 depict the training and validation performance of the proposed model. Fig. 6 shows the accuracy metrics for both training and validation datasets, highlighting the model’s effectiveness in correctly predicting segmentation labels. As the number of epochs increases, the accuracy increases, indicating the model’s learning improvement over time. In contrast, Fig. 7 illustrates the training and validation loss curves, showing that loss decreases as the number of epochs increases, demonstrating the model’s ability to minimize errors. Our model was trained over 240 epochs to ensure thorough learning and convergence. We used a batch size of 2 to balance memory usage and model performance. A learning rate of 0.001 was chosen to enable stable and gradual optimization. For the optimization process, we employed the adam optimizer, which adapts learning rates based on the estimates of the first and second moments of the gradients, thereby enhancing the efficiency and effectiveness of the training. Additionally, we noted that performance improved from BraTS 2018 to BraTS 2019 and further improved from BraTS 2019 to BraTS 2020 dataset. This improvement is likely due to the increased number of cases available for training and validation, highlighting the importance of dataset size in enhancing model performance. Fig. 8 illustrates the performance metrics of the model during training and validation on the BraTS 2018–2021 datasets, including the dice score, sensitivity, specificity, and precision for the three tumor regions. Notably, the BraTS 2021 dataset showed superior results with validation dice scores of 92% for WT, 91% for CT, and 91% for ET, and an overall accuracy of 99%. These results highlight the model’s robustness and improved generalization to newer data, making it an effective tool for accurate brain tumor segmentation. The dice coefficient is computed separately for each class in this multiclass segmentation problem, and the individual class results are averaged. This approach ensures that each class contributes equally to the final loss value, regardless of the class’s frequency or size in the dataset. Minimizing this dice loss during training enables the model to produce segmentations that closely match the ground truth labels, enhancing segmentation accuracy and reliability. The dice loss is mathematically defined as follows:

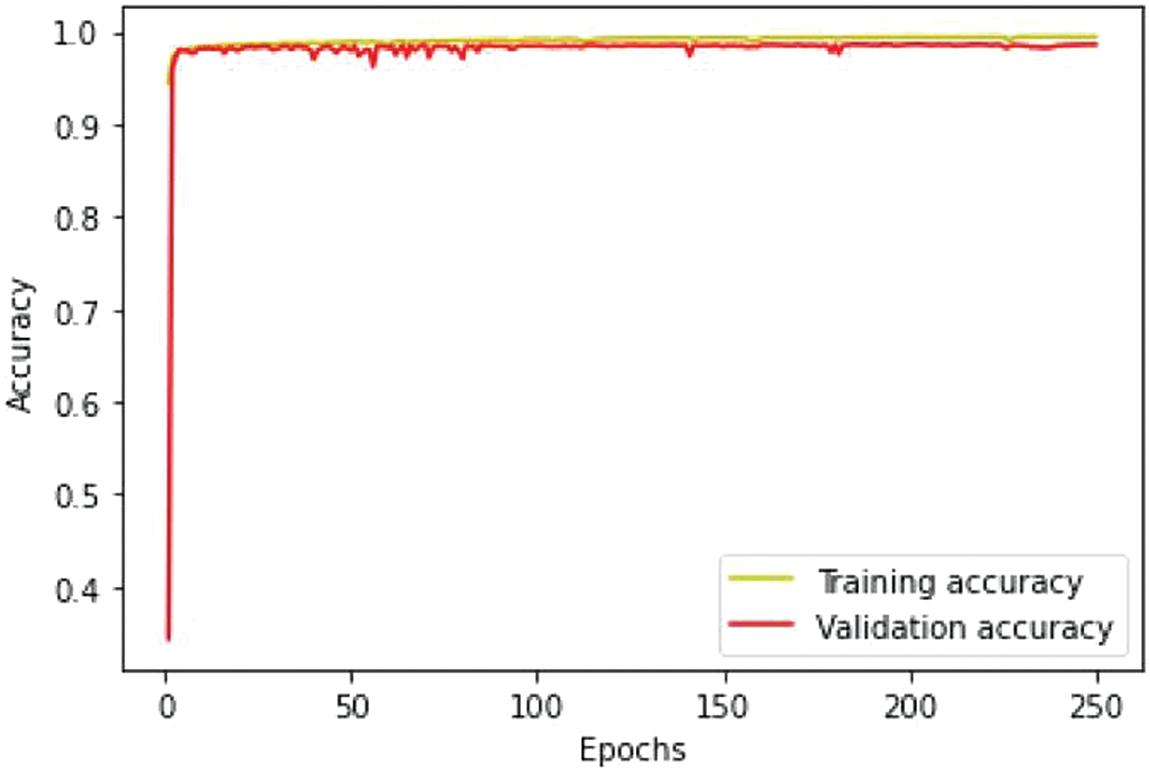
Figure 6: Training and validation accuracy performance
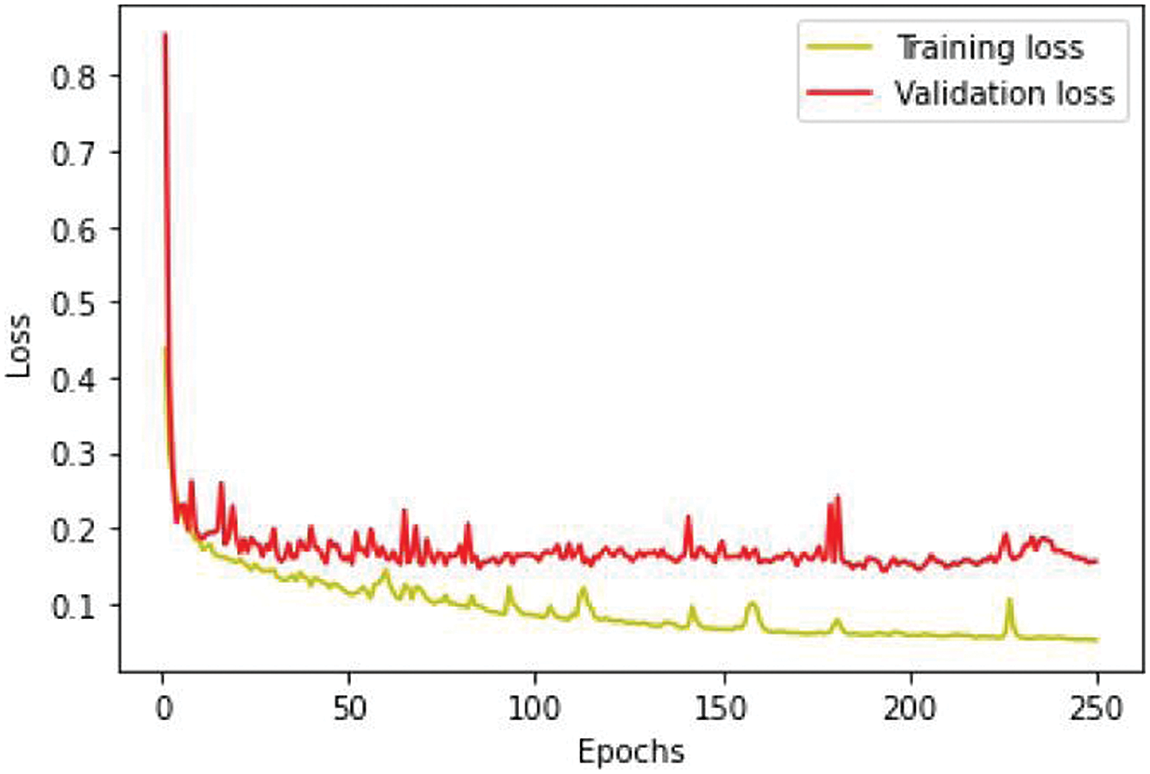
Figure 7: Loss analysis per epoch
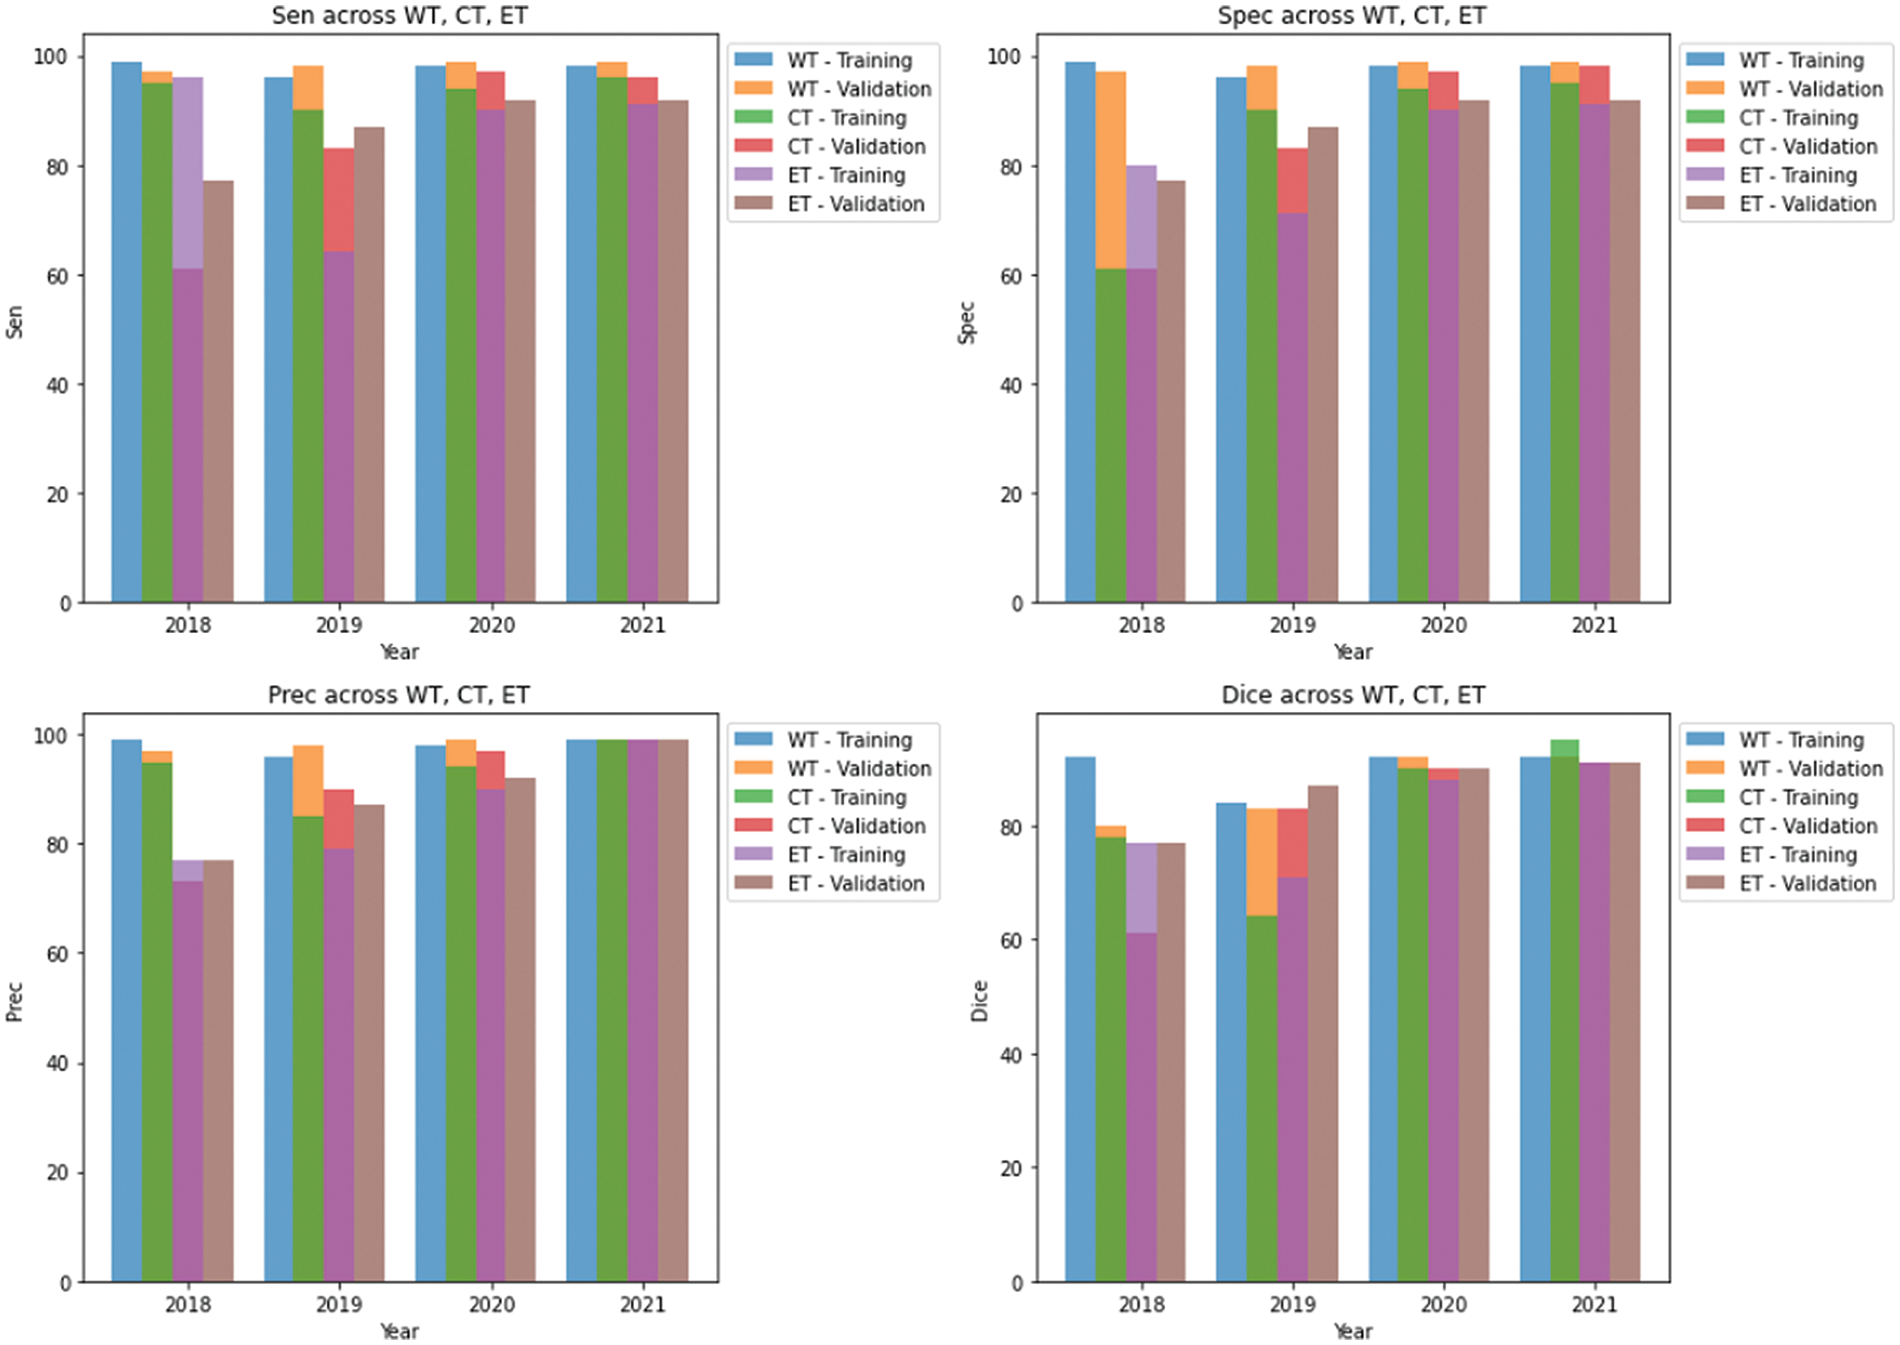
Figure 8: Results of training and validation on brats 2018–2021 datasets in our study
In this formula,
Additionally, Fig. 9 showcases predictions on testing images, demonstrating the model’s ability to segment different tumor regions accurately. In the figure, the core tumor is highlighted in red, the edema is shown in green, and the enhancing tumor is outlined in blue. These regions are crucial for precise tumor identification and classification. The combination of the core tumor, edema, and enhancing tumor regions represents the whole tumor, which a surrounding by black background area. This visual representation aids in understanding the model’s effectiveness in distinguishing and segmenting various tumor sub-regions, which is essential for accurate diagnosis and treatment planning.
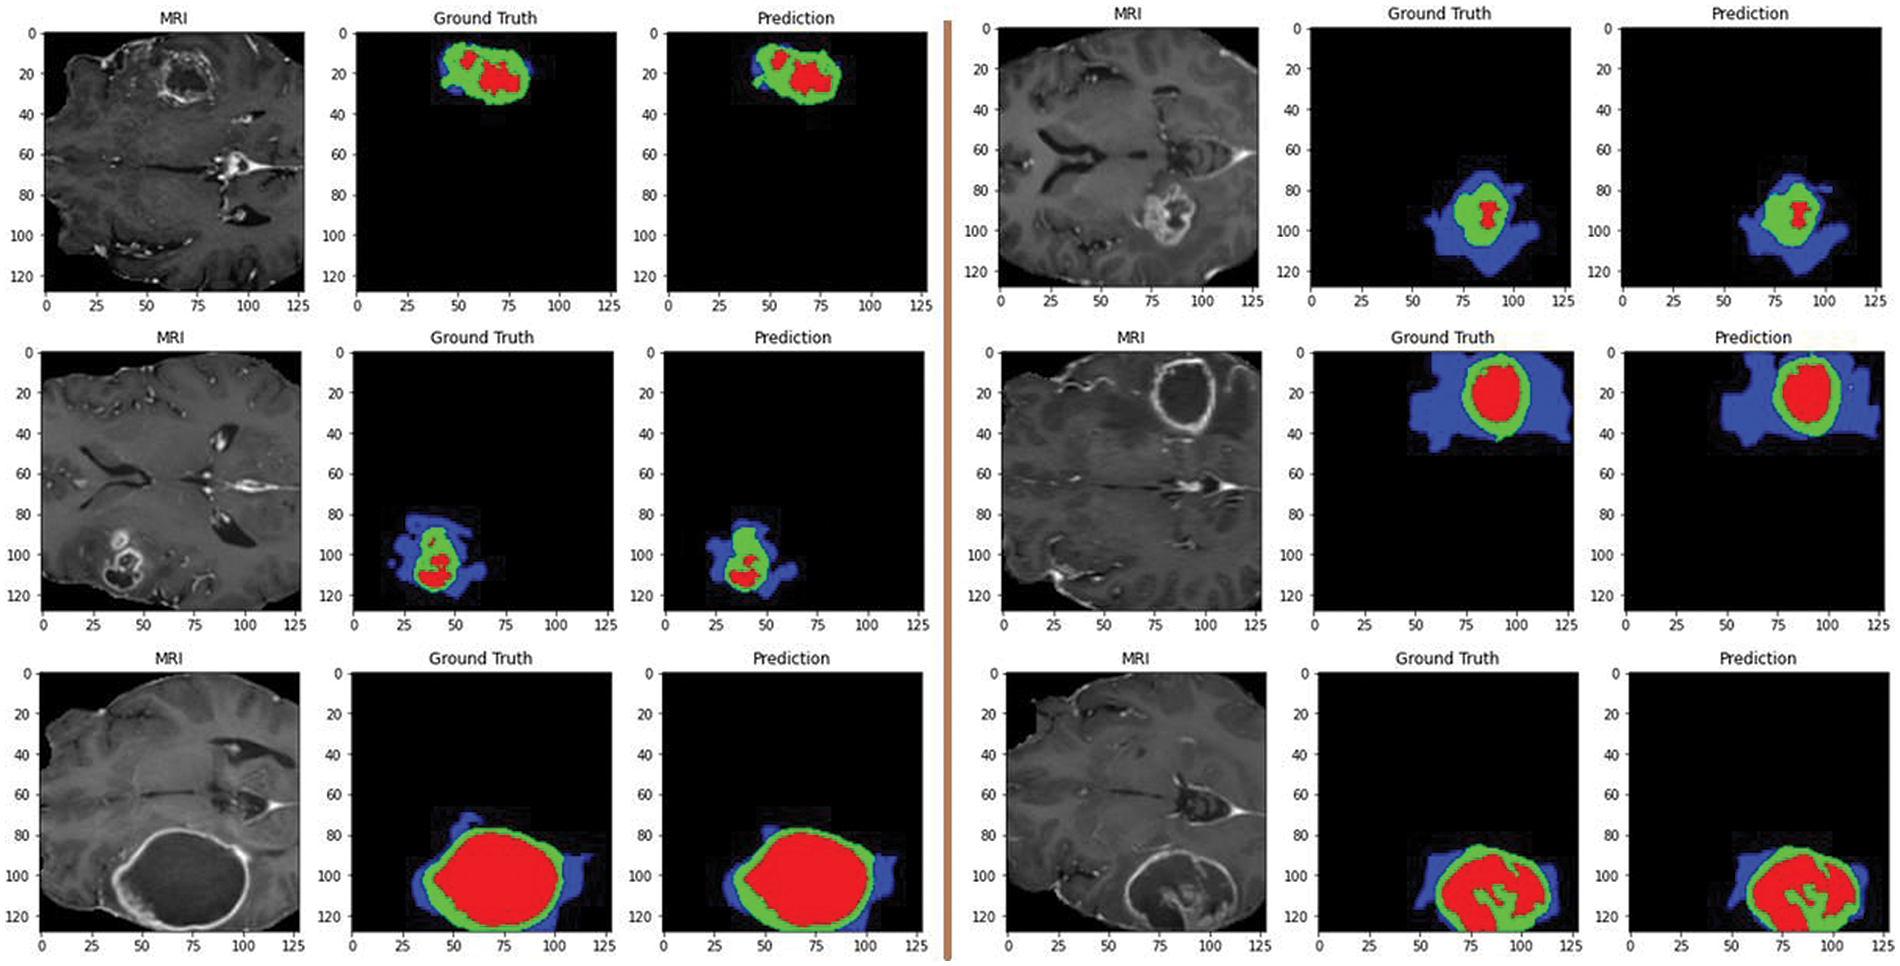
Figure 9: Predictions on testing images by the proposed model: red for core tumor, green for edema, blue for enhancing tumor, and black for background
In recent advancements in brain tumor segmentation, several innovative models have significantly improved over previous techniques. Zhang et al. [38] introduced a brain tumor segmentation model with multiple encoders, enhancing feature extraction and boosting performance. They proposed a new loss function called “Categorical Dice,” which tackles voxel imbalance by assigning varying weights to segmented regions. Evaluated using the BraTS 2020 dataset achieved dice scores of 0.70 for the ET, 0.88 for WT, and 0.73 for CT, outperforming current state-of-the-art techniques.
Ali et al. [39] developed a 3D U-Net model for automatic brain tumor detection and segmentation. Their approach achieved high dice scores of 0.913, 0.874, and 0.801 on the BraTS 2018 dataset for WT, CT, and ET regions, respectively. Evaluation on a local dataset of 71 subjects also demonstrated strong performance with dice scores of 0.891, 0.834, and 0.776.
Aboelenein et al. [40] proposed the Hybrid Two-Track U-Net (HTTU-Net) for brain tumor segmentation. The method addresses class imbalance using focal loss and generalized dice loss. Tested on the BraTS 2018 dataset, it achieved mean dice scores of 0.86 for WT, 0.80 for CT, and 0.74 for ET, with median scores of 0.883, 0.895, and 0.815, respectively.
Sun et al. [41] developed an efficient CNN for brain tumor segmentation with 7 layers, 108 kernels, and 20,308 parameters. Evaluation on BRATS2018 shows consistent segmentation performance: 77.2% for ET, 89.2% for WT, and 76.3% for CT. The system operates with minimal computational load, requiring 29.07G Flops per case, highlighting ‘its clinical applicability.
Li et al. [42] developed a corrective diffusion model for MRI brain tumor segmentation, addressing systematic errors. They introduced a Vector Quantized Variational Autoencoder (VQ-VAE) to compress data and stabilize corrections and a Multi-Fusion Attention Mechanism for enhanced segmentation accuracy. Evaluation of BRATS2019, BRATS2020, and Jun Cheng datasets showed superior performance compared to existing methods. A summary of these results and other state-of-the-art methods is compiled in Table 2. Furthermore, researchers are actively exploring the potential of various machine-learning approaches.

One such example is a study by Islam et al. [43] that utilizes a CNN with a unique 3D-UNet architecture enhanced by attention mechanisms. This model segments brain tumors in MRI scans and extracts valuable information about their characteristics like shape and location. By combining this data with other clinical factors, the model can predict patient survival times more accurately. Another innovative approach comes from Behrad et al. [44]. They use genetic algorithms to optimize a U-Net-based network for brain tumor segmentation. Notably, deep features extracted from the optimized network are then used for survival prediction, achieving superior efficiency compared to current methods. Additionally, Tran et al. [45] introduced a self-supervised learning framework for brain tumor survival prediction using MRI scans. This method identifies specific image patches and learns their spatial relationships within the scans. Tested on a large dataset, their method outperformed existing methods’ accuracy and ability to identify meaningful connections between image features and patient survival. A comparison of these methods with our approach is presented in Table 3.

Following the segmentation of MRI images using the ResMHA-Net model, we extracted radiomic features to characterize the segmented regions of interest (ROIs) quantitatively. PyRadiomics, a Python library designed explicitly for this purpose, was employed for feature extraction [46]. The extracted features can be broadly categorized into four groups: shape features, first-order, and basic texture statistics, second-order statistics, and higher-order statistics.
Shape Features: These features capture the geometric properties of the segmented ROIs. Examples include elongation, flatness, most minor and major axis lengths, maximum diameters in both 2D slices (Maximum2DDiameterSlice) and 3D volume (Maximum3DDiameter), sphericity, surface area, and voxel volume.
First Order and Basic Texture Statistics: This category focuses on the intensity distribution within the ROIs. Features like autocorrelation, contrast, correlation, difference average (DifferenceAverage), difference entropy (DifferenceEntropy), and difference variance (DifferenceVariance) quantify how the intensity values are distributed within the segmented object.
Second Order Statistics: These features delve deeper into the spatial relationships between neighboring voxels within the segmented ROI. They capture aspects like cluster prominence, shade, and tendency alongside gray-level non-uniformity and variance. This provides information on how intensity values interact spatially within the ROI.
Higher Order Statistics: This category focuses on more complex relationships between intensity values within the segmented ROI. Features like high and low gray level emphasis and large and small dependence emphasis capture how often specific intensity values appear and how they relate to their neighbors non-linearly.
Our study delved into predicting patient survival outcomes using machine learning (ML) models. We incorporated two key data sources: radiomic features extracted from predicted masks across three datasets and clinical data encompassing patient age, survival duration, and surgical resection status. Before analysis, we meticulously ensured data quality by normalizing and addressing missing values. To maximize the effectiveness of our models, we strategically split the dataset, allocating 80% for training and 20% for testing the survival prediction models. For the classification task, we categorize patients into three survival categories such as long survivors (>540 days), short survivors (<210 days), and mid survivors (210–540 days) and adopted a multifaceted approach, employing a diverse set of ML algorithms. Our ensemble approach integrates three distinct ML models for classification and two models for regression as shown in Fig. 10. We used random forest (RF), multi-layer perceptron (MLP), and gradient boosting classifier for classification. For regression, we employed random forest regressor (RFR) and MLP regressor. RF, known for its ensemble learning strength, was utilized to construct multiple decision trees and aggregate their predictions for enhanced accuracy and robustness. The random forest classifier (RFC) was trained with hyperparameters optimized through GridSearchCV. We explored various parameters, including the number of trees (n_estimators) ranging from 100 to 300, the maximum depth of each tree (max_depth) from 10 to 30, the minimum number of samples required to split a node (min_samples_split) from 2 to 15, and the minimum number of samples required to be at a leaf node (min_samples_leaf) from 1 to 10. Additionally, we evaluated whether to apply class weights to address the class imbalance, choosing between ‘balanced’ or no weights. This rigorous tuning process enabled the RF to effectively aggregate predictions from multiple trees, leading to accurate and reliable results. We experimented with MLPs by varying the number and size of hidden layers, using configurations such as (64, 64), (128, 128), (256, 256), (128, 128, 128), and (256, 128, 64). To determine the best configuration, we employed GridSearchCV to test various combinations of training parameters. These parameters included different numbers of training epochs (from 100 to 300), batch sizes (ranging from 16 to 128), and optimizers (like ‘adam’, ‘rmsprop’, and ‘sgd’). The MLP model was trained using scaled features from the training data, with ‘sparse categorical cross-entropy’ as the loss function and ‘accuracy’ as the performance metric. Gradient boosting, another powerful technique, was employed to sequentially build models that rectify errors made by previous models, leading to progressively improved predictive performance. We used GridSearchCV to find the best parameters for the gradient boosting classifier. The search focused on parameters such as the number of boosting stages (n_estimators) ranging from 100 to 200, the learning rate ranging from 0.01 to 0.2, and the maximum depth of each tree (max_depth) from 3 to 5. Gradient boosting builds models sequentially, where each new model tries to correct the errors of the previous ones. This process leads to better performance over time. After determining the optimal parameters through GridSearchCV, we trained the gradient boosting classifier on our training data using these best hyperparameters. To enhance our classification model’s performance, we combined the top-performing classifiers: RF, MLP, and gradient boosting classifier into a single ensemble model using a voting classifier. This voting classifier employs a ‘soft’ voting strategy, aggregating the predicted probabilities from each model. Specifically, it averages these probabilities and assigns the class label with the highest average probability to each data point. This method leverages the strengths of each classifier, leading to improved overall accuracy (see Fig. 11) and robustness of the classification results. The classification task prioritized accuracy for evaluating the ensemble’s effectiveness in categorizing patient survival. For regression, metrics included mean squared error (MSE) for prediction accuracy, Spearman’s Rho for rank correlation, median absolute error (MAE) for outlier resistance, and the standard deviation (SD) of Errors for assessing prediction consistency. The various loss functions employed in the survival prediction model are shown below:
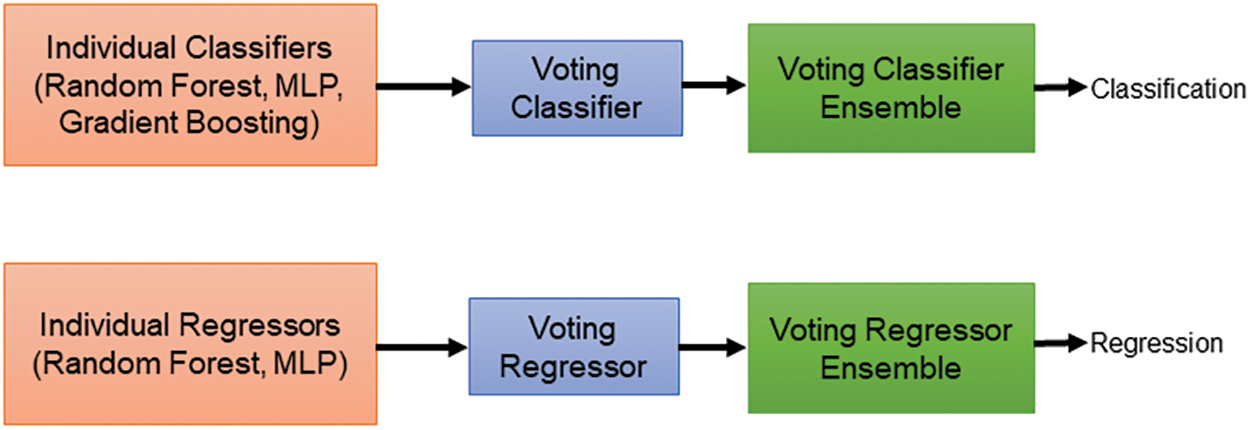
Figure 10: Voting-based classifier and regressor ensembles for brain tumor survival prediction
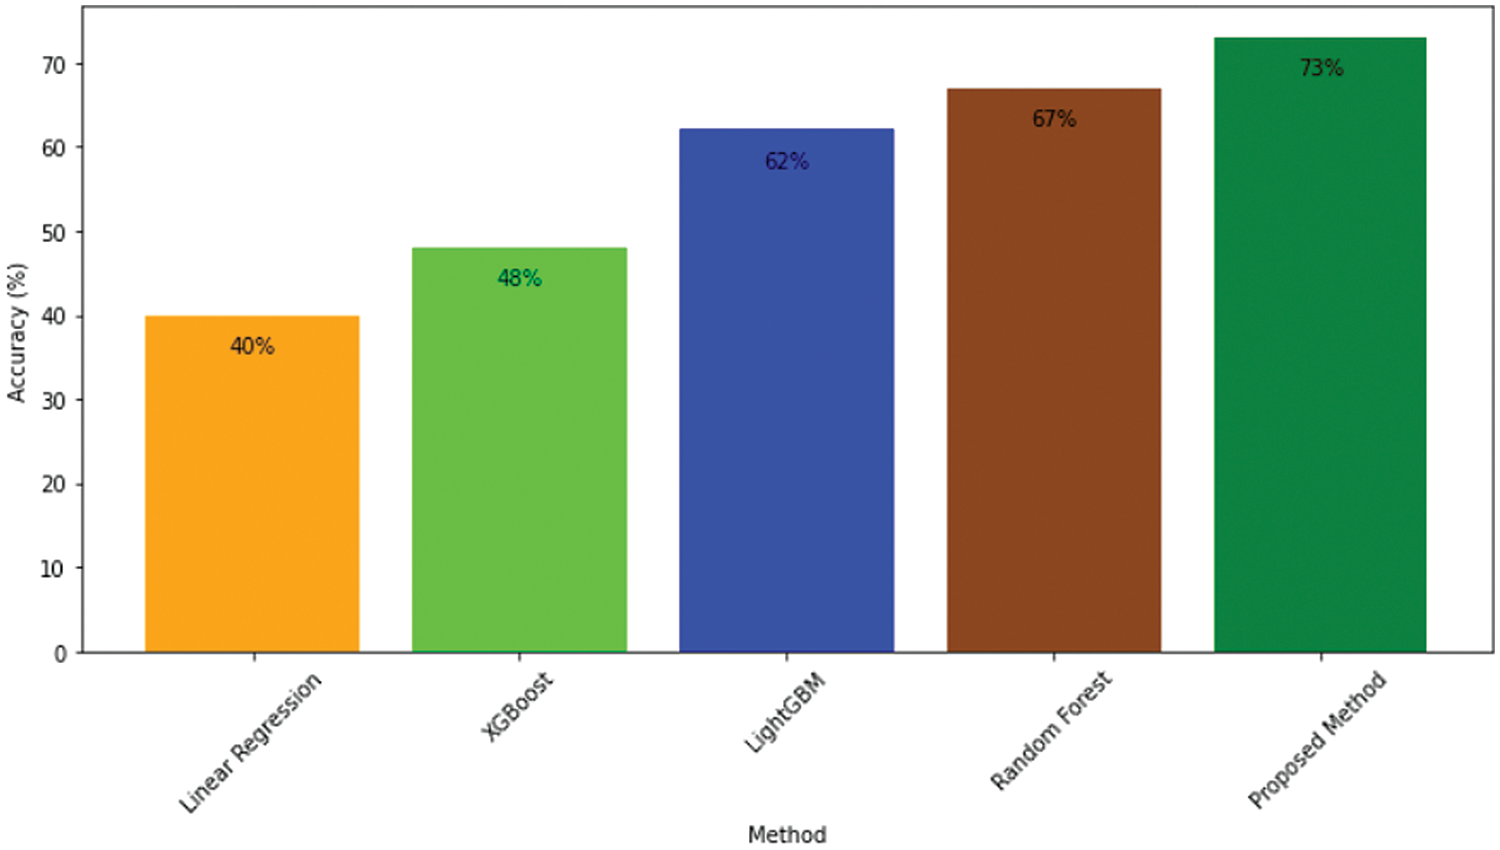
Figure 11: Accuracy comparison of proposed model and other approaches
Sparse categorical crossentropy: We use sparse categorical cross-entropy to penalizes differences between predicted probabilities and actual class labels, ensuring that the model focuses on minimizing classification errors.
Mean squared error: We use the MSE loss function to measure the average squared difference between predicted and actual values, with larger errors penalized more heavily. The training goal is to minimize this value, ensuring model predictions closely match the actual data.
Regression analysis: To predict the exact survival duration of patients, we used two regression models: RFR and MLP Regressor. The RFR was trained with various parameters, such as n_estimators ranging from 150 to 250 and max_depth from 15 to 25. These parameters were fine-tuned using GridSearchCV to find the best configuration for minimizing prediction errors. The MLP regressor, on the other hand, was set up with different hidden layer sizes and trained to predict continuous survival durations using MSE as the loss function, which helps measure the accuracy of predictions. We created an ensemble of the best RFR and MLP regressor models using a voting regressor for the regression task. This ensemble combines the predictions from both models by averaging them, which generally improves the accuracy and reliability of survival duration predictions compared to using a single model alone. We used GridSearchCV to systematically optimize hyperparameters for both classification and regression tasks, improving model performance on new data. Our ensemble approach combines predictions from multiple regression models to enhance accuracy, stability, and robustness in survival duration predictions. We also employed various evaluation metrics to thoroughly assess model performance.
To rigorously assess the segmentation accuracy among various methods, we employed a comprehensive statistical analysis involving both analysis of variance (ANOVA) and Tukey’s honest significant difference (HSD) test. The primary focus was on comparing the dice scores for the whole tumor, core tumor, and enhancing tumor across several methods, including Me-Net, 3D-UNet, HTTU-Net, CNN, CorrDiff, and our proposed method (ResMHA-Net). For each tumor class, we computed various components of an ANOVA test to determine whether there were statistically significant differences in dice scores among these methods. Specifically, we calculated key ANOVA metrics such as the sum of squares total (SST), sum of squares between groups (SSB), sum of squares within groups (SSW), mean squares (between and within groups), f-statistic, and p-value. These components were computed separately for each tumor class (WT, CT, ET) to assess the differences in performance among the segmentation methods. The f-statistic, which measures the variance ratio between groups to the variance within groups, was used to assess the significance of the differences. High f-statistic values suggest that there are meaningful differences between the group means. For our analysis, the f-statistics obtained were 30.9331 for WT, 14.7731 for CT, and 22.0940 for ET, all with p-values less than 0.05. This indicates a very low probability that the observed differences in segmentation accuracy are due to random variation alone, confirming significant differences between at least two methods for each tumor class as shown in Table 4.

To further pinpoint which specific methods showed significant differences, we applied Tukey’s HSD test as a post-hoc analysis. Tukey’s HSD test is designed to perform pairwise comparisons between group means following ANOVA, allowing us to identify which methods differ significantly. This test provided detailed comparisons between all methods, highlighting those with significantly better or worse performance. This approach offered a deeper understanding of the comparative effectiveness of each segmentation method. For each tumor class (WT, CT, ET), we found significant differences involving our proposed method (ResMHA-Net) compared to other methods. Specifically, Tukey’s HSD test results indicated that ResMHA-Net showed significant improvements in dice scores over other methods, demonstrating the robustness and superiority of our approach. The detailed results of the Tukey HSD test are presented in Table 5.

The table includes attributes such as tumor class, which indicates the specific tumor class (WT, CT, or ET); Comparison, which lists the pairwise comparisons between different methods, focusing on comparisons involving our proposed method (ResMHA-Net); p-adj, which is the adjusted p-value for each comparison, accounting for multiple testing to reduce the likelihood of Type I errors; and Reject Null Hypothesis, which indicates whether the null hypothesis (no difference between methods) is rejected for each comparison based on the adjusted p-value. A “Yes” in this column indicates a statistically significant difference between the methods being compared. All comparisons involving our proposed method (ResMHA-Net) show significant differences (p-adj < 0.05), affirming the enhanced performance of our method across all tumor classes. In addition, we extended our statistical analysis to evaluate the accuracy of various survival prediction models, including XGBoost, Linear Regressor, SVR, RF, and the proposed method (voting-based ensemble model). ANOVA was used to assess whether there were significant differences in accuracy among these models. The analysis yielded an f-statistic of 58.4907 with a p-value less than 0.05, confirming that significant differences exist between the models. Following the ANOVA, the Tukey HSD test employed for post-hoc analysis identified significant differences between methods. Our proposed method significantly outperforms the linear regressor, SVR, and XGBoost, while its performance is comparable to RF. Overall, our method demonstrates superior accuracy compared to the other models, as shown in Table 6.

Glioma tumor segmentation in MRI images is critical in medical imaging and neuro-oncology, as it enables precise identification and delineation of tumor regions. Accurate segmentation is essential for treatment planning, tumor progression, and treatment response evaluation. Given the heterogeneous nature of gliomas, which often exhibit varying shapes, sizes, and intensities, an effective segmentation framework is crucial for providing reliable and detailed tumor characterization. In this study, we have introduced an innovative deep-learning framework explicitly designed for segmenting multiclass glioma tumors in MRI images. Based on ResNet blocks with skip connections, our encoder effectively captures hierarchical features while preserving intricate details and addressing challenges associated with deep network training. The decoder utilizes transposed convolutional layers and ResNet blocks to enhance spatial information recovery, thereby improving segmentation accuracy. Integrating multi-head attention mechanism further enhances feature representation, contributing to superior segmentation outcomes. Additionally, we have introduced a multiclass dice coefficient loss function tailored for glioma tumor segmentation, which robustly guides model training by evaluating spatial overlap between predicted and ground truth segmentations. Training and validation were conducted on an NVIDIA A100 80 GB graphics card. Our approach includes a voting-based ensemble for survival prediction, combining insights from multiple models to deliver more reliable prognostic outcomes. The proposed model achieves a rapid two-second inference time and requires only 8 GB of memory, demonstrating its efficient design and resource management. To support such performance, the model is well-suited for deployment on the NVIDIA A100 80 GB graphics card, which provides ample memory and computational power. The A100’s advanced capabilities ensure that the model runs efficiently and easily handles demanding tasks, leveraging its high-bandwidth memory and processing strength. Looking forward, our deep learning framework for multiclass glioma tumor segmentation offers several future directions. These include enhancing attention mechanisms within the network to adapt better to varied tumor characteristics and imaging conditions, developing specialized loss functions to address data challenges, and collaborating with clinicians to validate our model on diverse datasets. Additionally, we plan to include clinical validation and clinician feedback as a critical component in our future work. These efforts aim to refine our approach for better clinical application and patient outcomes in glioma management.
Acknowledgement: The authors would like to acknowledge the Deanship of Research and Graduate Studies at King Khalid University valuable support to this research paper.
Funding Statement: The authors extend their appreciation to the Deanship of Research and Graduate Studies at King Khalid University for funding this work through a Large Research Project under grant number RGP2/254/45.
Author Contributions: Novsheena Rasool: Conceptualization, Methodology, Experimentation, Writing—original draft. Javaid Iqbal Bhat: Conceptualization, Methodology. Najib Ben Aoun: Data Curation, Conceptualization, Validation. Abdullah Alharthi: Investigation, Validation. Niyaz Ahmad Wani: Writing—review & editing, Formal analysis, Visualization. Vikram Chopra: Resources, Supervision. Muhammad Shahid Anwar: Writing—review & editing. All authors reviewed the results and approved the final version of the manuscript.
Availability of Data and Materials: Datasets are available at https://www.med.upenn.edu/cbica/brats2020/data.html (accessed on 10 May 2024).
Ethics Approval: Not applicable.
Conflicts of Interest: The authors declare that they have no conflicts of interest to report regarding the present study.
References
1. P. Marzola, T. Melzer, E. Pavesi, J. Gil-Mohapel, and P. S. Brocardo, “Exploring the role of neuroplasticity in development, aging, and neurodegeneration,” Brain Sci., vol. 13, no. 12, Oct. 2023, Art. no. 1610. [Google Scholar]
2. N. Rasool, J. I. Bhat, N. A. Wani, N. Ahmad, and M. Alshara, “TransresuNet: Revolutionizing glioma brain tumor segmentation through transformer-enhanced residual UNet,” IEEE Access, vol. 12, pp. 72105–72116, May 2024. doi: 10.1109/ACCESS.2024.3402947. [Google Scholar] [CrossRef]
3. E. Komlodi-Pasztor and J. O. Blakeley, “Brain cancers in genetic syndromes,” Curr. Neurol. Neurosci. Rep., vol. 21, pp. 1–10, Nov. 2021. [Google Scholar]
4. N. Rasool and J. I. Bhat, “Unveiling the complexity of medical imaging through deep learning approaches,” Chaos Theory Appl., vol. 5, no. 4, pp. 267–280, Dec. 2023. doi: 10.51537/chaos.1326790. [Google Scholar] [CrossRef]
5. M. Mohamed Musthafa, T. R. Mahesh, V. Vinoth Kumar, and G. Suresh, “Enhancing brain tumor detection in MRI images through explainable ai using grad-cam with ResNet 50,” BMC Med. Imag., vol. 24, no. 1, 2024, Art. no. 107. [Google Scholar]
6. N. Rasool, “Multimodal brain tumor segmentation using 3D-U-Net,” Ind. J. Natural Sci., vol. 14, no. 78, pp. 57473–57480, Jun. 2023. [Google Scholar]
7. A. H. Thias, A. F. Al Mubarok, A. Handayani, D. Danudirdjo, and T. E. Rajab, “Brain tumor semi-automatic segmentation on MRI T1-weighted images using active contour models,” in 2019 Int. Conf. Mechatron., Robotics Syst. Eng. (MoRSE), IEEE, Dec. 2019, pp. 217–221. [Google Scholar]
8. R. Dhabalia, S. V. Kashikar, P. S. Parihar, and G. V. Mishra, “Unveiling the intricacies: A comprehensive review of magnetic resonance imaging (MRI) assessment of T2-weighted hyperintensities in the neuroimaging landscape,” Cureus, vol. 16, no. 2, Feb. 2024. doi: 10.7759/cureus.54808. [Google Scholar] [PubMed] [CrossRef]
9. U. Baid et al., “Overall survival prediction in glioblastoma with radiomic features using machine learning,” Front. Comput. Neurosci., vol. 14, Aug. 2020, Art. no. 61. doi: 10.3389/fncom.2020.00061. [Google Scholar] [PubMed] [CrossRef]
10. N. Rasool and J. I. Bhat, “Brain tumour detection using machine and deep learning: A systematic review,” Multimed. Tools Appl., pp. 1–54, May 2024. doi: 10.1007/s11042-024-19333-2. [Google Scholar] [CrossRef]
11. G. Kumar and H. Alqahtani, “Deep learning-based cancer detection-recent developments, trend and challenges,” Comput. Model. Eng. Sci., vol. 130, no. 3, pp. 1272–1307, Sep. 2022. doi: 10.32604/cmes.2022.018418. [Google Scholar] [CrossRef]
12. D. Zhang et al., “Exploring task structure for brain tumor segmentation from multi-modality MR images,” IEEE Trans. Image Process., vol. 29, pp. 9032–9043, Sep. 2020. doi: 10.1109/TIP.2020.3023609. [Google Scholar] [PubMed] [CrossRef]
13. J. Tie and H. Peng, “Multi-level parallel network for brain tumor segmentation,” Comput. Model. Eng. Sci., vol. 139, no. 1, pp. 741–757, Apr. 2024. doi: 10.32604/cmes.2023.043353. [Google Scholar] [CrossRef]
14. N. A. Wani, R. Kumar, J. Bedi Mamta, and I. Rida, “Explainable AI-driven IoMT fusion: Unravelling techniques, opportunities, and challenges with explainable AI in healthcare,” Inf. Fusion, vol. 110, no. 4, Oct. 2024, Art. no. 102472. doi: 10.1016/j.inffus.2024.102472. [Google Scholar] [CrossRef]
15. K. Kamnitsas et al., “Deepmedic for brain tumor segmentation,” in Brainlesion: Glioma, Mult. Scler, Stroke Trauma. Brain Injuries: Second Int. Workshop, BrainLes 2016, Chall. BRATS, ISLES mTOP 2016, Held Conjunction MICCAI 2016, Athens, Greece, Springer, Oct. 17, 2016, pp. 138–149. [Google Scholar]
16. S. Alqazzaz, X. Sun, X. Yang, and L. Nokes, “Automated brain tumor segmentation on multi-modal MR image using SegNet,” Comput. Vis. Media, vol. 5, no. 2, pp. 209–219, Apr. 2019. doi: 10.1007/s41095-019-0139-y. [Google Scholar] [CrossRef]
17. S. Nema, A. Dudhane, S. Murala, and S. Naidu, “RescueNet: An unpaired GAN for brain tumor segmentation,” Biomed. Signal Process. Control, vol. 55, Jan. 2020, Art. no. 101641. doi: 10.1016/j.bspc.2019.101641. [Google Scholar] [CrossRef]
18. M. Yaqub et al., “State-of-the-art CNN optimizer for brain tumor segmentation in magnetic resonance images,” Brain Sci., vol. 10, no. 7, Jul. 2020, Art. no. 427. doi: 10.3390/brainsci10070427. [Google Scholar] [PubMed] [CrossRef]
19. R. C. Hrosik, E. Tuba, E. Dolicanin, R. Jovanovic, and M. Tuba, “Brain image segmentation based on firefly algorithm combined with k-means clustering,” Stud. Inform. Control, vol. 28, no. 2, pp. 167–176, Jul. 2019. [Google Scholar]
20. A. M. G. Allah, A. M. Sarhan, and N. M. Elshennawy, “Edge U-Net: Brain tumor segmentation using MRI based on deep U-Net model with boundary information,” Expert. Syst. Appl., vol. 213, no. 1, Mar. 2023, Art. no. 118833. doi: 10.1016/j.eswa.2022.118833. [Google Scholar] [CrossRef]
21. N. Rasool and J. I. Bhat, “Glioma brain tumor segmentation using deep learning: A review,” in 2023 10th Int. Conf. Comput. Sustain. Global Develop. (INDIACom), IEEE, Mar. 2023, pp. 484–489. [Google Scholar]
22. L. Sun, S. Zhang, H. Chen, and L. Luo, “Brain tumor segmentation and survival prediction using multimodal MRI scans with deep learning,” Front. Neurosci., vol. 13, Aug. 2019, Art. no. 810. doi: 10.3389/fnins.2019.00810. [Google Scholar] [PubMed] [CrossRef]
23. Z. Zhu, X. He, G. Qi, Y. Li, B. Cong and Y. Liu, “Brain tumor segmentation based on the fusion of deep semantics and edge information in multimodal MRI,” Inf. Fusion, vol. 91, no. 2, pp. 376–387, Mar. 2023. doi: 10.1016/j.inffus.2022.10.022. [Google Scholar] [CrossRef]
24. M. U. Rehman, J. Ryu, I. F. Nizami, and K. T. Chong, “RAAGR2-Net: A brain tumor segmentation network using parallel processing of multiple spatial frames,” Comput. Biol. Med., vol. 152, no. 13, Jan. 2023, Art. no. 106426. doi: 10.1016/j.compbiomed.2022.106426. [Google Scholar] [PubMed] [CrossRef]
25. Y. Cao, W. Zhou, M. Zang, D. An, Y. Feng and B. Yu, “MBANet: A 3D convolutional neural network with multi-branch attention for brain tumor segmentation from MRI images,” Biomed. Signal Process. Control, vol. 80, no. 2, Jan. 2023, Art. no. 104296. doi: 10.1016/j.bspc.2022.104296. [Google Scholar] [CrossRef]
26. R. Malhotra, B. S. Saini, and S. Gupta, “CB-D2RNet—An efficient context bridge network for glioma segmentation,” J. Vis. Commun. Image Represent., vol. 94, no. 4, Jun. 2023, Art. no. 103836. doi: 10.1016/j.jvcir.2023.103836. [Google Scholar] [CrossRef]
27. P. Wu, Z. Wang, B. Zheng, H. Li, F. E. Alsaadi and N. Zeng, “AGGN: Attention-based glioma grading network with multi-scale feature extraction and multi-modal information fusion,” Comput. Biol. Med., vol. 152, no. 7, Jan. 2023, Art. no. 106457. doi: 10.1016/j.compbiomed.2022.106457. [Google Scholar] [PubMed] [CrossRef]
28. Y. Yang et al., “Segmentation method of magnetic resonance imaging brain tumor images based on improved UNet network,” Transl. Cancer Res., vol. 13, no. 3, Mar. 2024, Art. no. 1567. doi: 10.21037/tcr-23-1858. [Google Scholar] [PubMed] [CrossRef]
29. A. Berkley et al., “Clinical capability of modern brain tumor segmentation models,” Med. Phys., vol. 50, no. 8, pp. 4943–4959, Aug. 2023. doi: 10.1002/mp.16321. [Google Scholar] [PubMed] [CrossRef]
30. D. Vinod, S. S. Prakash, H. AlSalman, A. Y. Muaad, and M. B. B. Heyat, “Ensemble technique for brain tumour patient survival prediction,” IEEE Access, vol. 12, pp. 19285–19298, Jan. 2024. [Google Scholar]
31. M. Mazher, A. Qayyum, D. Puig, and M. Abdel-Nasser, “Deep learning-based survival prediction of brain tumor patients using attention-guided 3D convolutional neural network with radiomics approach from multimodality magnetic resonance imaging,” Int. J. Imaging Syst. Technol., vol. 34, no. 1, Jan. 2024, Art. no. e23010. doi: 10.1002/ima.23010. [Google Scholar] [CrossRef]
32. A. Akter et al., “Robust clinical applicable CNN and U-Net based algorithm for MRI classification and segmentation for brain tumor,” Expert. Syst. Appl., vol. 238, no. 12, 2024, Art. no. 122347. doi: 10.1016/j.eswa.2023.122347. [Google Scholar] [CrossRef]
33. G. Wang, W. Li, S. Ourselin, and T. Vercauteren, “Automatic brain tumor segmentation using cascaded anisotropic convolutional neural networks,” in Brainlesion: Glioma, Mult. Scler., Stroke Trauma. Brain Injuries: Third Int. Workshop, Quebec City, QC, Canada, Springer, Sep. 2018, pp. 178–190. [Google Scholar]
34. S. Rosas-Gonzalez, T. Birgui-Sekou, M. Hidane, I. Zemmoura, and C. Tauber, “Asymmetric ensemble of asymmetric U-Net models for brain tumor segmentation with uncertainty estimation,” Front Neurol., vol. 12, Sep. 2021, Art. no. 609646. doi: 10.3389/fneur.2021.609646. [Google Scholar] [PubMed] [CrossRef]
35. M. J. Ali, M. T. Akram, H. Saleem, B. Raza, and A. R. Shahid, “Glioma segmentation using ensemble of 2D/3D U-Nets and survival prediction using multiple features fusion,” in Brainlesion: Glioma, Mult. Scler., Stroke Trauma. Brain Injuries: 6th Int. Workshop, Lima, Peru, Springer, Oct. 4, 2020, pp. 189–199. [Google Scholar]
36. D. Liu, N. Sheng, T. He, W. Wang, J. Zhang and J. Zhang, “SGEResU-Net for brain tumor segmentation,” Math. Biosci. Eng., vol. 19, no. 6, pp. 5576–5590, Mar. 2022. doi: 10.3934/mbe.2022261. [Google Scholar] [PubMed] [CrossRef]
37. J. C. Reinhold, B. E. Dewey, A. Carass, and J. L. Prince, “Evaluating the impact of intensity normalization on MR image synthesis,” in Proc. SPIE-Int. Soc. Opt. Eng., NIH Public Access, Sep. 2019, vol. 10949. [Google Scholar]
38. W. Zhang et al., “ME-Net: Multi-encoder net framework for brain tumor segmentation,” Int. J. Imag. Syst. Technol., vol. 31, no. 4, pp. 1834–1848, Dec. 2021. doi: 10.1002/ima.22571. [Google Scholar] [CrossRef]
39. S. Ali et al., “An improved 3D U-Net-based deep learning system for brain tumor segmentation using multi-modal MRI,” Multimed. Tools Appl., pp. 1–20, May 2024. doi: 10.1007/s11042-024-19406-2. [Google Scholar] [CrossRef]
40. N. M. Aboelenein, P. Songhao, A. Koubaa, A. Noor, and A. Afifi, “HTTU-Net: Hybrid two track U-Net for automatic brain tumor segmentation,” IEEE Access, vol. 8, pp. 101406–101415, May 2020. doi: 10.1109/ACCESS.2020.2998601. [Google Scholar] [CrossRef]
41. Y. Sun and C. Wang, “A computation-efficient CNN system for high-quality brain tumor segmentation,” Biomed. Signal Process. Control, vol. 74, Apr. 2022, Art. no. 103475. [Google Scholar]
42. W. Li, W. Huang, and Y. Zheng, “CorrDiff: Corrective diffusion model for accurate MRI brain tumor segmentation,” IEEE J. Biomed. Health Inform., vol. 28, no. 3, pp. 1587–1598, Jan. 2024. [Google Scholar]
43. M. Islam, V. Vibashan, V. J. M. Jose, N. Wijethilake, U. Utkarsh and H. Ren, “Brain tumor segmentation and survival prediction using 3D attention UNet,” in Brainlesion: Glioma, Multiple Sclerosis, Stroke Trauma. Brain Injuries: 5th Int. Workshop, Shenzhen, China, Springer, Oct. 2020, pp. 262–272. [Google Scholar]
44. F. Behrad and M. S. Abadeh, “Evolutionary convolutional neural network for efficient brain tumor segmentation and overall survival prediction,” Expert. Syst. Appl., vol. 213, no. 10, Mar. 2023, Art. no. 118996. doi: 10.1016/j.eswa.2022.118996. [Google Scholar] [CrossRef]
45. M. -T. Tran, H. -J. Yang, S. -H. Kim, and G. -S. Lee, “Prediction of survival of glioblastoma patients using local spatial relationships and global structure awareness in flair MRI brain images,” IEEE Access, Apr. 2023. doi: 10.1109/ACCESS.2023.3266771. [Google Scholar] [CrossRef]
46. J. J. Van Griethuysen et al., “Computational radiomics system to decode the radiographic phenotype,” Cancer Res., vol. 77, no. 21, pp. e104–e107, Nov. 2017. [Google Scholar] [PubMed]
Cite This Article
 Copyright © 2024 The Author(s). Published by Tech Science Press.
This work is licensed under a Creative Commons Attribution 4.0 International License , which permits unrestricted use, distribution, and reproduction in any medium, provided the original work is properly cited.
 Downloads
 Citation Tools