
 Submit a Paper
 Propose a Special lssue
 Open Access
ARTICLE

Efficient Real-Time Devices Based on Accelerometer Using Machine Learning for HAR on Low-Performance Microcontrollers
1 Faculty of Electrical and Electronic Engineering, Phenikaa University, Hanoi City, 100000, Vietnam
2 Institute of Information Technology, Vietnam Academy of Science and Technology, Hanoi City, 100000, Vietnam
3 Faculty of Information Technology and Communication, Phuong Dong University, Hanoi City, 100000, Vietnam
4 Graduate University of Sciences and Technology, Vietnam Academy of Science and Technology, Hanoi City, 100000, Vietnam
5 International School–Vietnam National University, Hanoi City, 100000, Vietnam
* Corresponding Authors: Nguyen Ngoc Linh. Email: ; Duc-Tan Tran. Email:
Computers, Materials & Continua 2024, 81(1), 1729-1756. https://doi.org/10.32604/cmc.2024.055511
Received 28 June 2024; Accepted 14 September 2024; Issue published 15 October 2024
 View Full Text
 Download PDF
Abstract
Analyzing physical activities through wearable devices is a promising research area for improving health assessment. This research focuses on the development of an affordable and real-time Human Activity Recognition (HAR) system designed to operate on low-performance microcontrollers. The system utilizes data from a body-worn accelerometer to recognize and classify human activities, providing a cost-effective, easy-to-use, and highly accurate solution. A key challenge addressed in this study is the execution of efficient motion recognition within a resource-constrained environment. The system employs a Random Forest (RF) classifier, which outperforms Gradient Boosting Decision Trees (GBDT), Support Vector Machines (SVM), and K-Nearest Neighbors (KNN) in terms of accuracy and computational efficiency. The proposed features Average absolute deviation (AAD), Standard deviation (STD), Interquartile range (IQR), Range, and Root mean square (RMS). The research has conducted numerous experiments and comparisons to establish optimal parameters for ensuring system effectiveness, including setting a sampling frequency of 50 Hz and selecting an 8-s window size with a 40% overlap between windows. Validation was conducted on both the WISDM public dataset and a self-collected dataset, focusing on five fundamental daily activities: Standing, Sitting, Jogging, Walking, and Walking the stairs. The results demonstrated high recognition accuracy, with the system achieving 96.7% on the WISDM dataset and 97.13% on the collected dataset. This research confirms the feasibility of deploying HAR systems on low-performance microcontrollers and highlights the system’s potential applications in patient support, rehabilitation, and elderly care.Keywords
Over the last several decades, significant advancements have been made in HAR research, driven by its wide range of applications [1]. Increasingly, practical challenges necessitate solutions rooted in activity recognition, including those in healthcare [2,3], fall detection [4,5], and industry [6], among others. By gathering user behavior data, activity recognition technology enables diverse interaction methods, empowering systems to proactively assist users in their tasks [7].
The goals of HAR include representing human activities posture in multiple videos or sensor data, analyzing interactive objects, understanding the semantics of actions, and ultimately enabling the computer to comprehend the activities sequence like humans do [8–12]. Three typical approaches to HAR are: i) computer vision-based methods [8,9], ii) methods utilizing environmental interaction sensors [10], and iii) methods employing wearable sensors [11,12]. With vision-based HAR, the data obtained from the camera is processed including the following steps: Data Preprocessing, Object Segmentation, Feature Extraction and Activity Classification Deployment [13]. Due to the vast demand and economic value that vision-based HAR brings, in the past few decades, many researchers have proposed many video-based HAR technologies, which can rapidly detect human activity using video and motion sensors. However, in vision-based HAR, there are factors that affect accuracy such as angle, shadow of the object, light intensity, and especially privacy issues of individuals that need to be considered [14,15]. In contrast, smartphones and wearable sensors can overcome this privacy problem and can be widely used for HAR [16–19].
HAR sensors can be broadly classified into wearable, and environmental [10–12]. Each sensor type has its own advantages and applications [20]. Due to the rapid development of wireless sensor networks, a large amount of data has been collected for HAR using different types of sensors [21].
Based on research on sensor technology and activity patterns [22,23], researchers have proposed many HAR methods using various sensors each other, including an accelerometer, gyroscope, magnetometer (for orientation), barometer (for altitude change), and heart rate monitor. Accelerometers have been widely used thanks to their ability to capture information about a subject is acceleration and velocity, which is very suitable for various human physical activities [24–27]. For instance, Bao et al. [24] used five small biaxial accelerometers worn on different body parts (e.g., limbs and hip) to collect sensor data while volunteers performed twenty daily activities like walking, standing, and sitting, .... They extracted features from both the time and frequency domains of the accelerometer data and built a classification model to recognize these activities. By comparing different classifiers, they found that a decision tree achieved the best performance with an accuracy of 84.0% [24]. However, it’s important to note that accuracy in HAR can be influenced by factors like individual body types or sensor placement. The system HAR cannot only recognize activities routine but also gauge the intensity of activities. Tapia et al. [28] achieved this with a real-time system using five accelerometers and a heart rate monitor, boasting an impressive 94.6% accuracy when tailored to the specific user. However, 56.3% subject-independent accuracy, and 80.6% accuracy without differentiating the activity intensities. While studies like [29,30] showed that more sensors often lead to better results, researchers are grappling with a trade-off: accuracy vs. user comfort. After all, bulky setups become a burden, hindering long-term adoption. This is why there is increasing research into developing HAR systems based on a single sensor [31].
The studies are increasingly exploring methods that utilize a single accelerometer for activity recognition [32]. For example, Ravi et al. [33] conducted a study to explore this possibility, using a single tri-axial accelerometer mounted on the pelvic region to collect data for eight activities including standing, walking, running, climbing stairs (both up and down), sitting, vacuuming, and brushing teeth. Their findings demonstrate the potential of single-sensor HAR for recognizing a wide range of everyday activities. They proposed a meta-level classifier combining decision table, Decision Tree (DT), KNN, SVM, and Naïve Bayes. The experiments are extended across four different dataset settings, achieving improved performance compared to with base-level classifier. Similarly, Gupta et al. [34] investigated feature selection for activity recognition using a belt-worn accelerometer. Their findings suggest that a wrapper-based approach and feature selection outperforms a filter-based approach when combined with Naïve Bayes and KNN classifiers. The classification outcomes showed over 95% accuracy across 6 activities. Their work’s limitation was the data collection involved only 7 participants (between the ages of 22 and 28). In [35], the authors used a single accelerometer (tri-axis) for HAR. In their research, the accelerometer had to be attached to the chest of an individual in a specific orientation. They proposed a hierarchical prediction model to classify static, dynamic, and transitional activities, applying the model to recognize activities in a natural setting. The overall accuracy reached up to 97.9%, classifying 15 behaviors. However, when tested across 5 different locations, the accuracy of the system declined by 47%. The authors in [36] concentrated on classifying 6 distinct walking styles using a mobile-based accelerometer and an IMU sensor. Furthermore, the WISDM activity dataset was utilized for validation [37]. Deep learning models effectively classify more activities with a very high accuracy rate [24,36]. Huang et al. conducted two studies on HAR using wearable sensors with CNNs [38,39]. Both studies were conducted on the Raspberry Pi Model 3 B+ platform and presented improvements that resulted in superior classification performance (with both studies achieving approximately 99% accuracy). However, deep learning models have a certain computational complexity, causing longer run times and more resource usage [40]. Therefore, using deep learning models on low-cost, low-performance microcontroller is not feasible. Machine learning (ML) models still have the potential to be used for real-time classification of human activities with lower computation and significantly shorter execution times [41].
This work of paper is to harness the capabilities of these body-worn sensors in HAR. The following are the main challenges encountered during the research of HAR systems that utilize wearable sensor devices:
– Challenge 1: The computational complexity of the algorithm is significantly high, which hinders the design of a device capable of accurately recognizing real-time activity.
– Challenge 2: In instances where the low-performance processor is unable to directly recognize the device, unprocessed data is transmitted to the server. This could potentially lead to communication errors. Conversely, the use of high-performance microcontrollers results in escalated costs.
The study addresses the challenge of real-time human activity recognition (HAR) using accelerometer sensors on low-cost, low-performance microcontrollers. This research distinguishes itself by focusing on the efficient deployment of computationally simple algorithms for real-time activity classification. The proposed system aims to support the health care of patients during the recovery period or for the elderly. The main contributions of this paper are outlined as follows:
– Contribution 1: This research examines the viability of implementing a low-complexity algorithm on low-performance microcontrollers to solve the HAR problem. The RF algorithm is embedded directly onto the microcontroller, enabling real-time activity classification. RF is selected for its balance between accuracy and computational efficiency, making it well-suited for resource-constrained devices. By leveraging the simplicity of accelerometer data and the efficiency of RF, the system achieves effective and cost-efficient activity recognition, even on low-cost microcontrollers. Similar to the methods used in studies [2,3], the model is trained on high-performance machines, after which the optimized algorithm is embedded into the microcontroller.
– Contribution 2: Optimized Activity Selection and Feature Extraction. Five key activities—Standing, Sitting, Jogging, Walking, and Walking the stairs—were meticulously selected based on their relevance and frequency in daily life. Recognizing the potential confusion between Upstairs and Downstairs in the data, these activities were combined into a single category. This strategic selection enhances the accuracy and reliability of the classification system. Additionally, the feature extraction process is tailored to the constraints of low-performance microcontrollers, ensuring the system’s efficiency and effectiveness.
– Contribution 3: A cost-effective HAR system with real-time capabilities. This system integrates electronic circuits, signal processing, and ML models to enable immediate action recognition. The process includes several steps: i) data collection; ii) data preprocessing; iii) feature extraction; iv) direct classification of actions on the microcontroller; v) efficient wireless transmission to a compact server to ensure real-time processing.
The remainder of this paper is structured as follows:
– Section 1: Discussion of related research work and problems of the proposed system.
– Section 2: Presentation of materials and methods to describe the system model. The proposed method uses a classifier RF with low-complexity and is suitable for the activity recognition problem of the study. The proposed features AAD, STD, IQR, Range, and RMS.
– Section 3: Evaluation and discussion of system performance with five selected activities.
– Section 4: Conclusion of the article.
2.1 Activities Recognition Model
In this work, a supervised learning method will be implemented to achieve higher accuracy [42]. The comprehensive system methodology encompasses three stages: 1) the gathering of data; 2) the analysis of the model; 3) the identification of activities, which includes both implementation and evaluation. This process is depicted in Fig. 1.
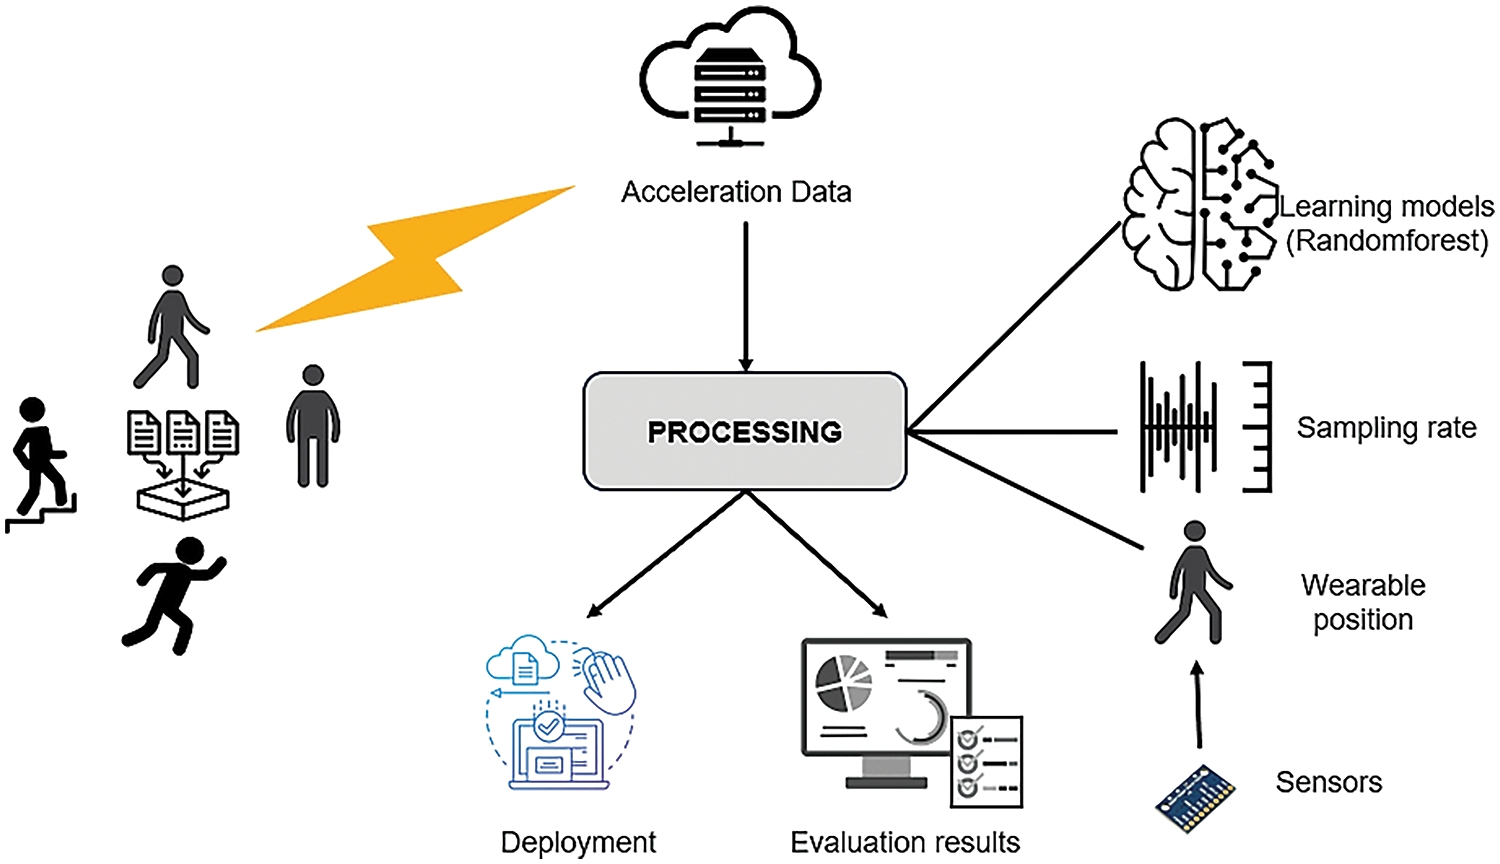
Figure 1: The activity recognition process
In the first stage of the study, acceleration data is collected from the proposed device to classify activities. Specifically, data are gathered along three axes (referred to as Ax, Ay, and Az). In the next stage, the data is segmented into smaller chunks. Using a sliding window technique, the timeline is traversed, meticulously recording a variety of information related to the activity in question. Each vector derived from these segments combines a multitude of features painstakingly extracted from the data, setting the stage for the following phase. The next phase focuses on the careful selection of relevant features, which will then be used as input to the classifier.
The final stage encompasses both implementation and evaluation, wherein the features chosen in the previous step are input into the training process, facilitating the construction of a robust classification model. Leveraging the knowledge embedded in this model, classifiers are then deployed to perform highly accurate recognition of activities.
This study proposes a system consisting of an accelerometer, a cost-effective Inertial Measurement Unit (IMU), and a wireless connector for bidirectional data transmission into a wearable device on a can. This device supports direct data transfer to a smartphone (in this study the smartphone used operates on the Android platform). The system was designed to significantly minimize user inconvenience during the data recording process. The structure of the proposed system is depicted in Fig. 2.
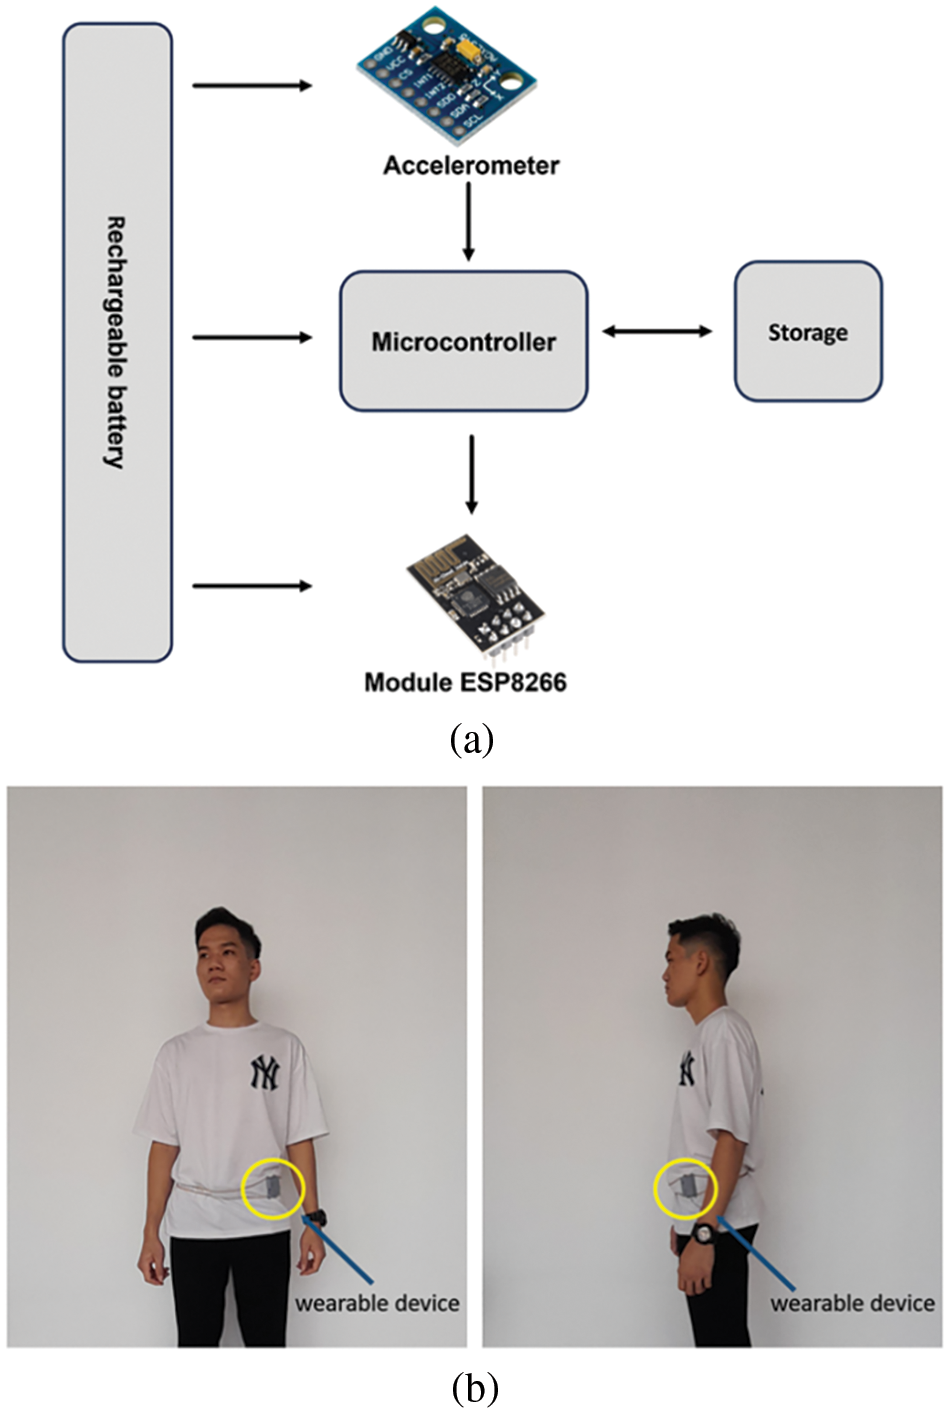
Figure 2: The proposed system (a) and the wearable device worn by volunteers (b)
The proposed system in this study integrates a 3-DOF ADXL345 accelerometer to measure motion data. To ensure that all activities in the study could be measured, the parameters of the ADXL345 sensor were used, with a full scale of ± 4 g, a sensitivity of 128 LSB/g, and a noise level of 150 μg. This setup allows the collection of motion data on three-axis: Ax, Ay, and Az. The ADXL345 3-DOF sensor is connected to the PIC18F4520 microcontroller via an I2C interface. Additionally, through UART communication, the ESP8266 Module is interfaced with the MCU for data transmission. The device is powered by a 3.7 V–6000 mAh battery and is rechargeable.
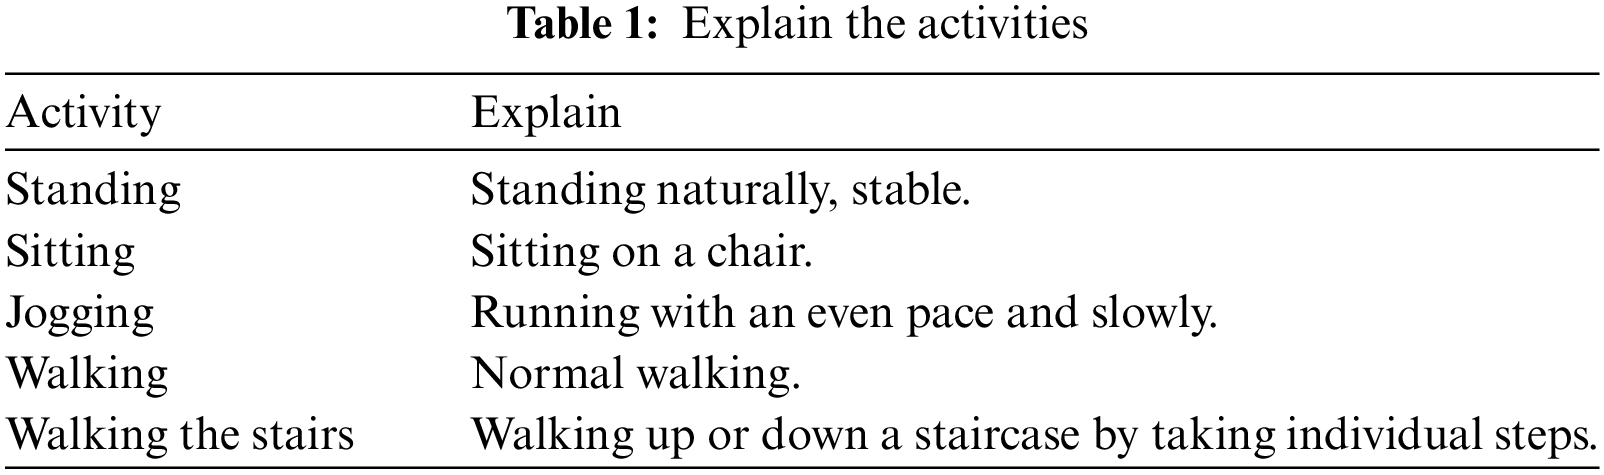
The testing was conducted on a Dell XPS-9310 laptop equipped with a 4.2 GHz processor and 8 GB of RAM. Experimental data recording was carried out with a group of 14 students (7 men and 7 women), aged between 18–22 years, with heights ranging from 1.5–1.9 m and weights between 42–67 kg, selected from Phenikaa University in Vietnam. Additionally, two individuals aged 65 and 72, with heights of 1.4 and 1.46 m and weights of 42 and 46 kg, respectively, were included to collect data on activities. The sampling frequency of the proposed device worn at the waist is 50 Hz. Five states were collected: Standing for 40 min, Sitting for 30 min, Jogging for 10 min, Walking for 22 min, and Walking the stairs for 44 min. To evaluate the performance of the algorithm, the WISDM dataset was utilized [29]. A detailed explain of the activities is presented in Table 1 below.
Following the construction of the model as detailed in Fig. 1 and the development of hardware devices that fulfill the model’s requirements as shown in Fig. 2a, the model will be trained, and the action classification algorithm will then be embedded in the microcontroller on wearable devices. The central processor in the proposed device is a PIC18F4520 microcontroller. Once installed, the devices will be attached at the waist of the volunteers.
This research focuses on developing optimized algorithms for low-performance, cost-effective microcontrollers (Tiny Machine Learning) to operate within embedded systems and Internet-of-Things (IoT) devices. Specifically, the algorithm is embedded into the device in the study to be able to perform real-time activity recognition. In this study, the microcontroller served as the Central Processing Unit (CPU) for the embedded device, therefore, programming wearable devices to recognize activities in real-time was very important. Real-time identification involved considerations for algorithmic complexity and memory requirements. As a result, on wearable devices in real-time, a ML algorithm like RF is well-suited for deploying HAR. RF leverages randomness in both sampling and feature selection to build diverse decision trees (DTs) and combines their predictions through majority voting, improving the accuracy and robustness of the model [43]. In this algorithm, the DTs were constructed based on the trained data, which provided feature thresholds for creating binary DTs. The implementation of the RF algorithm on devices is carried out in the following steps: In the setup phase, variables (from the ADXL345 library) were first declared to establish thresholds for distinguishing between motor and non-motor activities, set values for tap and double tap, threshold, and free-fall time, and set interrupts. In the Loop phase, the model determined which activity was occurring. RF algorithm with approximately 100 decision trees analyzes accelerometer data and classifies the activities. From the training process, the thresholds were derived. This process occurs every 5 s to deliver real-time results while maintaining low computational complexity. The RF algorithm flowchart for real-time classification is illustrated in Fig. 3 below.
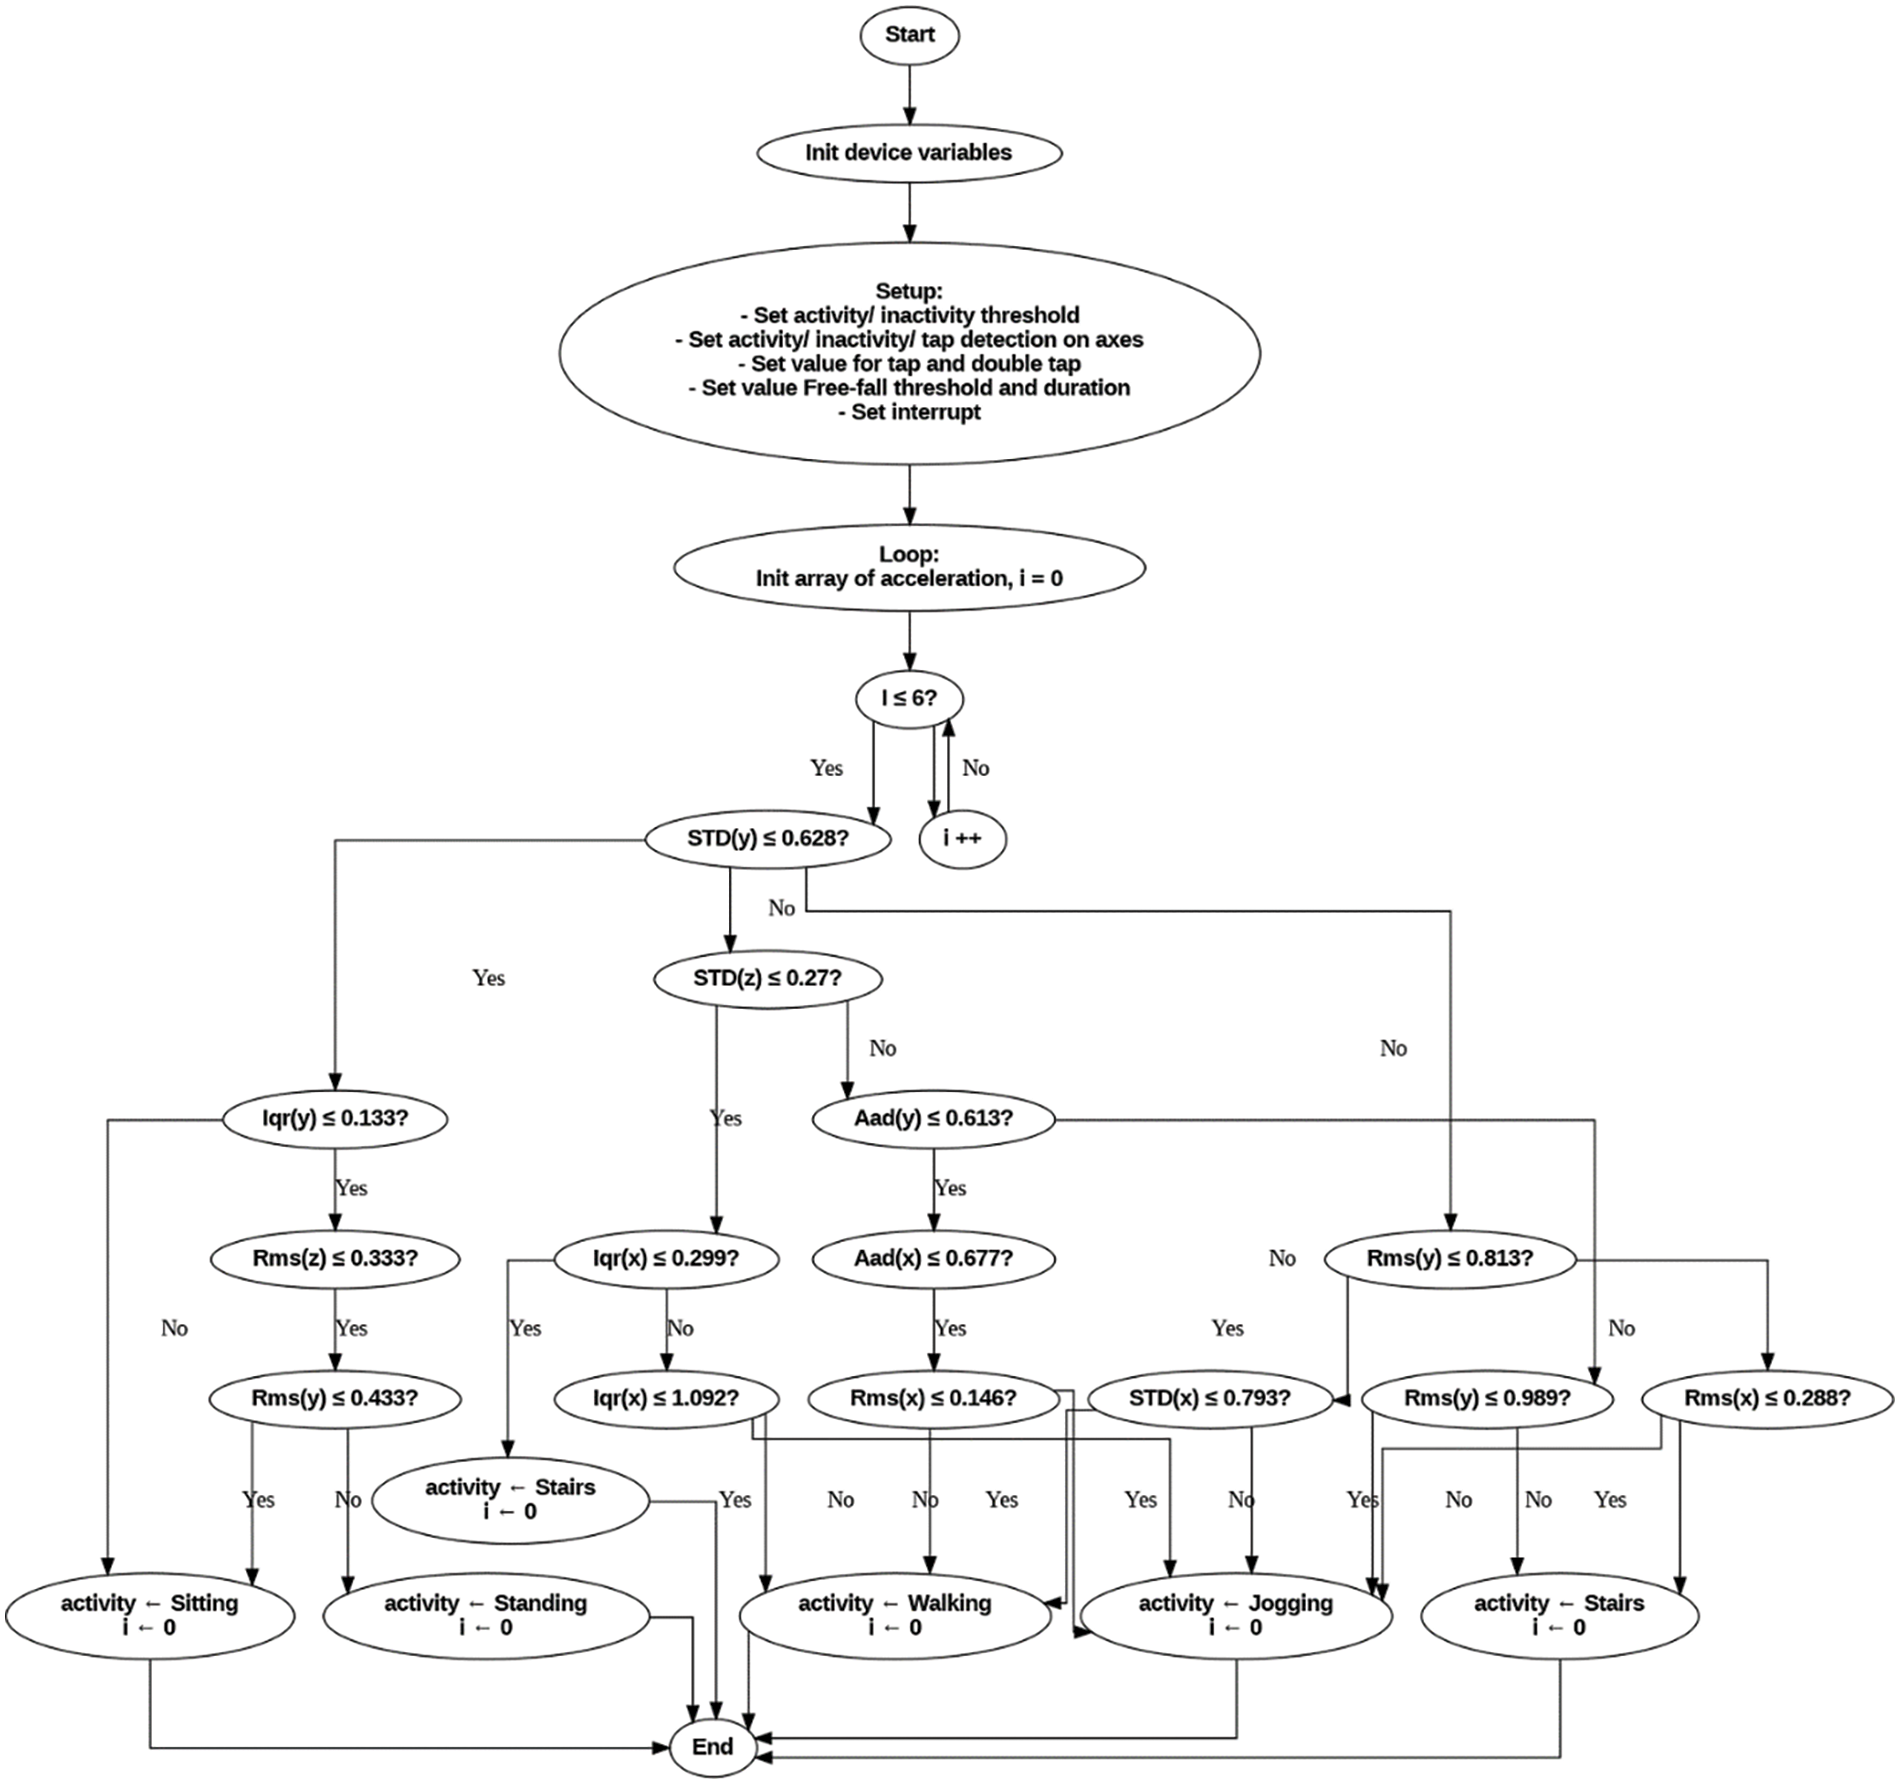
Figure 3: Embedded program for real-time activity classification
Following the reception of data from the accelerometer, it was synthesized and used to analyze activity features. The data was then segmented into smaller parts, each containing information related to the activity. This segmentation is necessary due to the sequential nature of activities, which complicates the definition of activity boundaries.
This study segmented the data using a sliding window due to its simplicity and suitability for real-time activity classification research [44]. In this case, the signal of the 3-DOF ADXL345 accelerometer is divided into time windows of fixed size. The selection of window size has a direct impact on the system’s recognition performance. To determine the most optimal window size, experiments were conducted with windows of varying sizes ranging from 1 to 22 s, with overlapping intervals of 0% to 95%.
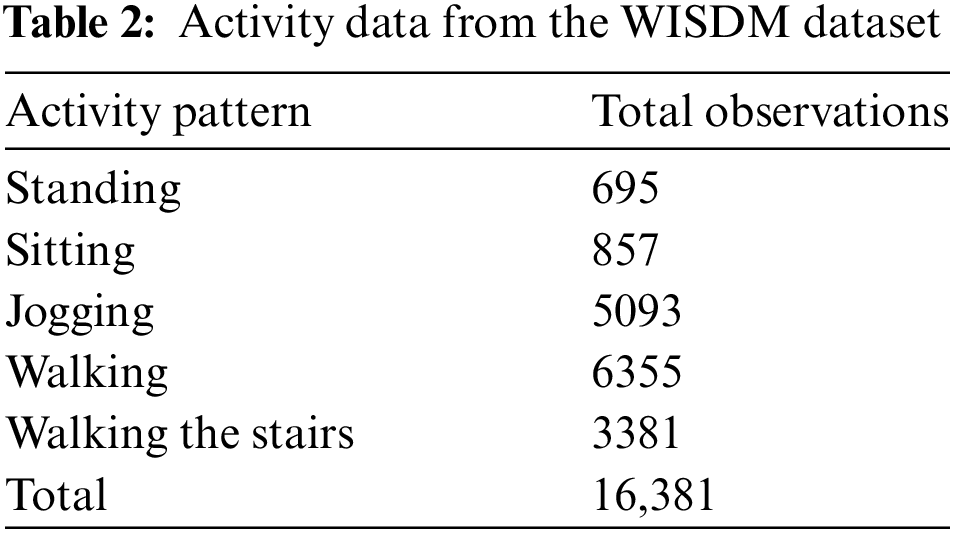
Initial data analysis was performed using the WISDM dataset [29]. This dataset provides movement data for daily activities, captured by the accelerometer of a smartphone. In this study, the volunteers put the phone in their pocket and the user performed the correct actions during the test. Table 2 shows the total number of observations of activities from the WISDM dataset using a sliding window size of 8 s and an overlap ratio of the windows of 40%. The dataset collected from 36 volunteers includes five activities: Standing, Sitting, Jogging, Walking, and Walking the stairs. The extracted dataset includes a total of 16,381 observations.
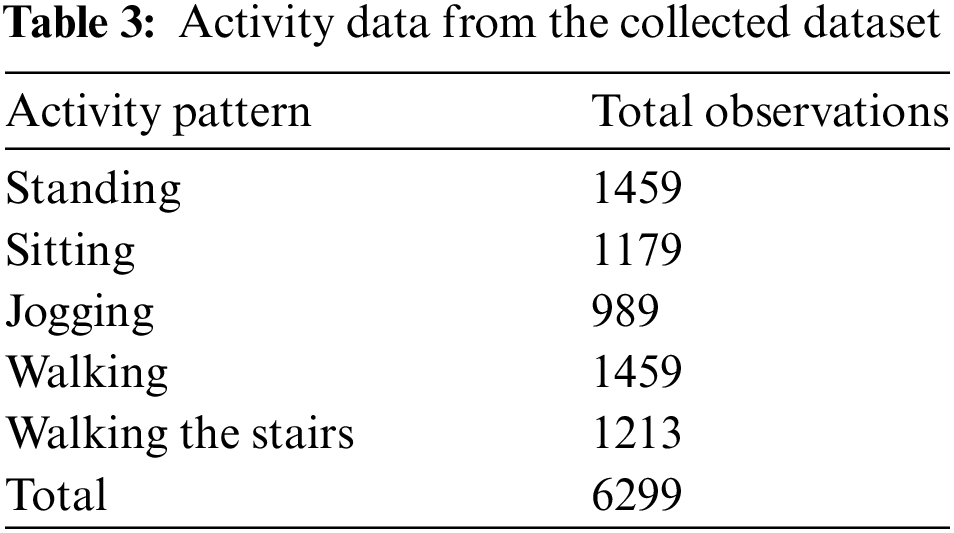
During the testing phase, 16 volunteers performed the activities in Table 1 while the device was worn on their waist (as depicted in Fig. 2b). Table 3 showcases the number of operations from the collected dataset using a window size of 8 s (with a 40% overlap). The extracted dataset from this process comprises a total of 6299 observations.
To achieve high classification performance, selecting features with activity information is extremely important Fig. 4 depicts the data distribution from the initial 200 data samples collected from the X-axis acceleration of each activity (in the collected dataset). This illustration aids in scoping and selecting appropriate features for activity classification.
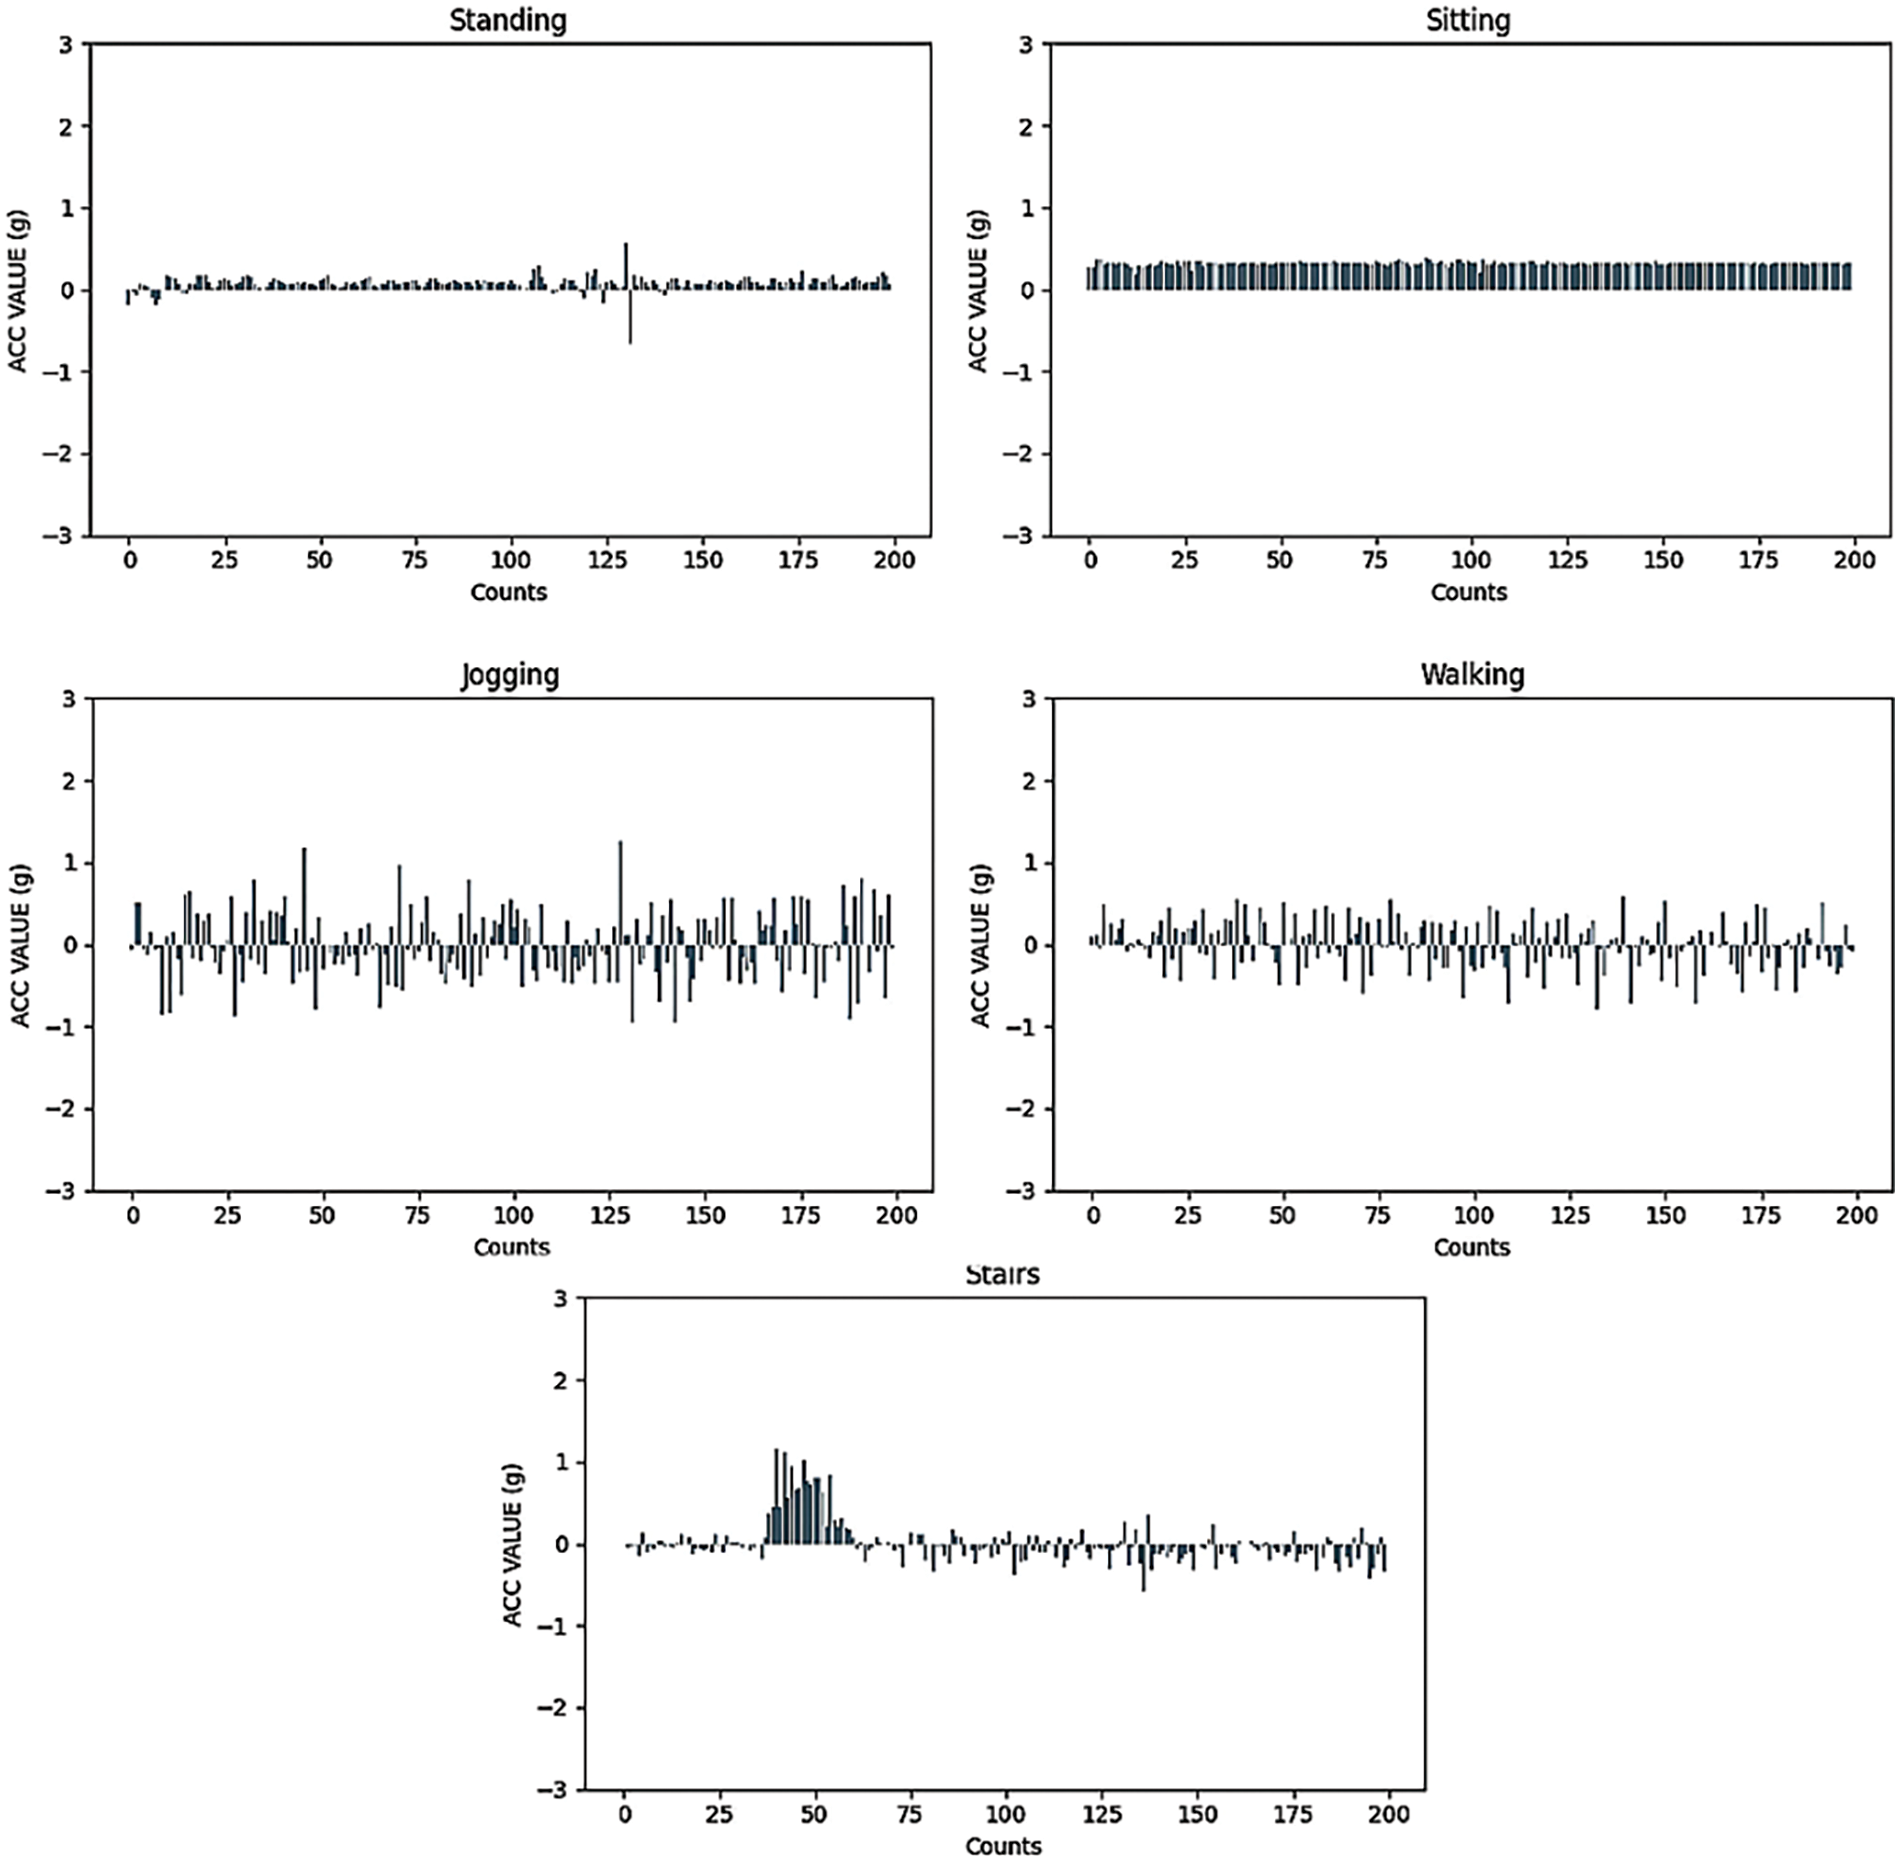
Figure 4: The histogram depicts a portion of data along the X-axis
In this study, data was collected from volunteers with careful attention to consistency. The volunteers we selected share similar characteristics such as age, height, and weight. During the collection process, they performed the exact activities under close supervision, ensuring uniformity across the data. Consequently, the differences between the data from male and female groups, as well as between young and elderly groups, are minimal. While Fig. 4 presents a blended distribution of data from multiple participants, Fig. 5 shows a portion of movement data along the X-axis from a participant in the collected dataset. A comparison between Figs. 4 and 5 reveals that the amplitude variations on the X-axis are not significantly different between these two instances, reflecting the controlled conditions under which the data was gathered.
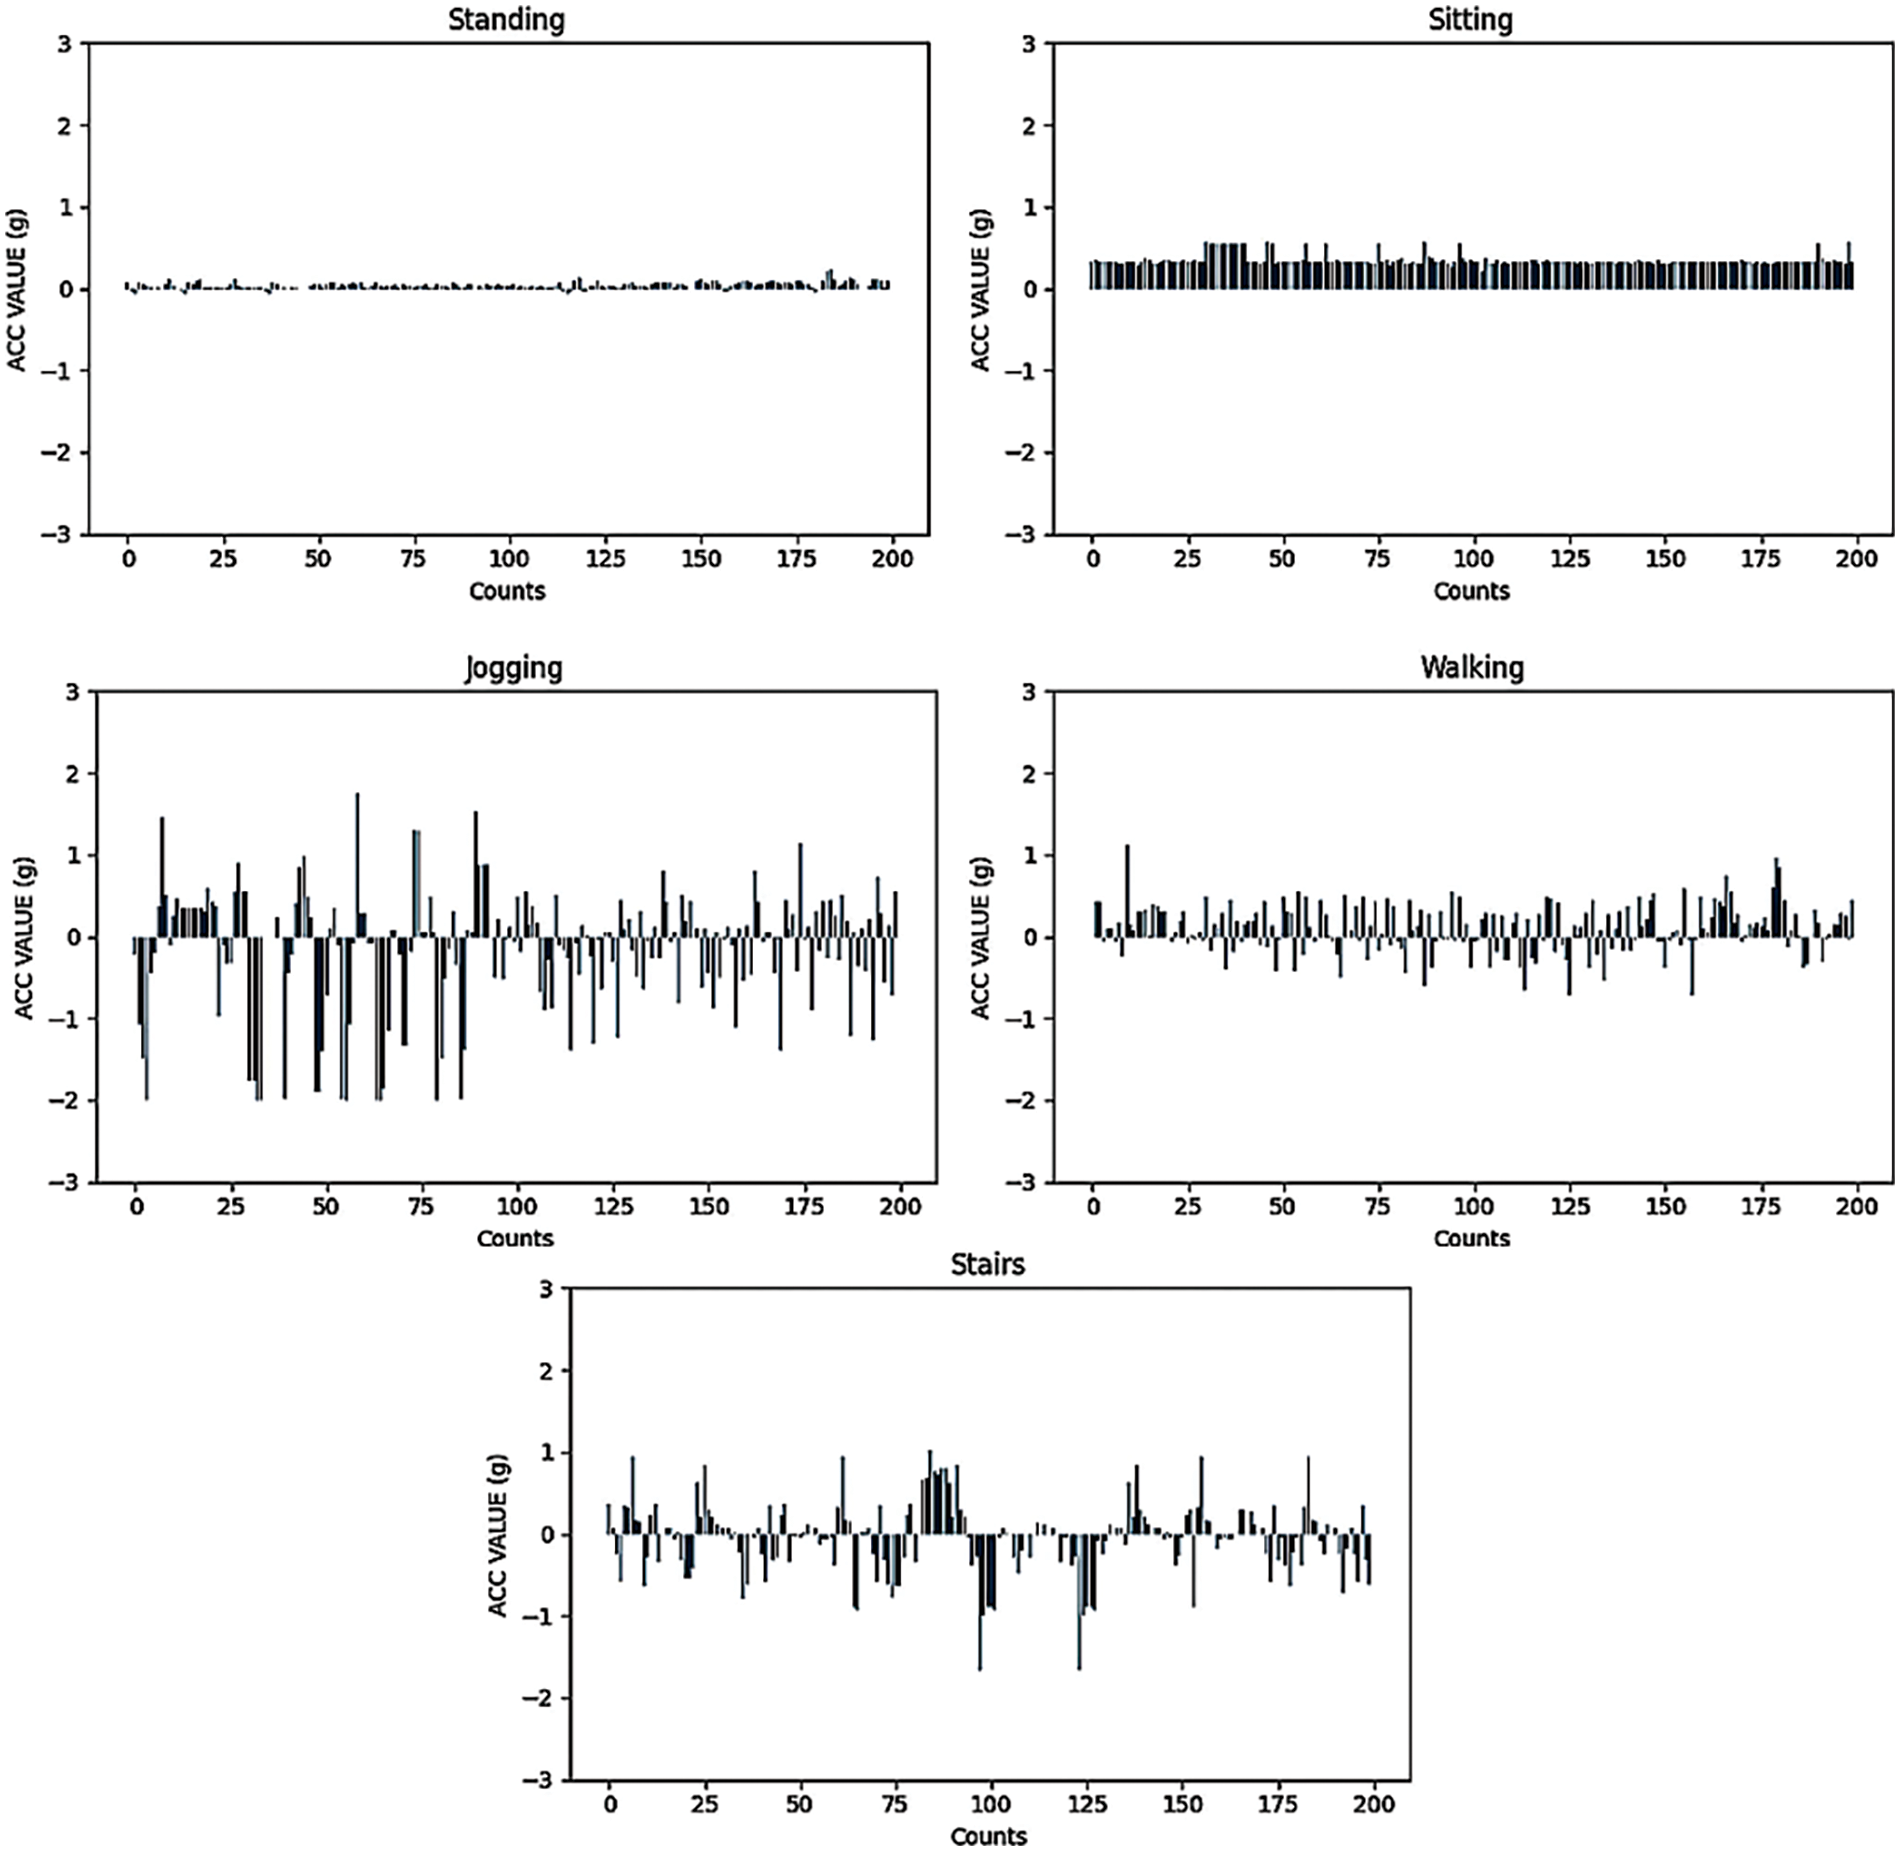
Figure 5: The histogram depicts a portion of movement data of a person along the X-axis
From Fig. 4, it remains evident that static states such as Standing and Sitting are characterized by values confined to a specific, narrow range. For instance, Standing predominantly featured approximately 150 data points concentrated around Ax ≈ 0 g (with 1 g equal to 9.8 m/s2), while Sitting exhibited nearly 190 data points along the X-axis at 0.14 g. Consequently, two key features, namely AAD and IQR, were chosen to assess data concentration, effectively distinguishing static states from dynamic ones, and even differentiating between different static states. On the other hand, moving states such as Walking, Jogging, and Walking the stairs have a significantly different range of values compared to static states. As a result, the Range was selected as a suitable measure to capture the distinctions between the highest and lowest values among these dynamic states.
Additionally, referring to Fig. 4, it can be noticed that among the motion states, Walking and Walking the stairs show a significant concentration of values between 0 and 1.5 g and gradually sparse values towards the boundary, while the values for Jogging show a more even distribution. Effectively capturing the differences between these dynamic operations, STD emerges as a valuable feature for quantifying data propagation.
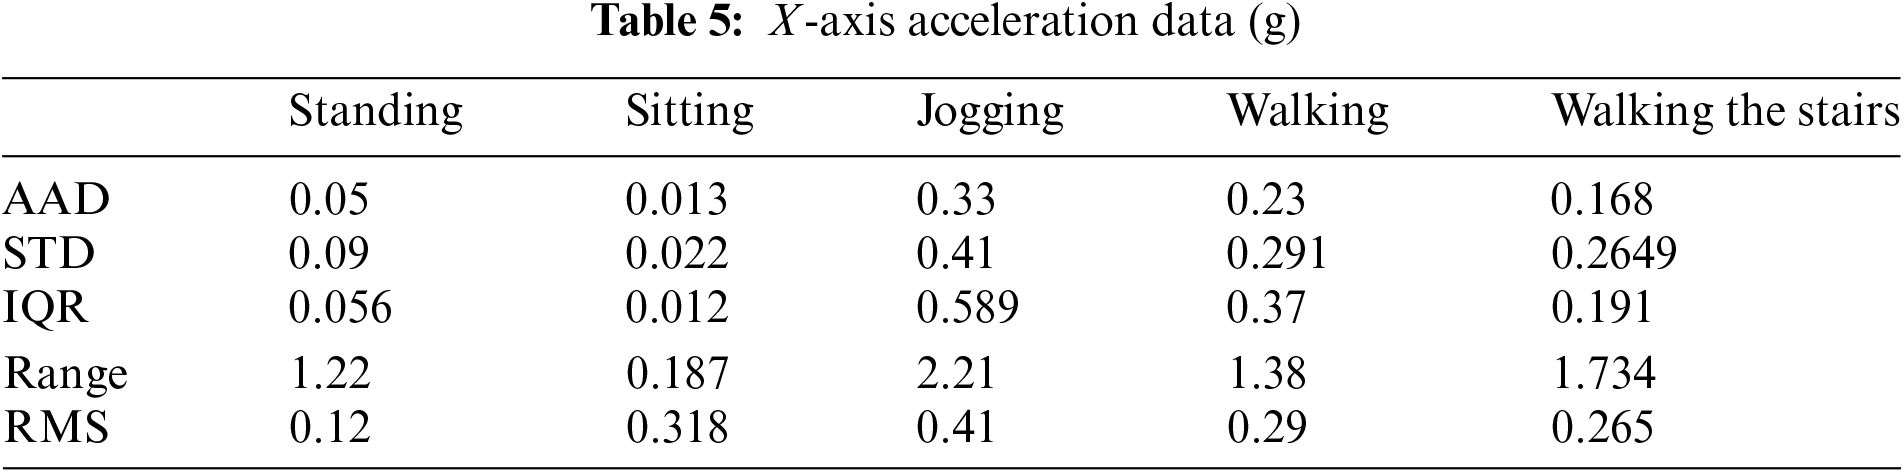
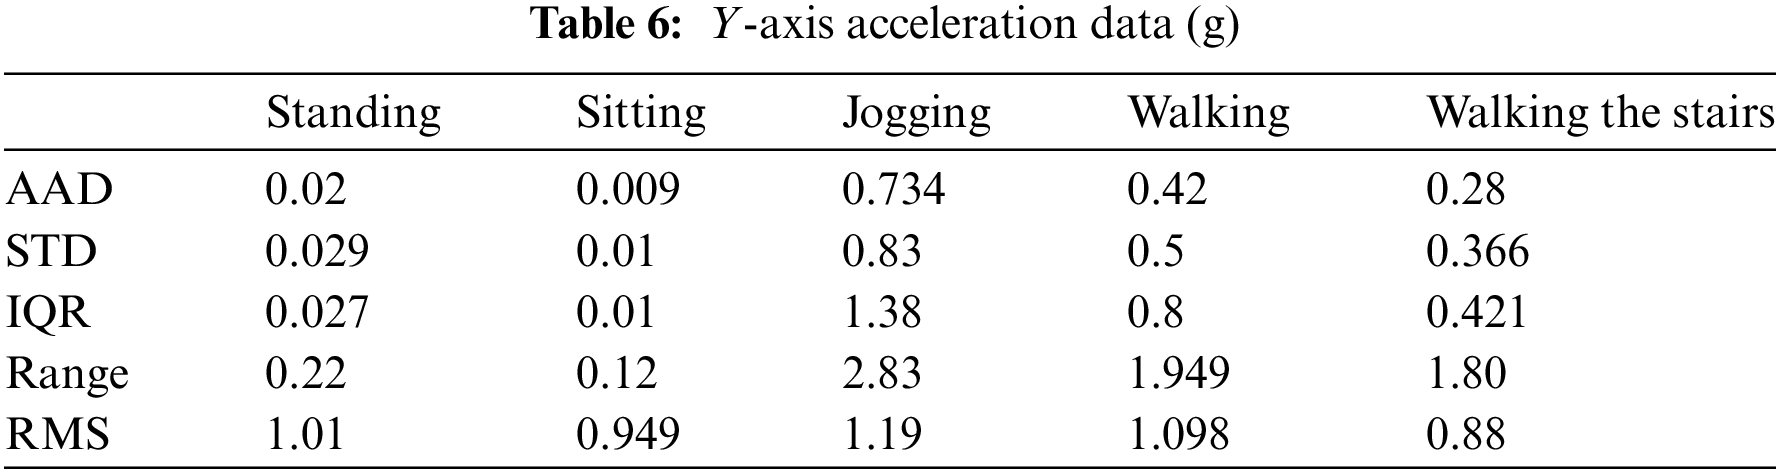
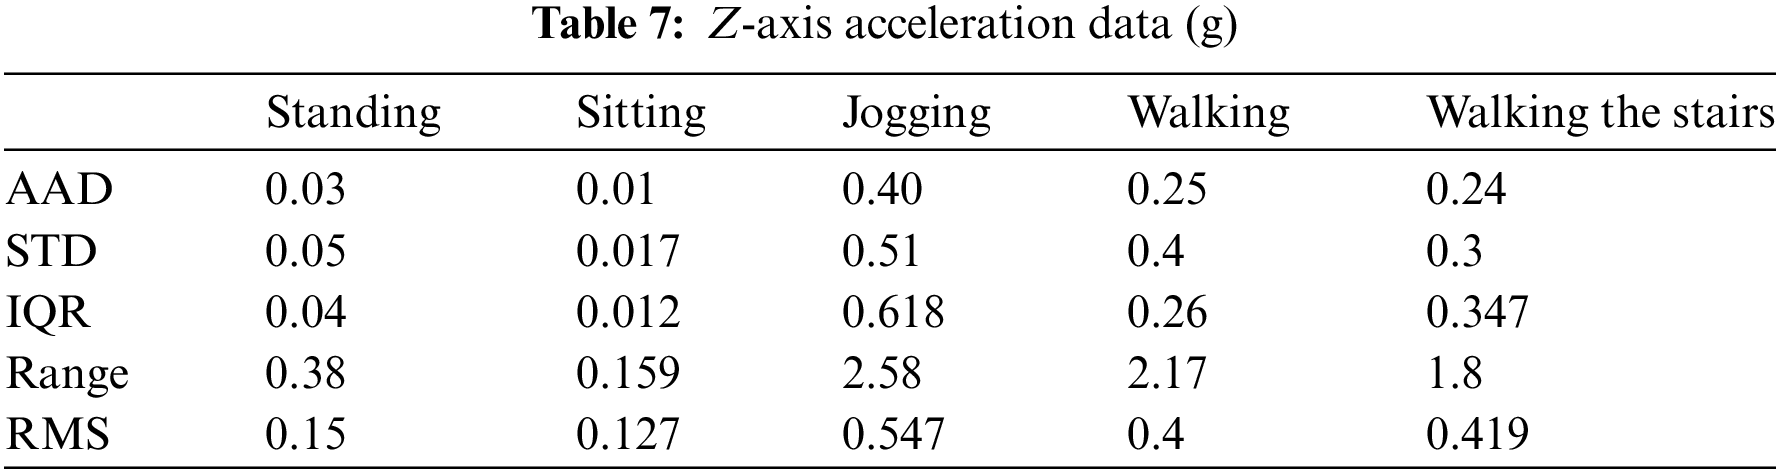
Furthermore, Standing, Jogging, and Walking the stairs consistently featured a higher number of data points around Ax ≈ 0 g compared to Sitting and Walking. Therefore, the choice of RMS was suitable for characterizing all five of these activities. In summary, the five features selected for this study were AAD, STD, IQR, Range, and RMS. Table 4 presented the formulas of the five features AAD, STD, IQR, Range, and RMS calculated on the X-axis, Y-axis, and Z-axis applying the same formulas. Tables 5 to 7 gave the results of the acceleration data calculated according to the AAD, STD, IQR, Range, and RMS statistical features for operations in all three dimensions (X, Y, and Z).
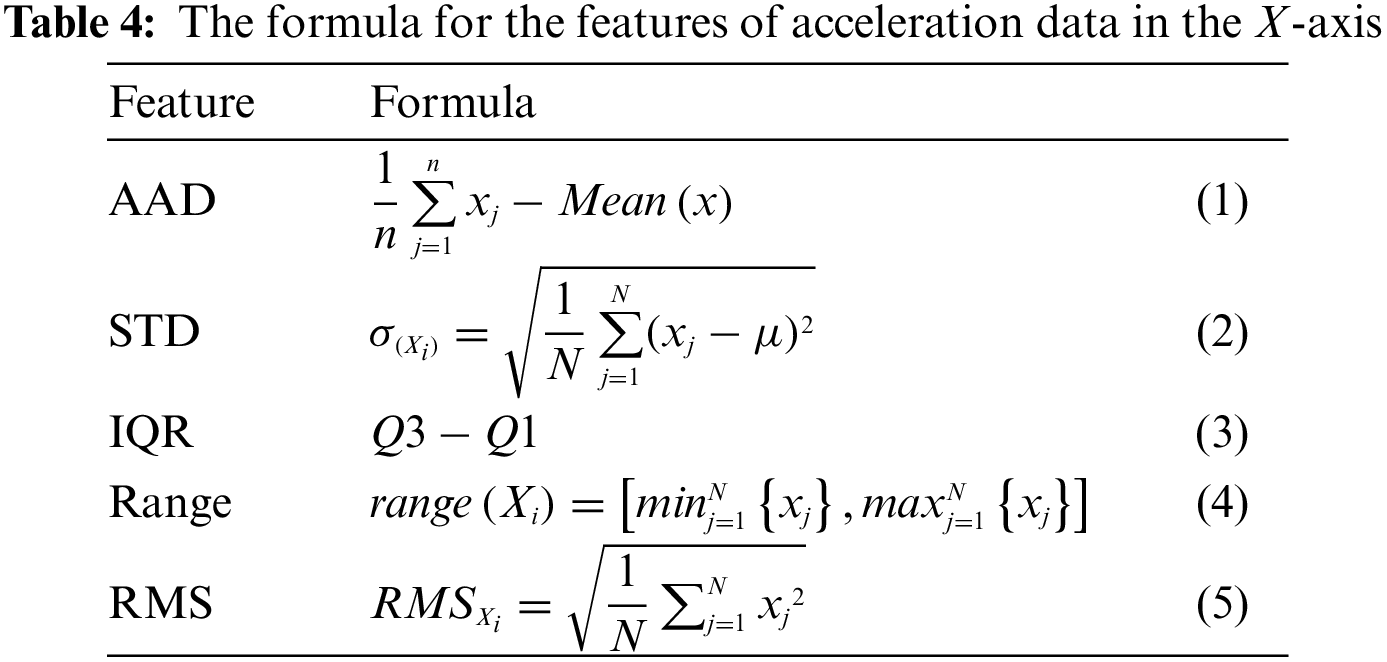
where:
–
–
–
–
–
–
In Table 5, the AAD feature remains consistent in its ability to differentiate between Standing (0.05) and Jogging (0.33) during a static state along the X-axis. In Table 6, STD continues to effectively distinguish Jogging from Walking the stairs. Furthermore, IQR is used to differentiate the Standing action with a value of 0.04 from the remaining activities, including static actions such as Sitting combined with other activities (as shown in Table 7). Overall, human activities exhibit significant differences.
In this study, for the problem of classifying real-time activities on low-cost, low-power microcontrollers, the selected five features, although not novel and relatively simple, are perfectly suitable. After selecting the five features (AAD, STD, IQR, Range, and RMS), the dataset was divided into a training set and a test set. The study experimented with different ratios of training and test set, concluding that a ratio of 60% training and 40% test set yielded the best results. It is important to note that the training set, which consisted of 60% of the original dataset, was randomly sampled from different subjects. Similarly, the remaining 40% formed the test set, ensuring that there was no overlap between the training and test set. The proposed features were utilized to analyze the training dataset for model development.
In order to gain a more comprehensive insight into the contributions of the training dataset, this study uses t-Distributed Stochastic Neighbor Embedding (t-SNE), a data dimensionality reduction tool, which maps the distribution of each data point from a high-dimensional space into a 2- or 3-dimensional space. Fig. 6 represents the WISDM dataset through the t-SNE algorithm. Fig. 6a reveals a considerable degree of confusion among the majority of activities. However, in Fig. 6b, after conducting testing involving all five previously mentioned features, the boundaries separating different activities become notably distinct. Employing all of these features in tandem consistently yields superior results in activity classification when compared to utilizing each feature individually. It is notable that the classification of activities such as Standing (depicted by the orange region) and Sitting (depicted by the blue region) proves to be straightforward. Meanwhile, the activities of Jogging (indicated by the pink region), Walking (represented by the green region), and Walking the stairs (represented by the brown region) exhibit some degree of overlap.
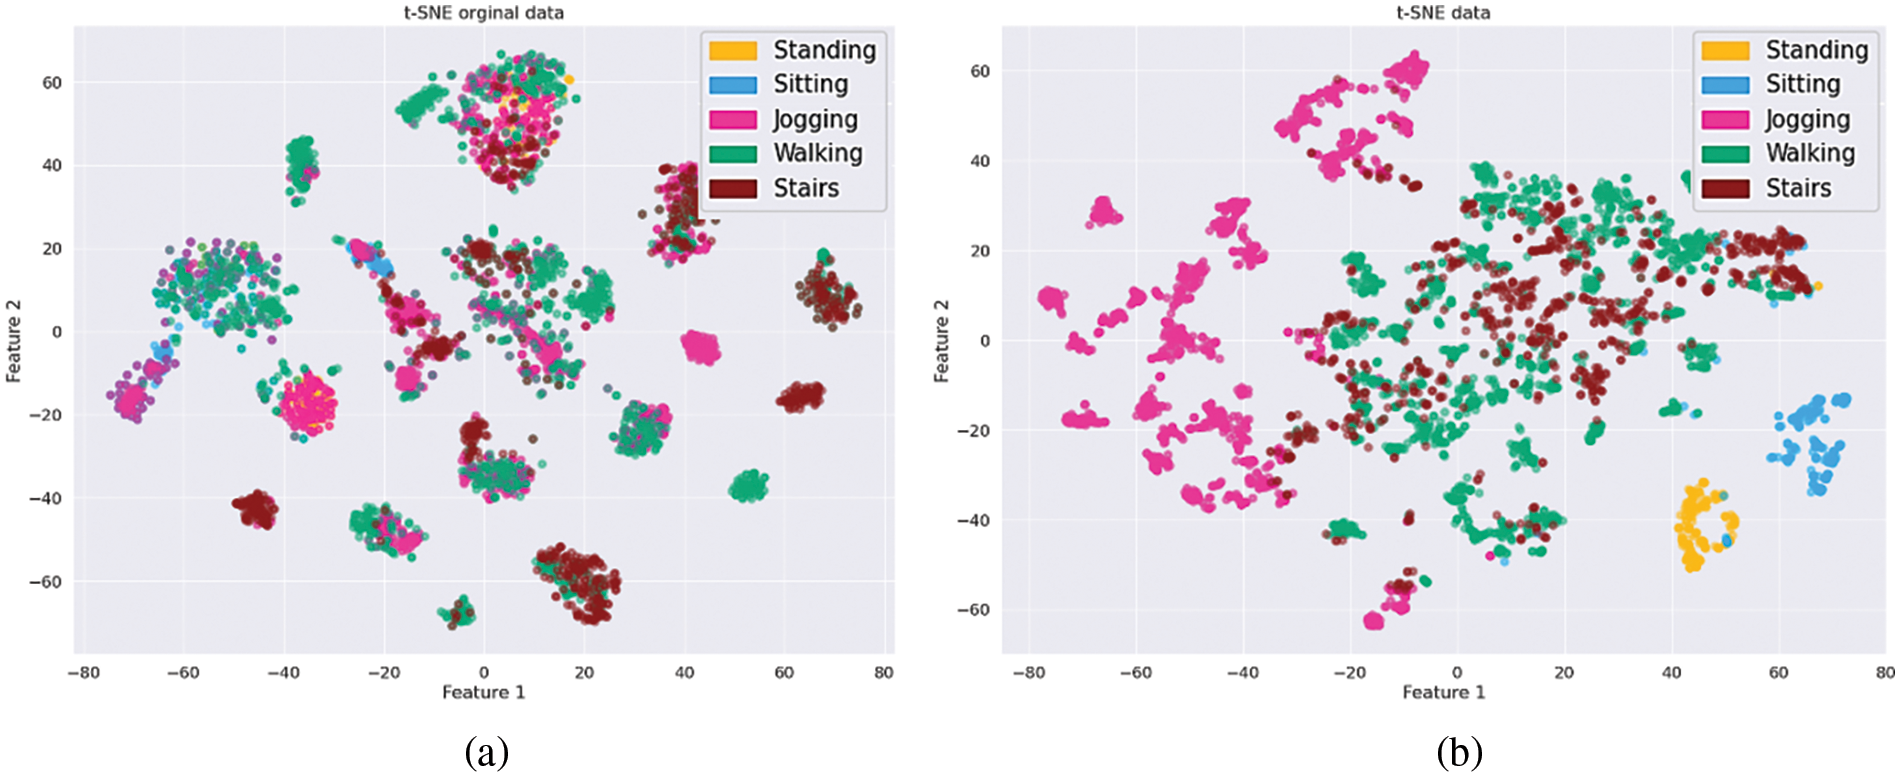
Figure 6: The WISDM dataset without features (a) and with features (b) in 2D space
The five features AAD, STD, IQR, Range, and RMS are also used with the collected dataset as the WISDM dataset. Fig. 7 illustrates the histogram of the collected dataset obtained through the t-SNE algorithm. It was evident that the activities in the collected dataset were distinctly classified, although there remained a slight overlap among Jogging, Walking, and Walking the stairs.
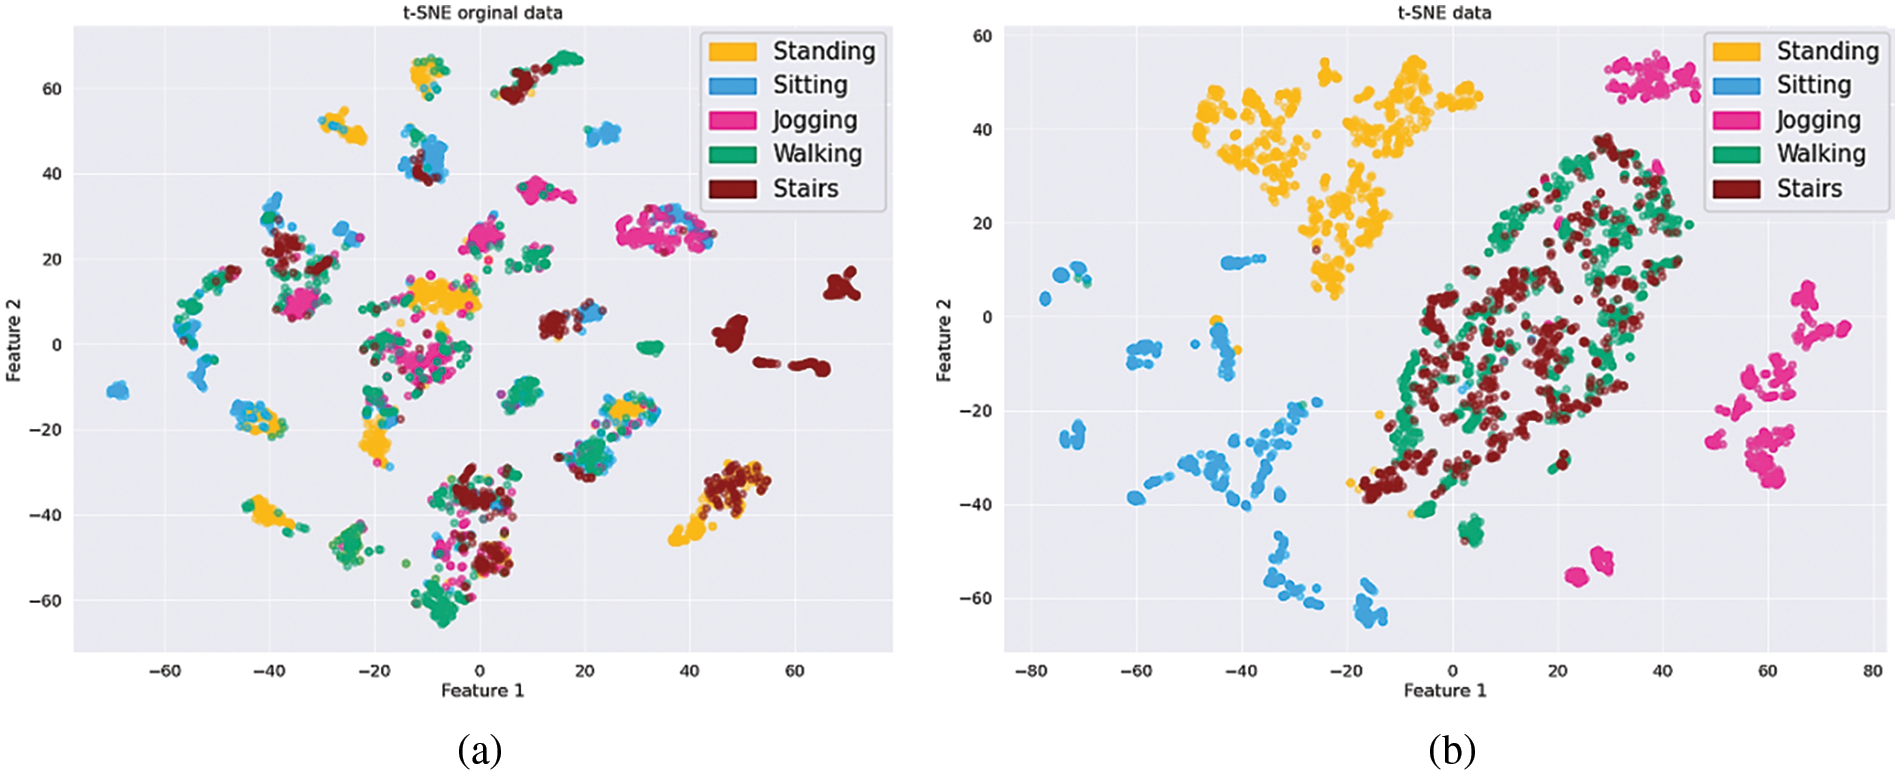
Figure 7: The collected dataset without features (a) and with features (b) in 2D space
The extracted feature set will be integrated into the training and classification of activities. Four commonly used classification methods in machine learning: RF, Gradient Boosted Decision Tree (GBDT), SVM, and KNN were employed through the Scikit-learn library to assess model performance. The GBDT model is configured with a learning rate of 0.05, a maximum depth of 3, and 100 estimators. The SVM model uses a regularization parameter
To assess the effectiveness of the classification model, the classification results were represented as a confusion matrix, with the test calculated as follows:
where:
–
– True Positive
– False Positive
– False Negative
– True Negative
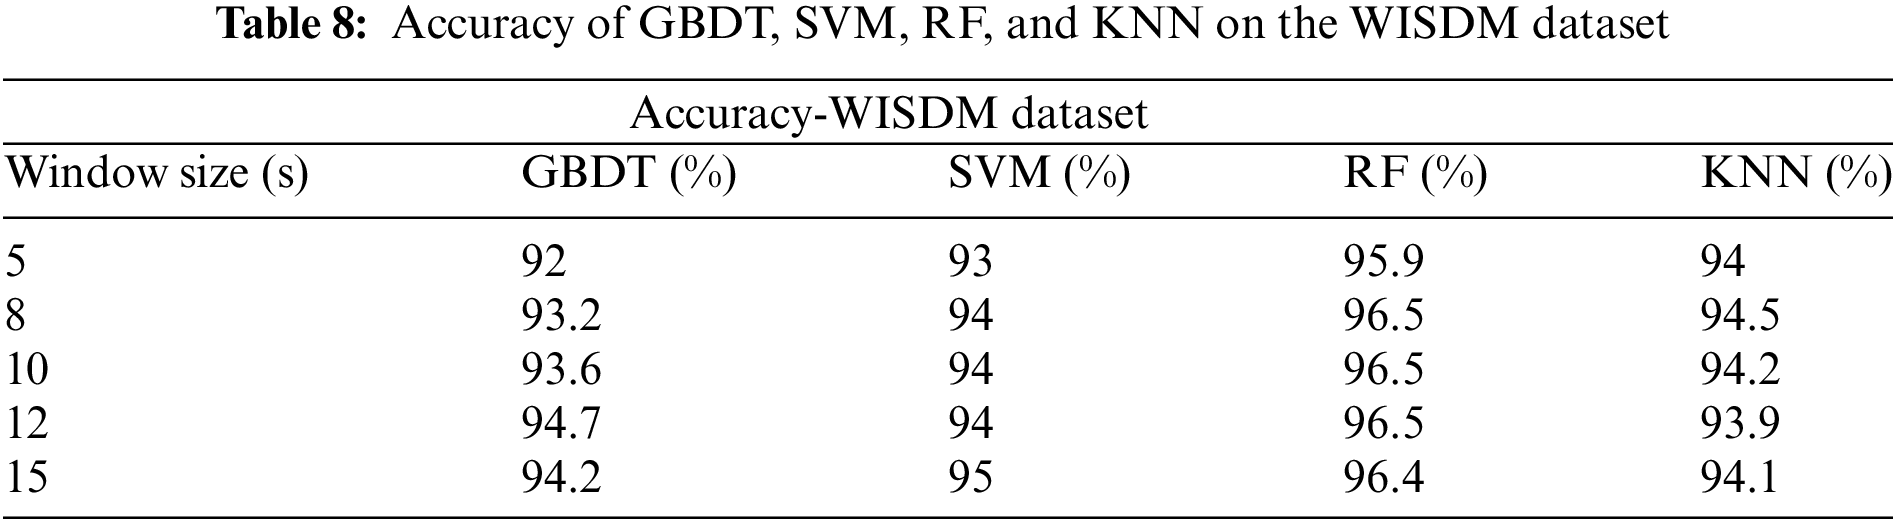
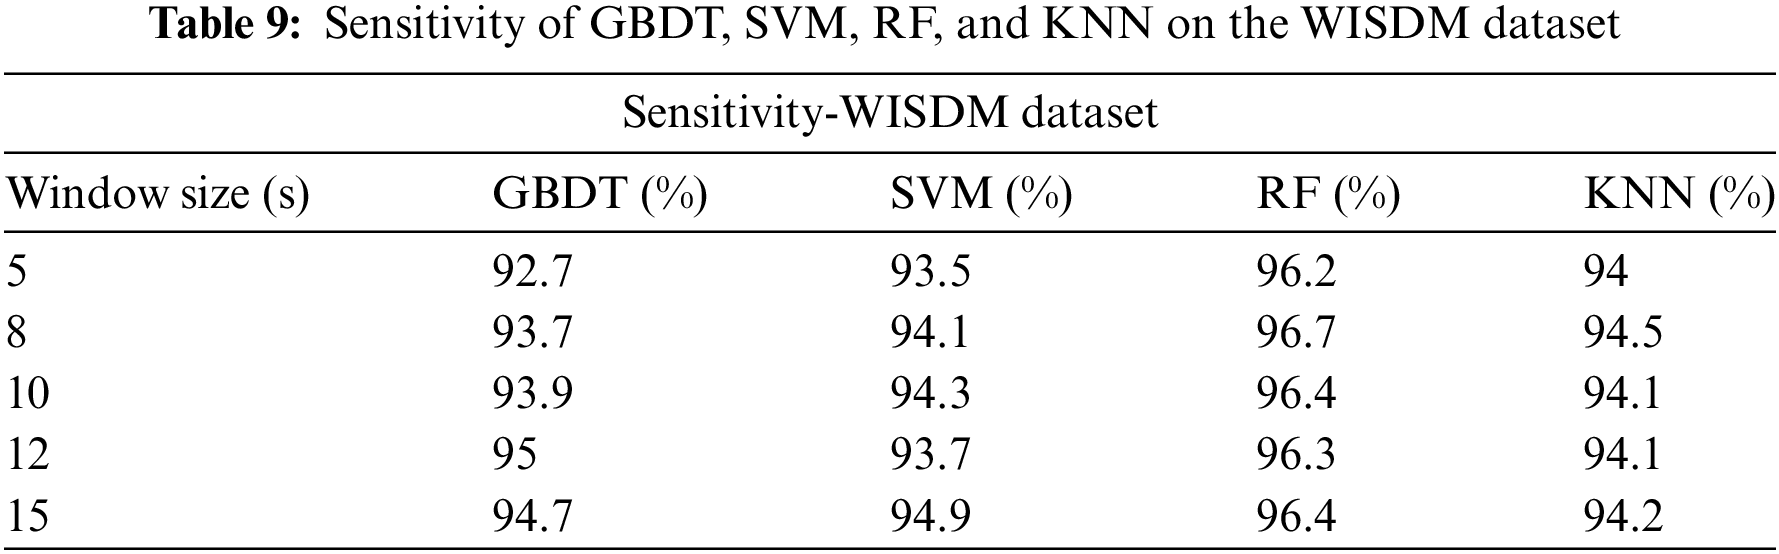
Tables 8 and 9 present the overall accuracy and sensitivity of each classifier on the WISDM dataset. The performance of these classifiers varies with different window sizes (5, 8, 10, 12, and 15 s). Among these classifiers, the RF classifier excelled in classification performance, achieving an accuracy of 96.5% and a sensitivity of 96.7% with an 8 s window size.
Tables 10 and 11 illustrate the accuracy and sensitivity of the collected dataset across various window sizes and classifiers. Unlike the WISDM dataset, where data is collected from volunteers with phones placed in their front pockets during activities, the test data is collected using a device fixed to the waist to minimize movement. The data collection process is structured by individual actions, reducing deviations. Consequently, the behavioral accuracy in the collected dataset is higher than that of the WISDM dataset. The RF classifier delivers the highest accuracy (98.3%) and sensitivity (97.5%) for a window size of 8 s. The superior results in the collected dataset are attributed to the careful measurement of each activity and testing on a group of individuals with similar age and behaviors, leading to consistent results.
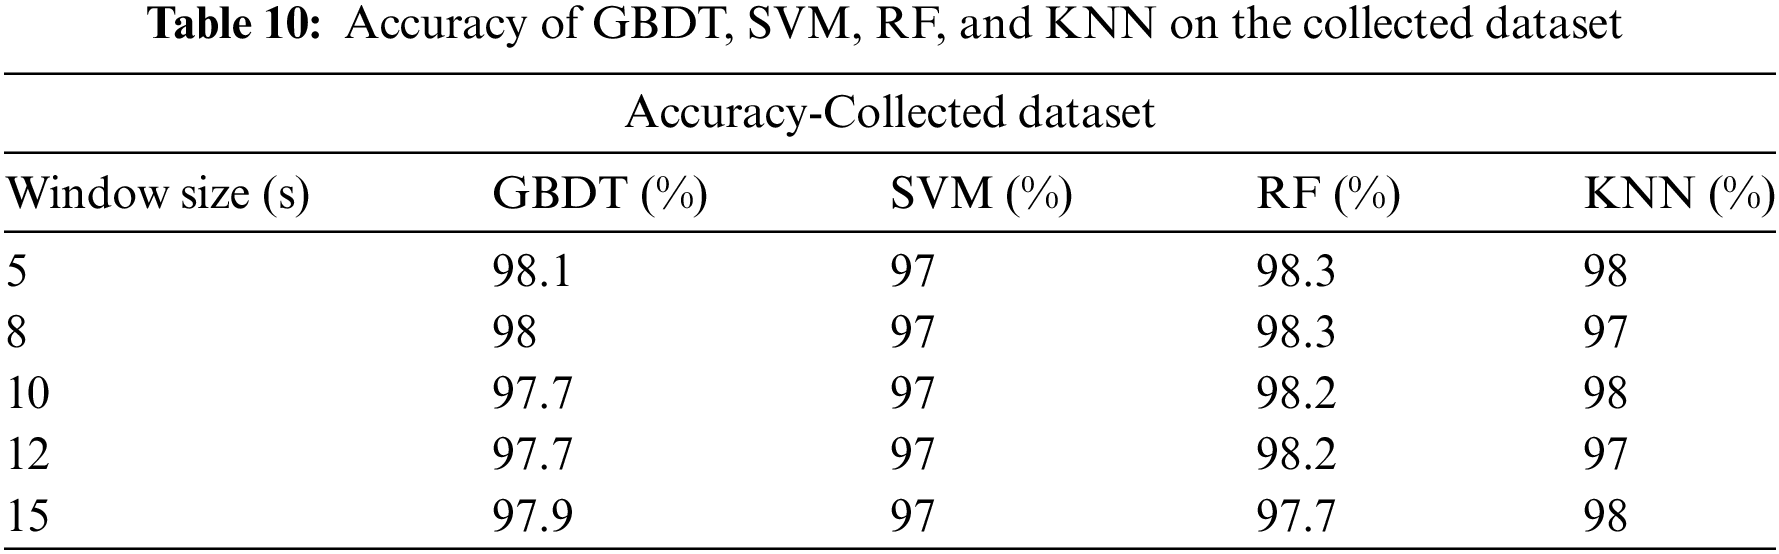
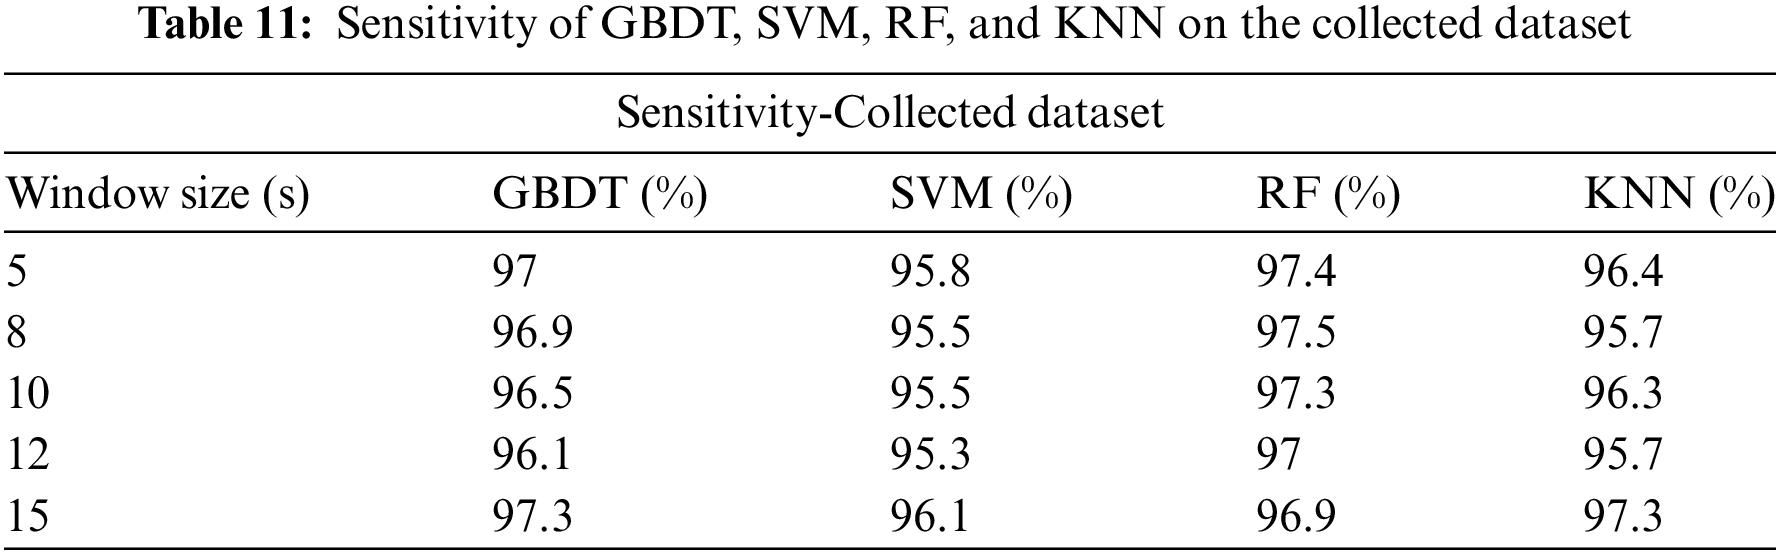
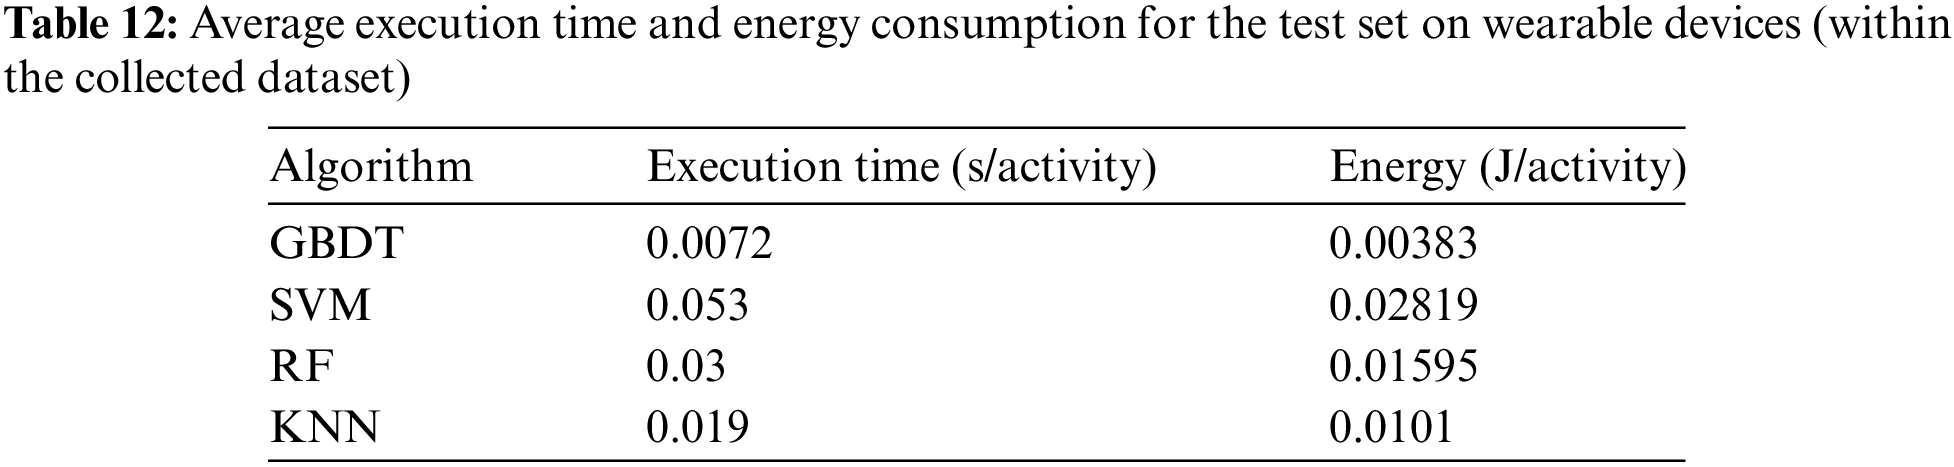
Table 12 presents the average execution time and energy consumption of the GBDT, SVM, RF, and KNN algorithms on wearable devices using the collected dataset. The results show that RF has significantly lower execution time and energy consumption compared to SVM, with only 0.03 s/activity and 0.01595 J/activity. When compared to KNN (0.019 s/activity and 0.0101 J/activity) and GBDT (0.0072 s/activity and 0.00383 J/activity), RF does not perform as efficiently in terms of speed or energy savings. However, when evaluated against accuracy and sensitivity metrics in Tables 10 and 11, RF outperforms the other algorithms. Specifically, RF achieves the highest accuracy in the 5, 8, and 10-s windows (98.3%) and the best sensitivity across the same window sizes (97.4%, 97.5%, and 97.3%, respectively). This demonstrates that RF can maintain high accuracy even as window sizes change, a critical factor in Tiny Machine Learning, where computational resources are limited and models must be optimized for both time and energy.
After considering the optimal computational goal and RF’s suitability for users less prone to sudden changes in actions (such as older users or those in recovery), the RF algorithm appears to be the preferred choice for classifying direct actions on microcontrollers in this study. The results in this study are presented in the figures and tables below using a window size of 8 s.
Figs. 8 and 9 show detailed results of using the RF algorithm to classify operations on the WISDM dataset and the collected dataset for a window size of 8 s. As can be seen from Fig. 8, most behavioral test samples exhibit relatively clear differentiation (277/279 samples for Standing, 337/344 samples for Sitting, 2014/2038 samples for Jogging). However, there is a slight discrepancy between Jogging, Walking, and Walking the stairs.
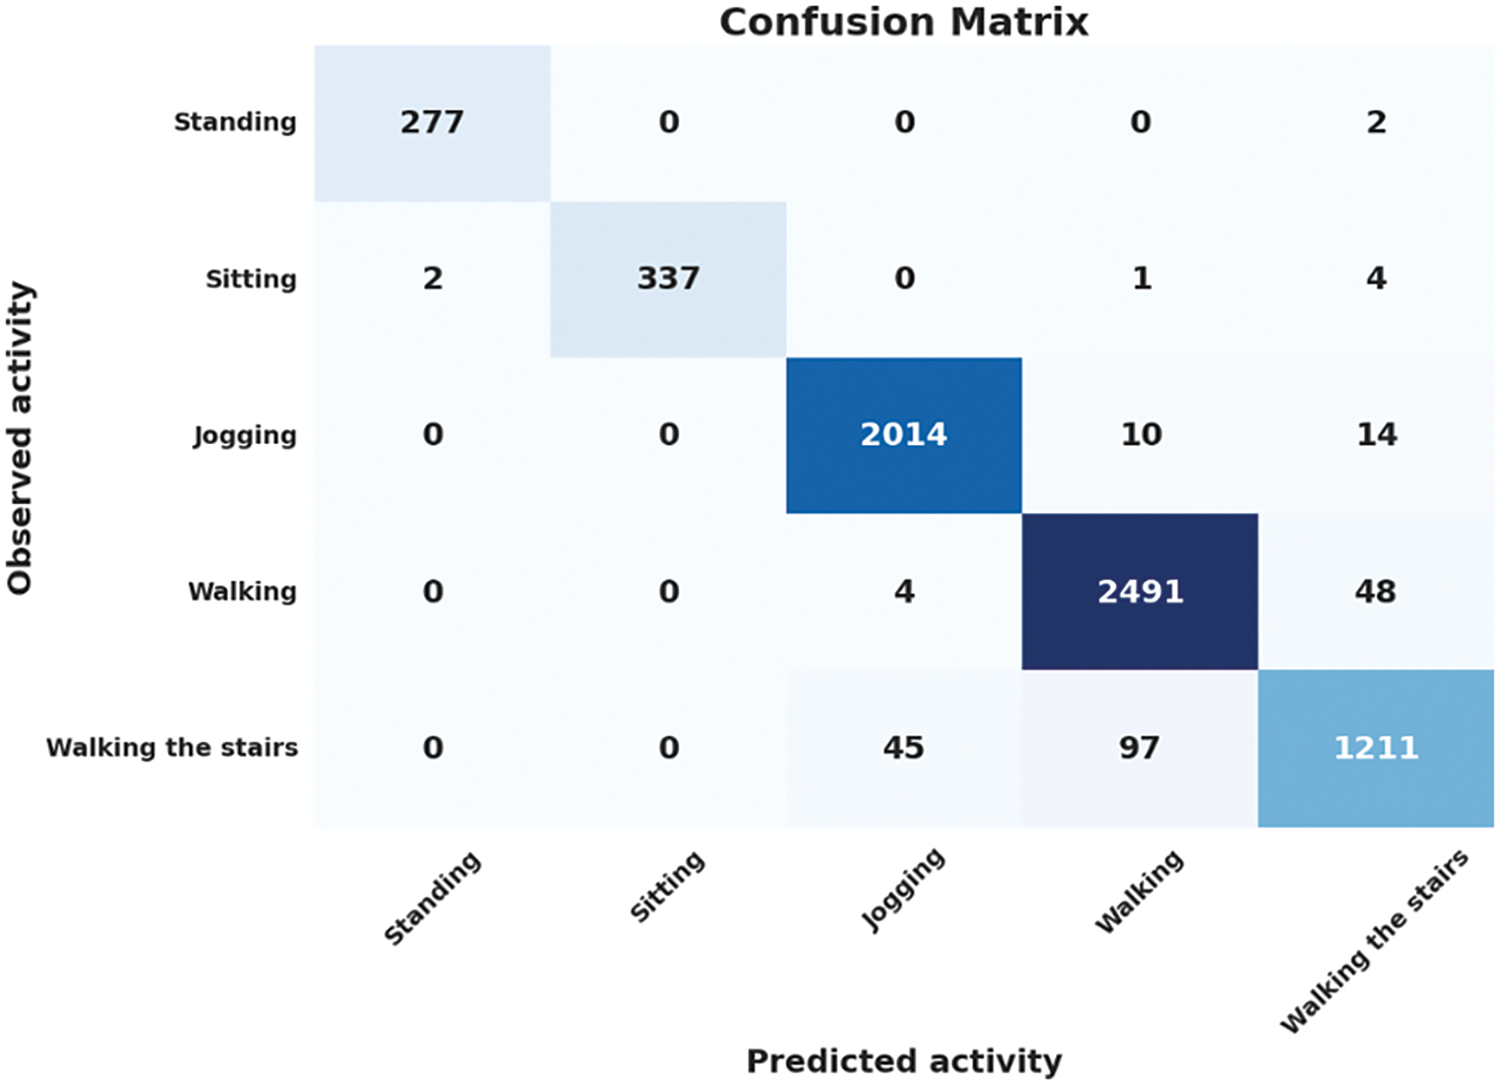
Figure 8: Confusion matrix of RF algorithm on the WISDM dataset
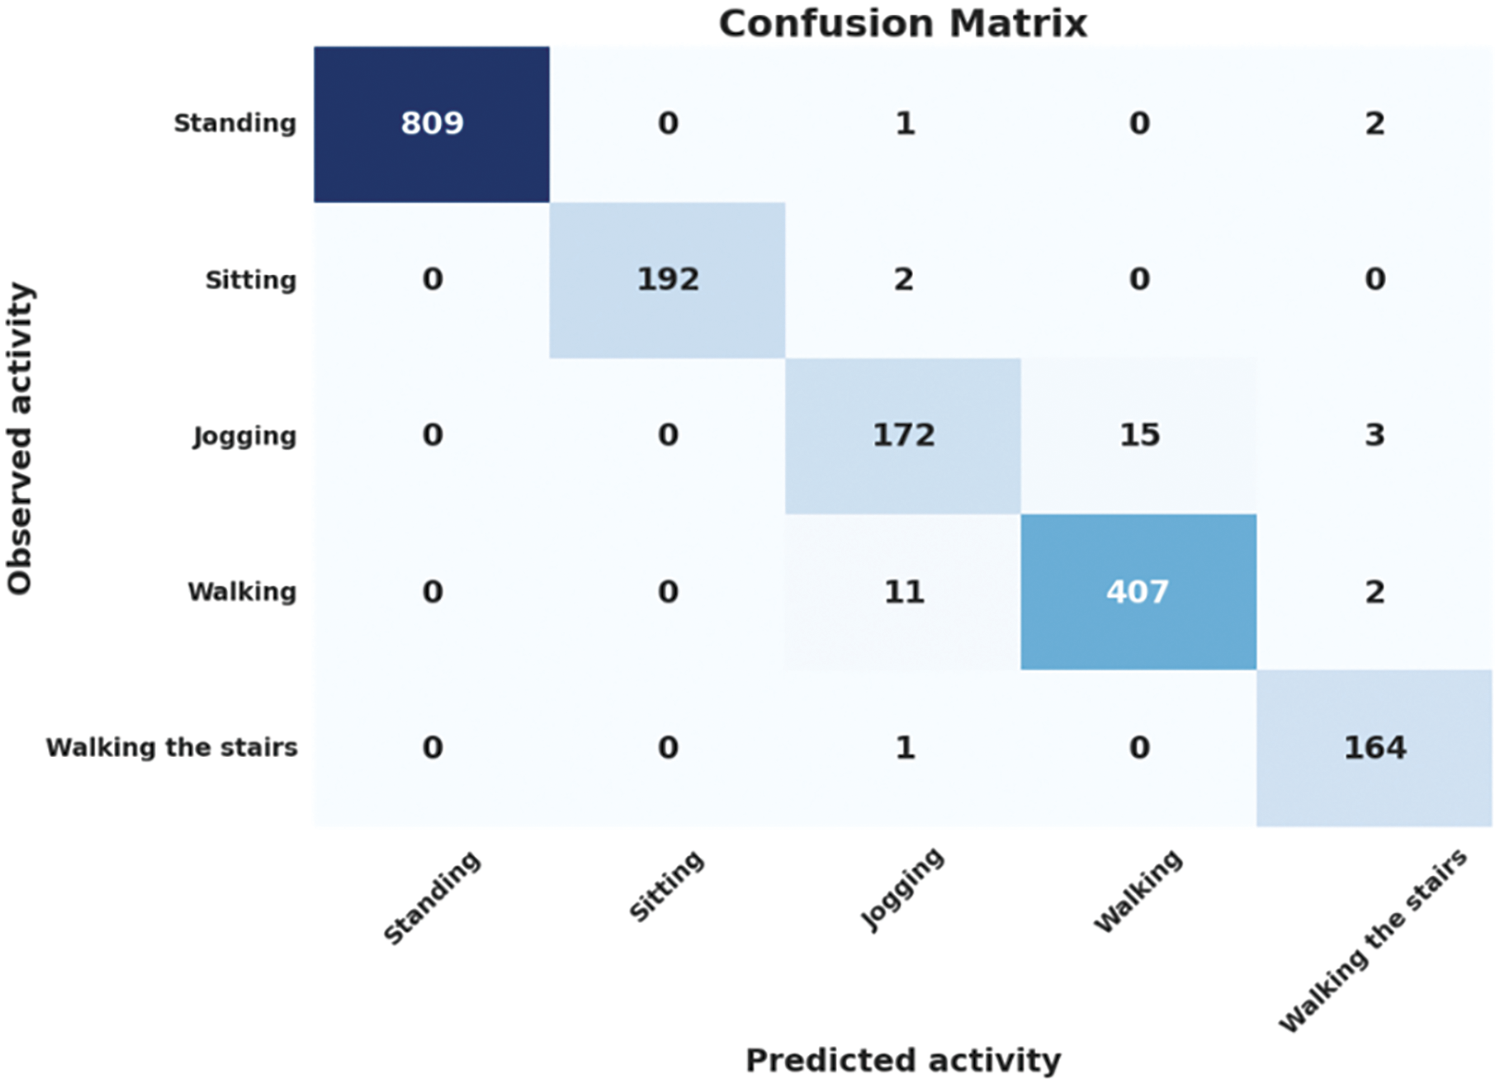
Figure 9: Confusion matrix of RF algorithm on the collected dataset
Similar to the WISDM dataset, in Fig. 9, most activity test samples on the collected dataset are distinctly differentiated. The accuracy of activity classification is presented in Tables 13 and 14 for the WISDM dataset and the collected dataset, respectively. The accuracy of the RF classifier across all operations exceeded 90% on both the WISDM dataset and the collected dataset. The classification performance of the RF classifier is relatively high. The results are calculated according to Formulas (6)–(9).
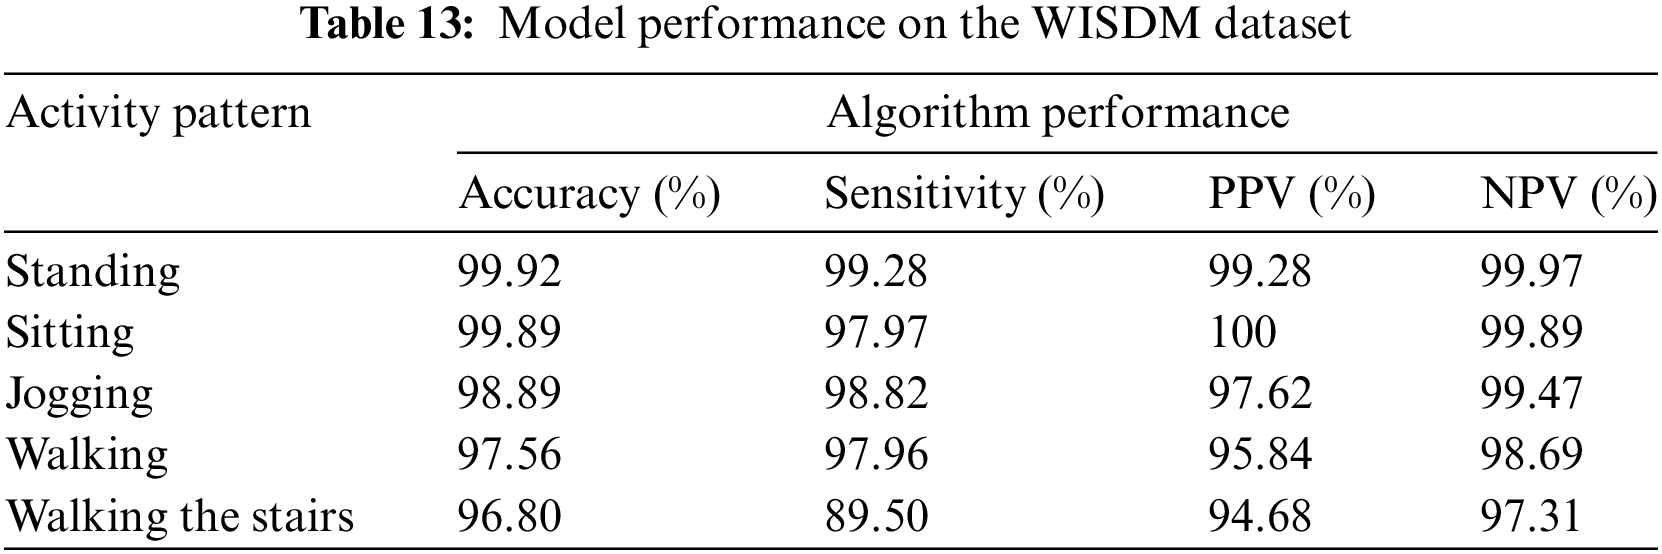
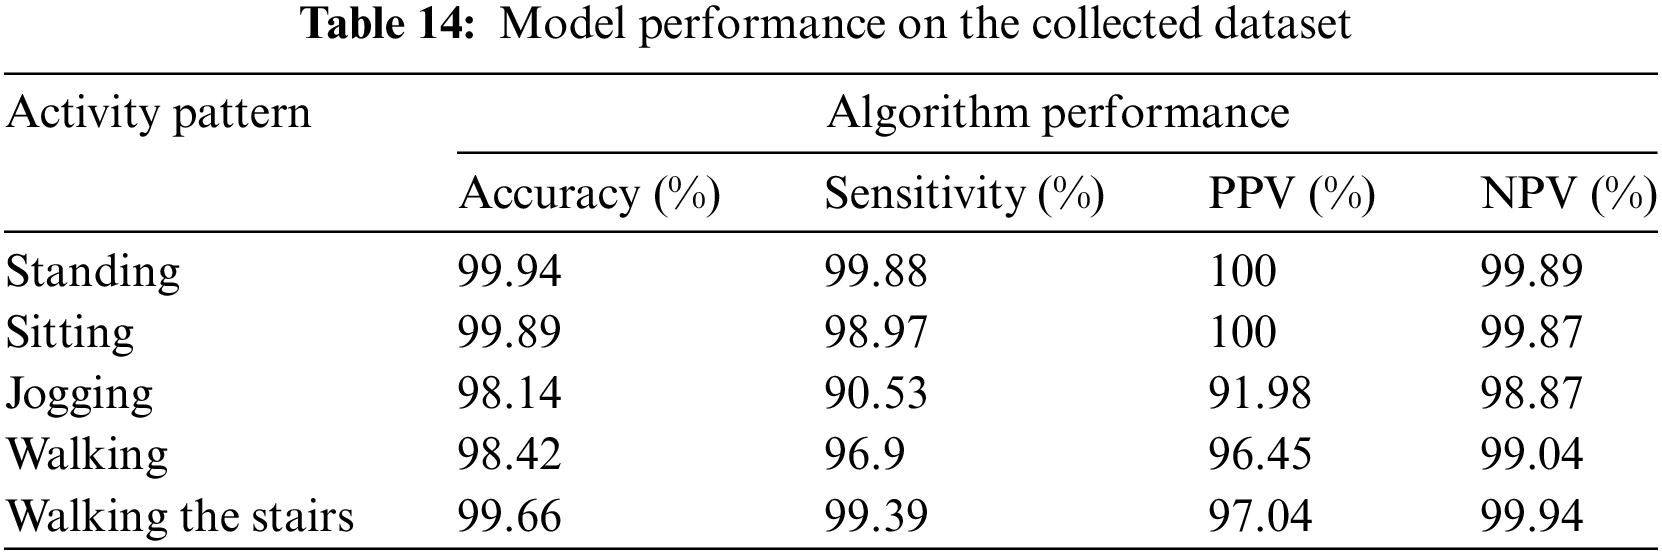
The RF classifier achieved remarkable accuracy and NPV rates exceeding 96% on the WISDM dataset and surpassing 98% on the collected dataset across all operations. Sensitivity and PPV demonstrated impressive values, surpassing 90% for all classes except for Walking the stairs, which achieved 89.50% on the WISDM dataset. Remarkably, the Standing and Sitting activities exhibited absolute index values, achieving complete classification compared to other activities.
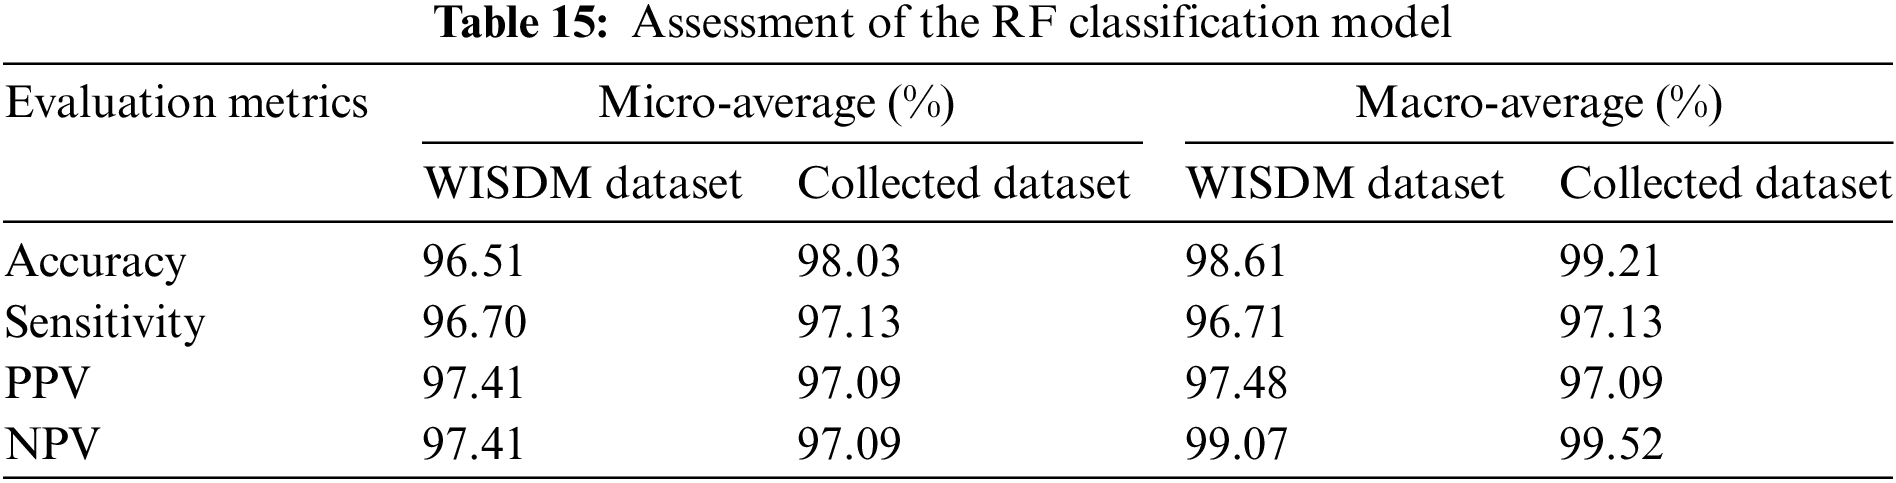
The dataset’s overall performance is evaluated using both macro-average and micro-average methods. The results in Table 15 indicate that the RF classifier stands out as the best-performing model. Specifically, the micro-average estimation method demonstrates notably high performance, surpassing 96% on the WISDM dataset and exceeding 99% on the collected dataset.
To validate the effectiveness of the proposed feature set, several individual features from the proposed set were omitted, and a few new features were systematically added. The model was rerun, and the resulting data allows for a visual comparison of accuracy between the proposed feature set and the altered feature sets. Furthermore, in this study, additional features used in [29,37,43,45,46] are also tested.
The features were chosen for the goal of implementation on low-performance microcontrollers, focusing on time-domain features with minimal computational complexity. Below is a list of these additional features:
– Mean: average (the average value of a set of numerical data).
– Mean2: mean squared (the average of the squared values in a dataset).
– Kurtosis: measures the peakness or tailness of a probability distribution.
– Median (med): the middle value when the data is arranged in order.
– Percentiles (pe): values dividing the dataset into different percentile parts.
– Skewness (skew): measures the asymmetry of a probability distribution.
– Energy: measures or computes the energy of a signal or data.
In machine learning problems, a crucial step involves extracting features from the raw data. The selection of features depends heavily on the machine learning model designer’s understanding of the dataset. Effective feature extraction typically enhances the model’s accuracy; conversely, it introduces computational overhead, potentially reducing accuracy. Observing Table 16, the model re-run with the reduced features compared to the original feature set shows a significant decrease in classification accuracy on the collected dataset. For the WISDM dataset, there is a slight increase and decrease when reducing some features. Overall, the accuracy for the WISDM dataset does not change much. When supplementing the original feature set with one or more additional time-domain features, re-running the model on the WISDM dataset shows a slight increase in classification accuracy. However, for the collected dataset, the re-run model shows a decrease in accuracy, although not significant.
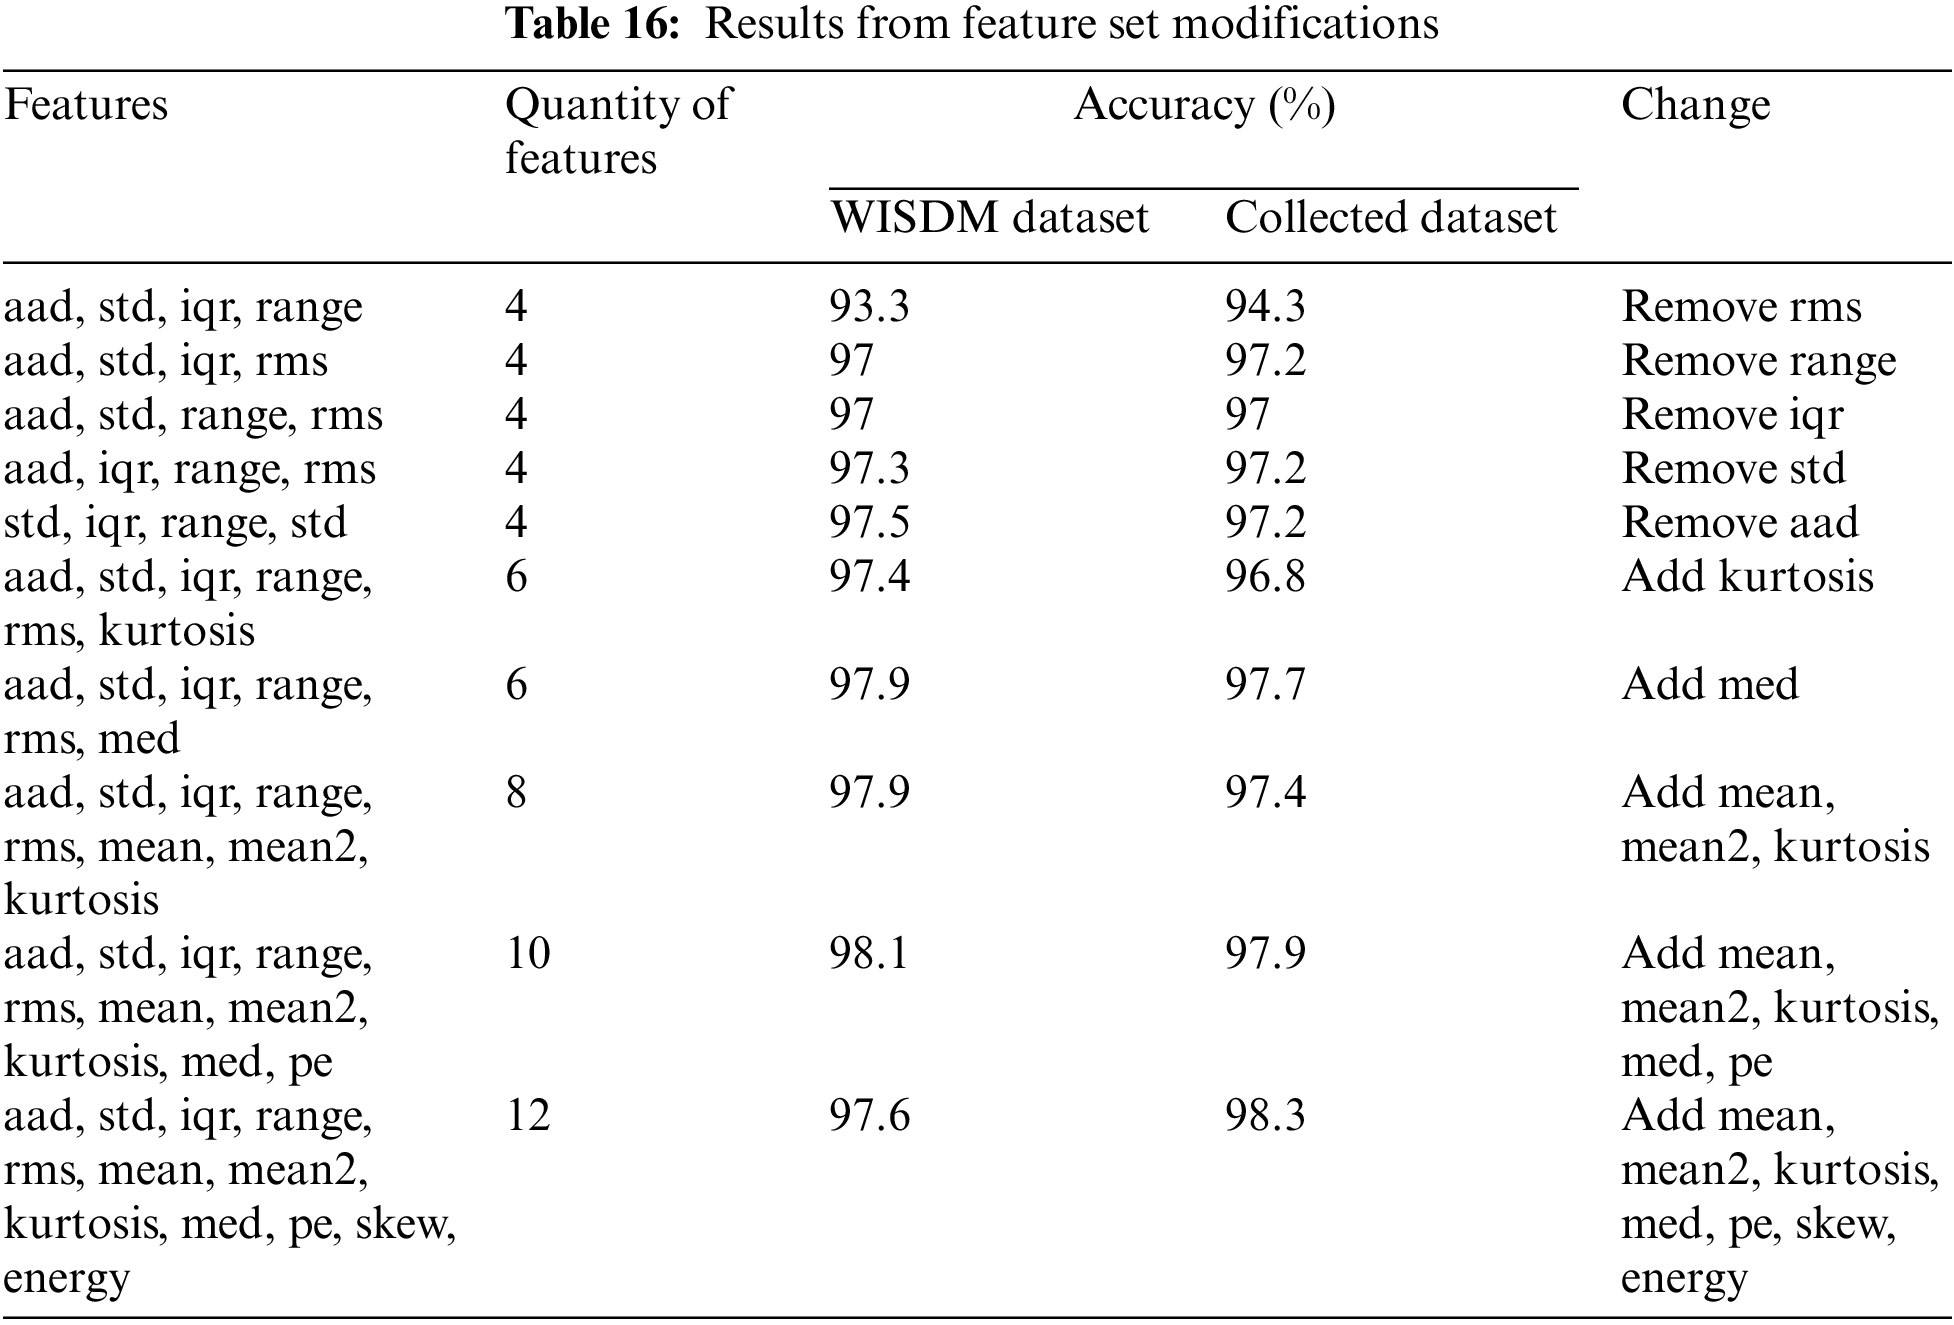
In the context of behavior classification in this study, increasing the features will lead to increased computation time, affecting real-time performance. Moreover, any increase in accuracy is not significant. Since activity classification occurs over a long period, the priority is to select suitable features. Therefore, the proposed feature set achieves an optimal balance between classification performance and computational complexity, meeting the study’s requirements.
Feature selection holds a critical position in the recognition process, substantiated by previous research [37,43,46,47]. Many studies have broadened their scope to encompass numerous features in order to more accurately identify human activities. Some studies have combined up to 43 features, as seen in Catal et al. [45], and even 64 features, as explored in the study by Vavoulas et al. [37]. This study applied five time-domain features (AAD, STD, IQR, Range, and RMS) along with the optimal sliding window size (8 s) to two datasets: the WISDM dataset and the collected dataset. The results show relatively high activity recognition accuracy, such as 96.7% on the WISDM dataset and 97.13% on the collected dataset. The classification process will be performed in real-time on the microcontroller. Furthermore, the classification status is updated and sent every 5 s. So, the five simple features above are completely consistent with the goals and equipment of the article. Fig. 10 presents the classification results on a terminal (smartphone).
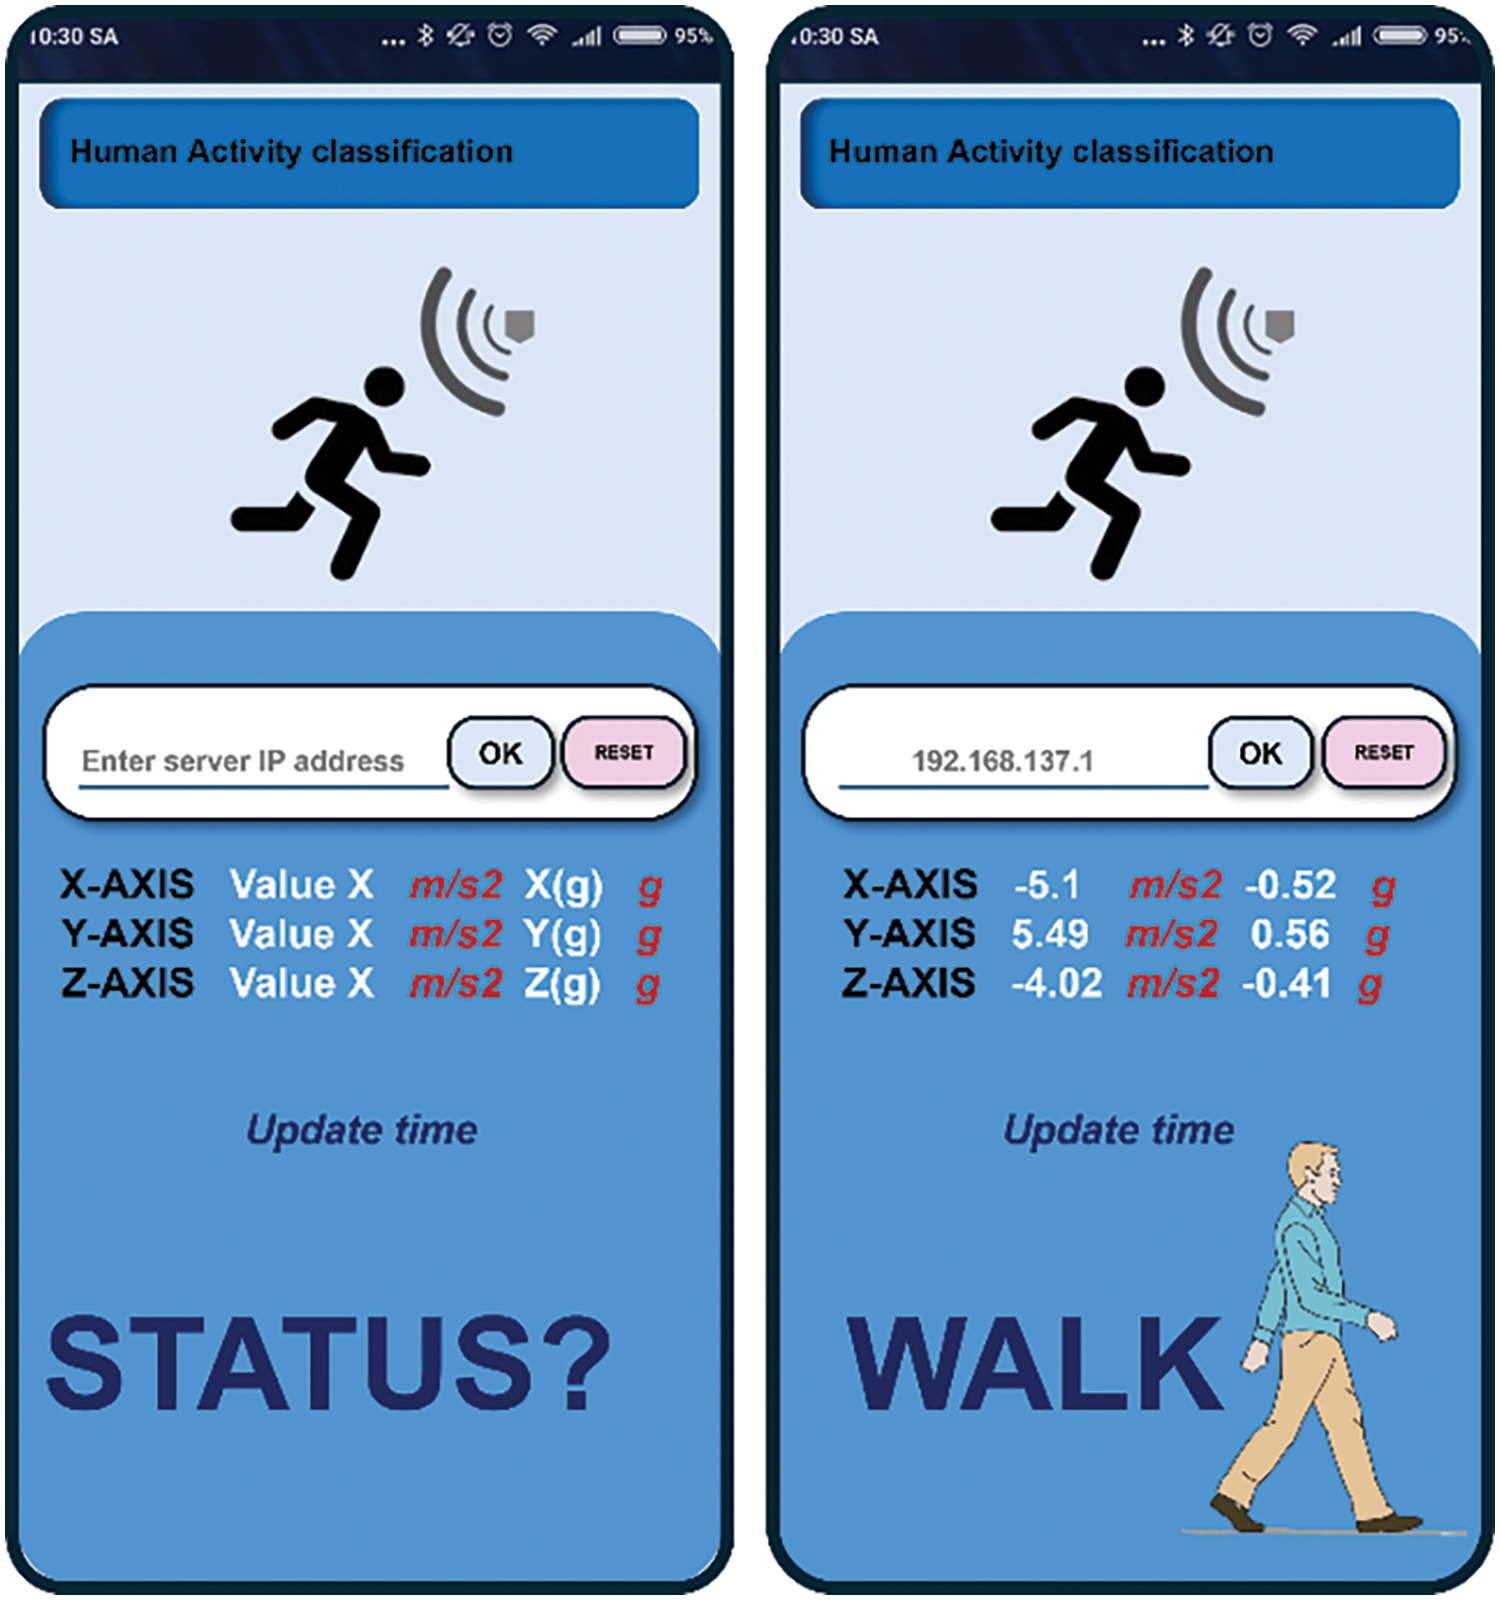
Figure 10: Classification is performed by a real-time microcontroller and displayed on a smartphone
Some researchers employ accelerometer data and deep learning to classify human activities. Chen et al. developed a CNN model and modified the convolution kernel to adapt to the characteristics of the three-axis acceleration signal [48]. Their experimental results indicate that CNN performs effectively, achieving an average accuracy of 93.8%. Lee et al. introduced a method based on 1D CNN with an accuracy of 92.71% [49]. However, this study utilized only three types of human activity data—walking, running, and standing still—collected using smartphone accelerometers. In part of the work done in this study, we tested the classification of the five actions Standing, Sitting, Jogging, Walking, and Walking the stairs on the WISDM dataset using a deep learning network architecture. The evaluation employed Long Short-Term Memory (LSTM) for assessment. Experimental results indicate that, using both micro-average and macro-average estimation methods, the accuracy and sensitivity are highly satisfactory. With LSTM, test results have given Accuracy > 99% and Sensitivity > 97%, testing shows that LSTM is a worthy choice for the HAR problem. However, LSTM (or deep learning) requires significant training and testing time, surpassing RF, GBDT, SVM, and KNN. Consequently, deploying deep learning might not be viable on cost-effective microcontrollers such as the PIC18F4520.
Some researchers have explored utilizing built-in accelerometers for activity classification. However, this method often suffers from reduced accuracy due to interference from routine activities like phone calls, web browsing, and messaging [29]. Wang et al. [12] conducted research on recognizing human physical activities based on three-axis accelerometer and gyroscope data. The study used Naive Bayes and KNN classifiers to evaluate classification ability on a data set of 6 activities: Walking, Sitting, Standing, Lying, Upstairs, and Downstairs. The results of the study showed good accuracy in most activities. However, the Upstairs and Downstairs operation has lower classification, with an accuracy of 82.78% for Upstairs and 91.78% for Downstairs. In addition, the PPV index is also quite low, reaching 79.62% for Upstairs and 77.14% for going Downstairs.
In this study, the focus shifts towards healthcare applications for the elderly, individuals in post-surgery recovery, or those who have experienced accidents. Our research found that separating the two operations Upstairs and Downstairs does not bring much meaning to the application that the research is aiming for. In daily activities when a person, the time spent going up and down stairs can be considered equal. Furthermore, the issue of concern is the frequency of activities over a long period of time of the user. Therefore, we combined the two activities Upstairs and Downstairs into Walking the stairs. Consequently, the scope is narrowed down to these five specific behaviors, which were deemed sufficient for the application while ensuring real-time classification and optimized costs.
In this study, a consistent methodology was employed across two distinct datasets, the WISDM dataset and a separately collected dataset, to facilitate a comparative analysis of performance outcomes. The same proposed model was used to train and evaluate both datasets independently. The aim was not to make a definitive claim about the superiority of one dataset over the other but rather to explore how different dataset characteristics might influence model performance. By applying identical preprocessing, feature extraction techniques, and model configurations to each dataset, a controlled comparison was ensured. It’s important to note that while our collected dataset showed better performance metrics, this does not inherently imply higher quality in the traditional sense. Instead, it suggests that the dataset may be simpler or more homogeneous, which might lead to better performance under the specific conditions tested. However, a more heterogeneous dataset, like WISDM, might offer richer patterns for the model to learn, potentially improving performance with unseen data in real-world applications. Furthermore, the study targets elderly individuals and patients in recovery, where movement variability is generally low, making the characteristics of the collected dataset particularly suitable and simple for this research.
The overall accuracy results between the WISDM dataset and the collected dataset revealed a notable difference (98.61% vs. 99.21%). This difference can be explained by several key factors. Firstly, the WISDM dataset involved a larger number of volunteers (36) compared to the study (16), resulting in more diverse data in the WISDM dataset. Secondly, differences in the data collection process significantly influenced the outcomes. In the WISDM dataset, volunteers collected data using their phone’s built-in accelerometer while the phones were placed in their pockets. In contrast, data in the collected dataset was obtained from volunteers wearing the device securely on their waists, ensuring more consistent and reliable data capture. This higher data quality contributed to the improved classification performance observed with the same proposed model. These results substantiate the hypothesis that enhanced data quality directly correlates with improved model efficacy. However, the study has several limitations, including its focus on a single age group with similar physical characteristics. It is anticipated that if the subjects were children or individuals aged 30–50 or older, the activity thresholds would likely differ. This issue will be explored further in future studies, which are beyond the scope of this paper.
This study was also directly compared with the study by Vavoulas et al. [37] using the same WISDM dataset. Both studies performed classification of six activities: Walking, Jogging, Upstairs, Downstairs, Sitting, and Standing, without merging Upstairs and Downstairs. A 10-fold cross-validation was used to ensure robust performance evaluation. The study by Vavoulas et al. utilized 64 features and achieved higher accuracy with the Ibk classifier (99.79%) and J48 classifier (98.63%). In another study [45], Catal et al. employed the J48 algorithm, Multi-Layer Perceptron, and Logistic Regression, using 43 features to classify a broader range of activities, achieving an accuracy of 91.6%. It is evident that the studies employed a more extensive array of features compared to our study, where we utilized only 15 features yet achieved a 97.6% accuracy with RF. Additionally, those studies did not prioritize cost-effectiveness and conducted action classification on a low-performance microcontroller. It is important to realize that comparing studies using different approaches can be challenging. However, in comparison to most computer vision-based techniques discussed in [47], our proposed method achieves higher overall accuracy.
In this study, the data from 16 volunteers were combined into a single dataset, which was then split into two datasets: a training set and a test set, with a split ratio of 60% training and 40% test (the split ensures that the 60% training data is randomly selected without overlapping with the 40% test data). The same approach was applied to the WISDM dataset with 36 volunteers. This method yields fairly objective results. However, it also has limitations, as the model may struggle to generalize to new (unseen) users because the parameters and hyperparameters were learned using the same subjects that were also used for evaluation. In a study by Gholamiangonabadi et al. [50], Leave-One-Subject-Out Cross-Validation (LOSOCV) was used to assess the accuracy of HAR models on new subjects. In LOSOCV, one subject is reserved for evaluation, and the model is trained on the remaining subjects. This process is repeated each time with a different subject reserved for evaluation, and the results are averaged over all folds (subjects). The study yielded outstanding results, with an accuracy of up to 99.85%. In the future, as the dataset is expanded to include more subjects, LOSOCV will be a method worth considering. Future research plans to explore this issue further to achieve even greater effectiveness.
Traditional active sorting systems typically run on AI-enabled microcontrollers [36,51]. In contrast, this research aims to test the system on a variety of microcontrollers, including low-performance ones, leading to more optimized costs. However, computation becomes more challenging when optimizing for low-performance microcontrollers. This approach opens research opportunities across a wide range of topics and applications. The proposed system is suitable for patients, people in recovery, and the elderly but may not generalize well to individuals engaged in complex, high-intensity tasks, such as firefighters or police officers. These activities often occur under difficult conditions like large fires, thick smoke, or being chased. Additionally, a limitation of the study is that the device must be fixed in the lumbar region.
The sensor was securely attached to the waist, as depicted in Fig. 2b. Volunteers performed their daily activities while wearing the device. These volunteers wore the test device throughout the day. Volunteers were surveyed about their comfort level with wearing and touching the device. The classification results between the WISDM dataset and the collected dataset show improved classification performance when the user wears a fixed device. However, in such cases, volunteers may feel uncomfortable using the device. The performance of activity classification depends on the fixation ability of the wearable device on the human body and the user’s comfort level when wearing the device. Users are anticipated to incorporate the proposed wearable devices into their daily routines. The smart wearable has a battery life of approximately one and a half days. However, given that the device can be charged daily, much like a smartphone, concerns about battery life become negligible.
In assisted living systems, achieving user acceptance is a critical challenge. While computer vision approaches offer promising applications, their implementation in this context may be hindered by privacy concerns [52]. Elderly users may be reluctant to have their images tracked or recorded, potentially perceiving such systems as intrusive. The feeling of being monitored can be off-putting for users. In this regard, waist-worn equipment with embedded sensors offers a practical solution.
This study focuses on the classification of basic activities of daily living (ADLs). Basic activities are also different for different ages and subjects. As individuals age, ADLs become more difficult and take more time to complete. Or a patient in recovery may find it difficult to perform ADLs independently. Based on this research, a healthcare service model can be developed to monitor the elderly or evaluate patient recovery levels, allowing for the creation of tailored plans to their care needs effectively. The proposed device also empowers individuals to live independently safely.
Sensor networks, a crucial component of the Internet of Things (IoT) with diverse applications, have revolutionized many fields, particularly healthcare [1,3]. As populations age globally, the need for solutions to support independent living grows. This study proposes an activity monitoring system leveraging IoT technology. This system can automatically monitor an elderly person living alone. By integrating the system with communication platforms like web or mobile applications (other communication-related systems within the IoT framework), families can receive real-time updates on their loved one’s activities (as illustrated in Fig. 10). This real-time monitoring provides peace of mind, ensuring the well-being of the elderly, especially those residing far from their families. Therefore, the proposed system offers significant value for elderly individuals, particularly those living independently.
This activity recognition system prioritizes user comfort during extended use. Unlike bulkier assisted living solutions, our proposed device utilizes unobtrusive and cost-effective accelerometer sensors. These sensors are small, lightweight, and priced at a fraction of dedicated equipment, making them ideal for widespread adoption. Furthermore, the device itself is remarkably affordable, with a price tag of just $15. To maximize battery life and minimize the need for replacements, the system employs a low sampling rate (50 Hz) while still maintaining accurate activity recognition. Additionally, the user-friendly design ensures a hassle-free setup process.
This research has effectively developed a cost-efficient, real-time human activity recognition system. By integrating a computationally efficient algorithm into a low-performance microcontroller, the system has demonstrated the ability to classify fundamental human activities, opening up new avenues for research in this area. Experimental results reveal that the RF classifier surpasses GBDT, SVM, and KNN in performance when using an 8-s window size. The RF algorithm proves particularly suitable for real-time applications due to its computational efficiency with digital data, such as accelerometer readings. By leveraging five features—AAD, STD, IQR, Range, and RMS—basic daily activities can be accurately classified.
The research has conducted numerous experiments and comparisons to establish optimal parameters for ensuring system effectiveness, including setting a sampling frequency of 50 Hz, selecting an 8-s window size with a 40% overlap between windows, and identifying features that align well with the data. Additionally, the model was developed, activity thresholds were determined, activities were labeled, performance was compared, and a complete system was designed for practical deployment.
The proposed system is expected to evolve, enabling the recognition of a broader range of more complex activities in the future. While this study focused on time-domain features, future systems could incorporate frequency-domain features or a combination of both domains to enhance performance. Ultimately, this system can be further developed and optimized for specific applications, including patient support, rehabilitation, and elderly care.
Acknowledgement: None.
Funding Statement: This research was funded by Vietnam National Foundation for Science and Technology Development (NAFOSTED) under grant number: 02/2022/TN.
Author Contributions: Manh-Tuyen Vi conducted data analysis, implemented machine learning techniques and wrote the original draft of the study. Duc-Tan Tran, Vu Thi Thuong and Duc-Nghia Tran provided expert guidance on the application of machine learning methods. Vu Thi Thuong and Nguyen Ngoc Linh offered modelling processes. Duc-Tan Tran, as the corresponding author, conceived the study and contributed to its investigation, development, and coordination. All authors reviewed the results and approved the final version of the manuscript.
Availability of Data and Materials: This study used the WISDM open databases that are available online at https://www.cis.fordham.edu/wisdm/dataset.php (accessed on 25 December 2023). The collected dataset that support the findings of this study are available from the corresponding author, Duc-Tan Tran.
Ethics Approval: Human activity data for the experiments were sourced from the Ethics Council for Grassroots Biomedical Research at Phenikaa University. The data collection adhered to Decision No. 476/QD-DHP-HĐĐĐ, approved the Ethics Council for Grassroots Biomedical Research at Phenikaa University (No. 023.0 7.01/DHP-HĐĐĐ, 2023 Dec). All participating people provided informed consent.
Conflicts of Interest: The authors declare that they have no conflicts of interest to report regarding the present study.
References
1. R. Singh, A. Kushwaha, Chandni, and R. Srivastava, “Recent trends in human activity recognition–A comparative study,” Cogn. Syst. Res., vol. 77, no. 4, pp. 30–44, 2023. doi: 10.1016/j.cogsys.2022.10.003. [Google Scholar] [CrossRef]
2. Y. Lai, S. Chiang, Y. Kan, and H. Lin, “Coupling analysis of multiple machine learning models for human activity recognition,” Comput. Mater. Contin., vol. 79, no. 3, pp. 3783–3803, 2024. doi: 10.32604/cmc.2024.050376. [Google Scholar] [CrossRef]
3. N. Long, Y. Lei, L. Peng, P. Xu, and P. Mao, “A scoping review on monitoring mental health using smart wearable devices,” Math. Biosci. Eng., vol. 19, no. 8, pp. 7899–7919, 2022. doi: 10.3934/mbe.2022369. [Google Scholar] [PubMed] [CrossRef]
4. V. T. Pham et al., “Development of a real-time, simple and high-accuracy fall detection system for elderly using 3-DOF accelerometers,” Arab. J. Sci. Eng., vol. 44, no. 4, pp. 3329–3342, 2019. doi: 10.1007/s13369-018-3496-4. [Google Scholar] [CrossRef]
5. M. Saleh and R. L. B. Jeannès, “Elderly fall detection using wearable sensors: A low-cost highly accurate algorithm,” IEEE Sens. J., vol. 19, no. 8, pp. 3156–3164, 2019. doi: 10.1109/JSEN.2019.2891128. [Google Scholar] [CrossRef]
6. S. C. Akkaladevi and C. Heindl, “Action recognition for human-robot interaction in industrial applications,” in 2015 IEEE Int. Conf. Comput. Graph., Vis. Inf. Secur. (CGVIS), Bhubaneswar, India, 2015, pp. 94–99. doi: 10.1109/CGVIS.2015.7449900. [Google Scholar] [CrossRef]
7. A. Jain and V. Kanhangad, “Exploring orientation and accelerometer sensor data for personal authentication in smartphones using touchscreen gestures,” Pattern Recognit. Lett., vol. 68, no. 1, pp. 351–360, 2015. doi: 10.1016/j.patrec.2015.07.004. [Google Scholar] [CrossRef]
8. B. Goodarzi, R. Javidan, and M. S. Rezaei, “A vision-based method for human activity recognition using local binary pattern,” in 2023 13th Int. Conf. Comput. Knowl. Eng. (ICCKE), Mashhad, Iran, 2023, pp. 209–215. doi: 10.1109/ICCKE60553.2023.10326220. [Google Scholar] [CrossRef]
9. L. Parida, B. R. Parida, M. R. Mishra, S. K. Jayasingh, T. Samal and S. Ray, “A novel approach for human activity recognition using vision based method,” in 2023 1st Int. Conf. Circuits, Power Intell. Syst. (CCPIS), Bhubaneswar, India, 2023, pp. 1–5. doi: 10.1109/CCPIS59145.2023.10292055. [Google Scholar] [CrossRef]
10. Y. Zhao, X. Wang, Y. Luo, and M. S. Aslam, “Research on human activity recognition algorithm based on LSTM-1DCNN,” Comput. Mater. Contin., vol. 77, no. 3, pp. 3325–3347, 2023. doi: 10.32604/cmc.2023.040528. [Google Scholar] [CrossRef]
11. A. O. Ige and M. H. M. Noor, “A survey on unsupervised learning for wearable sensor-based activity recognition,” Appl. Soft Comput., vol. 127, 2022, Art. no. 109363. doi: 10.1016/j.asoc.2022.109363. [Google Scholar] [CrossRef]
12. A. Wang, G. Chen, J. Yang, S. Zhao, and C. Y. Chang, “A comparative study on human activity recognition using inertial sensors in a smartphone,” IEEE Sens. J., vol. 16, no. 11, pp. 4566–4578, 2016. doi: 10.1109/JSEN.2016.2545708. [Google Scholar] [CrossRef]
13. Z. Gao, D. Wang, S. Wan, H. Zhang, and Y. Wang, “Cognitive-inspired class-statistic matching with triple-constrain for camera free 3D object retrieval,” Future Gener. Comput. Syst., vol. 94, no. 1, pp. 641–653, 2019. doi: 10.1016/j.future.2018.12.039. [Google Scholar] [CrossRef]
14. X. Ma, H. Wang, B. Xue, M. Zhou, B. Ji and Y. Li, “Depth-based human fall detection via shape features and improved extreme learning machine,” IEEE J. Biomed. Health Inform., vol. 18, no. 6, pp. 1915–1922, 2014. doi: 10.1109/JBHI.2014.2304357. [Google Scholar] [PubMed] [CrossRef]
15. J. Chaquet, E. Carmona, and A. Fernández-Caballero, “A survey of video datasets for human action and activity recognition,” Comput. Vis. Image Underst., vol. 117, no. 6, pp. 633–659, 2013. doi: 10.1016/j.cviu.2013.01.013. [Google Scholar] [CrossRef]
16. C. W. Lin and Z. H. Ling, “Automatic fall incident detection in compressed video for intelligent homecare,” in Proc. Int. Conf. Comput. Commun. Netw. (ICCCN), Honolulu, HI, USA, 2007, pp. 1172–1177. doi: 10.1109/ICCCN.2007.4317978. [Google Scholar] [CrossRef]
17. Y. Hao, B. Wang, and R. Zheng, “VALERIAN: Invariant feature learning for IMU sensor-based human activity recognition in the wild,” in Proc. 8th ACM/IEEE Conf. Internet Things Des. Implement., New York, NY, USA, 2023, pp. 66–78. doi: 10.1145/3576842.3582390. [Google Scholar] [CrossRef]
18. F. Marquis-Faulkes, S. J. McKenna, A. F. Newell, and P. Gregor, “Gathering the requirements for a fall monitor using drama and video with older people,” Technol. Disabil., vol. 17, no. 4, pp. 227–236, 2005. doi: 10.3233/TAD-2005-17404. [Google Scholar] [CrossRef]
19. W. Y. Shieh and J. C. Huang, “Speedup the multi-camera video-surveillance system for elder falling detection,” in Proc. Int. Conf. Embed. Softw. Syst. (ICESS), Hangzhou, China, 2009, pp. 350–355. doi: 10.1109/ICESS.2009.62. [Google Scholar] [CrossRef]
20. F. Fereidoonian, F. Firouzi, and B. Farahani, “Human activity recognition: From sensors to applications,” in 2020 Int. Conf. Omni-Layer Intell. Syst. (COINS), Barcelona, Spain, 2020, pp. 1–8. doi: 10.1109/COINS49042.2020.9191417. [Google Scholar] [CrossRef]
21. O. D. Lara and M. A. Labrador, “A survey on human activity recognition using wearable sensors,” IEEE Commun. Surv. Tutorials, vol. 15, no. 3, pp. 1192–1209, 2013. doi: 10.1109/SURV.2012.110112.00192. [Google Scholar] [CrossRef]
22. L. Chen, J. Hoey, C. Nugent, D. Cook, and Z. Yu, “Sensor-based activity recognition,” IEEE Trans. Syst., Man, Cybern., C (Appl. Rev.), vol. 42, no. 6, pp. 790–808, 2012. doi: 10.1109/TSMCC.2012.2198883. [Google Scholar] [CrossRef]
23. L. Chen, C. Nugent, and H. Wang, “A knowledge-driven approach to activity recognition in smart homes,” IEEE Trans. Knowl. Data Eng., vol. 24, no. 6, pp. 961–974, 2012. doi: 10.1109/TKDE.2011.51. [Google Scholar] [CrossRef]
24. L. Bao and S. Intille, “Activity recognition from user-annotated acceleration data,” in Lecture Notes in Computer Science, Springer, Berlin, Heidelberg, 2004, vol. 3001, pp. 1–17. doi: 10.1007/b96922. [Google Scholar] [CrossRef]
25. N. Krishnan, D. Colbry, C. Juillard, and S. Panchanathan, “Real time human activity recognition using tri-axial accelerometers,” in Proc. Sens. Signals Inf. Proces. Workshop, Sedona, AZ, USA, Nov. 3–6, 2008. [Google Scholar]
26. J. Qi, P. Yang, M. Hanneghan, S. Tang, and B. Zhou, “A hybrid hierarchical framework for gym physical activity recognition and measurement using wearable sensors,” IEEE Internet Things J., vol. 6, no. 2, pp. 1384–1393, 2019. doi: 10.1109/JIOT.2018.2846359. [Google Scholar] [CrossRef]
27. Y. Zheng, W. Wong, X. Guan, and S. Trost, “Physical activity recognition from accelerometer data using a multi-scale ensemble method,” in Proc. 25th IAAI, Bellevue, Washington, DC, USA, Jul. 14–18, 2013. [Google Scholar]
28. E. Tapia et al., “Real-time recognition of physical activities and their intensities using wireless accelerometers and a heart rate monitor,” in Proc. 11th IEEE Int. Symp. Wearable Comput., Boston, MA, USA, Oct. 11–13, 2007, pp. 37–40. [Google Scholar]
29. J. Kwapisz, G. Weiss, and S. Moore, “Activity recognition using cell phone accelerometers,” ACM SIGKDD Explor. Newsl., vol. 12, no. 2, pp. 74–82, 2010. doi: 10.1145/1964897.1964918. [Google Scholar] [CrossRef]
30. A. Reiss, G. Hendeby, and D. Stricker, “A competitive approach for human activity recognition on smartphones,” in Proc. ESANN, Bruges, Belgium, Apr. 24–26, 2013, pp. 455–460. [Google Scholar]
31. E. Garcia-Ceja, R. Brena, J. Carrasco-Jimenez, and L. Garrido, “Long-term activity recognition from wristwatch accelerometer data,” Sensors, vol. 14, no. 12, pp. 22500–22524, 2014. doi: 10.3390/s141222500. [Google Scholar] [PubMed] [CrossRef]
32. M. H. M. Noor, Z. Salcic, I. Kevin, and K. Wang, “Adaptive sliding window segmentation for physical activity recognition using a single tri-axial accelerometer,” Pervasive Mob. Comput., vol. 38, no. 5, pp. 41–59, 2017. doi: 10.1016/j.pmcj.2016.09.009. [Google Scholar] [CrossRef]
33. N. Ravi, N. Dandekar, P. Mysore, and M. L. Littman, “Activity recognition from accelerometer data,” Lect. Notes Netw. Syst., vol. 43, pp. 317–329, 2019. doi: 10.1007/978-981-13-2514-4. [Google Scholar] [CrossRef]
34. P. Gupta and T. Dallas, “Feature selection and activity recognition system using a single triaxial accelerometer,” IEEE Trans. Biomed. Eng., vol. 61, no. 6, pp. 1780–1786, 2014. doi: 10.1109/TBME.2014.2307069. [Google Scholar] [PubMed] [CrossRef]
35. A. M. Khan, Y. K. Lee, S. Y. Lee, and T. S. Kim, “A triaxial accelerometer-based physical-activity recognition via augmented-signal features and a hierarchical recognizer,” IEEE Trans. Inf. Technol. Biomed., vol. 14, no. 5, pp. 1166–1172, 2010. doi: 10.1109/TITB.2010.2051955. [Google Scholar] [PubMed] [CrossRef]
36. V. B. Semwal, N. Gaud, P. Lalwani, V. Bijalwan, and A. K. Alok, “Pattern identification of different human joints for different human walking styles using inertial measurement unit (IMU) sensor,” Artif. Intell. Rev., vol. 55, no. 2, pp. 1149–1169, 2022. doi: 10.1007/s10462-021-09979-x. [Google Scholar] [CrossRef]
37. G. Vavoulas, C. Chatzaki, T. Malliotakis, M. Pediaditis, and M. Tsiknakis, “The MobiAct dataset: Recognition of activities of daily living using smartphones,” in ICT4AWE, 2016—2nd Int. Conf. Inf. Commun. Technol. Ageing Well e-Health, Proc., Rome, Italy, 2016, pp. 143–151. doi: 10.5220/0005792401430151. [Google Scholar] [CrossRef]
38. W. Huang, L. Zhang, H. Wu, F. Min, and A. Song, “Channel-equalization-HAR: A light-weight convolutional neural network for wearable sensor based human activity recognition,” IEEE Trans. Mob. Comput., vol. 22, no. 9, pp. 5064–5077, 2023. doi: 10.1109/TMC.2022.3174816. [Google Scholar] [CrossRef]
39. W. Huang, L. Zhang, S. Wang, H. Wu, and A. Song, “Deep ensemble learning for human activity recognition using wearable sensors via filter activation,” ACM Trans. Embed. Comput. Syst., vol. 22, no. 1, pp. 1–23, 2023, Art. no. 15. doi: 10.1145/3551486. [Google Scholar] [CrossRef]
40. A. Gumaei, M. Al-Rakhami, H. AlSalman, S. M. M. Rahman, and A. Alamri, “DL-HAR: Deep learning-based human activity recognition framework for edge computing,” Comput. Mater. Contin., vol. 65, no. 2, pp. 1033–1057, 2020. doi: 10.32604/cmc.2020.011740. [Google Scholar] [CrossRef]
41. W. Qi, H. Su, and A. Aliverti, “A smartphone-based adaptive recognition and real-time monitoring system for human activities,” IEEE Trans. Hum. Mach. Syst., vol. 50, no. 5, pp. 414–423, 2020. doi: 10.1109/THMS.2020.2984181. [Google Scholar] [CrossRef]
42. S. Bhattacharjee, S. Kishore, and A. Swetapadma, “A comparative study of supervised learning techniques for human activity monitoring using smart sensors,” in 2018 Second Int. Conf. Adv. Electron., Comput. Commun. (ICAECC), Bangalore, India, Dec. 2018, pp. 1–4. doi: 10.1109/ICAECC.2018.8479436. [Google Scholar] [CrossRef]
43. A. Wang, H. Chen, C. Zheng, L. Zhao, J. Liu and L. Wang, “Evaluation of random forest for complex human activity recognition using wearable sensors,” in 2020 Int. Conf. Netw. Netw. Appl. (NaNA), Haikou, China, 2020, pp. 310–315. doi: 10.1109/NaNA51271.2020.00060. [Google Scholar] [CrossRef]
44. O. Banos, J. M. Galvez, M. Damas, H. Pomares, and I. Rojas, “Window size impact in human activity recognition,” Sensors, vol. 14, no. 4, pp. 6474–6499, 2014. doi: 10.3390/s140406474. [Google Scholar] [PubMed] [CrossRef]
45. C. Catal, S. Tufekci, E. Pirmit, and G. Kocabag, “On the use of ensemble of classifiers for accelerometer-based activity recognition,” Appl. Soft Comput. J., vol. 37, no. 3, pp. 1018–1022, 2015. doi: 10.1016/j.asoc.2015.01.025. [Google Scholar] [CrossRef]
46. Y. Min, Y. Yin, and K. Khin, “Comparing the performance of machine learning algorithms for human activities recognition using WISDM dataset,” Int. J. Comput., vol. 4523, pp. 61–72, 2020. [Google Scholar]
47. S. Kiran et al., “Multi-layered deep learning features fusion for human action recognition,” Comput. Mater. Contin., vol. 69, no. 3, pp. 4061–4075, 2021. doi: 10.32604/cmc.2021.017800. [Google Scholar] [CrossRef]
48. Y. Chen and Y. Xue, “A deep learning approach to human activity recognition based on single accelerometer,” in Proc. 2015 IEEE Int. Conf. Syst., Man, Cybern., Hong Kong, China, 2015, pp. 1488–1492. doi: 10.1109/SMC.2015.263. [Google Scholar] [CrossRef]
49. S. M. Lee, S. M. Yoon, and H. Cho, “Human activity recognition from accelerometer data using convolutional neural network,” in Proc. 2017 IEEE Int. Conf. Big Data Smart Comput. (BigComp), Jeju, Republic of Korea, 2017, pp. 131–134. doi: 10.1109/BIGCOMP.2017.7881728. [Google Scholar] [CrossRef]
50. D. Gholamiangonabadi, N. Kiselov, and K. Grolinger, “Deep neural networks for human activity recognition with wearable sensors: Leave-one-subject-out cross-validation for model selection,” IEEE Access, vol. 8, pp. 133982–133994, 2020. doi: 10.1109/ACCESS.2020.3010715. [Google Scholar] [CrossRef]
51. T. N. Nguyen and S. Zeadally, “Mobile crowd-sensing applications: Data redundancies, challenges, and solutions,” ACM Trans. Internet Technol., vol. 22, no. 2, pp. 1–15, 2022. doi: 10.1145/3431502. [Google Scholar] [CrossRef]
52. M. Ahmed et al., “Real-time violent action recognition using key frames extraction and deep learning,” Comput. Mater. Contin., vol. 69, no. 2, pp. 2217–2230, 2021. doi: 10.32604/cmc.2021.018103. [Google Scholar] [CrossRef]
Cite This Article
 Copyright © 2024 The Author(s). Published by Tech Science Press.
This work is licensed under a Creative Commons Attribution 4.0 International License , which permits unrestricted use, distribution, and reproduction in any medium, provided the original work is properly cited.
 Downloads
 Citation Tools