
 Submit a Paper
 Propose a Special lssue
 Open Access
ARTICLE

Multi-UAV Collaborative Mission Planning Method for Self-Organized Sensor Data Acquisition
1 School of Information Science and Technology, Beijing Forestry University, Beijing, 100083, China
2 Engineering Research Center for Forestry-Oriented Intelligent Information Processing of National Forestry and Grassland Administration, Beijing, 100083, China
3 State Key Laboratory of Efficient Production of Forest Resources, Beijing, 100083, China
4 Division of Biostatistics, Department of Population Heath, Grossman School of Medicine, New York University, New York, NY 10016, USA
* Corresponding Author: Xiaohui Cui. Email:
(This article belongs to the Special Issue: AI-Assisted Energy Harvesting Techniques and its Applications in Wireless Sensor Networks)
Computers, Materials & Continua 2024, 81(1), 1529-1563. https://doi.org/10.32604/cmc.2024.055402
Received 26 June 2024; Accepted 14 September 2024; Issue published 15 October 2024
 View Full Text
 Download PDF
Abstract
In recent years, sensor technology has been widely used in the defense and control of sensitive areas in cities, or in various scenarios such as early warning of forest fires, monitoring of forest pests and diseases, and protection of endangered animals. Deploying sensors to collect data and then utilizing unmanned aerial vehicle (UAV) to collect the data stored in the sensors has replaced traditional manual data collection as the dominant method. The current strategies for efficient data collection in above scenarios are still imperfect, and the low quality of the collected data and the excessive energy consumed by UAV flights are still the main problems faced in data collection. With regards this, this paper proposes a multi-UAV mission planning method for self-organized sensor data acquisition by comprehensively utilizing the techniques of self-organized sensor clustering, multi-UAV mission area allocation, and sub-area data acquisition scheme optimization. The improved α-hop clustering method utilizes the average transmission distance to reduce the size of the collection sensors, and the K-Dimensional method is used to form a multi-UAV cooperative workspace, and then, the genetic algorithm is used to trade-off the speed with the age of information (AoI) of the collected information and the energy consumption to form the multi-UAV data collection operation scheme. The combined optimization scheme in paper improves the performance by 95.56% and 58.21%, respectively, compared to the traditional baseline model. In order to verify the excellent generalization and applicability of the proposed method in real scenarios, the simulation test is conducted by introducing the digital elevation model data of the real terrain, and the results show that the relative error values of the proposed method and the performance test of the actual flight of the UAV are within the error interval of ±10%. Then, the advantages and disadvantages of the present method with the existing mainstream schemes are tested, and the results show that the present method has a huge advantage in terms of space and time complexity, and at the same time, the accuracy for data extraction is relatively improved by 10.46% and 12.71%. Finally, by eliminating the clustering process and the subtask assignment process, the AoI performance decreases by 3.46× and 4.45×, and the energy performance decreases by 3.52× and 4.47×. This paper presents a comprehensive and detailed proactive optimization of the existing challenges faced in the field of data acquisition by means of a series of combinatorial optimizations.Keywords
In consequence of the accelerated evolution of sensor technology in recent years, the deployment of a multitude of sensors with self-organizing characteristics has become a principal method of data acquisition. This is undertaken with a view to obtaining pertinent data within the designated operational range in a variety of fields, including forest fire early warning, forest pest and disease monitoring, and wildlife protection [1–4]. The timely collection of monitoring data from sensors is a crucial element in ensuring the effective functioning of the scenario in question. The conventional method of gathering sensor data through manual patrol is both costly and inefficient. The use of ground-based autonomous aerial vehicle (AAV) to collect sensors in some agricultural production environments is also not applicable to complex field environments [5]. As an airborne carrier of data collection methods, UAV have gradually become an important part of efficient data collection in conjunction with ground-based self-organizing sensors due to their advantages, including high collection efficiency and freedom from terrain constraints [6]. However, relying on UAVs as the sole means of data collection is not a comprehensive solution. When employing UAVs for data collection in the aforementioned scenarios, several critical issues must be considered, including:
• The large number of sensors deployed poses a challenge to UAV data acquisition, and it is often difficult for a single UAV to accomplish the task of acquiring data from a large number of sensors in one go within its energy consumption constraints. The use of a single UAV for data acquisition from each sensor also underutilizes features such as self-organized data transfer between ground sensors.
• Multi-UAV collaborative data collection has become a solution for data collection in multi-sensor deployment scenarios, but in application scenarios with complex environments, collaborative UAVs need to avoid overlapping task areas and other issues when assigning tasks to prevent collisions due to scrambling to collect the same sensors when UAVs collect data.
• For each UAV acquisition task in multi-UAV collaboration, it is still necessary to comprehensively consider information such as sensor position, UAV flight and data acquisition energy consumption, and the AoI of sensor data, etc., and one-sided pursuit of AoI or energy consumption path planning are not applicable to the data acquisition work in the above scenarios [7,8].
In response to the limitations of a single UAV’s energy consumption and the inefficiencies associated with ground sensor monitoring data collection, this paper presents a multi-UAV mission planning method for self-organized sensor data acquisition. This method employs a comprehensive approach, integrating techniques such as clustering, classification, and cooperative optimization. The method begins with the optimization of ground sensor data collection. This is achieved through the exploitation of the self-organized communication characteristics between sensors, whereby key sensors are designated as cluster head (CH) nodes. These CH nodes receive data from surrounding sensors, summarize and back up monitoring data from surrounding sensors, and communicate with UAVs during UAV patrols. This approach ensures that the UAVs only collect sensor monitoring data through the CH nodes, thereby reducing the scale of UAV communication sensors. Then, starting from the optimization of the aerial data collection mode, relying on the advantages of multi-UAV collaborative and efficient data collection, the K-Dimensional classification method is applied to construct the UAV collection task allocation to ensure that the different UAV collection task areas do not overlap and maximize the effectiveness of the collaborative task. Finally, focusing on the needs of single UAV data collection work when multi-UAV collaborate, the objective function and constraints applicable to data collection operations with different sensor scales are designed by taking the AoI and UAV flight energy consumption as important indicators for assessing the efficiency of the collected data.
The main contributions of the methodology proposed in this paper are as follows:
• Aiming at the data collection scenario with multiple ground sensors and multi-UAVs collaborating, a data collection operation method combining self-organized downsizing of sensors and multi-UAV task area division is proposed to improve the efficiency of data collection work.
• The work of data collection is accomplished using UAVs in a collaborative manner, and this paper gives the choice of K-Dimensional division of data collection task areas for each UAV to clarify the division of labor for the task, and at the same time, taking into account the weighting of the AoI and the energy consumption in the process of the task, the use of the Simple Full Permutation Algorithm to plan the optimal data collection operation scheme for each task area.
• The proposed method is not only suitable for large-scale monitoring data collection scenarios where the energy consumption of UAVs is limited, but also has better generalization in national forest parks, national nature reserves, and key monitoring areas of urban environments. Furthermore, it has the potential for application in the fields of fire monitoring, animal protection, and analysis of the effects of environmental governance.
The rest of the paper is organized as follows: in Section 2, the current research status of sensor clustering, multi-UAV task assignment, and single UAV data acquisition path planning related work involved in the proposed method is presented. In Section 3, the general framework of the proposed method and the sensor self-organization method, multi-UAV task area allocation, and data acquisition operation planning method for sub-task areas are introduced. Section 4 observes the experimental results of feasibility analysis experiments and comparative ablation analysis experiments in order to verify the scientific and efficient nature of the method. Sections 5 and 6 provide a discussion looking forward to the follow-up work and a summary of the work in this paper, respectively.
Focusing on the research work carried out in this paper and the typical problems encountered in data collection, it is proposed to put forward solutions from the perspectives of reducing the scale of UAV communication sensor data and multi-UAV collaborative data collection, etc., and the related ground self-organizing sensors clustering, multi-UAV collaborative task allocation, single UAV data collection operation planning, and problem solving of the methods proposed in this paper in the relevant application scenarios are summarized as follows.
2.1 Clustering Method for Ground-Based Self-Organizing Sensors
To address the problem of collecting monitoring data from a large number of self-organizing sensors deployed on the ground, clustering algorithms can be used to reduce the size of the sensors [9,10].
Sensor clustering is the process of dividing the full domain into sub-domains, combining sensors within the same sub-domain into a cluster, and selecting a CH sensor from each cluster to be responsible for integrating all data in the cluster [11,12]. Current sensor clustering algorithms are classified as Deterministic CH Selection Algorithms [13], Random CH Selection Algorithms [14], Adaptive CH Selection Algorithms [15], Distributed Clustering Algorithms [16], Hybrid Clustering Algorithms [17] and Centralized Clustering Algorithms [18]. These clustering algorithms do not comprehensively take into account the energy consumption of subsequent UAVs when collecting data and cannot be directly used in practical scenarios of large-scale data collection.
α-hop is a clustering algorithm that reduces communication loss by decreasing the number of communication hops, the algorithm uses the average distance of the sensors in the clustered area to the rest of the sensors as a weight, and the shortest distance sensor is selected as the CH. Existing α-hop based sensor clustering methods are usually used in smart city scenarios, where sensors are clustered through a two-dimensional mesh without considering issues such as sensors being blocked by buildings. In complex data collection scenarios, it is necessary to improve the α-hop method and construct a backup scheme for critical data to overcome the problems of communication blocking and single-point failure after sensor clustering that may result from complex field scenarios.
2.2 Tasking Method for Collaborative Data Collection by Multi-UAV
Limited by the energy consumption constraints of a single UAV, the use of multi-UAVs to collaborate on data collection tasks is the main means to improve the efficiency of data collection [19,20].
Multi-UAV collaborative data collection focuses on the problem of collaborative UAV path planning and the problem of multi-UAV task allocation. For the former, common solutions include graph-theoretic based algorithms containing pure graph-theoretic class methods, optimization class methods, and hybrid class and intelligent optimization methods. Among them, purely graph-theoretic methods include V-shaped Rono Diagrams, Probabilistic Road Maps, and Hilbert Curves [21]. Algorithms based on optimization theory include Dynamic Programming and Branch Bounding [22,23]. Other hybrid and intelligent optimization class methods include the use of Efficient Cutting Plane Method [24], Ant Colony Optimization Algorithms [25], etc. The above UAV path planning method for data collection simply assumes that the energy source of the UAV is always sufficient, which reduces the applicability of the method when the number of ground sensors to be communicated is high and the energy consumption of a single UAV is limited. When conducting coordinated multi-UAV data collection, the existing ground sensors to be collected need to be divided to form a task area with a moderate amount of UAV collection tasks that do not spatially overlap each other.
In order to meet the needs of task allocation, the multi-UAV collaborative data task allocation method can be optimized based on K-Dimensional [26,27]. K-Dimensional is supposed to be a K-Dimensional spatial data indexing optimization method that uses a division method in constructing the tree that divides the ground nodes according to their distance distribution. In the process of task allocation, the attribution of nodes in the tree can be controlled to ensure that the number of nodes in each region is approximately the same, so as to obtain the set of sensors with the nearest-neighbor relationship, and the sub-tasks after the division are similar in size and do not overlap, which can help to take advantage of the high-efficiency data collection by multi-UAVs.
2.3 Operational Planning Method for Data Collection by Single UAV
In a single UAV data collection mission, the planning of UAV data collection operations within the mission area needs to be addressed.
AoI is used as an important metric to measure the latency of UAV data collection [28,29], which is defined as the time difference between the generation of information and the time up to the current moment. Considering that some scenarios, such as forest fire prevention and pest monitoring, both have high requirements for monitoring data quality, existing research results propose UAV path planning methods to solve data collection problems in different fields based on the AoI of the data.
Energy consumption is also another important factor in determining UAV path planning [30–32]. The energy consumption of UAV primarily consists of flight propulsion energy, communication energy, and other forms of energy consumption. Since the propulsion energy consumption of the UAV in a single UAV data acquisition mission is much larger than the communication energy consumption transferred between sensors, the rest of the energy consumption excluding the UAV propulsion energy is negligible [33,34]. Existing research results have constructed energy derivation equations based on patrol needs, from the perspective of different flight modes [35].
2.4 Prospects for UAV Application in Data Collection Scenarios in Related Fields
UAVs collecting sensor data or UAVs carrying their own data collection equipment have a wide range of application scenarios in many fields. Behavioral recognition of rare wild animals in field environments is a popular field, and common schemes are utilizing the improved YOLOv5s based model including Mobile Bottleneck Block module and improved StemBlock to reduce the computational cost, using Focal-EIoU as a loss function, and adopting BiFPN-based neck to improve the accuracy of predicting the bounding box, deriving the WildARe-YOLO lightweight framework model, deep learning and convolutional neural network automation for analyzing a large amount of data and identifying features on a limited animal dataset, and improving the ability to process and analyze animal behaviors [36,37]. Alternatively, feature enhancement and feature extraction can be carried out by monitoring the animal’s habits through the collection of life traces left by the animal, for example, by using non-invasive footprint recognition techniques to develop classification algorithms based on data extracted from captive northeastern tiger footprints [38]. The algorithms use cross-validated discriminant analysis to determine the distances between the centroids of the footprint pairs, and then use Ward’s hierarchical clustering technique to classify the footprints into clusters that minimize the internal variance. For the above scenarios, UAVs are able to track and observe the behavioral image data of wildlife in close proximity, or use sensors to monitor the animal’s habits over time in order to obtain the animal’s time-series data, and then use multi-UAVs to collect the data within the sensors at regular intervals in order to get a quick and accurate picture of the animal’s behavior as well as its habitat range [39].
The above research results provide reference programs for this paper to solve the UAV data collection operation planning problem of data collection in different scenarios from the perspectives of AoI and energy consumption constraints. Based on the research work of ground sensor clustering method and multi-UAV cooperative task, the UAV energy and AoI should be comprehensively considered to construct the weight acquisition method to reasonably determine the energy consumption and AoI as well as the optimal data collection operation plan for UAVs. Examples of the applicable scenario domains of the method are also given to reflect the applicability of the proposed method in different domains for efficient problem solving.
Facing the problems of limited energy consumption of a single UAV and the freshness of large-scale ground sensor monitoring data collection, this paper proposes a multi-UAV mission planning method for self-organized sensor data collection. The method proposes a sensor clustering method and a multi-UAV collaborative task area allocation as well as a single UAV data collection operation planning scheme within a sub-task area from the perspective of ground sensor scale optimization and airborne multi-UAV task allocation and path planning. The method flow framework is shown in Fig. 1.
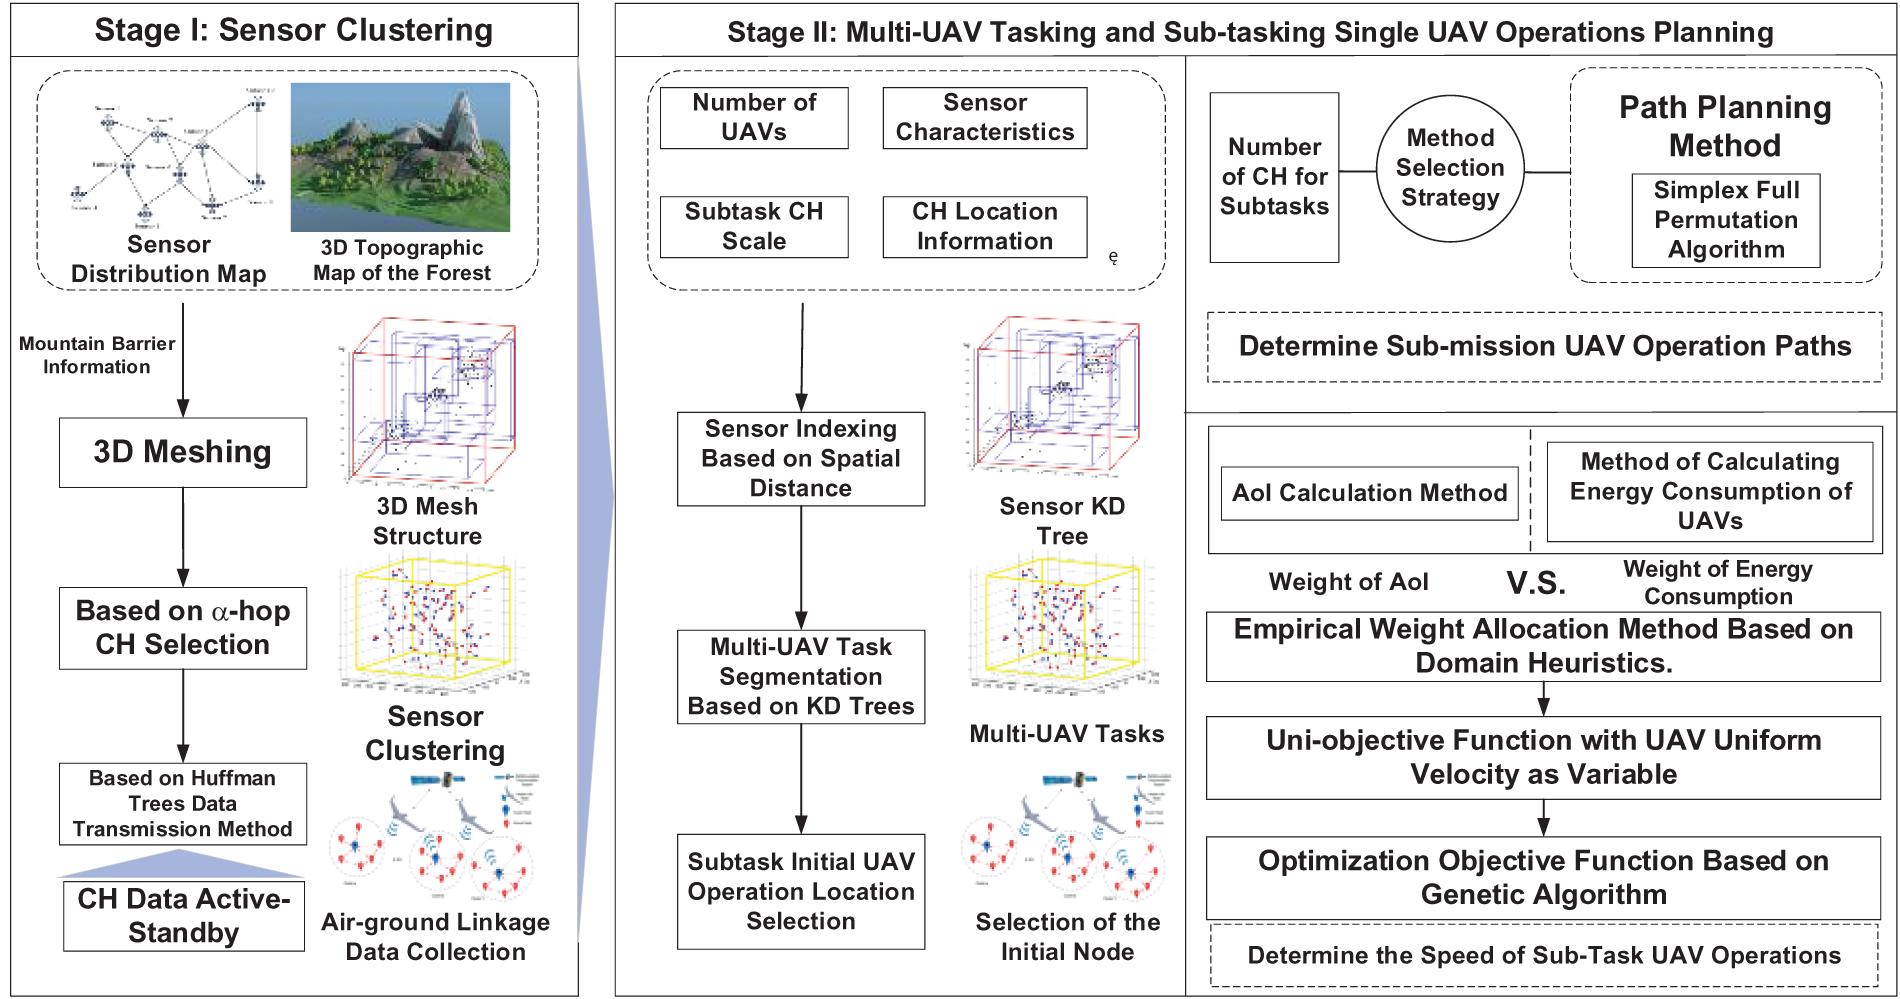
Figure 1: Methodological process framework diagram
Stage 1: Sensor Clustering. Sensor clustering employs the self-organizing attributes of ground sensors in the monitoring domain, integrating ground terrain variables, selecting cluster head nodes for data aggregation and communication with UAVs through an enhanced three-dimensional (3D) grid and α-hop algorithm, and according to the CH nodes. The data transmission mode within the grid is determined through the Huffman tree, while consideration is given to the potential single-point failure of CH nodes in field scenarios. Through the implementation of a backup strategy for collected data, the redundant storage of key monitoring data and the main and backup switching of CH nodes are achieved. A detailed account of Stage 1 is provided in Section 3.1.
Stage 2: Multi-UAV Tasking and Sub-tasking Single UAV Operations Planning. The multi-UAV task allocation method synthesizes the number of task areas and the near-neighbor information of CH sensors after clustering, forms a single UAV data collection area with non-crossing task areas based on the improved K-Dimensional division, solves the problem of collision when collecting data from multi-UAVs, and at the same time, based on the sub-task areas and the starting point of the UAV flights after the division, determines the first UAV’s data collection CH. The single UAV operation planning method for a sub-task area applies the Simple Full Permutation Algorithm to confirm the shortest paths for UAV flights under different task areas based on the CH sensors of the data to be collected in the sub-tasks, and then, by combining the weight assignments of the AoI of data and the UAV’s propulsive energy consumption, as well as the UAV’s flight speed and other elements, determines the actual operation scheme for the actual UAVs to collect the data. Multi-UAV tasking and sub-tasking single UAV operation planning methods are described in Sections 3.2 and 3.3.
The sensor clustering process specifically consists of three parts: 3D homogeneous mesh delineation, CH selection based on α-hop algorithm and monitoring data backup based on Huffman tree.
To improve the 2D homogeneous mesh partitioning method for sensor clustering in smart cities in response to the sensor communication blockage problem that may be caused by the terrain in the monitoring scenario, different 3D mesh partitioning methods are established for the environments with mountainous blockage and terrain platform environments.
For environments separated by a mountain, two ninety-degree straight lines extending from the center of the mountain are used as the boundary lines of the 3D homogeneous mesh to ensure that the ground sensors assigned to the same 3D mesh are not separated by the terrain. Taking the simulated terrain map with three peaks as an example, the three peaks are used as the boundary line of the 3D mesh to ensure that the sensors divided in the same mesh can communicate directly, laying the foundation for the selection of the CH sensors in the mesh, as shown in Fig. 2.
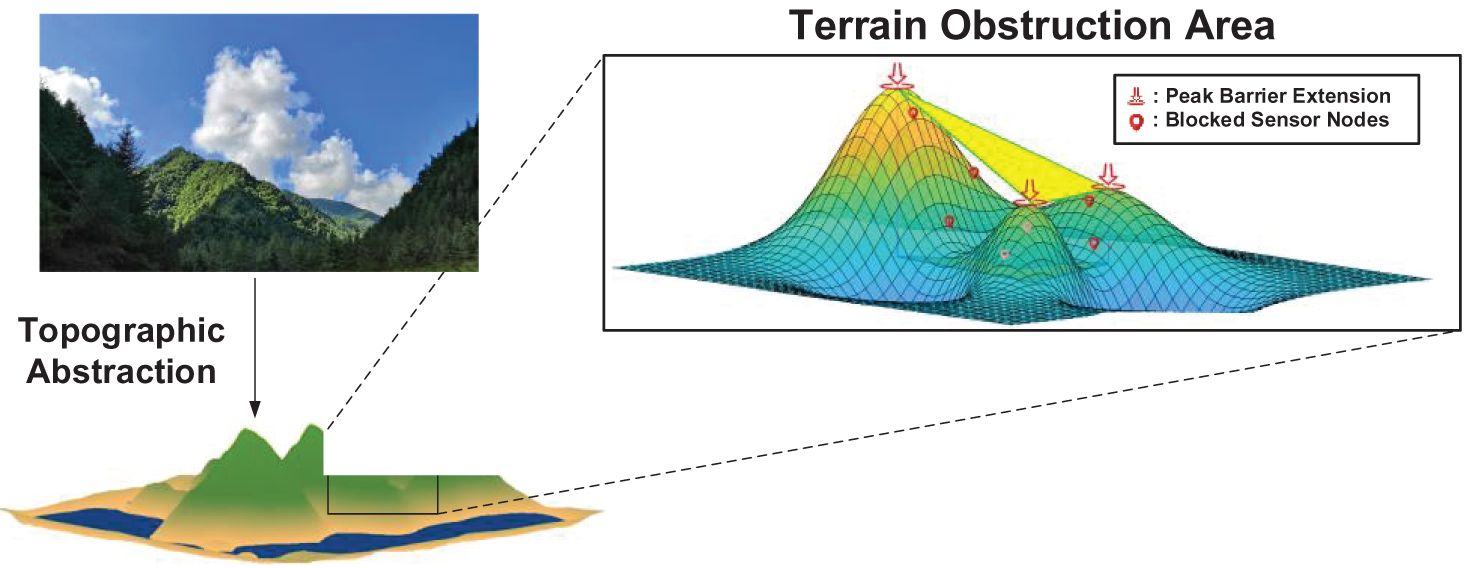
Figure 2: Schematic diagram of sensor clustering preprocessing blocked by terrain
For areas where the terrain is flat and there is no communication hindrance, a homogeneous mesh is used to preprocess the sensors to be clustered and delineate the clustered areas. Homogeneous mesh processing means that the area to be processed is divided into several homogeneous meshes using cubes with different locations but the same parameters for the rest of the 3D planes.
In practical application scenarios, the mesh division granularity can be determined independently according to the number of deployed sensors and data collection capabilities, and the appropriate mesh granularity determines a small difference in the number of sensors in each mesh, avoiding problems such as difficult selection of aggregation and CH nodes due to the imbalance in the number of sensors in different meshes.
3.1.2 CH Selection Based on α-hop Algorithm
According to the self-organization characteristics of the ground sensors in the grid, after dividing the 3D grid, the CH sensors are selected using the α-hop clustering algorithm, which is used to collect the monitoring data from the other sensors in the grid and communicate with the UAV to send the data to the UAV [40].
Analyzing the energy consumption of ground sensor data sending and receiving to determine the basis of CH selection for the α-hop algorithm.
Sensor Transmission Data Energy Consumption: the energy consumed to transmit k-bits of information over a distance d is given by the following equation:
where
Sensor receiving data energy consumption: energy equation for receiving k-bits messages to calculate the energy consumption.
where
Sensors within the same 3D grid monitor data using single-hop communication to reduce data transmission energy consumption. Meanwhile, combining Eqs. (1) and (2), the energy consumption of inter-sensor communication to monitor data is positively proportional to the distance between sensors.
where
Based on Eq. (3), the pseudo-code of the algorithm for selecting CHs from all 3D meshes in the region using the α-hop clustering method is as follows:
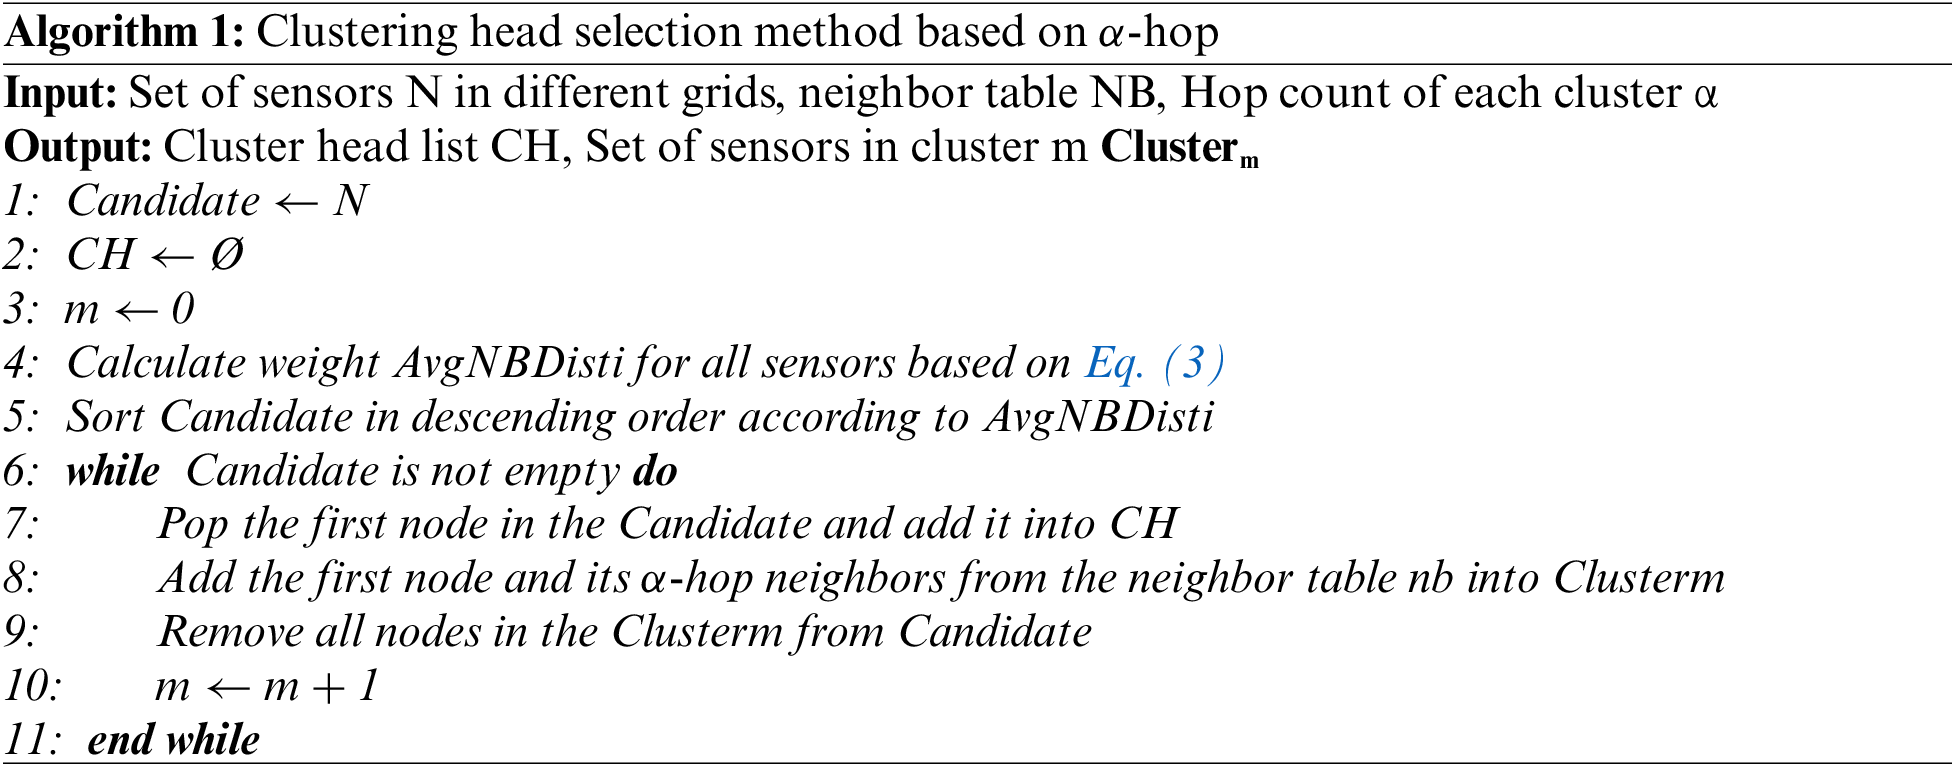
The idea of Algorithm 1: First, each sensor i in the 3D grid is considered as a candidate CH. Then, the sensor distance weight
3.1.3 Monitoring Data Active-Standby Strategy
CH nodes need to be selected to further aggregate other data in the grid into the CH nodes, according to the single-hop sensor transmission data needs, the CH sensor selected by the α-hop clustering algorithm as the root node of the tree for transmitting the data, and the relationship between the nodes is abstracted as a heat map of the neighboring table with distance weights, and through the Huffman tree method, to build a tree structure for the transmission of data from the sensors to ensure that the parent sensors in the tree will store the data of child sensors and finally converge all the monitoring data in the grid to the CH sensor which is the root of the tree [41,42]. Considering the problem of single-point failure in the CH stage, in order to ensure the integrity and security of monitoring data, we draw on the strategy of “high availability” of distributed data storage to construct a master and backup strategy for monitoring data. Using the α-hop clustering algorithm, the sensor with the smallest average distance weight outside the current CH sensor is selected as the alternate CH node. In the spare CH sensor, monitoring data from the CH sensor is stored redundantly at regular intervals, and the remaining sensors redundantly store monitoring data that has been sent to the parent sensor before the UAV successfully collects data from the CH sensor. When the CH sensor fails due to internal or external reasons, etc., the Huffman tree of sensor communication data is reconstructed according to the weights of Eq. (3), and the data collected by the failed CH sensor is recovered based on the redundantly stored data in the standby CH sensor, which aggregates the data in the other sensors and communicates with the UAV. As shown in Fig. 3.
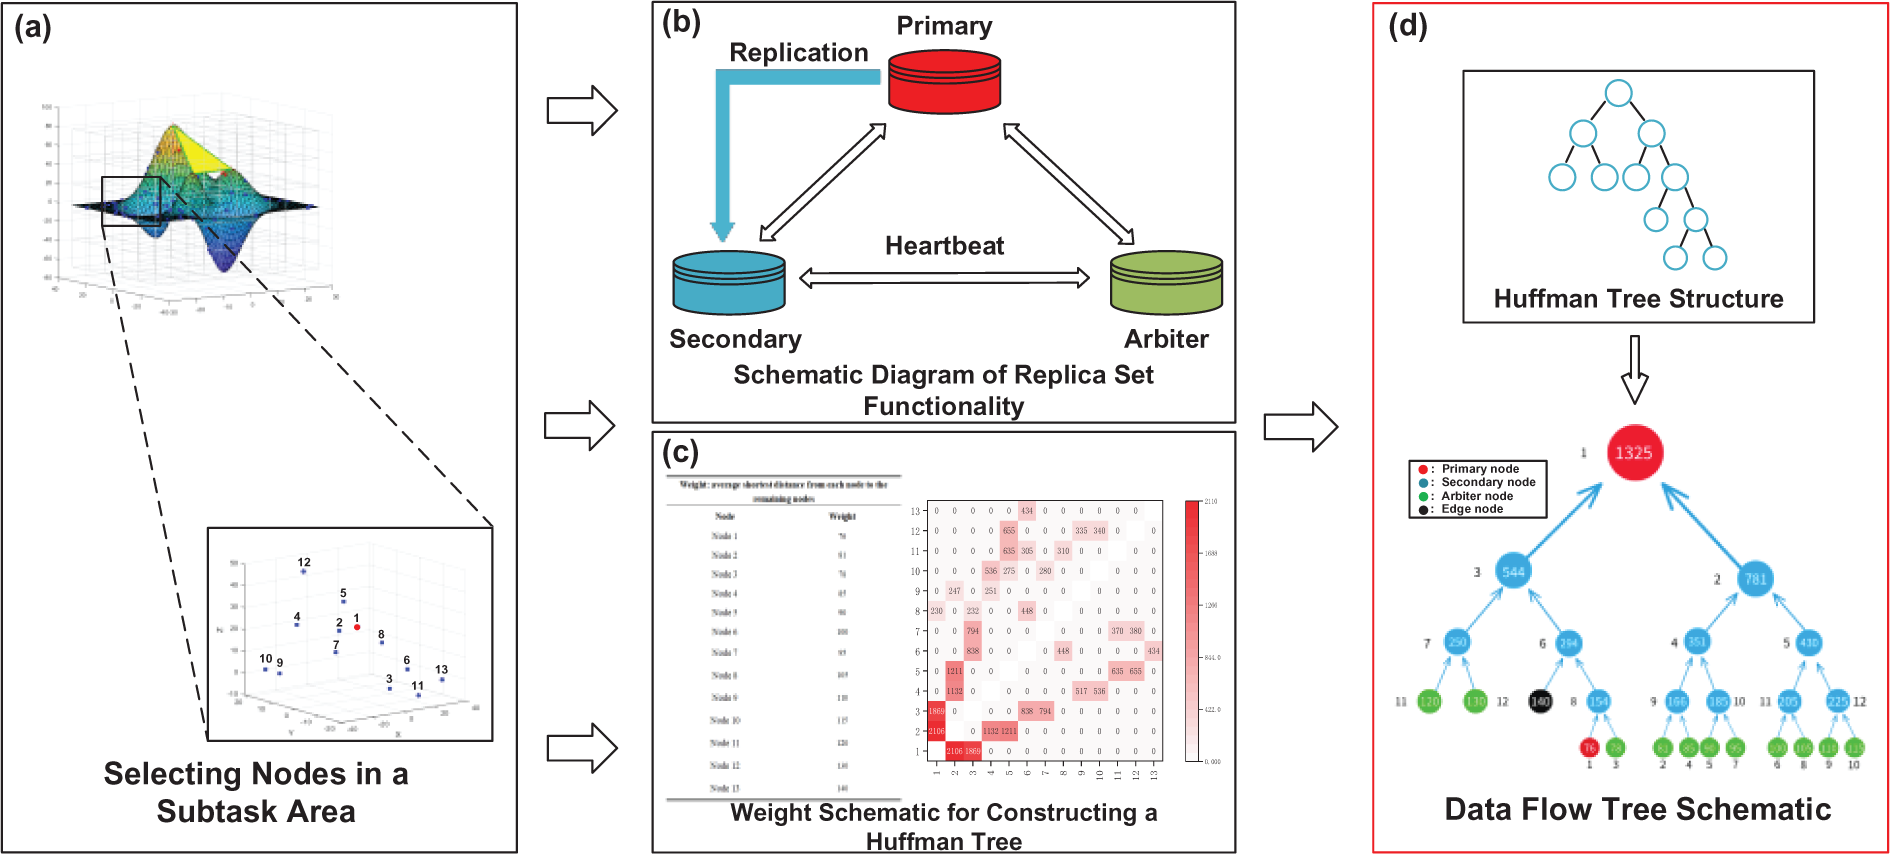
Figure 3: Schematic flowchart for constructing replica sets to store data redundancy and data flow
3.2 Multi-UAV Collaborative Task Area Allocation
The key to collaborative data collection by multi-UAVs is the task division of sensor CH nodes to form sub-task regions where the task regions do not intersect and satisfy data collection by a single UAV. At the same time, it is also necessary to identify the collection CH sensors for UAV collection in each sub-task region.
When tasking CH sensors in 3D space, the distance of the sensors as well as the scale of the sensors need to be taken into consideration. K-Dimensional, as a K-Dimensional spatial data organization and query optimization method, can set the CH sensors in the 3D mesh as nodes on the K-Dimensional tree, and then with the advantage of the K-Dimensional tree division, through the near-neighborhood relationship of the cluster-head sensors, the CH sensors will be grouped and the obtained is the grouping of the CH sensors after the division [43,44]. Each group after division naturally contains a collection of sensors with nearest-neighbor relationships, and at the same time, the overall scale of each post-division task sensor is moderate and each task area is not intersected, so that no collision occurs due to simultaneous grabbing of the same sensor node’s acquisition position, which meets the demand for multi-UAV collaborative task division of labor.
The pseudo-code for carrying out multi-UAV collaborative task division using K-Dimensional is shown below:
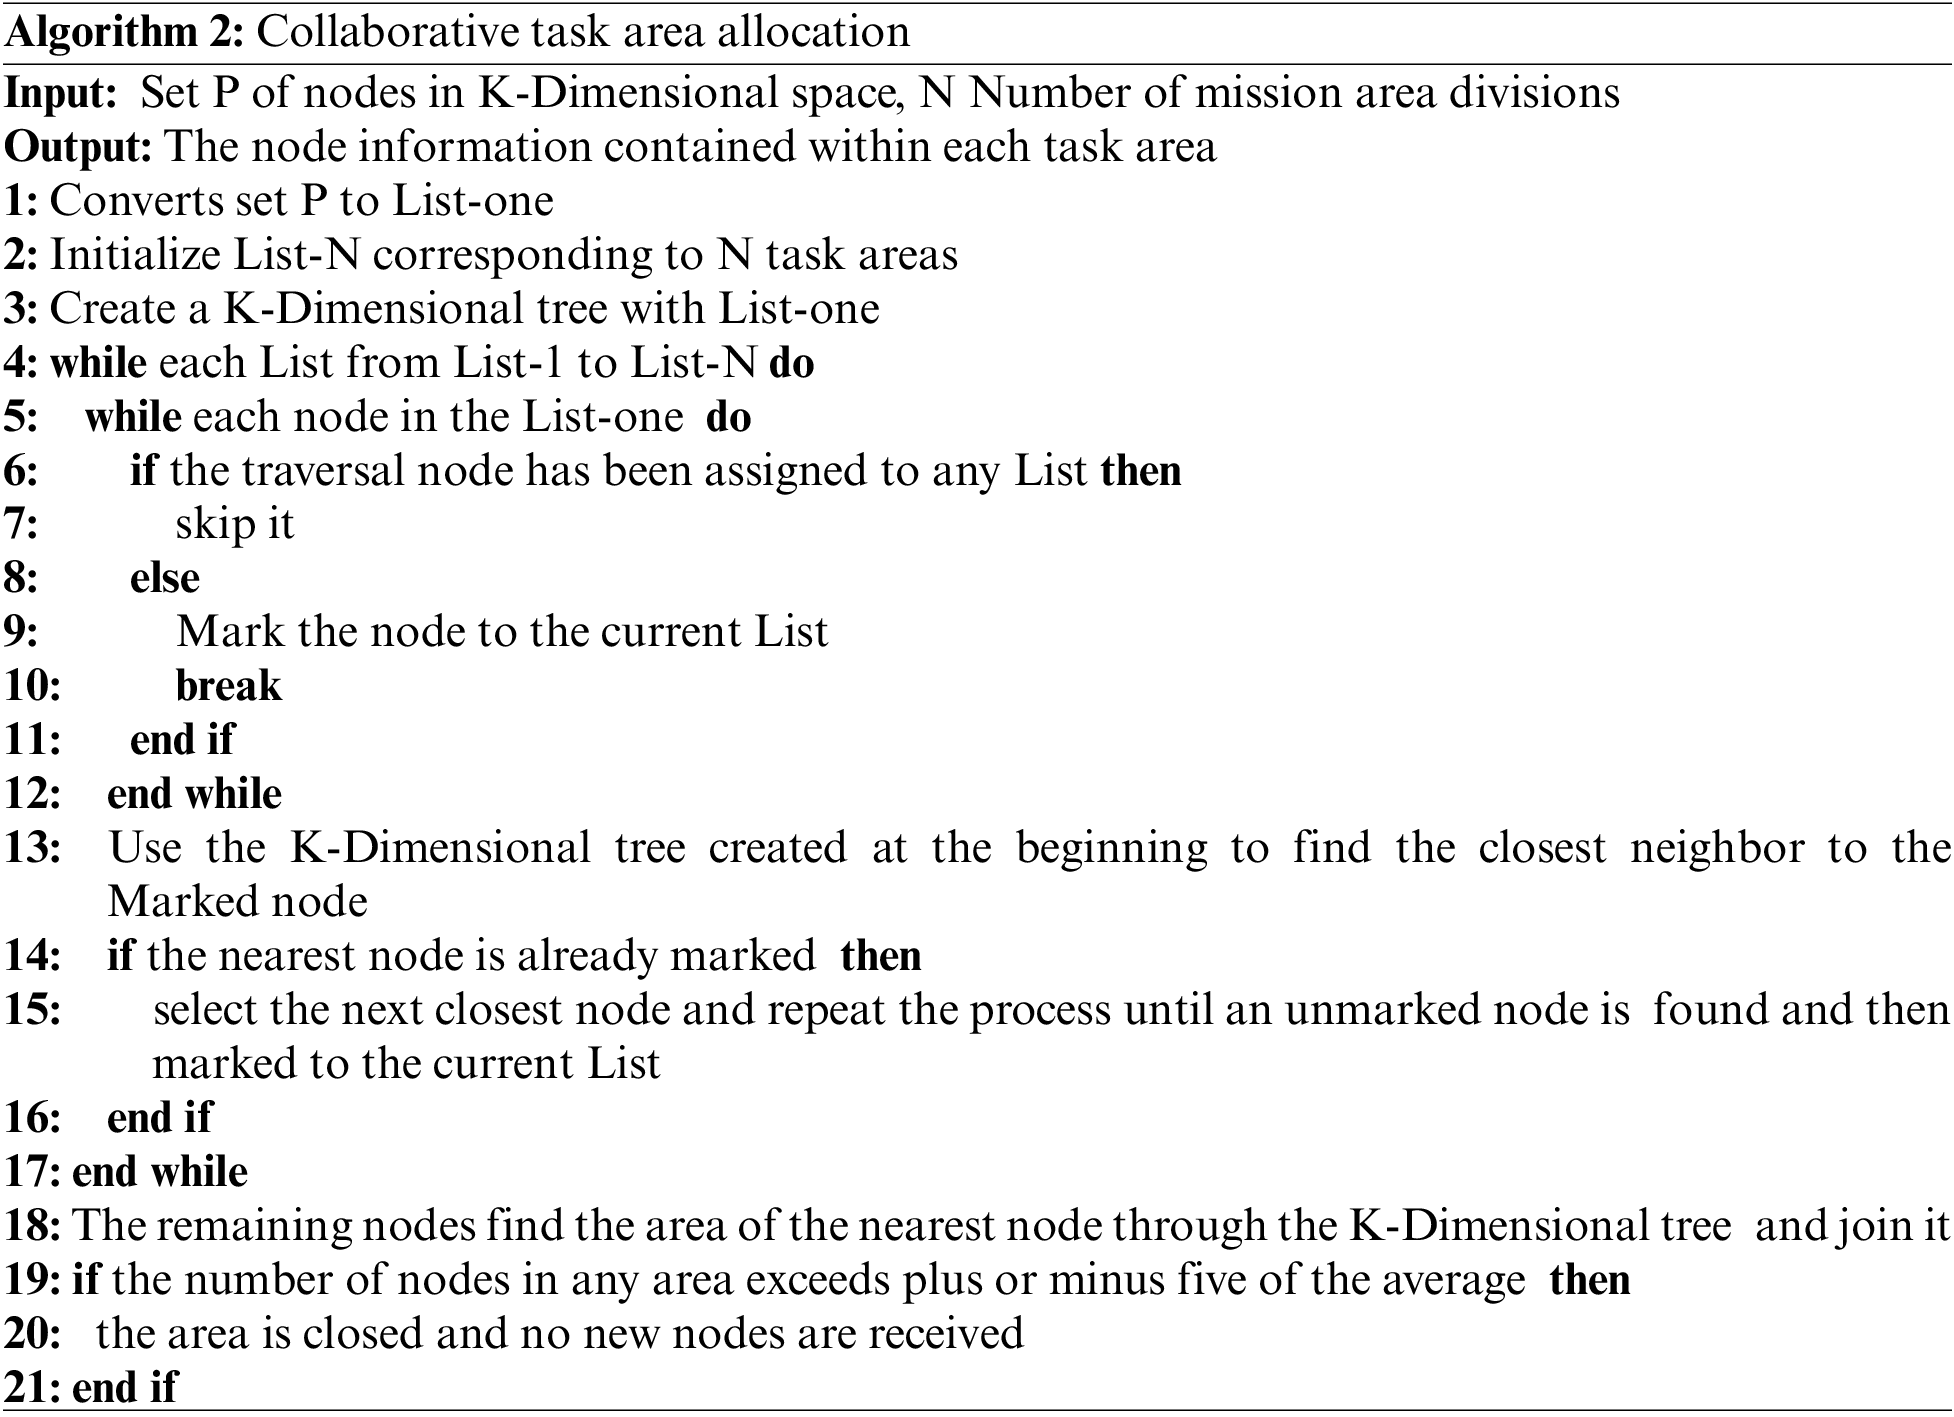
The idea of Algorithm 2: First, based on the parameter information such as the 3D coordinates of the CH sensors and the number of task area divisions, the clusters are constructed into a tree model using the K-Dimensional classification method. Then, the CHs with similar spatial locations are grouped into the same task area. Finally, the divided different regions are used as UAV air-ground linkage task subspaces.
When operating in the sub-task area, assuming that there are n CH sensors, Eq. (4) can be used to determine the CH sensor in the sub-task area with the shortest average distance from the rest of the sensor nodes, which will be used as the first acquisition node for the UAV to collect data.
where
3.3 Planning of Data Acquisition Operations within the Sub-Task Area
Within each sub-mission area, individual UAV data collection operations need to collect data from all CH sensors faster within their energy consumption constraints to ensure the AoI of the monitoring data.
Studies have shown that the transmission energy consumption of UAV data collection is much smaller than the propulsion energy consumption when the UAV is in flight [45], and therefore the main energy consumption of the UAV comes from the flight energy consumption. In field scenarios, stable UAV flight energy consumption can greatly enhance the probability of safe return of the UAV, which is usually assumed to fly at a constant speed when carrying out UAV data collection. In the process of data collection, the data AoI is directly proportional to the data collection time, i.e., flight time.
Based on the above analysis, the key parameters to be weighed in UAV operations include: flight distance, uniform speed and flight time, with the goal of minimizing AoI and flight energy consumption. Considering that the flight distance is related to the trajectory of the UAV flying in the sub-region [46,47], the flight path can be determined firstly based on the scale and location of the CHs in the sub-region. Then, the empirical determination scheme of the considered weights for the AoI and energy consumption constraints is constructed to convert the multi-objective problem of AoI and flight energy consumption into an objective function that unifies the speed as a variable. Finally, the optimization method is used to obtain the optimal flight speed that satisfies the AoI and the energy consumption of UAV flight, which provides a practical operation plan for UAVs [48,49].
UAV data collection can use fixed-wing and rotary-wing UAVs, considering that collecting monitoring data requires more energy consumption and fixed-wing UAVs are more suitable for long-distance navigation than rotary-wing UAVs in complex scenarios, for this reason, the calculation method of fixed-wing UAV energy consumption is used in all the later sections when representing the energy consumption of a single UAV operation. After determining the flight path of the UAV sub-area, it is necessary to further determine the parameter representations such as the AoI and the energy consumption of the UAV flight related to the data collection task, and then construct the objective function and constraints describing the single UAV operation.
AoI is related to the time it takes for the UAVs in the sub-region to collect monitoring data from each CH sensor [50].
First, the flight elapsed time between the k-th and k + 1st sensors of neighboring CH sensors in the UAV flight path is calculated as shown in Eq. (5).
where
Second, based on Eq. (5), the AoI of the k-th CH sensor in the acquisition path is calculated as shown in Eq. (6).
where
Finally, Eqs. (5) and (6) are combined to calculate the average AoI of the data from all the CH sensors along the entire flight path, as shown in Eq. (7).
where n represents the total number of sensors in the delineated sub-task area, the equation sums up the AoI of all the sensors and later divides it by the total number of sensors to find the average AoI of the CH sensor data.
According to Eq. (7), given the UAV flight path in the sub-task area, the average value of the AoI of the monitoring data of the CH sensors on the path is related only to the UAV flight speed v.
3.3.2 Representation of UAV Flight Energy Consumption
Fixed-wing UAV flight energy consumption is related to the UAV flight propulsion energy. The fixed-wing UAV propulsion energy is shown in Eq. (8) [45,51].
where
When the fixed-wing UAV carries out uniform flight and collects animal monitoring data, Eq. (8) needs to be adjusted to the uniform form, and after the initial simplification of Eq. (8), the propulsion energy consumption
where T denotes the total flight time of the UAV in the sub-region, considering the velocity homogeneity and eliminating the integral sign, the further simplified equation is shown in Eq. (11).
During the UAV flight, the UAV flight time consists of the total flight time
In order to differentiate from the neighboring distances in Eq. (5),
Substituting the sum of Eq. (12) into having Eq. (11), the propulsive energy consumption representation of the CH sensor for a fixed-wing UAV homogeneous collection sub-region is obtained as shown in Eq. (13).
According to Eq. (13), the UAV flight propulsion energy consumption is only related to the UAV flight speed v, given the UAV flight path in the sub-task area.
3.3.3 Objective Function and Solution Method
Considering that the lower the value of Eq. (7) the better the AoI collected, and the lower the value of Eq. (13) the lower the energy consumption of the UAV flight, i.e., both the AoI and the energy consumption are minimization constraints. Therefore, the existing theoretical model can be improved by utilizing the linear superposition approach to represent the AoI and flight energy consumption as a unified objective function, as shown in Eq. (14).
where n is the total number of CH sensors in the sub-region, and
The constraints of Eq. (14) are:
For
Based on the actual data, different orders of magnitude of weight ratios are assigned to AoI weight
After determining
It focuses on the experimental environment and the basis of parameter setting of the involved algorithms or methods, the construction of data sets, the content of the experiments and the analysis of the results of comparative experiments.
4.1.1 Experimental Environment and Parameter Settings
Experimental Environment: Hardware and software infrastructure: Intel Core i9-13900H Processor, 32 G RAM. Windows 11 System. Method development and experimental platform: PyCharm 2022.3.3 Platform. MATLAB r2018b.
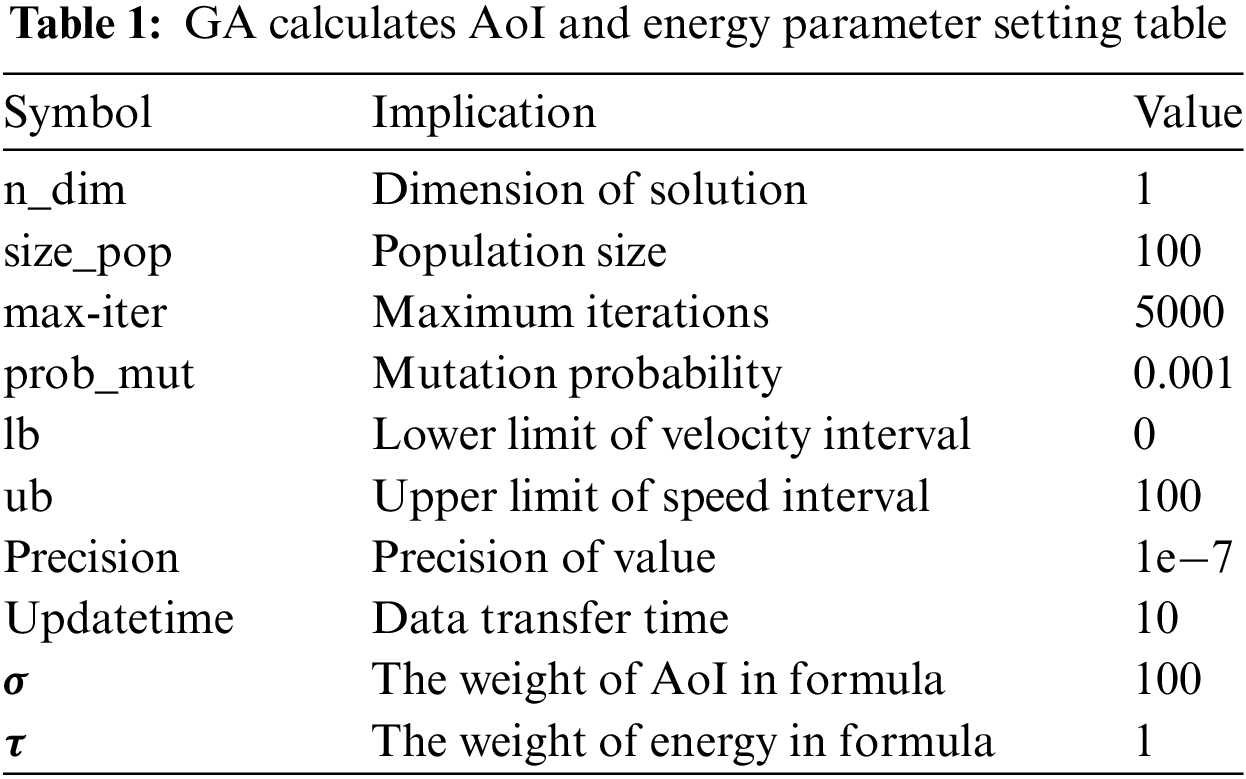
Parameter Setting: The proposed method requires the use of genetic algorithm to optimize the flight speed of the UAV. The built-in parameters of the genetic algorithm are set as shown in Table 1. The preliminaries and demand solution parameter settings for the experiment are shown in Table 2.

The 3D spatial length X, Y, and Z of the simulation dataset are set to 100, which is a data setting related to the spatial length of the simulation data with the simulation. In the later text, the spatial measurements in both horizontal and vertical coordinates in the charts are represented by X, Y, Z here.
The UAV model chosen for this experiment is V500H and its parameters are shown in Table 3.

In this experiment, relevant tests are conducted in a real environment, and the geographic location of the UAV test site is 34°35′–40°19′N latitude and 110°15′–116°27′E longitude. Its geographic characteristics are deciduous broad-leaved forest zone in the North China Plain in the east, forest-steppe zone and steppe zone in the Loess Plateau in the west, and there are also obvious differences in vegetation and soil vertical zone characteristics between the two sides. Because of its high density of forest vegetation coverage and more complex geomorphological environment, it becomes an ideal test flight site for UAVs. The actual scene and flight process are shown in Fig. 4.
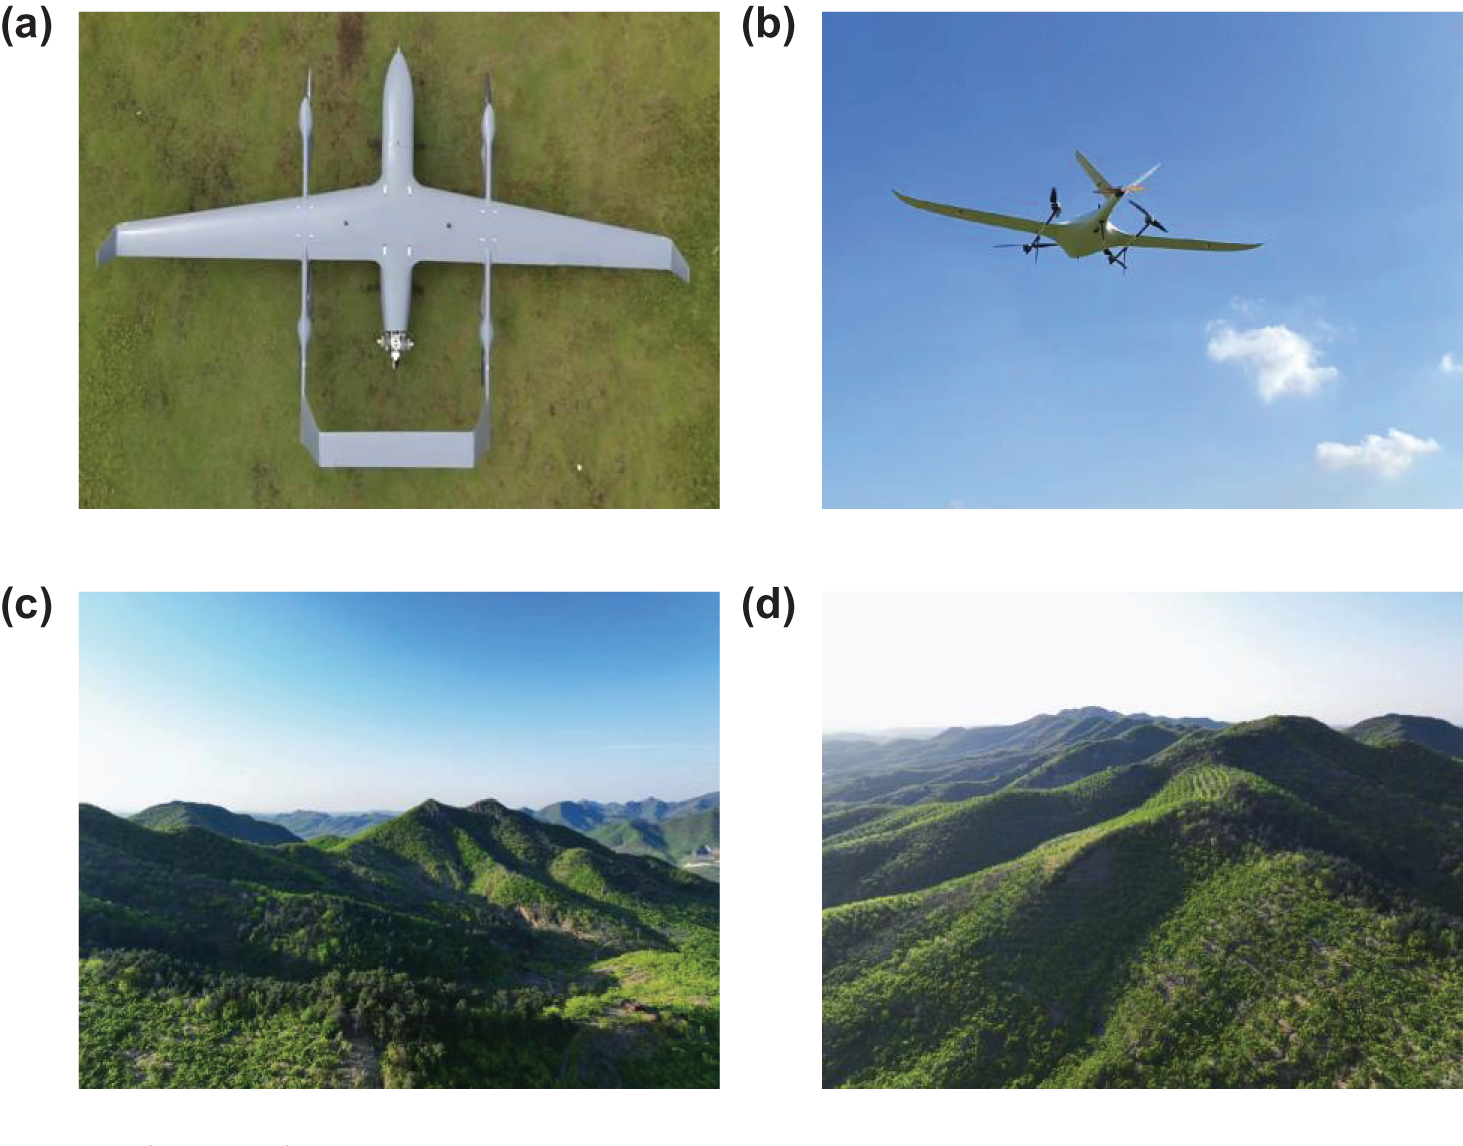
Figure 4: UAV flight type (a), UAV flight process (b), UAV flight observation scenario (c, d)
In order to verify the applicability and feasibility of the method proposed in this paper in real scenarios, the terrain features in the area of 34°35′–40°19′ N latitude and 110°15′–116°27′ E longitude are portrayed with digital elevation model terrain data. The TIFF type data were cleaned using the MATLAB r2018b platform and the terrain data were visualized in PyCharm 2022.3.3 Platform by introducing the tifffile library. The experimental terrain dataset is obtained by controlling the parameter information of the terrain as shown in Fig. 5. The mission was to collect data built into the sensors deployed in the forest, acquiring the data in a communication mode using a cross use of Los and NLos links.
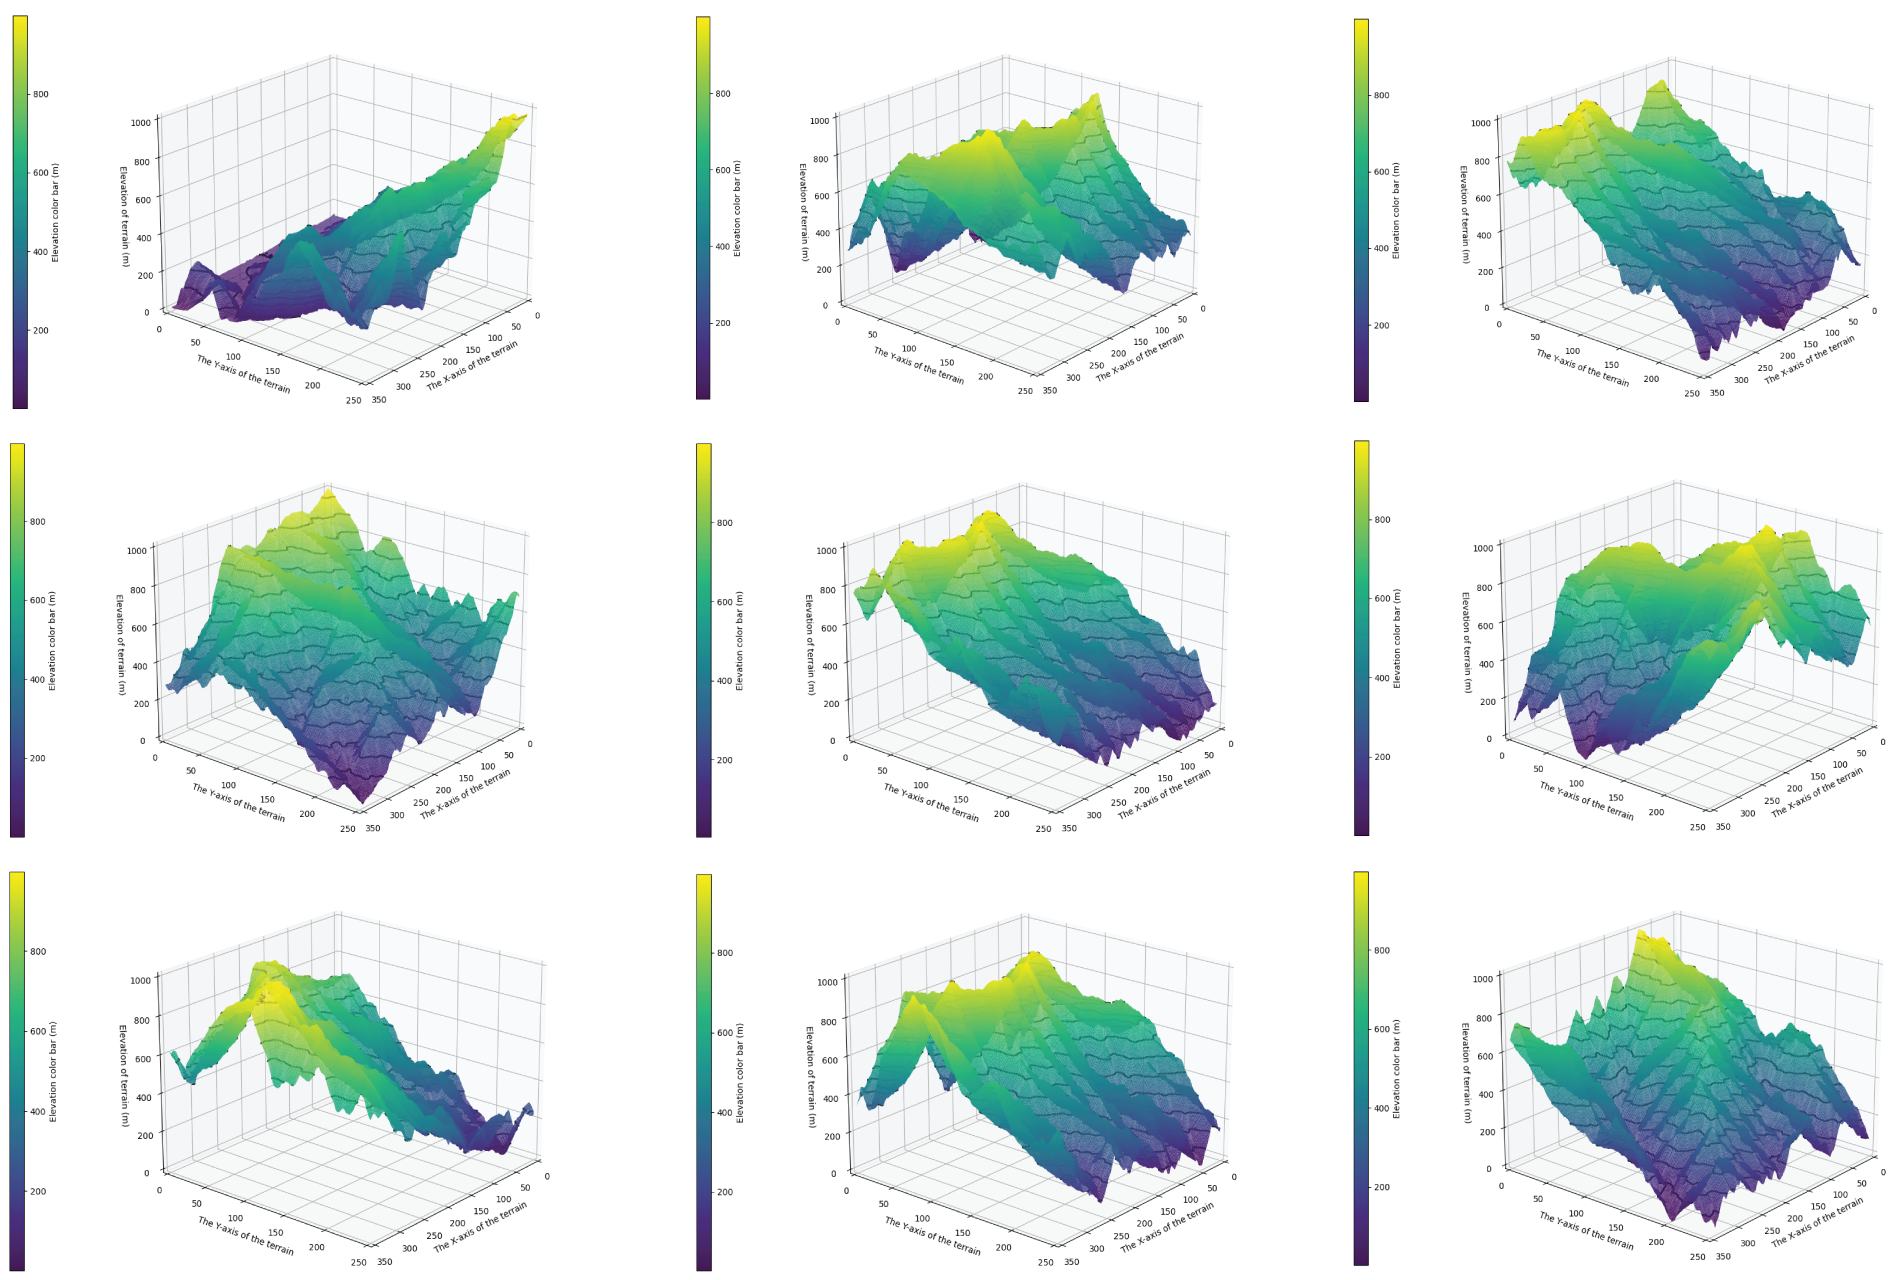
Figure 5: Visualization of digital elevation model terrain datasets
4.1.2 Simulation Dataset Construction Methodology
Using PyCharm with MATLAB in 3D space, a random function randomizes the locations of the required number of sensors generated for the experiment (as shown in Fig. 6a). And based on the deployment of sensors in the real field environment, the terrain topography with peak blocking (as shown in Fig. 6b) and without peak blocking (as shown in Fig. 6c) are generated.
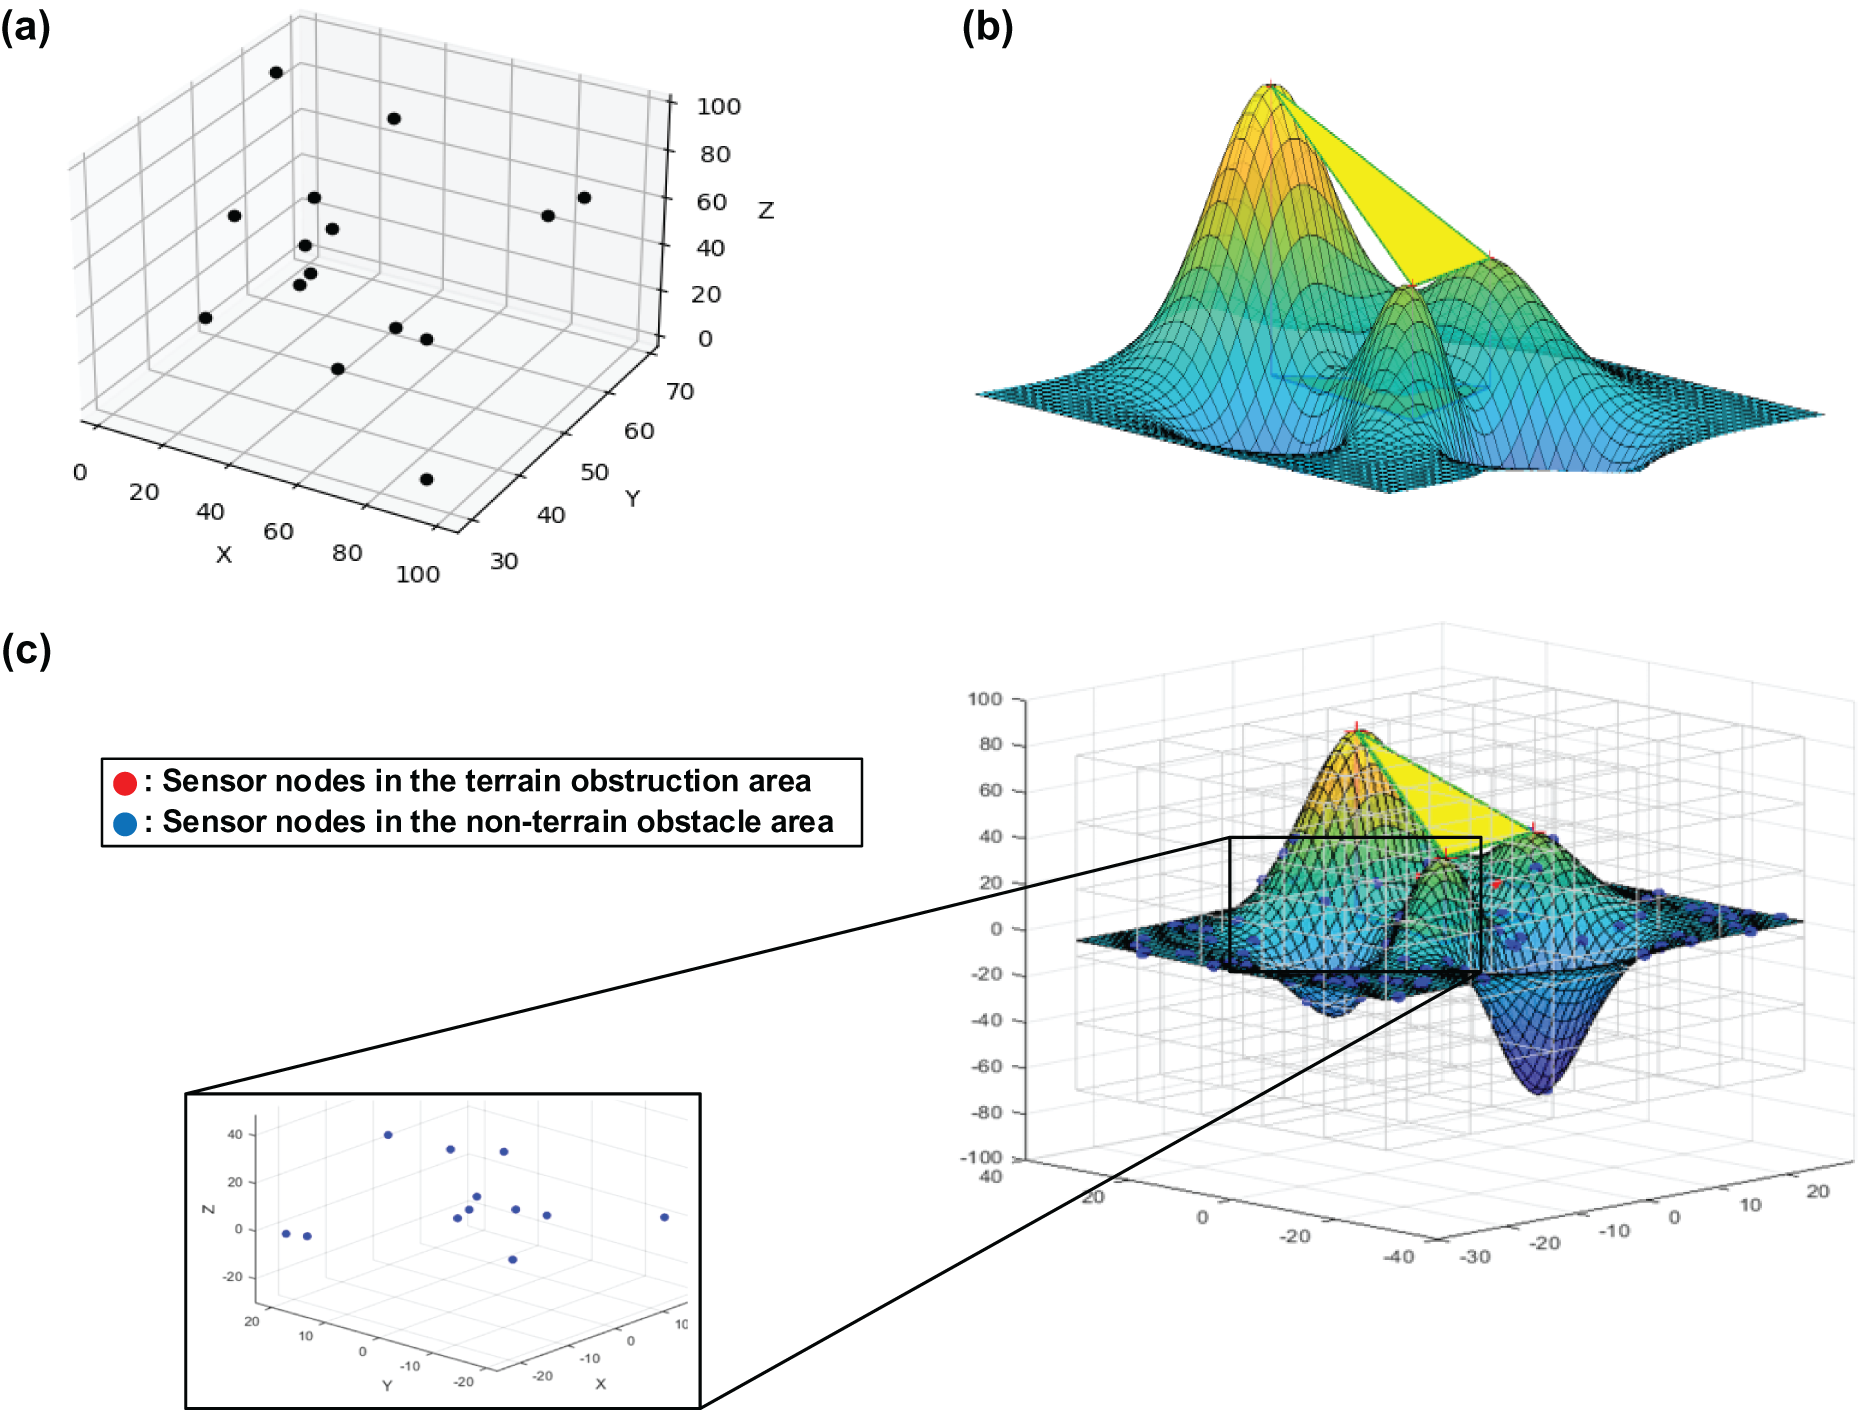
Figure 6: A random function randomizes the locations of the required number of sensors generated for the experiment (a). And based on the deployment of sensors in the real field environment, the terrain topography with peak blocking (b) and without peak blocking (c) are generated
A total of two datasets were generated, the number of nodes in each dataset, the blocking region and other information is shown in Table 4, and all subsequent experiments were conducted based on this table.

4.2 Feasibility Analysis Experiment
4.2.1 Sensor Clustering Experiment
Beginning to divide the data collection area into the area with terrain obstruction communication and the area without terrain obstruction communication, this experiment will take different measures for the above two areas.
For the area with terrain obstruction, this experiment uses MATLAB to simulate the mountain peak terrain of the field environment, and individually divides the mountain peak emergence area, in which the sensor nodes are individually self-organized network, through the above means of processing can prevent the occurrence of the communication of sensor nodes is blocked by the terrain, and then assigned to the same mesh within the self-organized network occurs. For the communication area without terrain obstruction, this experiment utilizes a homogeneous mesh to divide the data collection area, and the sensor nodes within each mesh are self-organized.
Both of these areas use the α-hop clustering algorithm, which will sort each sensor node according to the size of the weights, where the sensor with the smallest weight is selected as the CH, after which a Huffman tree is constructed and saved according to the size of the sensor weights. The CHs selected in this experiment will be used as traversal targets for subsequent UAV data collection.
On the constructed data, the experiment uses MATLAB to simulate the terrain of the field environment as shown in Fig. 7. The area where the communication is obstructed by the terrain is wrapped with a triangular prism, and the sensor nodes that fall into the terrain obstructed area are identified with red nodes, and the sensor nodes that do not fall into the terrain obstructed area are identified with blue nodes.
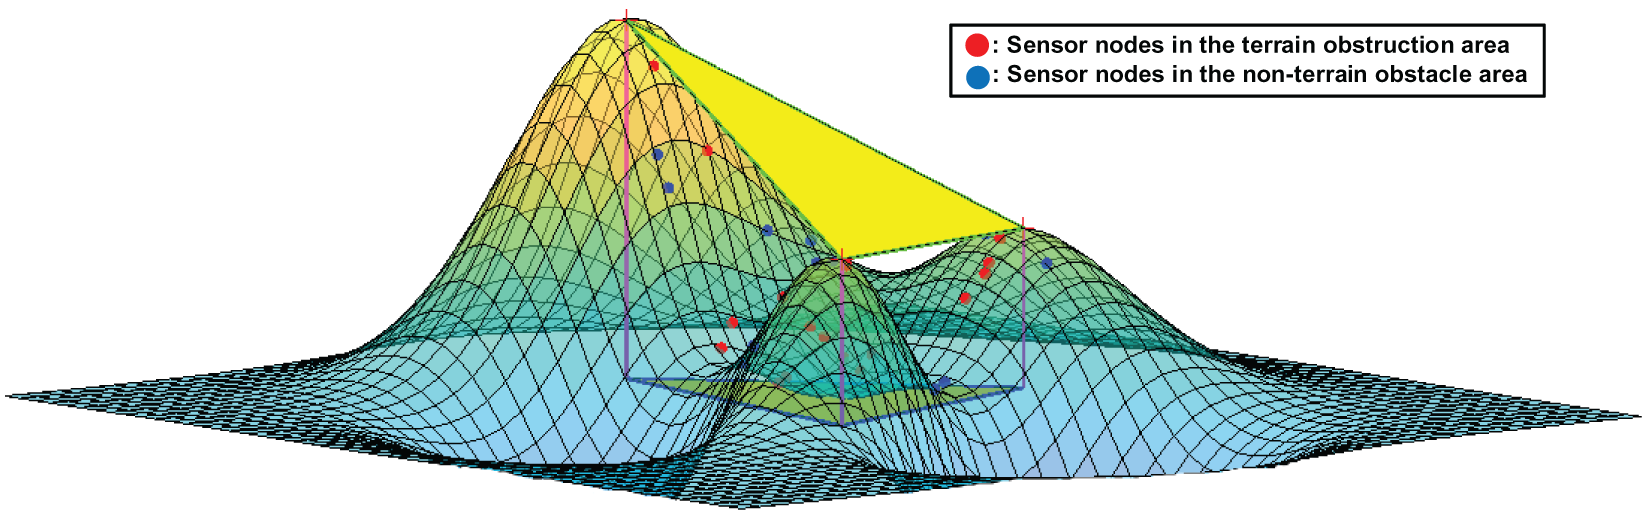
Figure 7: Generating a randomized sensor node map located in the terrain obstruction area
The simulated terrain-free obstruction communication area is shown in Fig. 8, with the black nodes being the sensor nodes within this data collection area. The sensor nodes are partitioned using a homogeneous mesh, and CHs are computed in each mesh using the α-hop clustering algorithm, where the red nodes indicate the CHs selected in that mesh area.
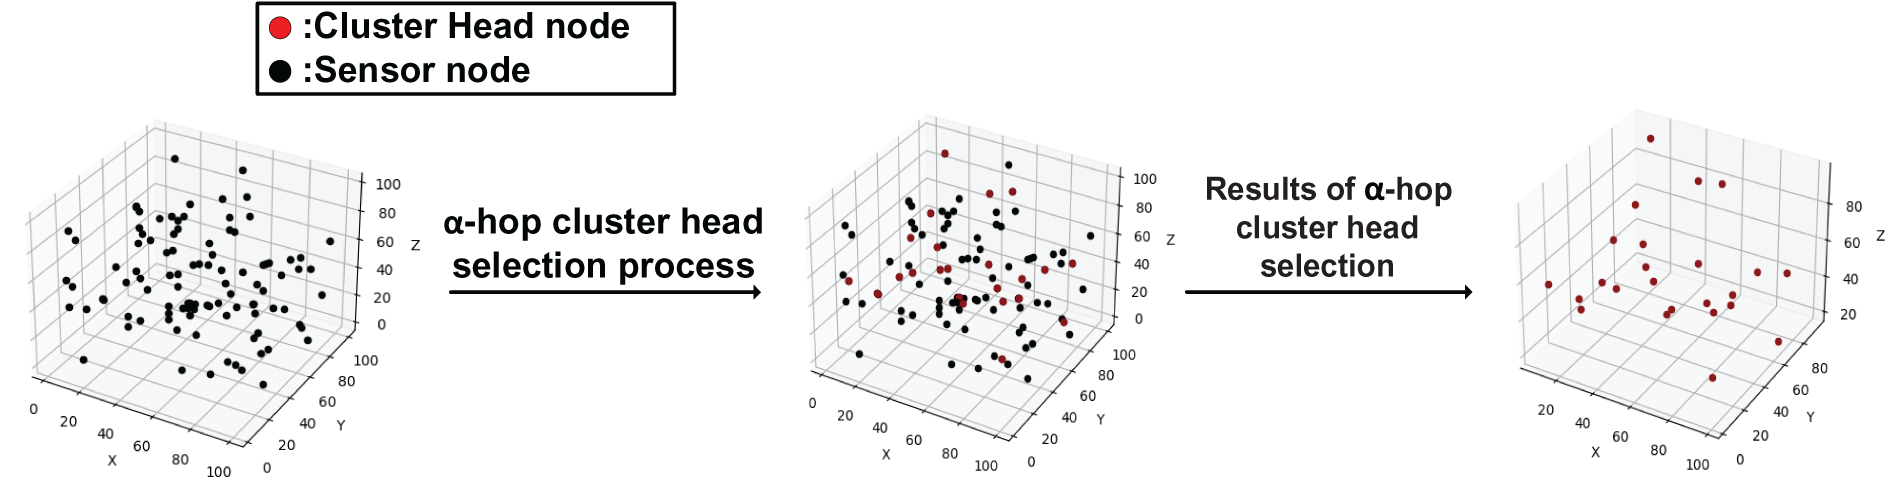
Figure 8: Schematic diagram of CH selection process for random sensor nodes without terrain obstruction area
For the nodes in the terrain obstruction area and the mesh division area, the sum of the distances from each node to the rest of the nodes is calculated as the weight ordering, and the redundant data is stored according to the weights, and the Huffman tree constructed and showing the process of data flow between the nodes is shown in Fig. 9.
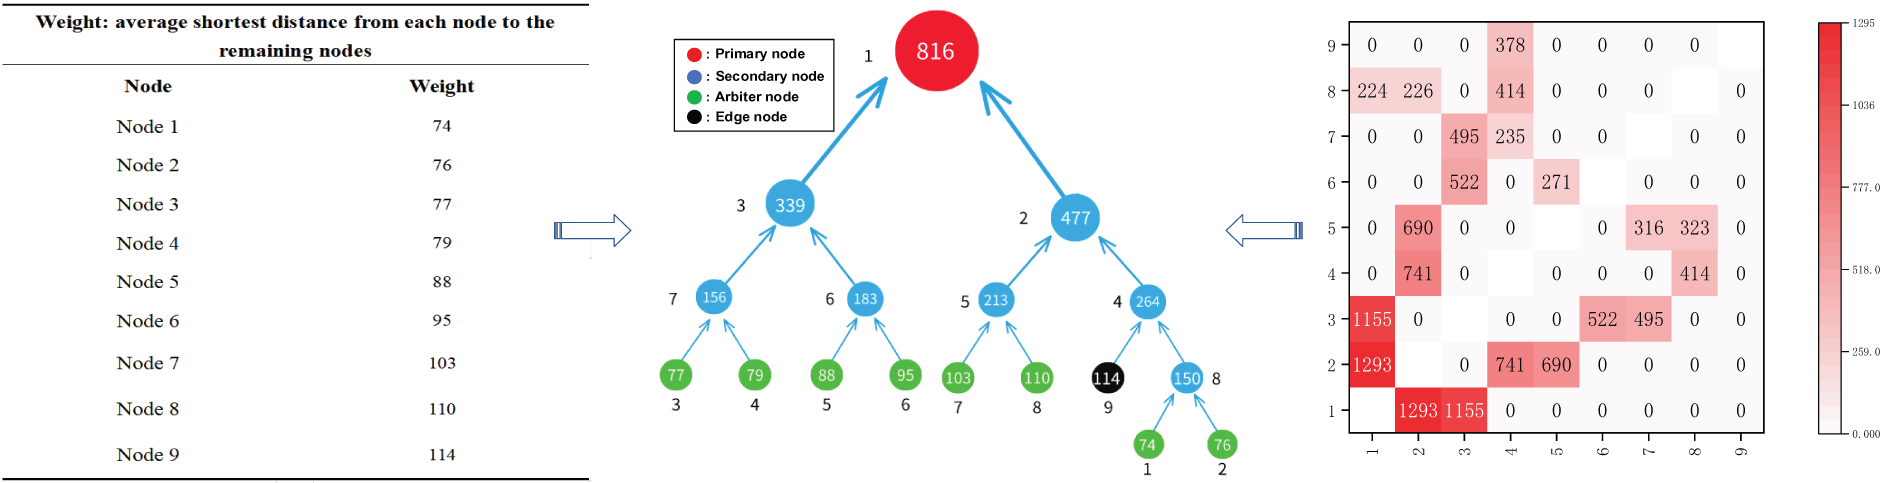
Figure 9: Tree diagram of data flow for each sensor node in a mesh area or terrain obstructed area
4.2.2 Multi-UAV Collaborative Task Area Allocation Experiment
On the simulation dataset 1, the feasibility of using the K-Dimensional classification method to divide the subtask areas is verified, and the overall division results are shown in Fig. 10. The sensor CHs are first divided into their respective task areas, and after the task areas are divided, the initial node of UAV flight is selected for each sub-task area as shown in Fig. 11.
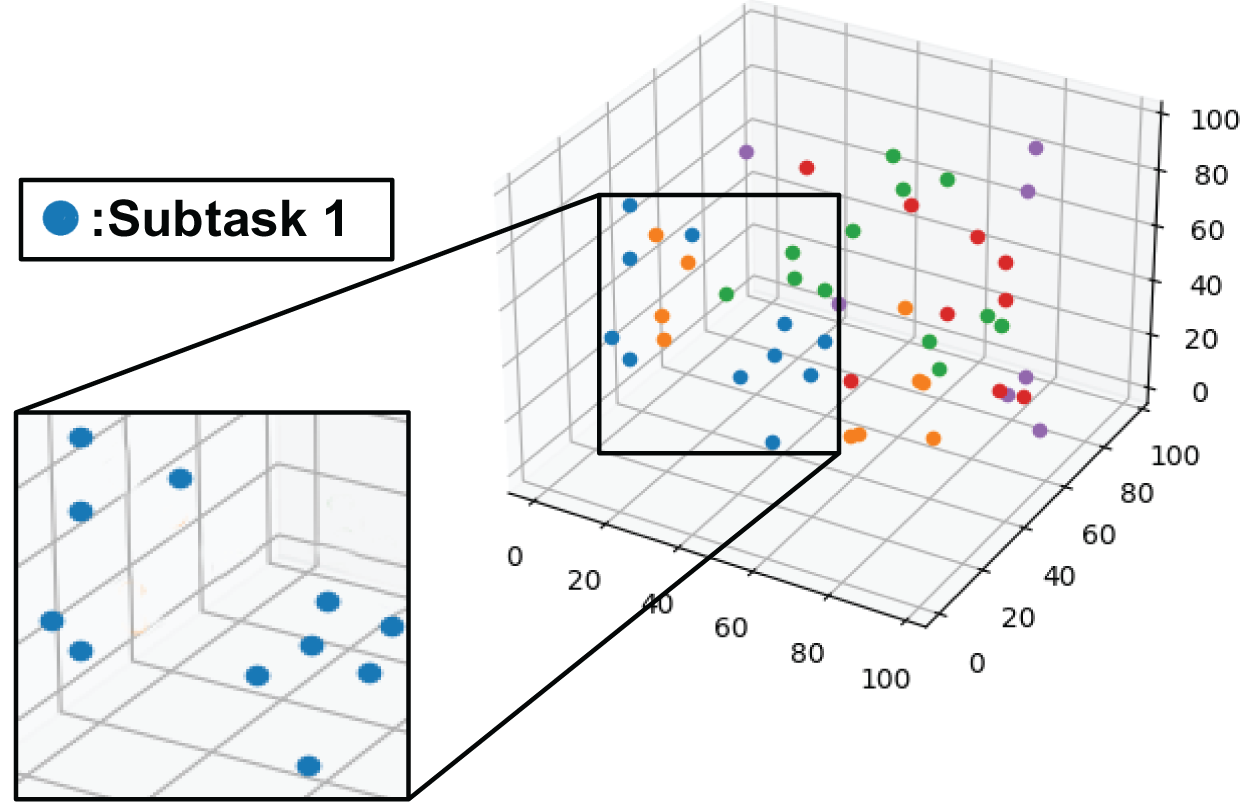
Figure 10: K-Dimensional grouping diagram of 50 sensor nodes
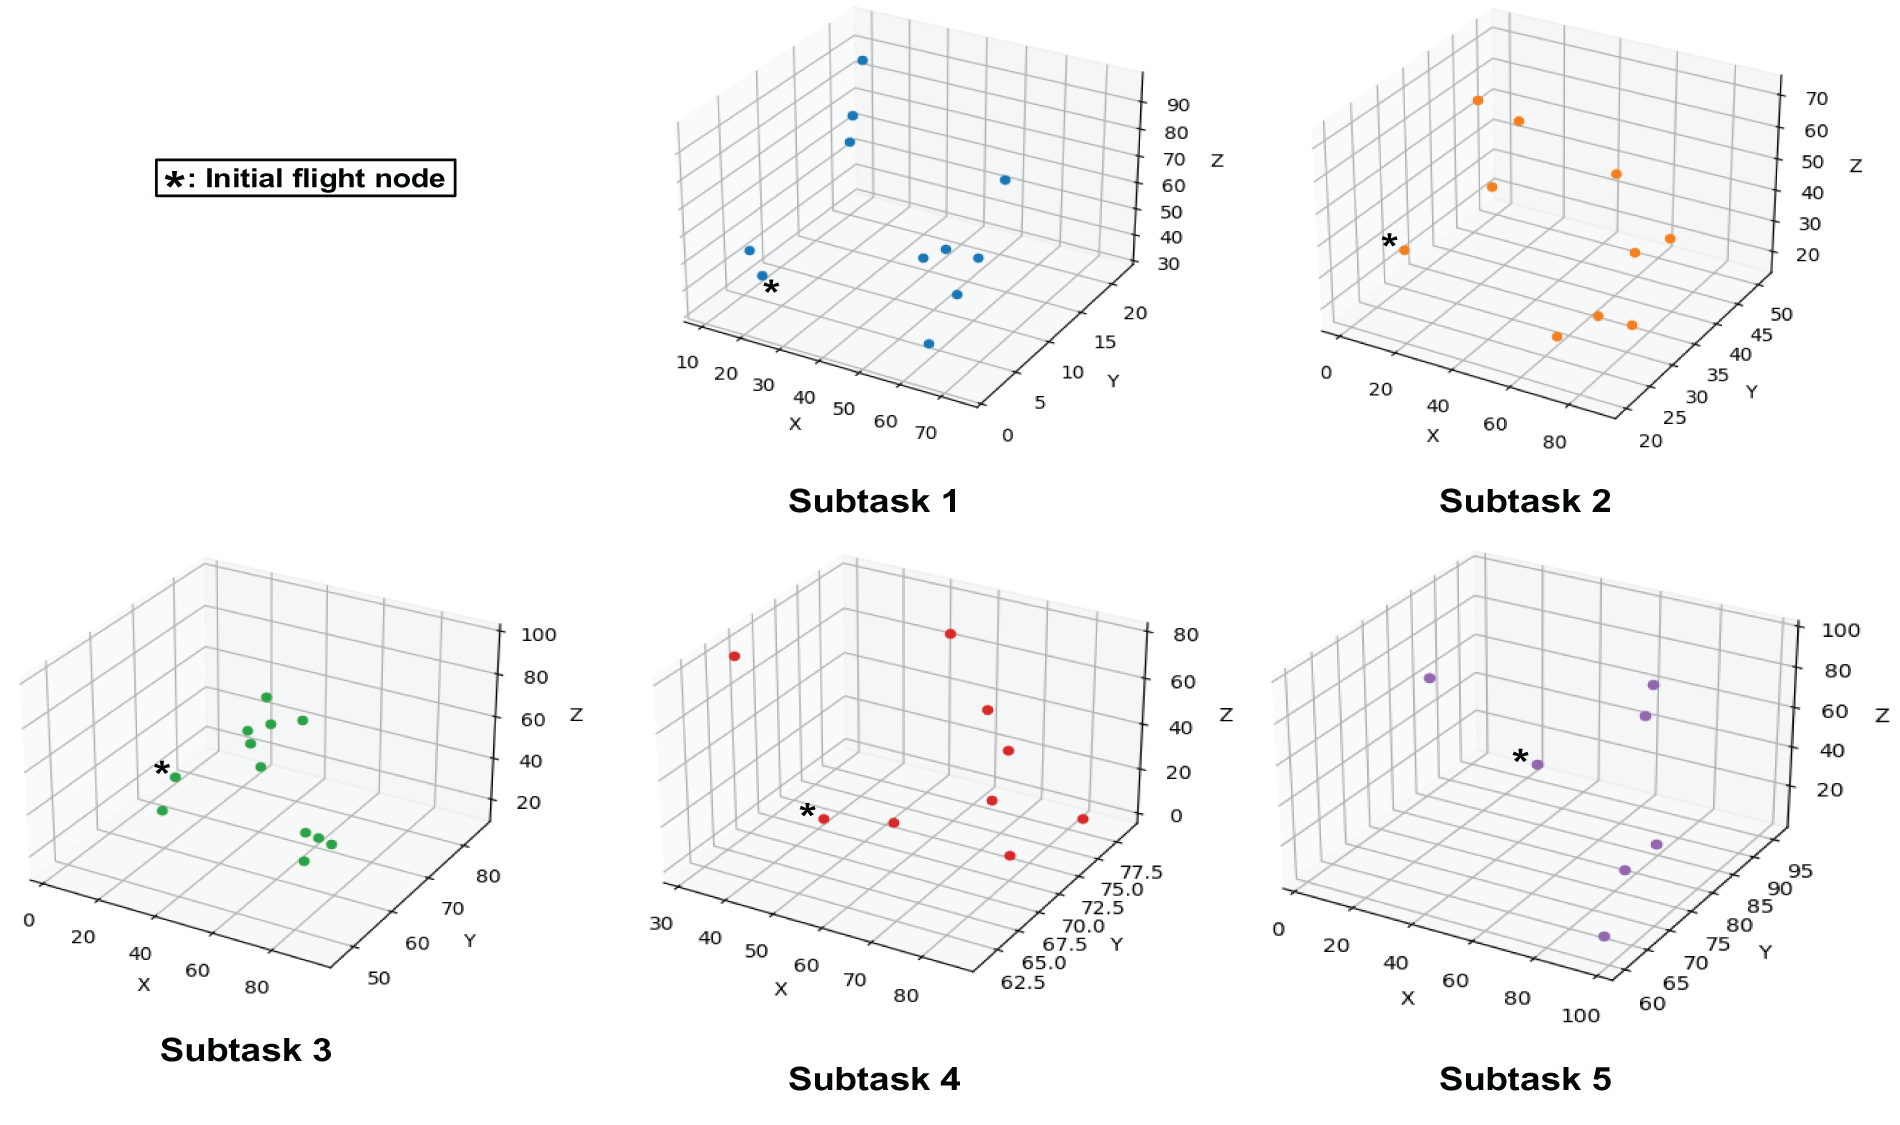
Figure 11: Map of the results of the division of the subtask area and the selection of its initial node of flight
4.2.3 Experiment on Single UAV Data Collection Operations in the Sub-Task Area
Sub-task area UAV operation pathnstruction experiment: On the basis of K-Dimensional division of task areas, the optimal path for single UAV data collection operation is constructed for each task area. The specific UAV data acquisition operation flow is schematically shown in Fig. 12. The UAV path planning algorithm in this experiment is Simple Full Permutation Algorithm, and the parameters of path planning are shown in Table 5. The UAV path planning results for each sub-task area are shown in Fig. 13.
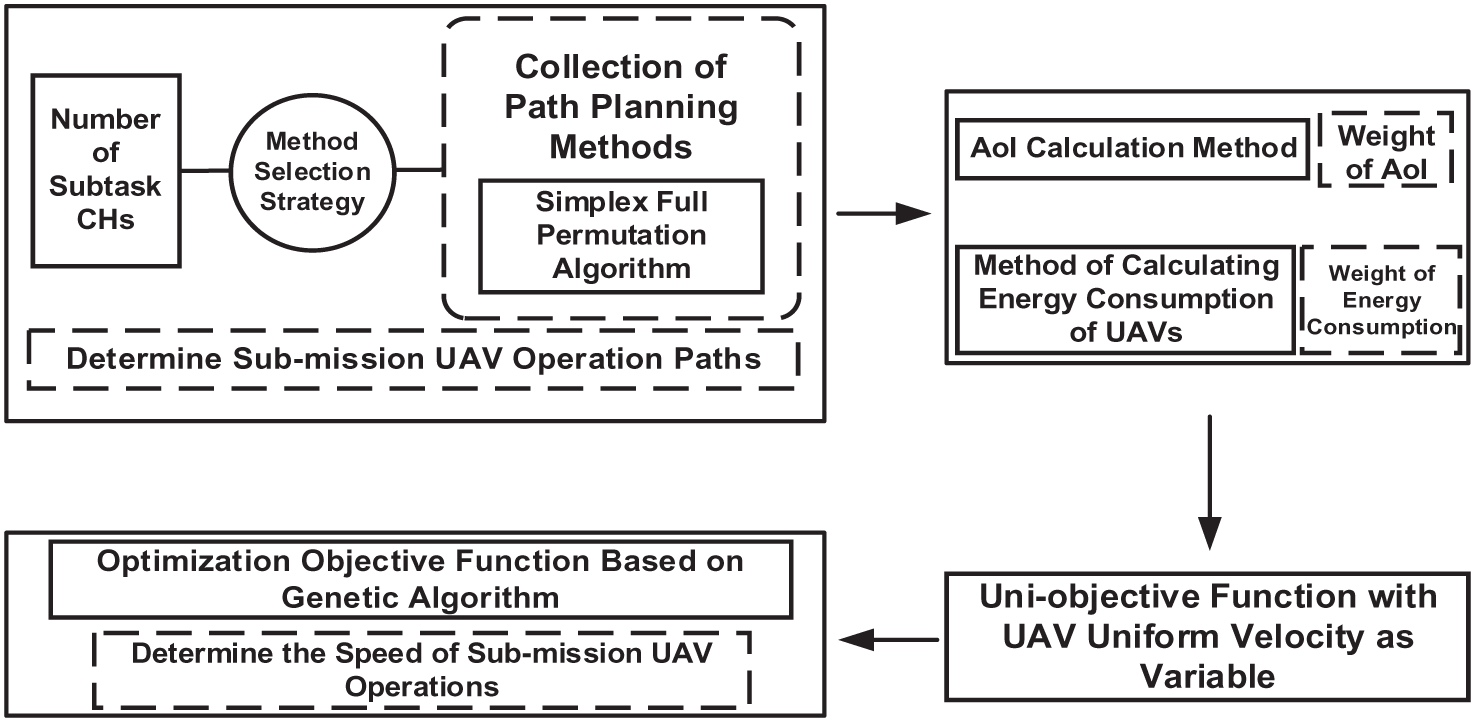
Figure 12: Schematic diagram of single UAV data collection operation flow

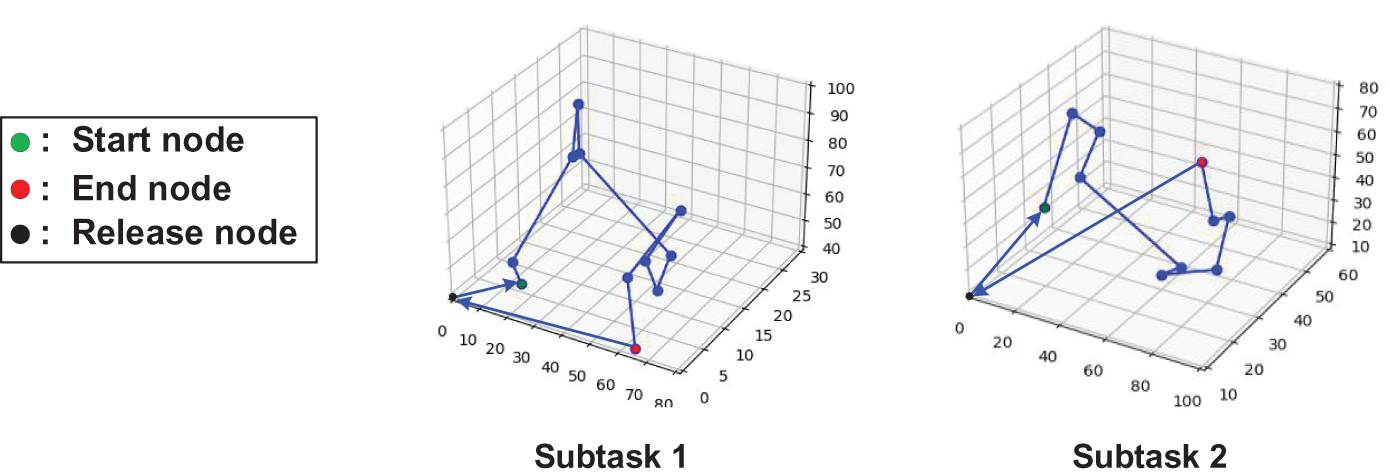
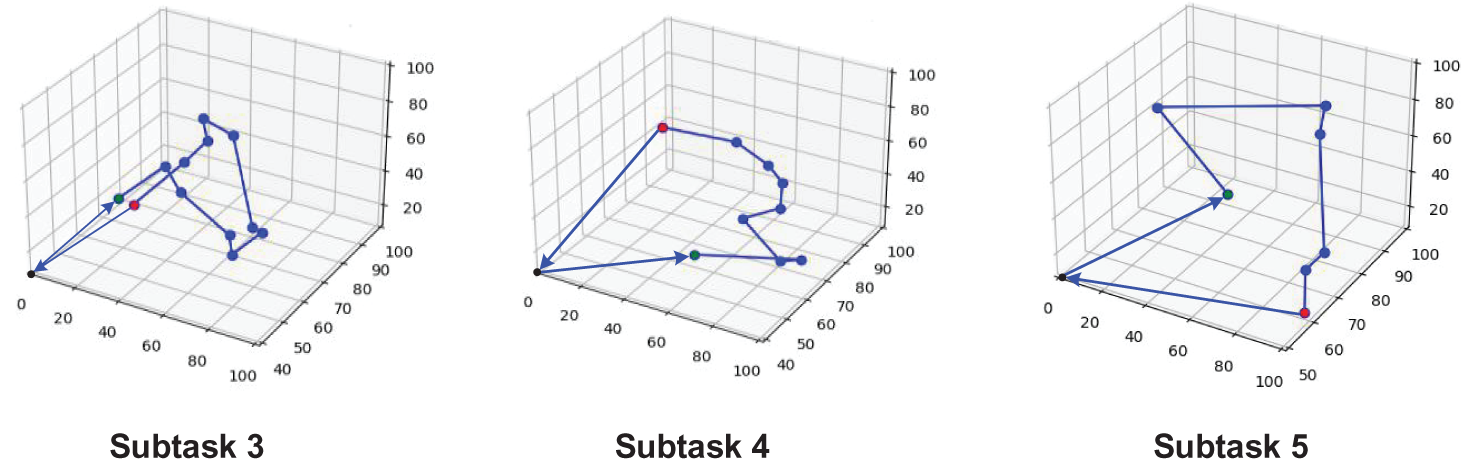
Figure 13: UAV path planning results for each sub-task area
AoI and UAV energy consumption weighting determination experiment: Based on the data collection operation assessment model constructed in Section 3.3.2, Eq. (14) is expanded to obtain the complete model equation shown in Eq. (16). And in Eq. (16), there are AoI weights and UAV energy consumption weights, respectively. In this experiment, using the randomized sensor coordinates in Fig. 6a and the node coordinates of two different scales, simulation dataset 1 and simulation dataset 2, as parameters, the weight ratios of the UAV propulsion energy consumption and data AoI are set to be 1:1, 1:10, 1:100, and 1:1000, respectively, and the combined results are shown in Fig. 14. Fig. 14 shows that when the weight ratio of the two is 1:1 and 1:10, the influence factor of data AoI in the overall evaluation model is too low, and when the weight ratio of the two is 1:1000, the influence factor of data AoI in the overall evaluation model is too high, which makes the data AoI dominant in the overall evaluation model. When the weight ratio of the two is 1:100, they have roughly the same influence in the overall evaluation model, so it is most reasonable to select and in the subsequent model as 1 and 100, respectively.
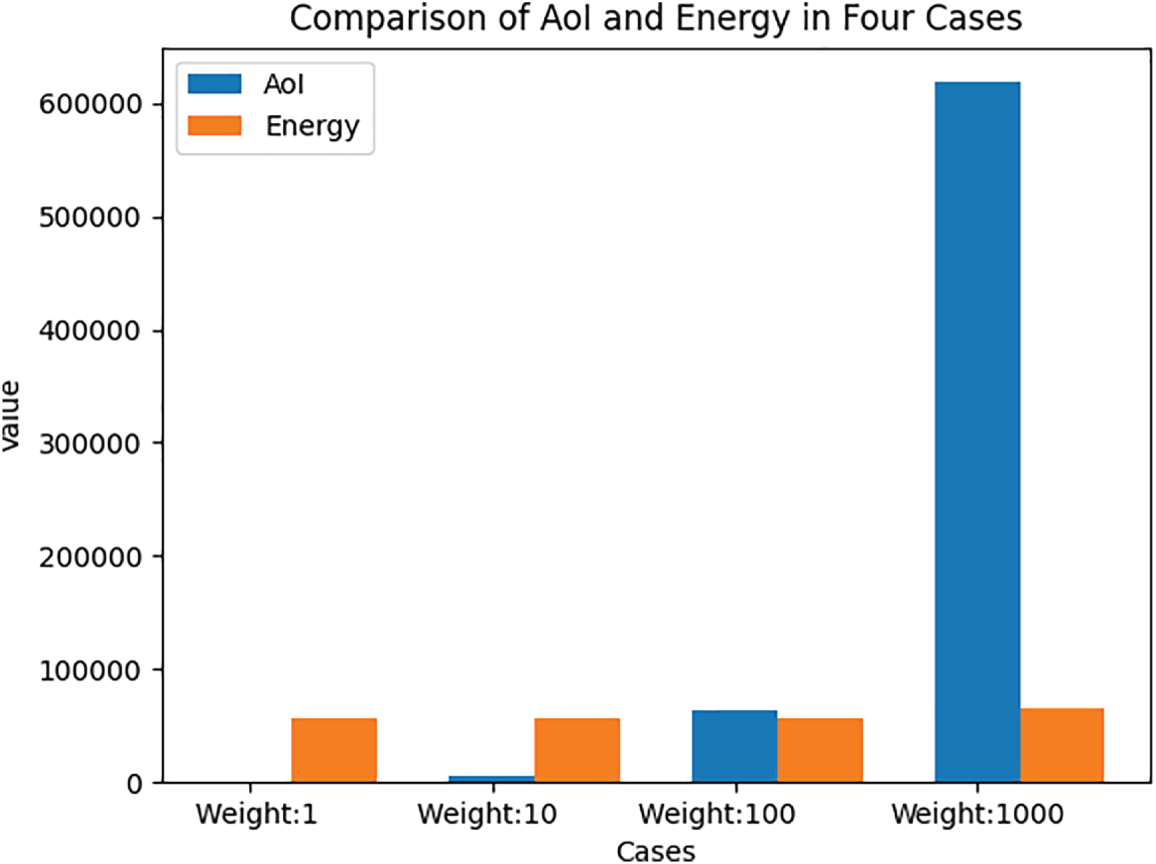
Figure 14: Comparison of weight ratios for the four magnitudes
Sub-task UAV operation speed determination experiment: The 10 sensor coordinate positions randomized in Fig. 6a are used as parameters input into the data AoI equation model and the UAV propulsion energy calculation equation model to construct the mathematical functional relationship between the data AoI and the UAV propulsion energy consumption and speed, as shown in Fig. 15. Fig. 15 shows that for a given velocity interval, the larger the velocity value, the better the freshness of the data AoI. For UAV propulsion energy consumption, an increase in velocity value causes a rapid decrease in UAV propulsion energy consumption in the velocity starting region, but UAV propulsion energy consumption reaches its lowest point and then starts to increase with an increase in velocity value. The figure show that the data AoI and the UAV propulsion energy consumption do not lead to an optimal solution at the same time.
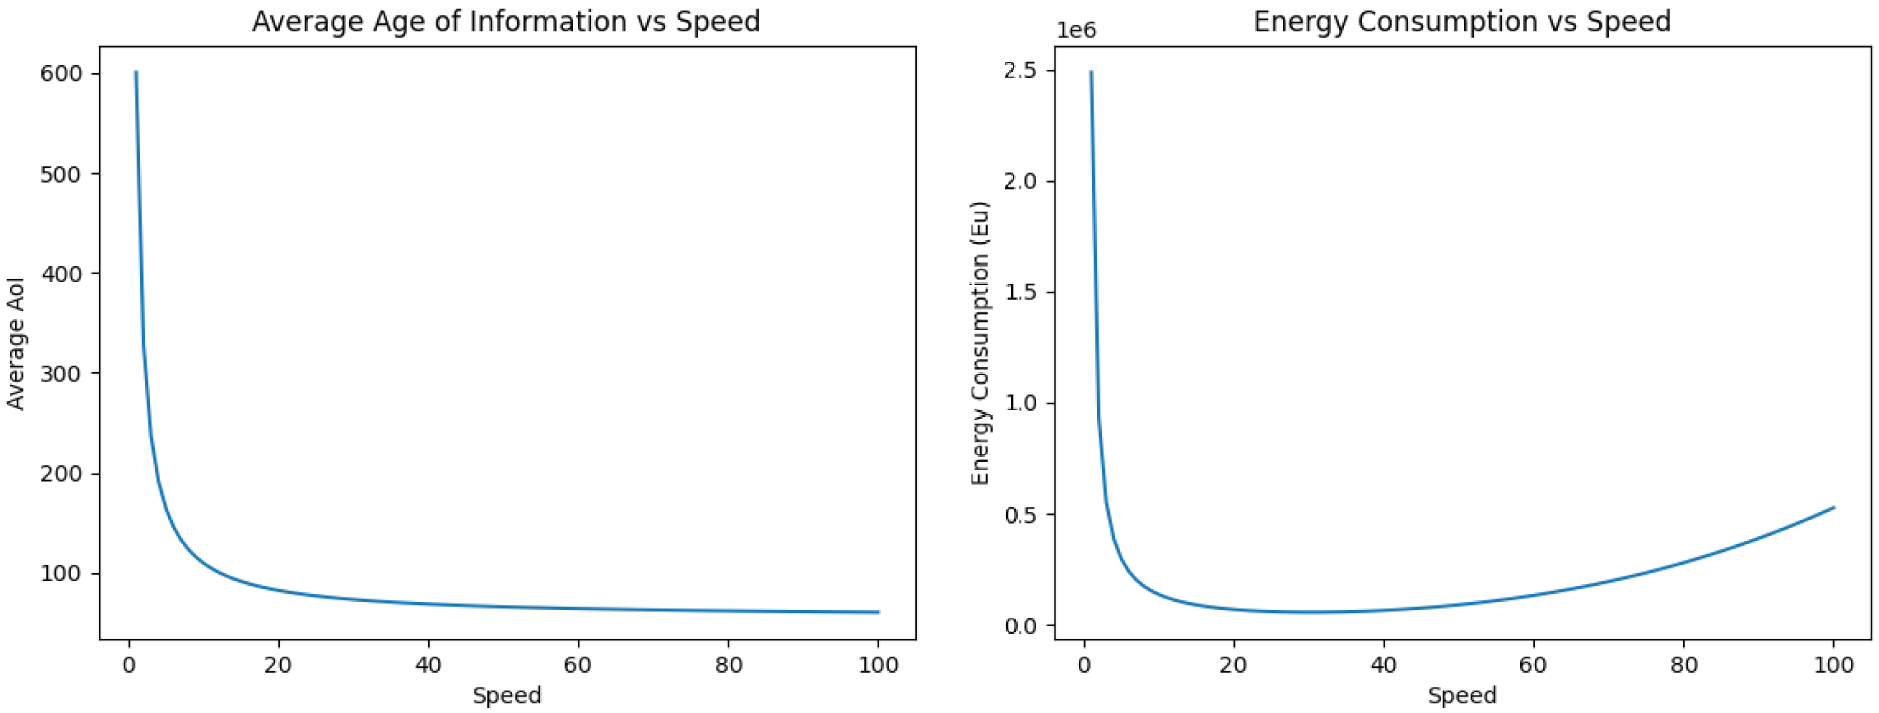
Figure 15: Plot of data AoI and UAV propulsion energy consumption as a function of speed
The results of the above optimal path planning are input into the data collection operation assessment model as parameters, and the genetic algorithm is used to calculate the UAV flight speed when the optimal evaluation value is reached, which is compared with the unprocessed UAV data collection methods (Baseline Model 1, Baseline Model 2), the values of the detailed comparison results are shown in Table 6 and the magnitude visualization is shown in Fig. 16. It can be concluded from the graphs that the performance of the proposed combinatorial optimization scheme in this paper is improved by 95.56% and 58.21%, respectively, compared to the conventional baseline model.
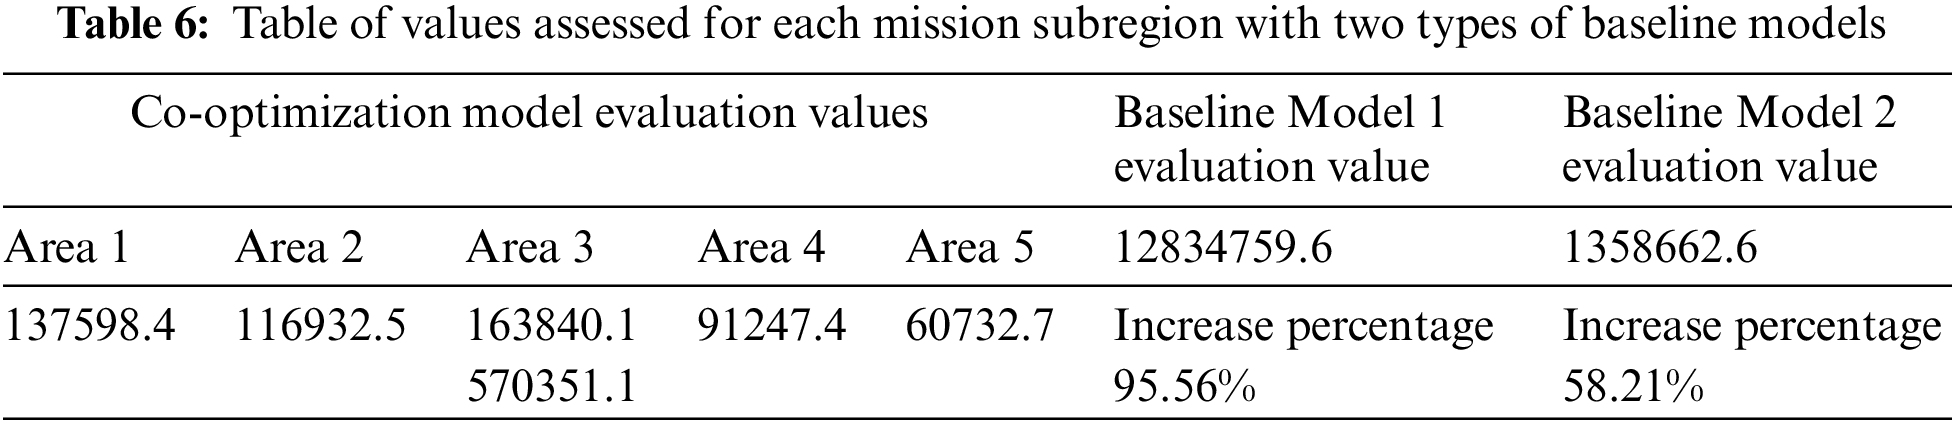
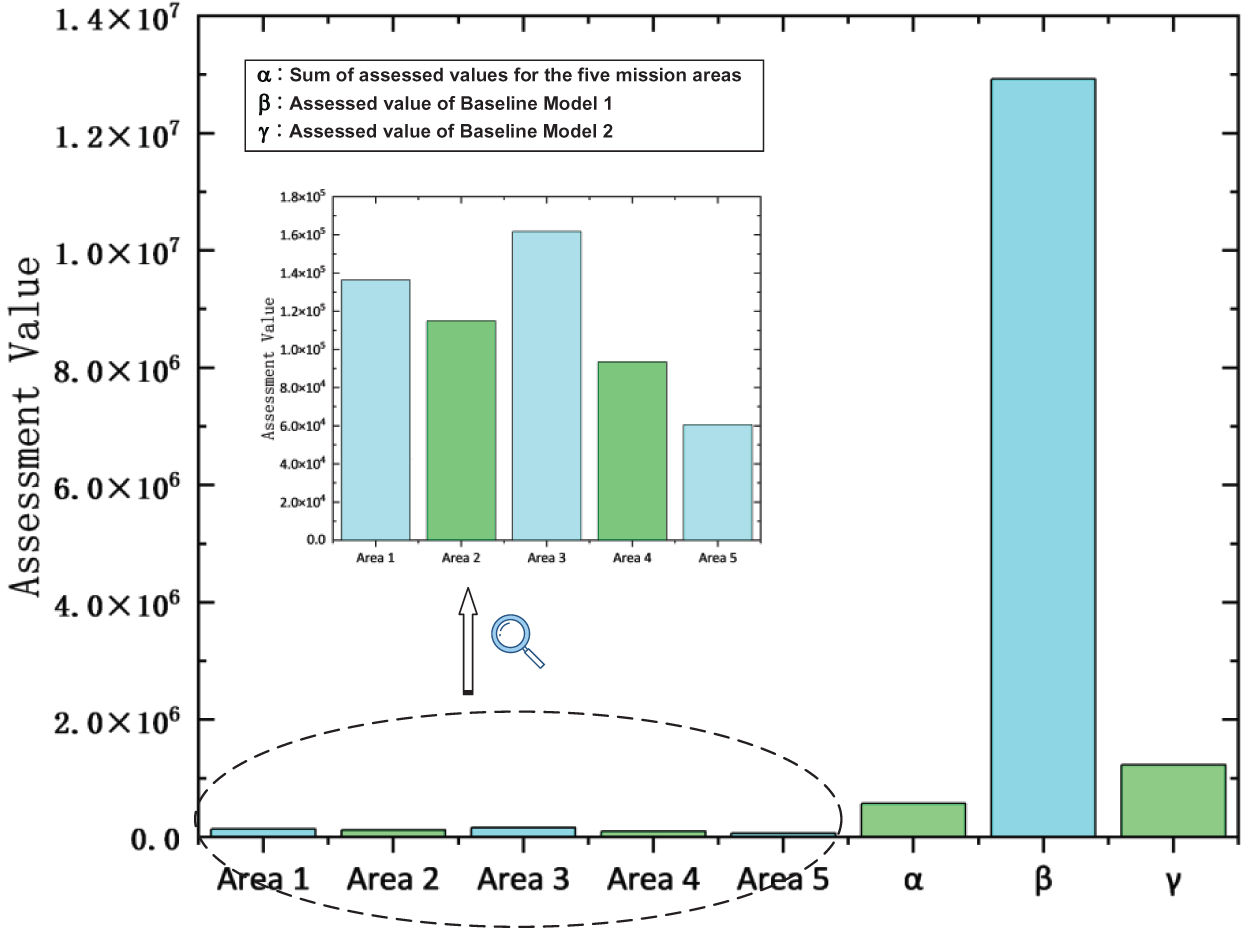
Figure 16: Plot of data AoI and UAV propulsion energy consumption as a function of speed
4.3 UAV Flight Test Experiment in Actual Field Complex Environment
In order to verify the universality and applicability of the method proposed in this paper in real scenarios, this experiment is conducted by performing UAV flight missions in real scenarios, whose real flight scenes are shown in Fig. 4, and in order to facilitate the observation of the terrain with the portrayal of the accurate flight result values, this experiment utilizes the digital elevation model data to display the terrain features as shown in Fig. 5, in which the experiment quantifies both the AoI and the flight energy consumption of the data collected by the UAV, and compared with the results of the simulation method proposed in this paper.
Through the real test flight and simulation on nine terrains, the numerical results are obtained, in order to facilitate the observation of the results, this paper will normalize the numerical results, retaining three decimals, and the detailed values are shown in Table 7. It can be observed through Table 7 that the relative error between the simulation value and the real value derived from the calculation formula and method given in this paper can be roughly maintained in the error interval of ± 10%, and the flights in the real scenarios can prove the accuracy and good suitability of the proposed scheme in the real test experiment. Through the flight test experiments in real scenarios, the accuracy and good applicability of the proposed scheme can be proved.

This experiment compares and verifies the excellence of the combination optimization method proposed in this paper and the mainstream sensor self-organizing network technology by deploying sensor nodes of different sizes. As well as using simulation dataset 2, the optimal paths of sub-task regions are constructed by using the Simple Full Permutation Algorithm, and the clustering process and sub-task assignment process in the method are eliminated respectively to verify the roles played by each module of combinatorial optimization in the optimization performance.
4.4.1 Comparison of Data Acquisition Performance with Mainstream Sensor Self-Organizing Network Technologies
In order to verify the superiority of the proposed method in this paper compared with other existing techniques in terms of efficiency and accuracy of data collection, artificial immunity and community-based self-organizing algorithms for sensor networks, which have been performing well in real-world application scenarios in recent years, are selected for comparison in this experiment to demonstrate the superiority of the proposed method in this paper [52]. In order to comprehensively evaluate the efficiency and accuracy of each algorithm, this experiment specifies the time and space complexity of the algorithm as the evaluation index of the algorithm’s efficiency, and the total amount of data that can be acquired by the sensors traversed by the UAV as the evaluation index of the algorithm’s accuracy. The amount of data built into each sensor is randomized with a random function within 0.5–1.0 to ensure the fairness of the experiment [53].
The detailed comparison values are shown in Table 8, where the number of new convergence iterations of the heuristic algorithm over the method proposed in this paper is used as one of the evaluation metrics. Table 8 shows that the method proposed in this paper has a huge advantage in space and time complexity over artificial immunity and community-based self-organization algorithms for sensor networks when facing equal sensor size scenarios, with a relative improvement of 10.46% and 12.71% for the accuracy of data extraction.

4.4.2 Eliminating the Clustering Process Ablation Comparison
The sensor clustering process is removed from the method and multi-UAV are used directly to perform task segmentation and flight operations for all sensors, which in turn analyzes the changes in AoI and UAV flight energy consumption.
It can be seen through Fig. 17 that the number of sensor nodes in each sub-task area that has not undergone the clustering process has increased, and the results of path planning for each assigned task area are shown in Fig. 18. It can be concluded from Table 9 that there is a large gap between the performance indicators before and after clustering, and the addition of the clustering module makes the energy consumption of the UAV and the data AoI increase by 71.57% and 71.14%, respectively, compared with the original. As can be seen through Fig. 19, after removing the clustering process, the AoI and UAV flight energy consumption of the data in each sub-task area increased dramatically, with a difference of 3.46 times in the data AoI metrics before and after the clustering process, and a difference of 3.52 times in the UAV flight energy consumption metrics. By eliminating the clustering process, it proves the effectiveness and scientificity of the clustering method in improving the efficiency of UAV data collection.
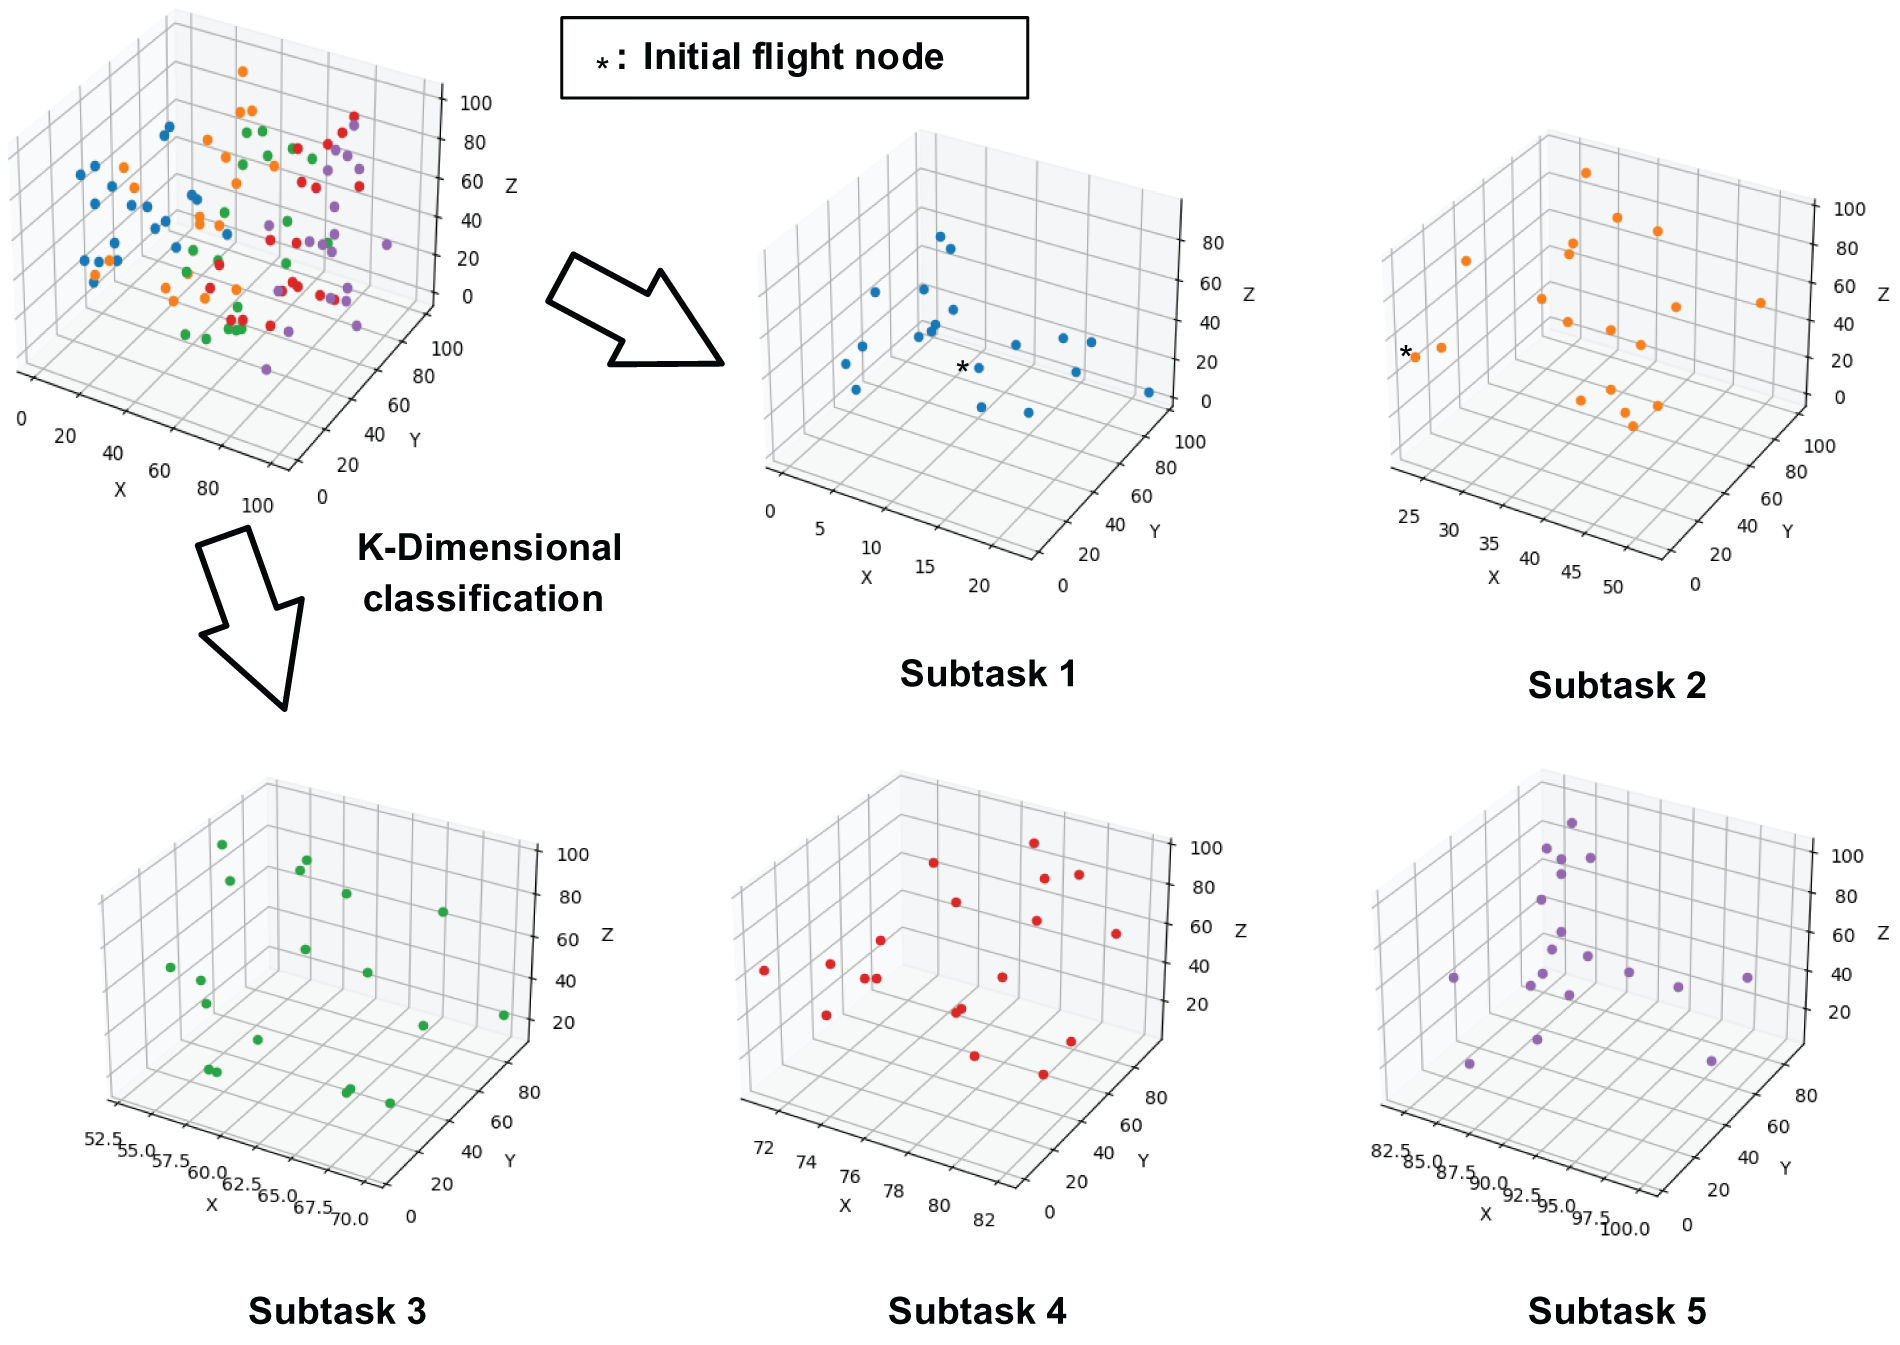
Figure 17: Map of the results of sub-task area division for non-clustering
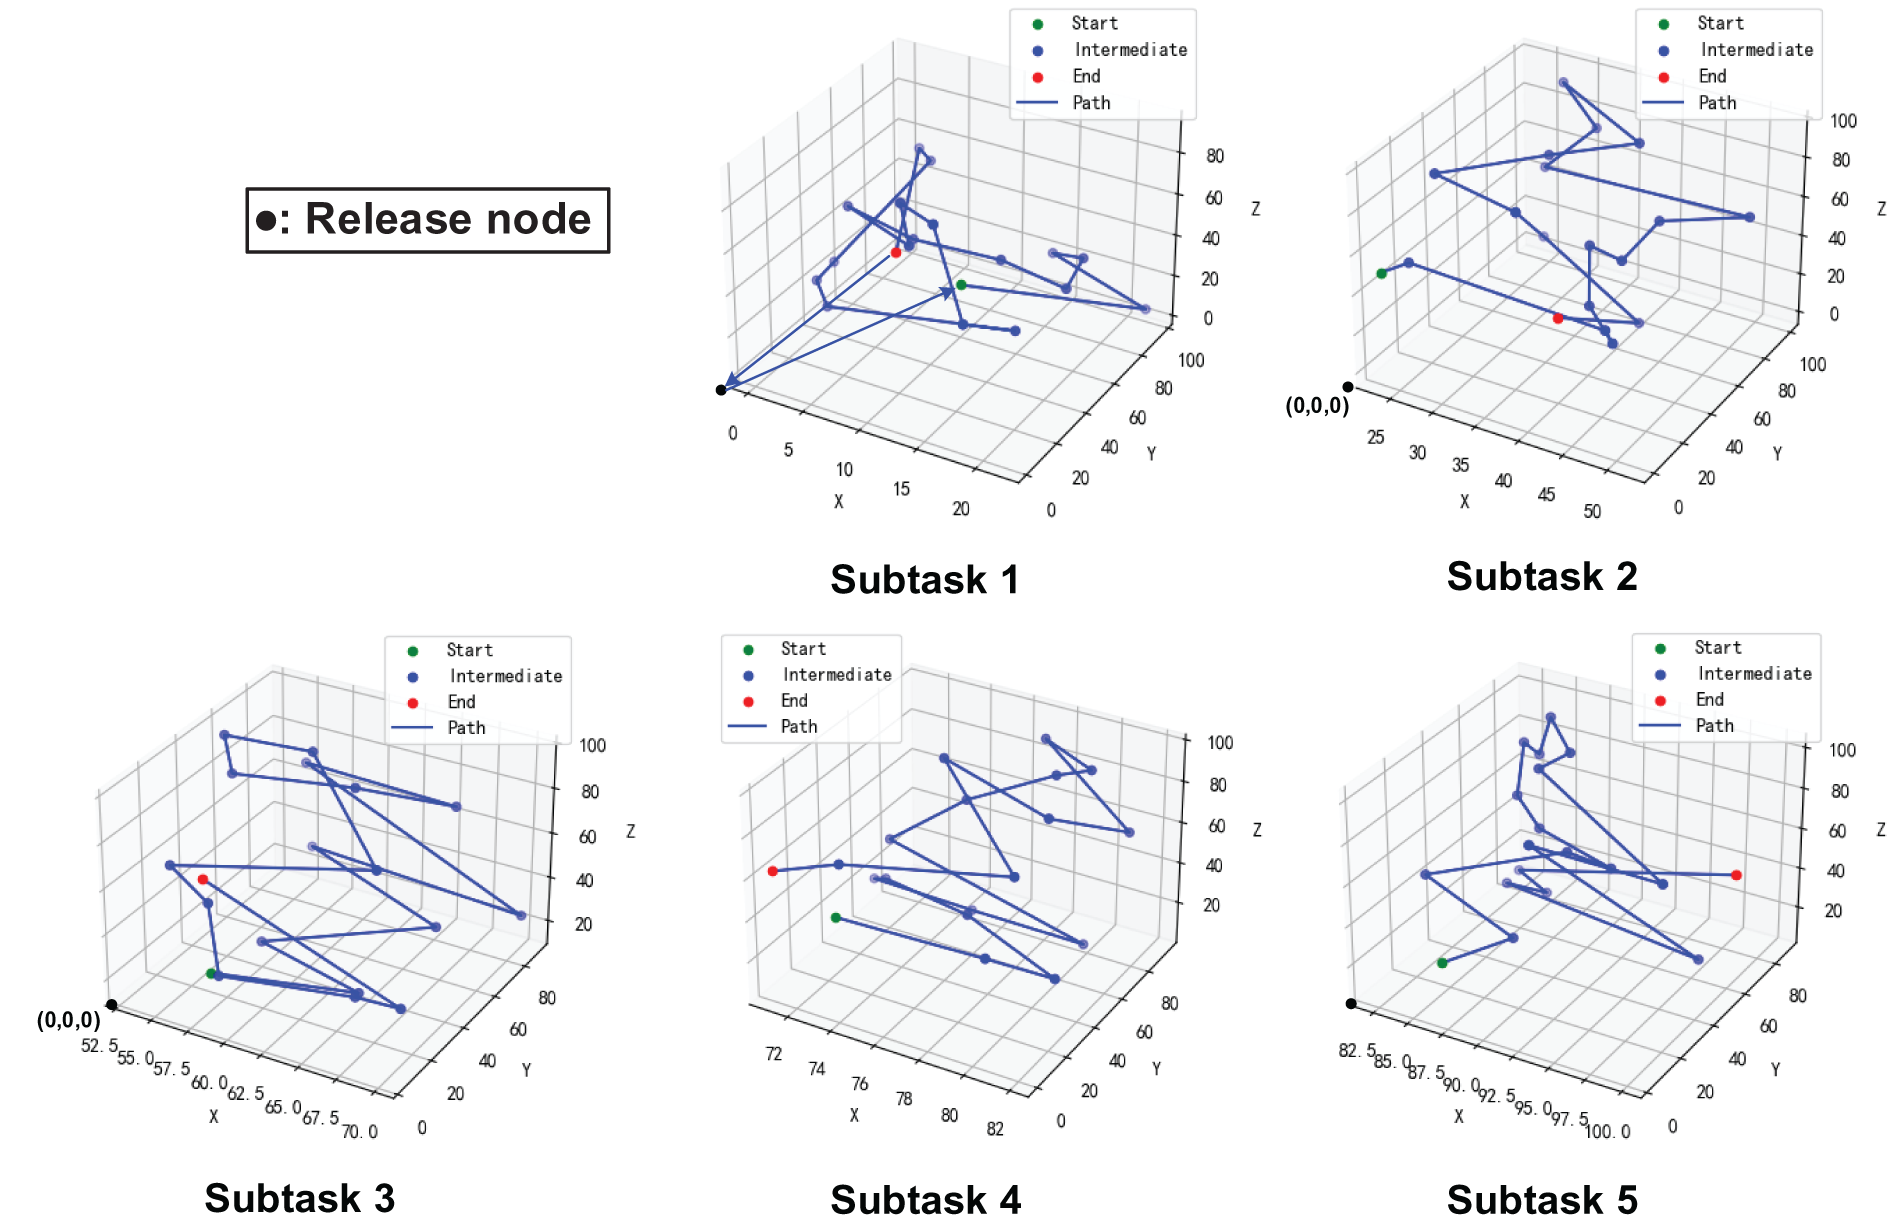
Figure 18: Non-clustered UAV path planning results for each sub-task area
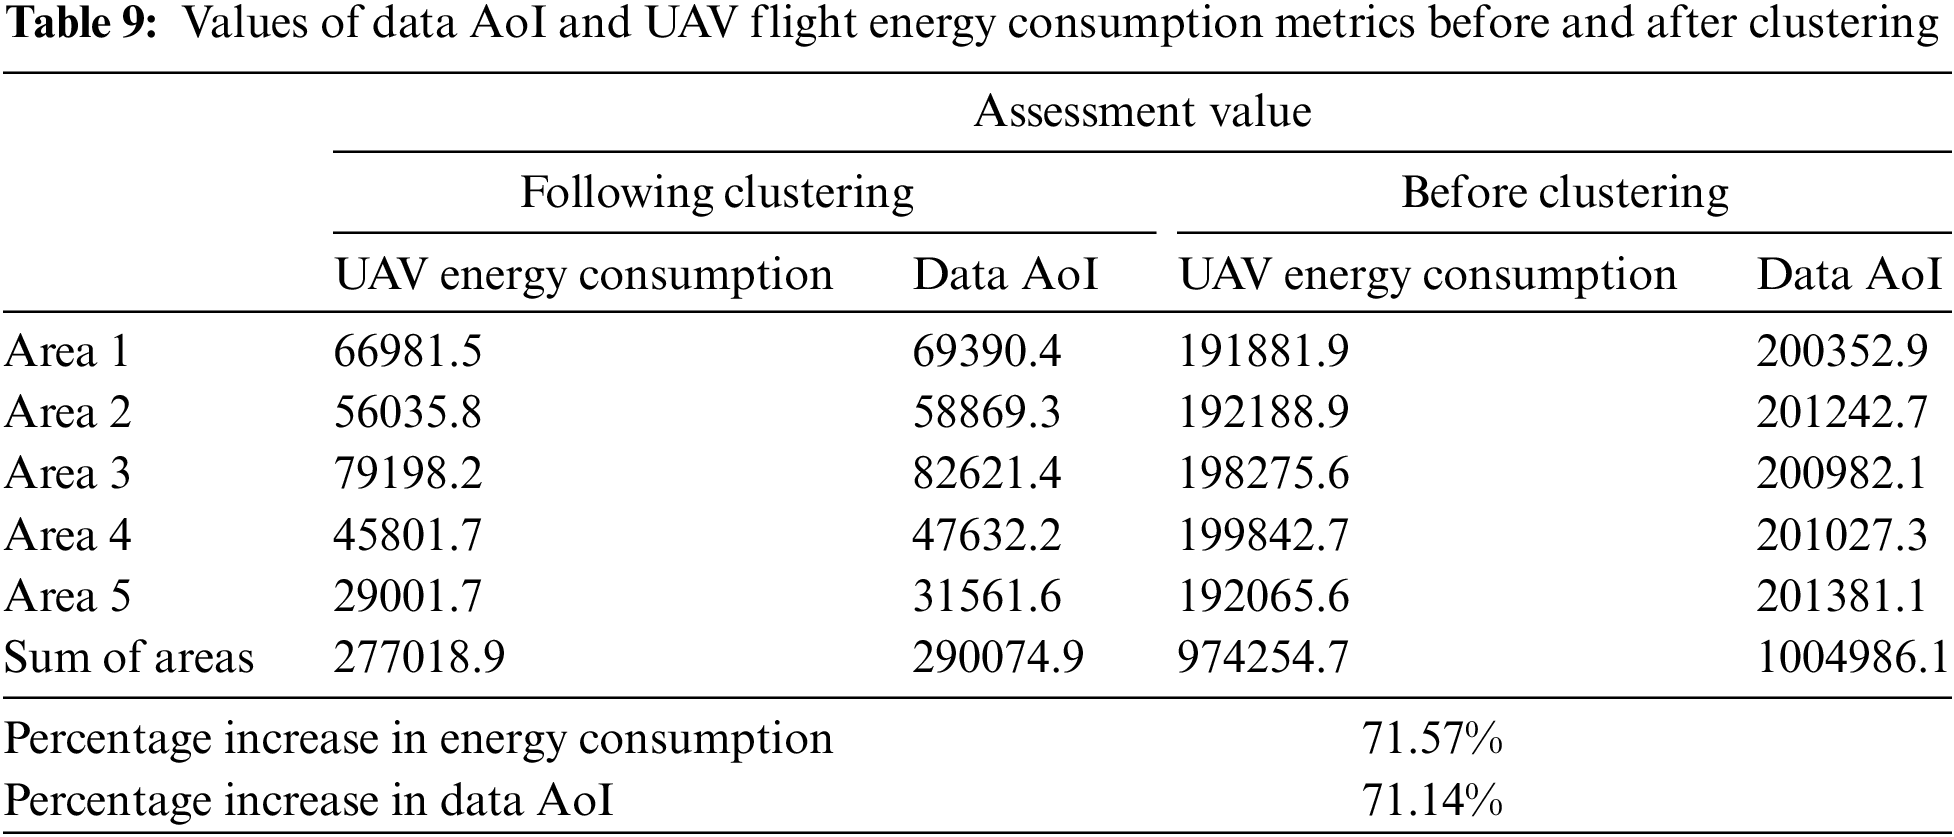
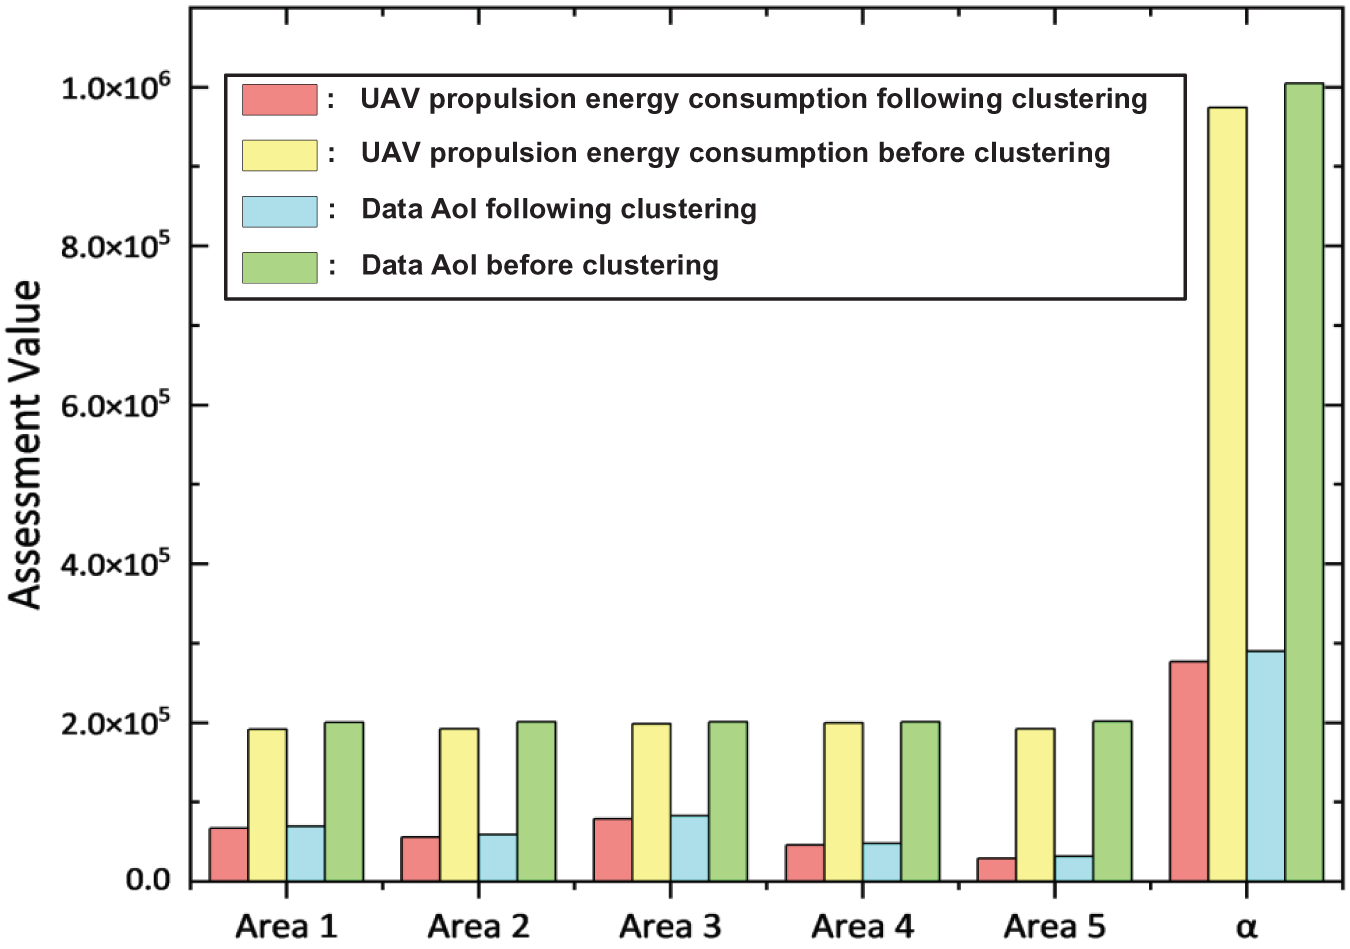
Figure 19: Comparison of data AoI and UAV propulsion energy consumption metrics before and after clustering
4.4.3 Eliminating Sub-Task Assignment Process Ablation Comparisons
The sub-task assignment process is removed from the methodology and a single UAV is used directly to plan flight operations based on sensor clustering, which in turn analyzes the changes in AoI and UAV flight energy consumption.
After the sensor nodes are divided through the mesh, CHs are selected within each mesh using the α-hop clustering algorithm, and the selection process is shown in Fig. 20. The result of direct path planning without subtask assignment for the selected CH nodes is shown in Fig. 21a. As can be seen in Fig. 21b, the AoI of the data in the total mission area and the energy consumption of the UAV flight both increase dramatically after removing the sub-tasking process, with a difference of 4.45 times in the data AoI metrics before and after the sub-tasking process, and a difference of 4.47 times in the energy consumption metrics of the UAV flight. The feasibility and effectiveness of the subtask assignment process in improving the efficiency of UAV data collection can be demonstrated by eliminating the subtask assignment process.
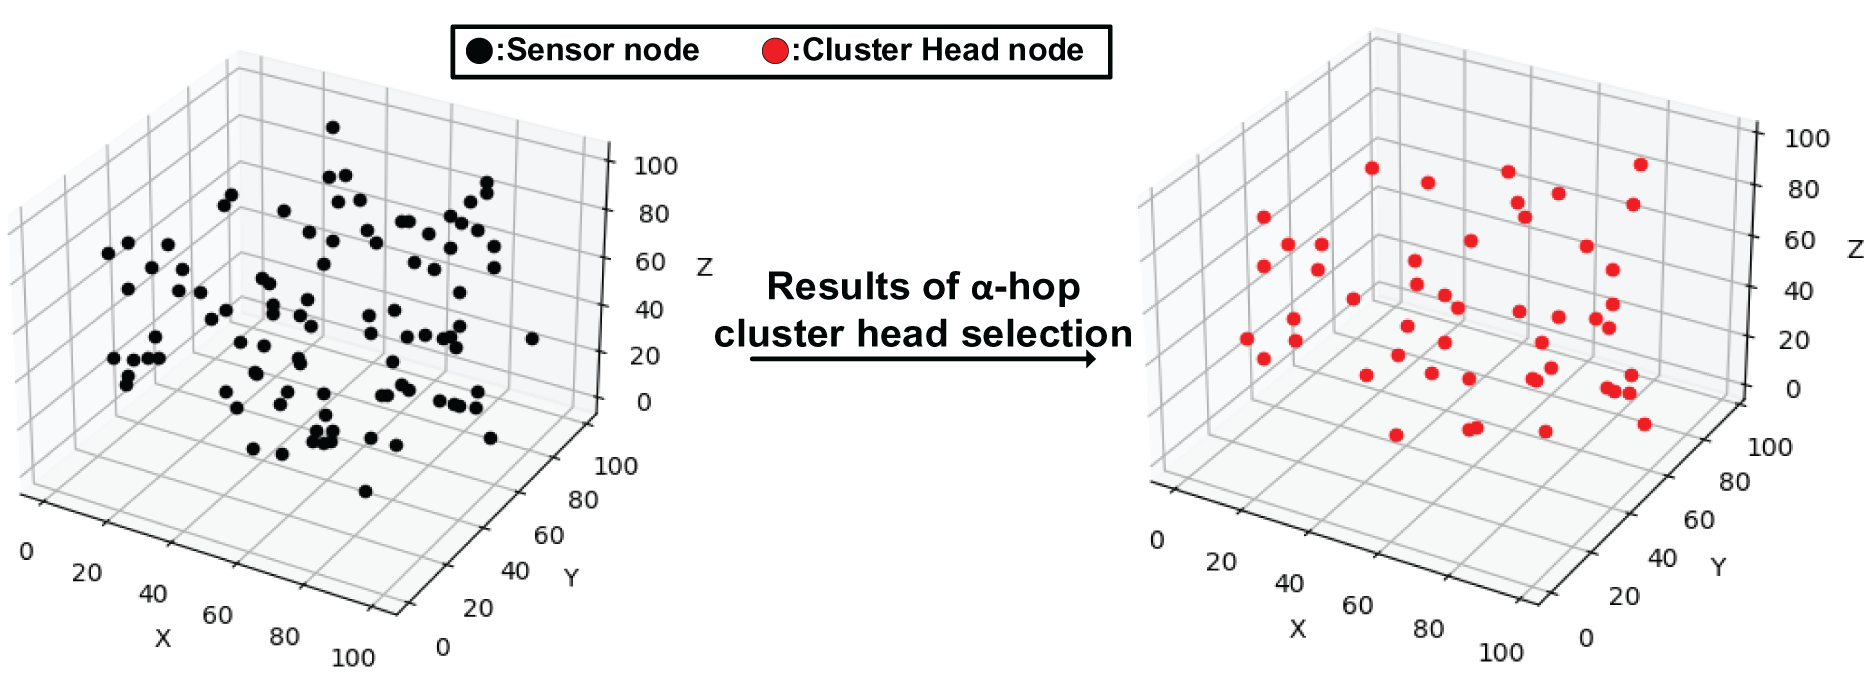
Figure 20: Schematic of the CH selection process after clustering of sensor nodes
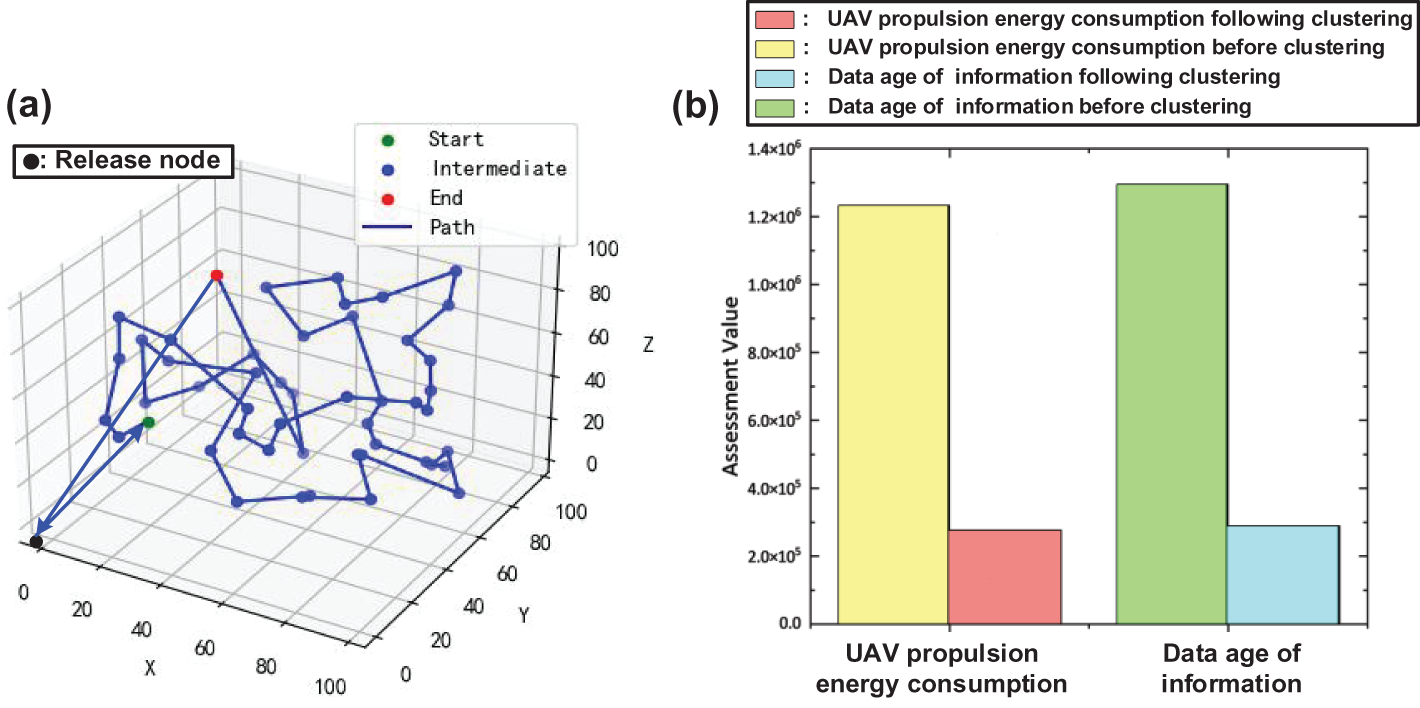
Figure 21: UAV path planning results in the mission area after clustering and comparison of AoI (a). UAV flight energy consumption metrics before and after sub-task assignment (b)
In this paper, using the idea of combinatorial optimization, through α-hop sensor clustering, K-Dimensional division of the task area, using genetic algorithms to trade-off the relationship between speed and the AoI of the collected information and energy consumption. We propose a multi-UAV task planning method oriented to the collection of data from self-organized sensors, and form a multi-UAV collection of data operation scheme. In the context of data collection in field settings, the proposed method demonstrates a distinct advantage when compared to existing technical approaches, such as artificial immunity and community-based sensor self-organizing networks. This is particularly evident in terms of the method’s time and space complexity, as well as its accuracy and completeness in data collection. In the α-hop sensor clustering module, the shortest distance CH selection method of the neighboring sensors is capable of reducing the size of the sensors while ensuring that the quantity and quality of the sensor data remain uncompromised. The K-Dimensional division of the task area is employed to facilitate the optimal work sub-schemes for each UAV, enabling the concurrent completion of data collection tasks and enhancing overall efficiency. The optimal combination of evaluation metrics for AoI and energy consumption is assigned using genetic algorithms. This ensures that data quality and data collection energy consumption can be taken into account.
Nevertheless, this field of work is still deficient in certain respects and constrained by a number of limitations. Fixed-wing UAVs are capable of enduring extended periods of flight, yet their considerable size and the necessity for a high degree of stability in their flight attitude render them unsuitable for the collection of data from certain locations characterized by challenging terrain. In the subsequent work, the rapid development of lightweight rotor UAV technology has led to the emergence of lightweight rotor UAVs as a new area of interest in the field of data acquisition. The compact flight attitude of rotor UAVs enables them to fly near the ground, facilitating data communication. Moreover, the integrity of the acquired data is enhanced due to the stability of the communication link. The control of the flight attitude of the lightweight UAV is also a key research topic. The wind perturbation affecting the lightweight UAV is significant. In addition to the influence of the wind, the lightweight UAV is also subject to rain, lightning, and other natural conditions that impose limitations. As the research progresses, steady progress is being made, simulations are conducted and subsequently validated in the field. This approach allows for the evaluation of the UAV’s performance in actual flight conditions, including the impact of adverse weather on the flight process. It enables the investigation of how to adjust the flight attitude under varying wind speeds, thereby facilitating more comprehensive data collection. The impact of disparate natural conditions on the flight process of the lightweight UAV can be recorded in order to ascertain the limiting environmental parameters that the UAV is capable of flying. Furthermore, the small rotary-wing UAV’s ability to adjust its flight attitude under varying wind speeds can be examined in order to determine how it can better accomplish the data collection task.
The data collection mission scenario presented in this paper is one of the scenarios in which UAVs and sensors are used in combination, and in future work, mobile sensors such as collar sensors can also be utilized to obtain personalized data on mobile monitoring objects. To illustrate, one might collect audio-visual data of animals in a national forest park with the aim of understanding the aggregation range and habits of said animals. Following this, one could then design dynamic drone path planning algorithms to collect data from all animals wearing collar-based motion sensors within that range. This approach offers zoologists the opportunity to obtain more up-to-date and precise animal data at a reduced cost, which can contribute to the conservation of endangered species.
This paper proposes a multi-UAV mission planning method for self-organized sensor data acquisition, which is designed to address the need for efficient sensor data acquisition. The method employs a three-dimensional grid, an α-hop clustering algorithm, and a Huffman tree to cluster ground sensors. It then selects CH nodes to pool ground sensor data for communication with the UAV, which significantly reduces the volume of data collected by the UAV. The CH nodes are classified according to a K-Dimensional system to form sub-mission areas that are conducive to multi-UAV cooperative operations with non-intersecting flight areas. Based on the path flight paths generated by the construction algorithms, the objective function and constraints for the combined AoI and UAV flight energy consumption are formulated. Additionally, an operational implementation scheme for solving the UAV flights in the sub-tasks is provided. Simulation experiments demonstrate that the combinatorial optimization strategy presented in this paper is capable of devising an optimal solution for the data acquisition work plan within the specified time frame. The combined optimization strategy proposed in this study demonstrates superior performance compared to the traditional baseline model, with significant improvements of 95.56% and 58.21%, respectively. To further verify the applicability and universality of the method in the real world, the digital elevation model data of the real terrain is used in this study for simulation testing. The results of this testing demonstrate that the error range of the method is controlled within ±10% in comparison with the actual flight performance test of the UAVs, thereby proving the reliability of the method in practical applications. Comparative analyses with prevailing standard methodologies substantiate the substantial benefits of the current approach in terms of spatial and temporal complexity. In particular, with regard to the precision of data extraction, the current method demonstrates an improvement of 10.46% and 12.71%, respectively. This enhancement is particularly evident in tasks that involve the processing of large amounts of data. The results of tests conducted with split modules indicate that the omission of the clustering and subtask assignment steps results in a notable decline in performance. Specifically, the AoI performance decreased by a factor of 3.46 and 4.45, respectively, while the energy performance also exhibited a reduction by a factor of 3.52 and 4.47, respectively. The results underscore the significance of the individual modules in the optimization process and demonstrate that the current methodology is capable of providing precise data extraction and low-energy consumption solutions while sustaining high performance.
This study proposes a novel approach to multi-UAV mission planning oriented to self-organized sensor data acquisition. This approach is not only innovative in theory but also demonstrates excellent performance and wide applicability in practical applications. These results provide a robust foundation and novel perspectives for future research and applications in related fields. In the subsequent research, scholars in related fields can also focus on the field of animal audio-image data collection in national forest parks to help endangered wildlife conservation. Or it can study the flight attitude of lightweight UAVs to meet the data acquisition tasks in narrow terrain more accurately and other related research work. It is also possible to combine the professional opinions given by experts in different fields as the objective function of data acquisition to construct a multi-objective optimization problem, which further improves the generalizability and adaptability of the optimization problem of data acquisition in different scenarios.
Acknowledgement: Not applicable.
Funding Statement: This research was funded by National Key R&D Program of China (2022YFF1302700), Xiong’an New Area Science and Technology Innovation Special Project of Ministry of Science and Technology of China (2023XAGG0065), Ant Group through CCF-Ant Research Fund (CCF-AFSG RF20220214), Outstanding Youth Team Project of Central Universities (QNTD202308) and Beijing Forestry University National Training Program of Innovation and Entrepreneurship for Undergraduates (202310022097).
Author Contributions: Conceptualization, Shijie Yang and Xiaohui Cui; methodology, Xiaohui Cui and Shijie Yang; software, Shijie Yang; validation, Xiaohui Cui and Shijie Yang; formal analysis, Xiaohui Cui and Shijie Yang; investigation, Shijie Yang; resources, Xiaohui Cui, Shijie Yang, Zhipeng Zhang and Jiateng Yuan; data curation, Xiaohui Cui and Shijie Yang; writing—original draft preparation, Xiaohui Cui and Shijie Yang; visualization, Zhipeng Zhang, Shijie Yang and Jiateng Yuan; supervision, Xiaohui Cui, Zhibo Chen and Hanchao Zhang; project administration, Xiaohui Cui, Zhibo Chen and Hanchao Zhang; funding acquisition, Xiaohui Cui and Zhibo Chen. All authors reviewed the results and approved the final version of the manuscript.
Availability of Data and Materials: The datasets generated during and/or analyzed during the current study are available from the corresponding author on reasonable request.
Ethics Approval: Not applicable.
Conflicts of Interest: The authors declare that they have no conflicts of interest to report regarding the present study.
References
1. A. Sharma, B. Sohi, and S. Chandra, “SN based forest fire detection and early warning system,” Int. J. Innov. Technol. Explor. Eng., vol. 8, no. 9, pp. 209–214, Jul. 2019. doi: 10.35940/ijitee.H6733.078919. [Google Scholar] [CrossRef]
2. R. Hall et al., “Remote sensing of forest pest damage: A review and lessons learned from a Canadian perspective,” Can. Entomol., vol. 148, no. S1, pp. S296–S356, Sep. 2016. doi: 10.4039/tce.2016.11. [Google Scholar] [CrossRef]
3. J. Zhang, X. Luo, C. Chen, Z. Liu, and S. Cao, “A wildlife monitoring system based on wireless image sensor networks,” Sens. Transducers, vol. 180, no. 10, pp. 104–111, Oct. 2014. [Google Scholar]
4. P. Barmpoutis, P. Papaioannou, K. Dimitropoulos, N. Grammalidis, “A review on early forest fire detection systems using optical remote sensing,” Sensors, vol. 20, no. 22, Nov. 2020, Art. no. 6442. doi: 10.3390/s20226442. [Google Scholar] [PubMed] [CrossRef]
5. H. Etezadi and S. Eshkabilov, “A comprehensive overview of control algorithms, sensors, actuators, and communication tools of autonomous all-terrain vehicles in agriculture,” Agriculture, vol. 14, no. 2, Feb. 2024, Art. no. 163. doi: 10.3390/agriculture14020163. [Google Scholar] [CrossRef]
6. C. Caillouet, F. Giroire, and T. Razafindralambo, “Efficient data collection and tracking with flying drones,” Ad Hoc Netw., vol. 89, no. 3, pp. 35–46, Oct. 2019. doi: 10.1016/j.adhoc.2019.01.011. [Google Scholar] [CrossRef]
7. M. Ren, X. Fu, P. Pace, G. Aloi, and G. Fortino, “Collaborative data acquisition for UAV-aided IoTs based on time-balancing scheduling,” IEEE Internet Things J., vol. 10, no. 12, pp. 10743–10755, Jun. 2023. [Google Scholar]
8. D. Popescu, C. Dragana, F. Stoican, L. Ichim, and G. Stamatescu, “A collaborative UAV-WSN network for monitoring large areas,” Sensors, vol. 18, no. 12, Dec. 2018, Art. no. 4202. doi: 10.3390/s18124202. [Google Scholar] [PubMed] [CrossRef]
9. S. Loganathan and J. Arumugam, “Clustering algorithms for wireless sensor networks survey,” Sens. Lett., vol. 18, no. 2, pp. 143–149, Feb. 2020. doi: 10.1166/sl.2020.4193. [Google Scholar] [CrossRef]
10. A. I. Al-Sulaifanie, B. K. Al-Sulaifanie, and S. Biswas, “Recent trends in clustering algorithms for wireless sensor networks: A comprehensive review,” Comput. Commun., vol. 191, no. 2, pp. 395–424, Mar. 2022. doi: 10.1016/j.comcom.2022.05.006. [Google Scholar] [CrossRef]
11. N. Mazumdar, S. Roy, and S. Nayak, “A survey on clustering approaches for wireless sensor networks,” presented at the 2nd Int. Conf. Data Sci. Bus. Anal. (ICDSBA), Hyderabad, India, Oct. 10–12, 2018, pp. 1–6. [Google Scholar]
12. J. Singh and A. K. Mishra, “Clustering algorithms for wireless sensor networks: A review,” presented at the 2nd Int. Conf. Comput. Sustain. Glob. Dev. (INDIACom), New Delhi, India, Mar. 11–13, 2015, pp. 726–731. [Google Scholar]
13. S. Sall and R. Bansode, “Energy efficient approaches for dynamic cluster head selection using optimized genetic algorithm in cluster networks of WSN,” Turk. Online J. Qual. Inquiry., vol. 12, no. 10, pp. 123–135, Oct. 2021. [Google Scholar]
14. D. Singh, P. Singh, V. Singh, and N. Singh, “Psuedo randomised cluster head selection algorithm for wireless sensor network,” Int. J. Comput. Sci. Commun., vol. 3, no. 1, pp. 254–258, 2012. [Google Scholar]
15. Y. Liang and H. Yu, “Energy adaptive cluster-head selection for wireless sensor networks,” presented at the 6th Int. Conf. Parallel Distrib. Comput. Appl. Technol. (PDCAT), Dalian, China, Sep. 12–15, 2005, pp. 634–638. [Google Scholar]
16. M. Bendechache and M. -T. Kechadi, “Distributed clustering algorithm for spatial data mining,” presented at the 2nd IEEE Int. Conf. Spatial Data Min. Geogr. Knowl. Serv. (ICSDM), Lisbon, Portugal, Jun. 15–17, 2015, p. 155. [Google Scholar]
17. R. Jain, “A hybrid clustering algorithm for data mining,” May 2012, arXiv:1205.5353. [Google Scholar]
18. T. A. Al-Janabi and H. S. Al-Raweshidy, “Optimised clustering algorithm-based centralised architecture for load balancing in IoT network,” presented at the Int. Symp. Wireless Commun. Syst. (ISWCS), Lisbon, Portugal, Aug. 28–31, 2017, pp. 1–6. [Google Scholar]
19. Z. Wang, L. Tian, L. Lin, J. Xie, W. Wu and Y. Tong, “Data collection system of IoT based on the coordination of drones and unmanned surface vehicle,” J. Adv. Transp., vol. 2023, no. 1, Jan. 2023, Art. no. 3426932. doi: 10.1155/2023/3426932. [Google Scholar] [CrossRef]
20. H. S. Lee, B. S. Shin, J. A. Thomasson, T. Wang, Z. Zhang and X. Han, “Development of multiple UAV collaborative driving systems for improving field phenotyping,” Sensors, vol. 22, no. 4, Apr. 2022, Art. no. 1423. doi: 10.3390/s22041423. [Google Scholar] [PubMed] [CrossRef]
21. J. Skilling, “Programming the Hilbert curve,” presented at the AIP Conf. Proc., Melville, NY, USA, pp. 105–108. [Google Scholar]
22. A. Visentin, S. Prestwich, R. Rossi, and S. A. Tarim, “Computing optimal (R, s, S) policy parameters by a hybrid of branch-and-bound and stochastic dynamic programming,” Eur. J. Oper. Res., vol. 294, no. 1, pp. 91–99, Jan. 2021. doi: 10.1016/j.ejor.2021.01.012. [Google Scholar] [CrossRef]
23. M. J. Brusco and S. Stahl, “Optimal least-squares unidimensional scaling: Improved branch-and-bound procedures and comparison to dynamic programming,” Psychometrika, vol. 70, no. 2, pp. 253–270, Jun. 2005. doi: 10.1007/s11336-002-1032-6. [Google Scholar] [CrossRef]
24. S. Boyd and L. Vandenberghe, “Localization and cutting-plane methods,” in Stanford EE 364b Lecture Notes, 2007, vol. 386, pp. 1–21. [Google Scholar]
25. C. Blum, “Ant colony optimization: Introduction and recent trends,” Phys. Life Rev., vol. 2, no. 4, pp. 353–373, Dec. 2005. doi: 10.1016/j.plrev.2005.10.001. [Google Scholar] [CrossRef]
26. M. Zhang, M. Sutcliffe, P. I. Nicholson, and Q. Yang, “Efficient autonomous path planning for ultrasonic non-destructive testing: A graph theory and k-dimensional tree optimisation approach,” Machines, vol. 11, no. 12, Dec. 2023, Art. no. 1059. doi: 10.3390/machines11121059. [Google Scholar] [CrossRef]
27. A. Chambolle, L. A. Ferrari, and B. Merlet, “Variational approximation of size-mass energies for k-dimensional currents,” ESAIM: Control Optim. Calc. Variations, vol. 25, Apr. 2019, Art. no. 43. doi: 10.1051/cocv/2018027. [Google Scholar] [CrossRef]
28. A. Hazarika and M. Rahmati, “A framework for information freshness analysis in UAV-based sensing and communications,” presented at the Wireless Telecommun. Symp. (WTS), Los Angeles, CA, USA, Apr. 19–21, 2022, pp. 1–6. [Google Scholar]
29. X. Chen et al., “Information freshness-aware task offloading in air-ground integrated edge computing systems,” IEEE J. Sel. Areas Commun., vol. 40, no. 1, pp. 243–258, Jan. 2021. doi: 10.1109/JSAC.2021.3126075. [Google Scholar] [CrossRef]
30. J. Modares et al., “UB-ANC planner: Energy efficient coverage path planning with multiple drones,” presented at the IEEE Int. Conf. Robot. Autom. (ICRA), Singapore, May 29–Jun. 3, 2017, pp. 5291–5298. [Google Scholar]
31. D. Hong, S. Lee, Y. H. Cho, D. Baek, J. Kim and N. Chang, “Energy-efficient online path planning of multiple drones using reinforcement learning,” IEEE Trans. Veh. Technol., vol. 70, no. 10, pp. 9725–9740, Oct. 2021. doi: 10.1109/TVT.2021.3102589. [Google Scholar] [CrossRef]
32. C. Di Franco and G. Buttazzo, “Energy-aware coverage path planning of UAVs,” presented at the IEEE Int. Conf. Autonomous Robot Syst. Compet. (ICARSC), Lisbon, Portugal, Apr. 15–17, 2015, pp. 41–46. [Google Scholar]
33. P. Beigi, M. S. Rajabi, and S. Aghakhani, “An overview of drone energy consumption factors and models,” in Handbook Smart Energy Syst., vol. 529–548, pp. 1–20, 2022. [Google Scholar]
34. Y. Chen, D. Baek, A. Bocca, A. Macii, E. Macii and M. Poncino, “A case for a battery-aware model of drone energy consumption,” presented at the IEEE Int. Telecommun. Energy Conf. (INTELEC), San Diego, CA, USA, Oct. 14–18, 2018, pp. 1–6. doi: 10.1109/INTLEC.2018.8612333. [Google Scholar] [CrossRef]
35. X. Liu, C. Hefler, W. Shyy, and H. Qiu, “The importance of flapping kinematic parameters in the facilitation of the different flight modes of dragonflies,” J. Bionic Eng., vol. 18, no. 2, pp. 419–427, Jun. 2021. doi: 10.1007/s42235-021-0020-4. [Google Scholar] [CrossRef]
36. S. K. Alibhai, J. Gu, Z. C. Jewell, J. Morgan, D. Liu and G. Jiang, ‘I know the tiger by his paw’: A non-invasive footprint identification technique for monitoring individual Amur tigers (Panthera tigris altaica) in snow,” Ecol. Inform., vol. 73, no. 3, Oct. 2023, Art. no. 101947. doi: 10.1016/j.ecoinf.2022.101947. [Google Scholar] [CrossRef]
37. S. R. Bakana, Y. Zhang, and B. Twala, “WildARe-YOLO: A lightweight and efficient wild animal recognition model,” Ecol. Inform., vol. 80, Apr. 2024, Art. no. 102541. [Google Scholar]
38. S. Alibhai, Z. Jewell, and J. Evans, “The challenge of monitoring elusive large carnivores: An accurate and cost-effective tool to identify and sex pumas (Puma concolor) from footprints,” PLoS One, vol. 12, no. 3, p. e0172065, Mar. 2017. [Google Scholar] [PubMed]
39. M. A. Zemanova, “Towards more compassionate wildlife research through the 3Rs principles: Moving from invasive to non-invasive methods,” Wildlife Biol., vol. 2020, no. 1, pp. 1–17, Jan. 2020. doi: 10.2981/wlb.00607. [Google Scholar] [CrossRef]
40. C. D. Cameron, “Self-organising smart grid architectures for cyber-security,” Ph.D. dissertation, Newcastle University, UK, 2017. [Google Scholar]
41. A. Reinhardt, D. Christin, M. Hollick, J. Schmitt, P. S. Mogre and R. Steinmetz, “Trimming the tree: Tailoring adaptive Huffman coding to wireless sensor networks,” presented at the 7th Eur. Conf. Wireless Sens. Netw. (EWSN), Coimbra, Portugal, Feb. 17–19, 2010, vol. 7, pp. 29–44. [Google Scholar]
42. S. Wang, “Multimedia data compression storage of sensor network based on improved Huffman coding algorithm in cloud,” Multimedia Tools Appl., vol. 79, no. 47, pp. 35369–35382, Nov. 2020. doi: 10.1007/s11042-019-07765-0. [Google Scholar] [CrossRef]
43. A. Abu-Baker, H. Shakhatreh, A. Sawalmeh, and A. H. Alenezi, “Efficient data collection in UAV-assisted cluster-based wireless sensor networks for 3D environment: Optimization study,” J. Sens., vol. 2023, no. 1, Jan. 2023, Art. no. 9513868. doi: 10.1155/2023/9513868. [Google Scholar] [CrossRef]
44. T. Zhang, G. Chen, Q. Zeng, G. Song, C. Li and H. Duan, “Routing clustering protocol for 3D wireless sensor networks based on fragile collection ant colony algorithm,” IEEE Access, vol. 8, pp. 58874–58888, Apr. 2020. doi: 10.1109/ACCESS.2020.2982691. [Google Scholar] [CrossRef]
45. Y. Zeng and R. Zhang, “Energy-efficient UAV communication with trajectory optimization,” IEEE Trans. Wireless Commun., vol. 16, no. 6, pp. 3747–3760, Jun. 2017. doi: 10.1109/TWC.2017.2688328. [Google Scholar] [CrossRef]
46. D. Xue, K. K. Ng, and L. -T. Hsu, “Multi-objective flight altitude decision considering contrails, fuel consumption, and flight time,” Sustainability, vol. 12, no. 15, Jul. 2020, Art. no. 6253. doi: 10.3390/su12156253. [Google Scholar] [CrossRef]
47. A. A. Recalde et al., “Energy storage system selection for optimal fuel consumption of aircraft hybrid electric taxiing systems,” IEEE Trans. Transp. Electrification., vol. 7, no. 3, pp. 1870–1887, Sep. 2020. doi: 10.1109/TTE.2020.3039759. [Google Scholar] [CrossRef]
48. X. Li, J. Li, and D. Liu, “Energy-efficient UAV trajectory design with information freshness constraint via deep reinforcement learning,” Mobile Inf. Syst., vol. 2021, no. 1, Jun. 2021, Art. no. 1430512. [Google Scholar]
49. J. Liu, P. Tong, X. Wang, B. Bai, and H. Dai, “UAV-aided data collection for information freshness in wireless sensor networks,” IEEE Trans. Wireless Commun., vol. 20, no. 4, pp. 2368–2382, Apr. 2020. doi: 10.1109/TWC.2020.3041750. [Google Scholar] [CrossRef]
50. B. Zhu, E. Bedeer, H. H. Nguyen, R. Barton, and Z. Gao, “UAV trajectory planning for AoI-minimal data collection in UAV-aided IoT networks by transformer,” IEEE Trans. Wireless Commun., vol. 22, no. 2, pp. 1343–1358, Feb. 2022. doi: 10.1109/TWC.2022.3204438. [Google Scholar] [CrossRef]
51. Y. Zhang, J. Lyu, and L. Fu, “Energy-efficient trajectory design for UAV-aided maritime data collection in wind,” IEEE Trans. Wireless Commun., vol. 21, no. 12, pp. 10871–10886, Dec. 2022. doi: 10.1109/TWC.2022.3187954. [Google Scholar] [CrossRef]
52. T. -Y. Chuang, K. -C. Chen, and H. V. Poor, “Information centric sensor network management via community structure,” IEEE Commun. Lett., vol. 19, no. 5, pp. 767–770, May 2015. doi: 10.1109/LCOMM.2015.2409070. [Google Scholar] [CrossRef]
53. T. Chen, J. Shi, J. Yang, and G. Li, “Enhancing network cluster synchronization capability based on artificial immune algorithm,” Hum. Cent. Comput. Inf. Sci., vol. 9, no. 1, pp. 1–28, Dec. 2019. doi: 10.1186/s13673-019-0164-y. [Google Scholar] [CrossRef]
Cite This Article
 Copyright © 2024 The Author(s). Published by Tech Science Press.
This work is licensed under a Creative Commons Attribution 4.0 International License , which permits unrestricted use, distribution, and reproduction in any medium, provided the original work is properly cited.
 Downloads
 Citation Tools