
 Submit a Paper
 Propose a Special lssue
 Open Access
ARTICLE

Optimization Model Proposal for Traffic Differentiation in Wireless Sensor Networks
Faculty of Traffic and Communications, University of Sarajevo, Sarajevo, 71000, Bosnia and Herzegovina
* Corresponding Author: Adisa Hasković Džubur. Email:
Computers, Materials & Continua 2024, 81(1), 1059-1084. https://doi.org/10.32604/cmc.2024.055386
Received 25 June 2024; Accepted 05 September 2024; Issue published 15 October 2024
 View Full Text
 Download PDF
Abstract
Wireless sensor networks (WSNs) are characterized by heterogeneous traffic types (audio, video, data) and diverse application traffic requirements. This paper introduces three traffic classes following the defined model of heterogeneous traffic differentiation in WSNs. The requirements for each class regarding sensitivity to QoS (Quality of Service) parameters, such as loss, delay, and jitter, are described. These classes encompass real-time and delay-tolerant traffic. Given that QoS evaluation is a multi-criteria decision-making problem, we employed the AHP (Analytical Hierarchy Process) method for multi-criteria optimization. As a result of this approach, we derived weight values for different traffic classes based on key QoS factors and requirements. These weights are assigned to individual traffic classes to determine transmission priority. This study provides a thorough comparative analysis of the proposed model against existing methods, demonstrating its superior performance across various traffic scenarios and its implications for future WSN applications. The results highlight the model’s adaptability and robustness in optimizing network resources under varying conditions, offering insights into practical deployments in real-world scenarios. Additionally, the paper includes an analysis of energy consumption, underscoring the trade-offs between QoS performance and energy efficiency. This study presents the development of a differentiated services model for heterogeneous traffic in wireless sensor networks, considering the appropriate QoS framework supported by experimental analyses.Keywords
Traffic characteristics in Wireless Sensor Networks (WSNs) are only partially determined due to their complex nature. These networks often experience unevenly distributed traffic, where data flows from numerous sensor nodes to a few destination points. It is challenging to ensure adequate Quality of Service (QoS) due to unpredictable traffic behavior and heterogeneous traffic characteristics. Consequently, there is a pressing need for differentiating services within WSNs. This research is motivated by the necessity to develop a multi-criteria model to ensure adequate QoS, ultimately leading to the requirement for differentiating services.
WSNs play a crucial role in the Internet of Things (IoT) due to their broad range of applications and their similarity to IoT networks, both of which utilize battery-powered nodes for monitoring processes [1]. IoT relies on the data traffic generated by WSNs, utilizing their wireless sensor nodes to efficiently transmit and gather information. This data flow enables real-time monitoring, control, and diverse applications of interconnected devices in the IoT ecosystem. Different IoT applications have varying QoS requirements; for instance, some applications demand strict delay constraints, while others are more tolerant. To address these needs, various service scheduling methods have been proposed for buffer management [2]. These methods include allocated buffer access for each traffic class and a shared buffer with a defined priority for each class.
Understanding traffic behavior in WSNs allows for more effective traffic management. For instance, a better strategy for implementing routing protocols and managing sensor nodes can be developed if the nature of the large amounts of data exchanged between the sensors is understood. This understanding ensures optimal bandwidth distribution across service classes by preventing the over-allocation of resources to high-priority classes. Once the necessary bandwidth has been allocated to the high-priority class, the remaining bandwidth can be distributed among the lower-priority classes. This approach is suitable for packet networks that support various traffic types competing for limited network resources, each with specific QoS requirements [3]. Service differentiation is achieved by applying QoS mechanisms at the access point of the analyzed network.
The primary aim of this research is to present a new service differentiation model for WSNs with heterogeneous traffic characteristics and QoS parameters. Based on the aforementioned considerations, the research question was formulated: How can we determine the weight factor values to assign priority to certain traffic classes? To answer this question, an optimization model was developed that determines weight values for individual traffic classes. The contributions of this research include: proposing an optimization model that addresses the existing challenges in traffic classification and resource allocation, which impacts QoS parameters and energy consumption; enhancing priority assignment schemes to certain types of traffic differentiated into classes by their relevant characteristics; and improving QoS and reducing delay using a novel Analytical Hierarchy Process (AHP) and Multi-Criteria Decision-Making (MCDM)-based approach.
This paper is structured as follows: Section 2 presents an overview of class-oriented models of traffic differentiation in WSNs to ensure QoS. Section 3 details the proposed model, including its network, queuing, and traffic class structure. This section also includes an analysis of multicriteria optimization methods, specifically the AHP method, and its application in determining weight components for specific traffic classes. Section 4 focuses on modeling heterogeneous traffic and identifying the most critical QoS parameters for different traffic types. These parameters serve as input for the AHP multi-criteria analysis, which determines their importance under varying traffic conditions. Section 5 presents a detailed comparative analysis with existing methods, showcasing the advantages and limitations of the proposed AHP model, supported by experimental and energy consumption analyses that validate its effectiveness and performance. Finally, Section 6 provides concluding remarks and suggestions for future research directions.
Quality of Service (QoS) solutions provided through service differentiation algorithms within Wireless Sensor Networks (WSNs) have been suggested in various studies [4,5]. The strategy of differentiating services has emerged as a common approach for achieving QoS in real-time WSN applications. Beginning with pioneering works on service-based differentiated QoS, as seen in [4], subsequent research in this domain has demonstrated the tailored design of QoS approaches to accommodate WSN resource limitations [4,6]. Although the proposed mechanisms include various types of service differentiation, such as QoS-aware routing, scheduling based on priority schemes, assurance of QoS with a certain probability, and MAC protocols, research in this area is mainly based on different types of data and requirements for network QoS levels. Considering many other real-time QoS solutions in WSNs, it’s evident that the service differentiation strategy predominantly prioritizes delay-sensitive packets [5], aiming to serve real-time packets in their arrival process to the destination point with minimal delays. However, there have been limitations in papers [7–9] that deal with the different QoS requirements of various traffic classes.
Delay-tolerant WSNs [10] are characterized by long-term and sporadic connections. A fundamental aspect of QoS requirements in delay-tolerant applications, such as automotive networks [11], revolves around ensuring reliable data transmission and compensating for unstable connections using storage and forwarding network functions. Research efforts in this domain predominantly focus on routing protocols [8,12], which aim to reduce data transmission delays. The method proposed in [13] efficiently schedules CoAP (Constrained Application Protocol) packets on sensor nodes by employing a classification mechanism to categorize CoAP requests and responses across the network. Additionally, it manages the timing and aggregation of received messages on the sensor nodes, achieving outcomes such as reduced energy consumption and network traffic.
Machine learning algorithms, specifically the Classification and Regression Tree (CART) algorithm, play a crucial role in optimizing resource allocation for WSNs by intelligently managing resources for classification and decision-making, as shown in [14]. This proposed scheme enhances accuracy, computational efficiency, and transmission effectiveness in resource allocation at the cluster level, with potential extensions to gateway, edge, and cloud levels. It addresses challenges such as fading and interference for diverse applications in heterogeneous WSNs. The paper [15] addresses QoS in WSNs through cross-layered architecture and statistical analysis, showing improvements in latency, throughput, energy efficiency, and reliability, while also discussing the role of machine learning in enhancing these metrics. In contrast, the performance of a heterogeneous data traffic network categorized as high and low priority is described in [16] by WSN integration on the Internet. However, the QoS requirements for timely and reliable packet transmission were not considered.
An enhanced class-based dynamic priority (E-CBDP) algorithm is proposed as a mechanism for scheduling uplink packets, which gives human-to-human (H2H) communication higher priority over M2M traffic [17]. Moreover, a dynamic priority queuing model is modified in [18] to assess the efficiency of various traffic types. Within this model, a priority jump strategy is introduced to enhance transmission opportunities for packets belonging to low-priority users.
A novel mechanism for effective traffic prioritization is introduced in [19]. Data packets generated from each wireless body area network are effectively placed in four separate queues, taking into account their criticality to ensure QoS-aware delivery. A scheduling mechanism based on the IEEE 802.15.6 standard is developed. Additionally, a traffic scheduling scheme for audio/video sensor networks, designed to meet the different QoS requirements of these delivery forms, is proposed in [20]. A typical architecture of audio/video sensor networks is presented, along with the concept of DiffServ (Differentiated Services) within this architecture. Two basic delivery methods are described. To meet the requirements of guaranteed real-time communication, a model without priority queues (NPPQ—Non-Preemptive Priority Queuing) was used to arrange two types of data packets. The average waiting time of these two types of data packets was also analyzed using the M/M/1 queuing model, and the performance of this model was compared with a model where bandwidth differentiation is present [21].
The paper [22] proposed a game theory-based admission control algorithm for efficient resource allocation in wireless mesh networks. Similarly, the traffic engineering model in [23] uses a dynamic queuing mechanism to assign priorities and ensure QoS in next-generation wireless sensor networks, thereby enhancing overall network performance.
The methodology for the proposed traffic differentiation model in WSNs involves several steps to ensure efficient traffic management based on QoS parameters, as follows: (1) traffic classification using predefined parameters, (2) packet labeling based on their class, (3) packet directing to appropriate queues using the AHP-based model, and (4) weight factors and bandwidth allocations for each class to manage packet flow and ensure QoS.
The model proposed in this paper presents traffic differentiation in WSNs, using multi-criteria optimization to manage traffic based on QoS parameters. The model is described through three key aspects: network structure, queuing system, and traffic classes. Each of these aspects is explained in detail, including methods for determining weight values for each traffic class, implementation of queuing systems, and algorithms for resource allocation to ensure bandwidth assurance. These details are discussed further in the following sections.
Service differentiation is considered a general principle for developing models that ensure appropriate QoS in WSNs and applications. Since the typical DiffServ approach could not be easily translated into the WSN environment [16], several models have been developed to achieve this goal. The most frequently applied integration approach involves modeling based on the implementation of a node-gateway as an interface between the WSN and the Internet [24].
Fig. 1 illustrates the network model of the traffic differentiation approach in a WSN. WSN nodes are assumed to have bidirectional communication with the network access point (gateway), with no direct communication among sensors. Each node generates different types of traffic that belong to classes

Figure 1: Traffic differentiation network model
Upon reaching the access point, packets are organized into buffer rows. Within the access point, a scheduler and an appropriate queue mechanism are implemented, utilizing weighted values assigned to specific traffic classes. The primary objective is to achieve optimal resource allocation in the transmission process for packets with diverse QoS requirements.
Resource allocation optimization is performed by applying a multi-criteria AHP optimization method. Connections, i.e., individual traffic classes, are defined by the obtained AHP weights and link capacity value C. Based on these results, it is possible to assess the QoS performance of the access network.
The queuing model determines the behavior of packets waiting to be transmitted in the buffer at the access point (AP). Different types of traffic arrivals are placed in separate queues based on the differentiation principle applied at the AP. To achieve traffic class differentiation, it is assumed that each WSN node labels each packet with a specific traffic class label, directing them to the appropriate queues. Packet identification based on these labels determines the individual traffic class of each packet. If the number of traffic classes increases, there may be a need to increase the number of buffers, which are created separately for each traffic class.
Fig. 2 illustrates the queuing model of this system. Packet flows from different traffic classes are served based on the assigned weight factors for each queue. These weight factors are determined according to QoS traffic requirements, including parameters such as delay, loss, and jitter.
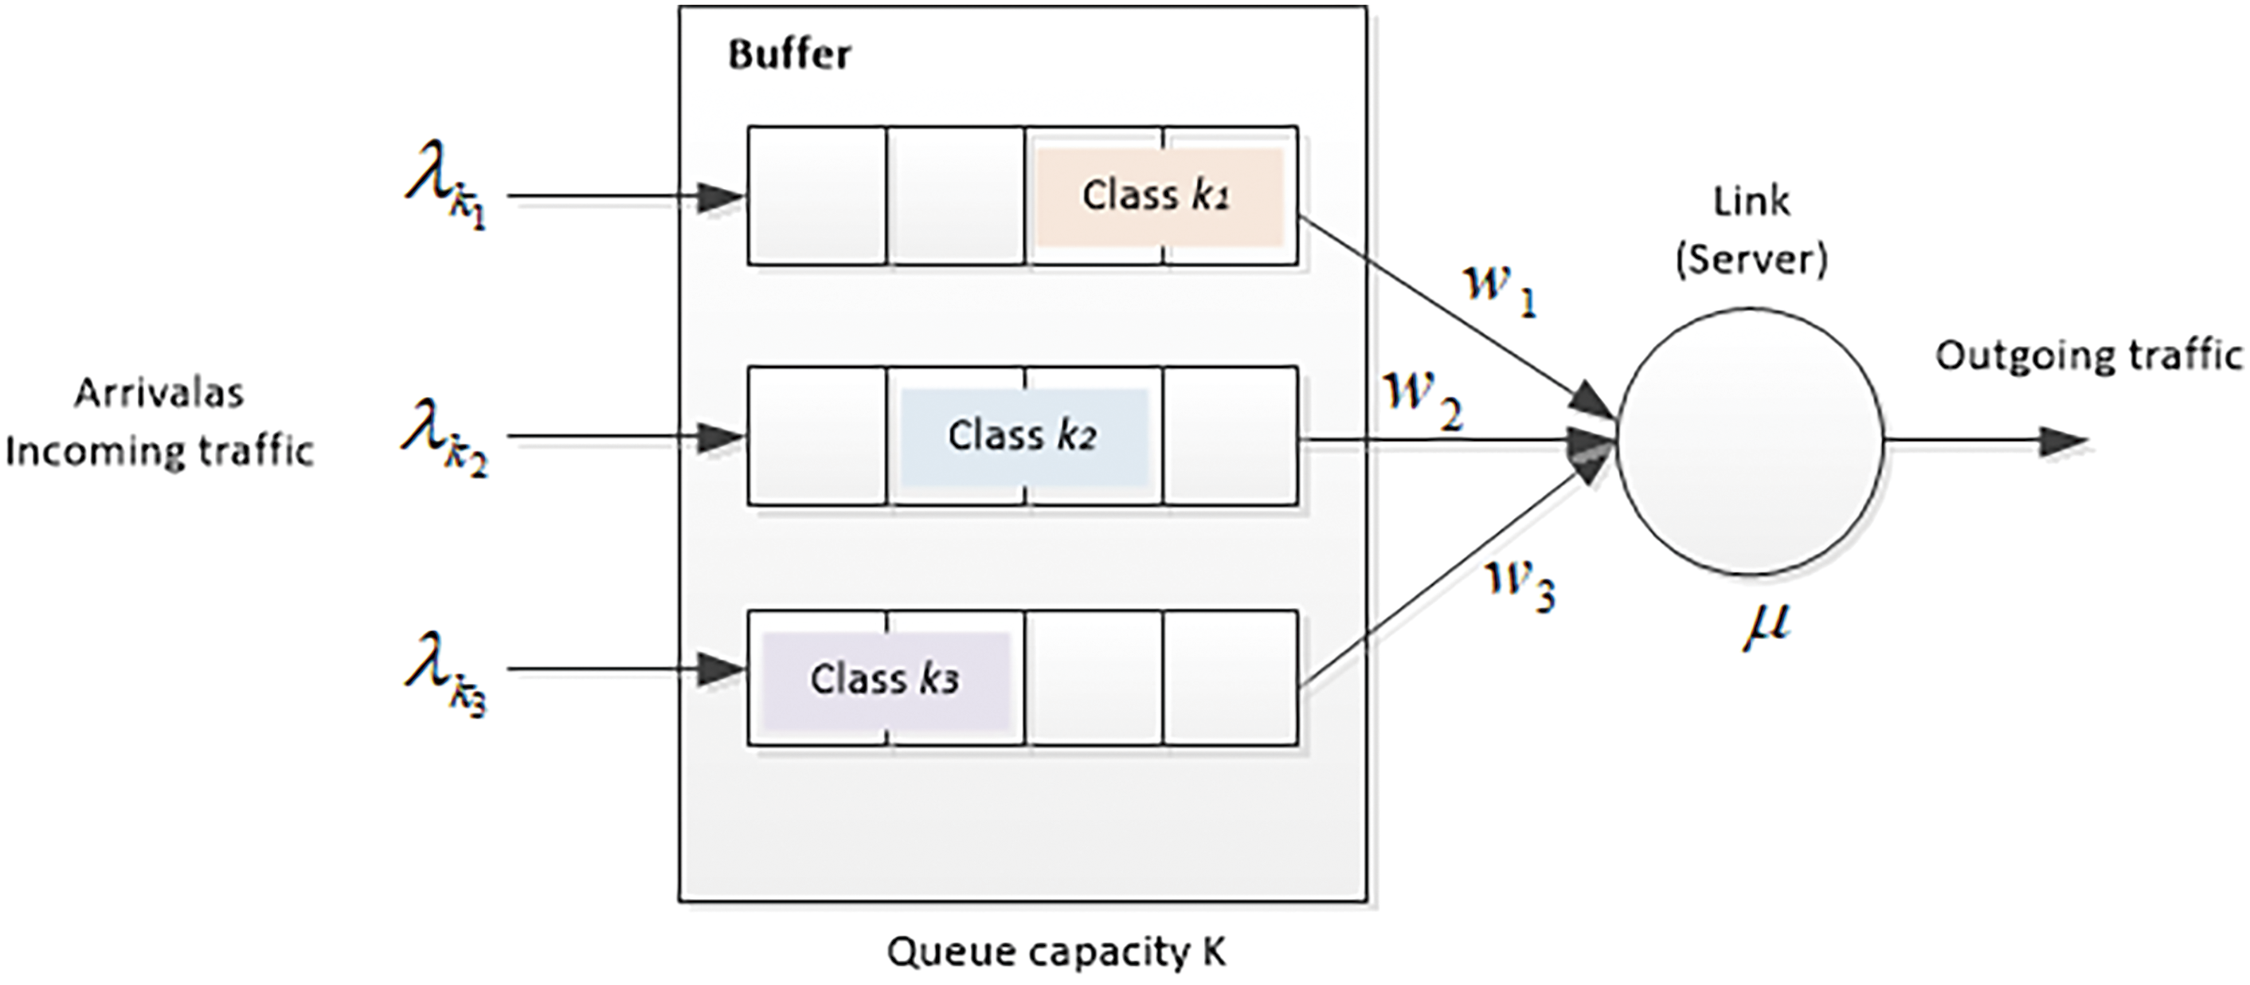
Figure 2: Queue system of the proposed model
Consider a system with three traffic classes
If we analyze a link with capacity
Each queue has a limited waiting time value, and interarrival times are exponentially distributed with a mean value that depends on the service rate intensity, which characterizes the outgoing connection capacity to the network access point. These assumptions allow for the application of the M/M/1 queuing theory model to analyze the appropriate distribution of weight factors for individual traffic classes.
Considering the heterogeneous traffic in wireless sensor networks, different types of traffic are assumed, such as:
•
•
•
Traffic class
Furthermore, delay-tolerant traffic is defined by class
An important note is that in most WSNs, a single node does not always have the same sensors. This means that one node can support different traffic classes, while another node may only support two traffic class types. This indicates that QoS requirements should be precisely defined. The queuing model was developed with consideration of the QoS requirements important for different traffic types. Typically, QoS requirements for real-time traffic are defined using delay constraints, while QoS requirements for delay-tolerant traffic are defined using packet loss tolerance.
The QoS parameters (see Table 1), analyzed in the process of categorizing traffic types into certain classes, are highlighted by RFC 4594 [25]. This RFC is intended as a framework to support DiffServ in any network, including wireless networks.
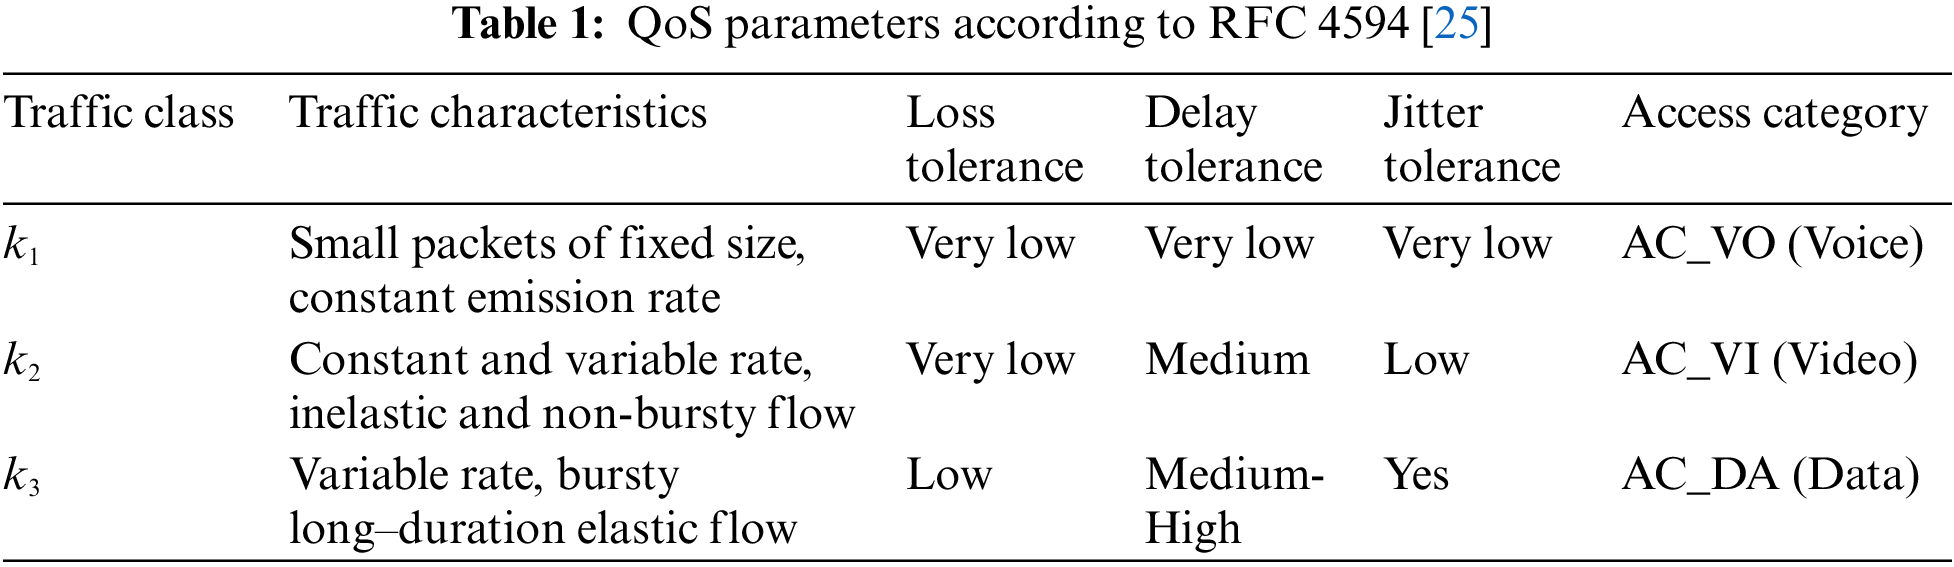
The proposed model supports real-time traffic (Expedited Forwarding-EF) and traffic that has a certain tolerance to delay (Assured Forwarding-AF). The EF category includes
The consideration of QoS parameters in the IoT environment is fundamentally influenced by selecting a service capable of providing suitable resources. QoS evaluation is treated as a multi-criteria decision-making problem when applying an appropriate optimization method. Based on the previously defined model of heterogeneous traffic differentiation in WSNs, three traffic classes are identified, each with specific requirements for QoS parameters: loss, delay, and jitter. The following discussion will focus on the application of a multi-criteria optimization method to determine suitable packet allocation weighting factors for resource allocation algorithms.
QoS modeling has been extensively researched within the IoT domain. Hence, it is necessary to establish a system that can effectively manage the increasing traffic demands while maintaining the required QoS level [26]. Developed QoS models utilize various methods to quantify QoS values, serving as metrics for service evaluation and selection. Given the event-driven nature of IoT traffic, selecting an appropriate resource to handle incoming traffic is critical. For such resource selection, a QoS evaluation model is employed as an objective tool in the decision-making process.
An MCDM model was proposed for a heterogeneous access network [27], where incoming service requests include preferences based on decision factors that determine the most appropriate network. Thus, the categorization of traffic into classes can be analyzed as an MCDM problem. MCDM guides decision-makers in choosing the optimal alternative from several options, determined by various criteria or attributes, whether clearly defined or ambiguous. In this case, the objective of employing MCDM techniques is to evaluate and rank alternatives (classes) based on QoS parameters (criteria).
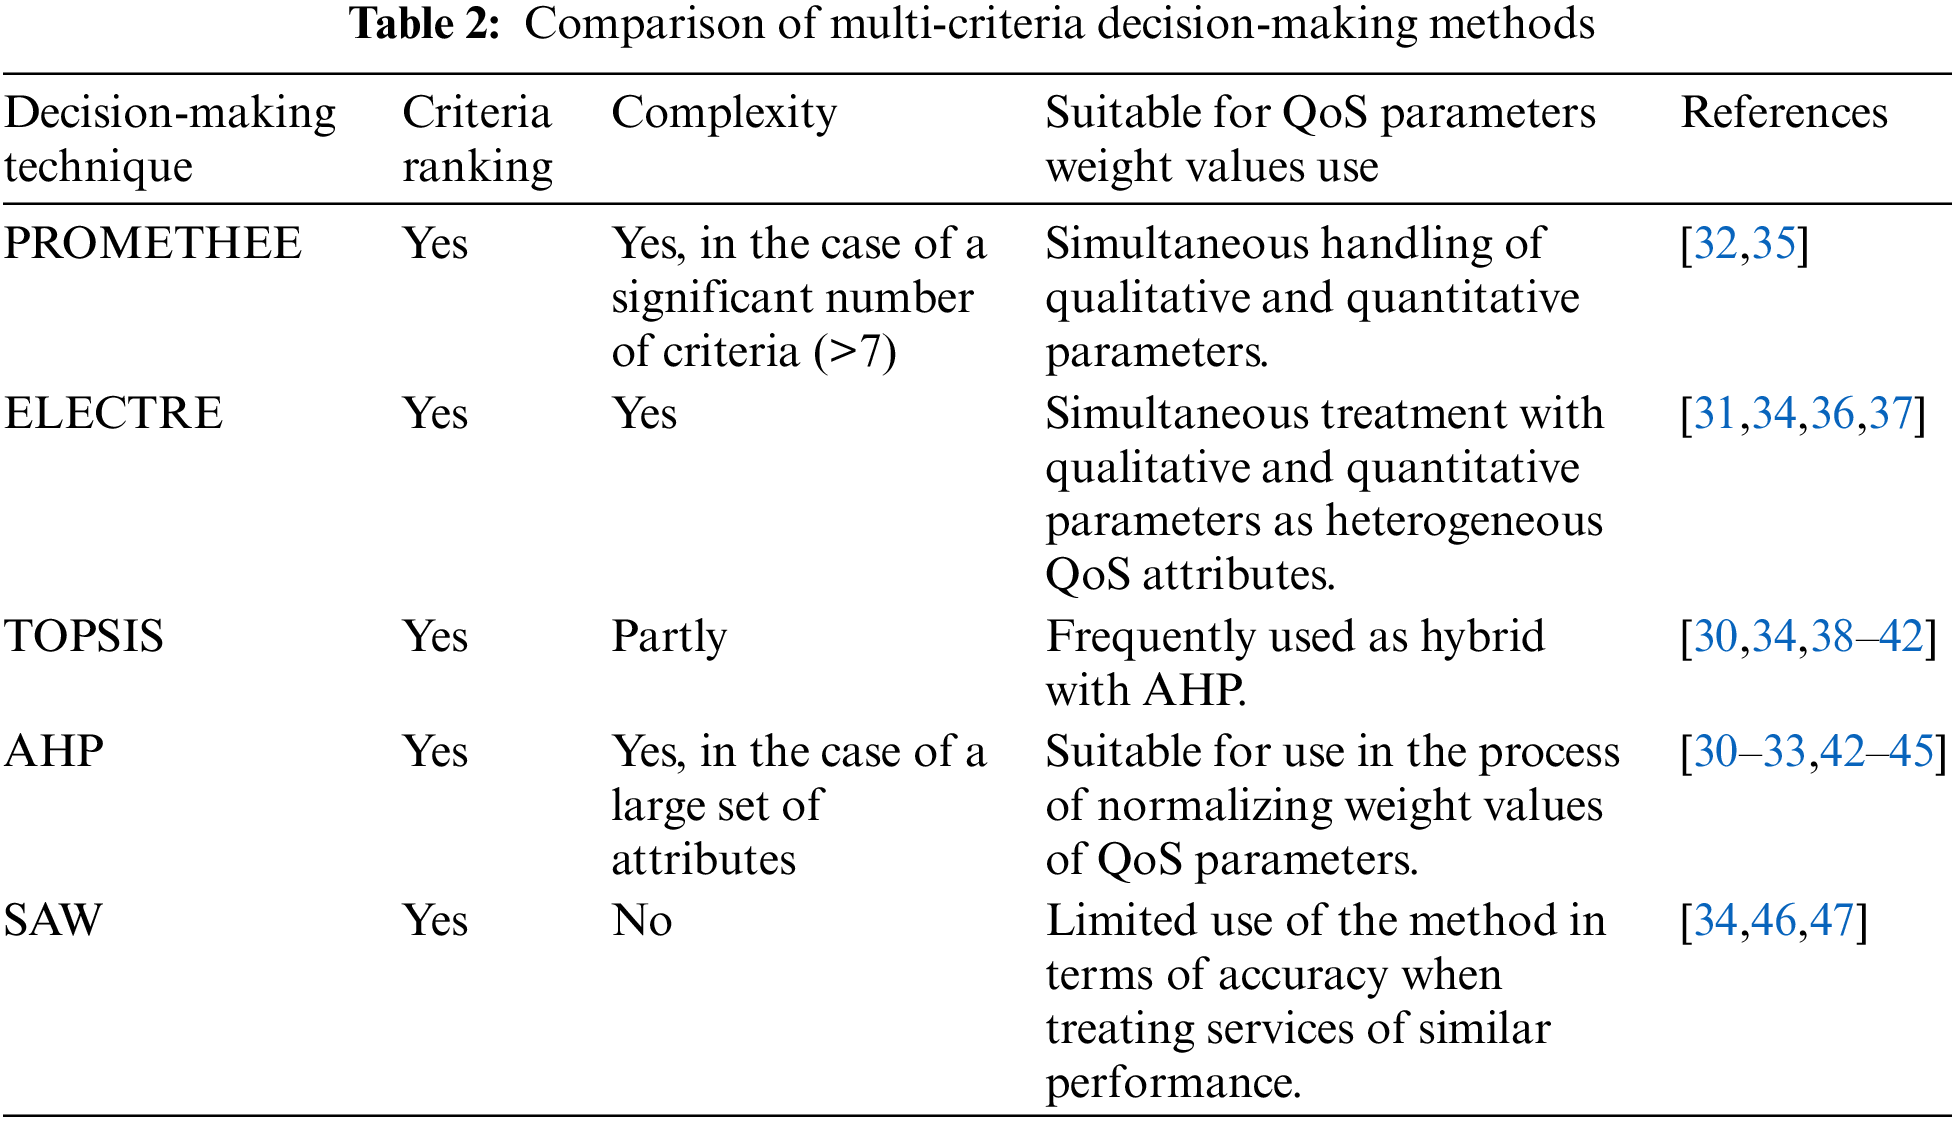
Various MCDM techniques have been developed and applied to decide on the best alternative in WSNs. These include the Analytic Hierarchy Process (AHP) [28], Fuzzy Analytic Hierarchy Process (FAHP) [29], Technique for Order Preference by Similarity to Ideal Solution (TOPSIS) [30], ELimination and Choice Expressing Reality (ELECTRE) [31], and Preference Ranking Organization Method for Enrichment Evaluation (PROMETHEE) [32]. Among these, AHP stands out as the most popular and widely used technique due to its simplicity and the characteristics of its calculation results [33,34]. Table 2 presents a comparative analysis of various MCDM techniques.
The AHP method was proposed as a method for service quality evaluation in [40,43], considering criteria related to services, networks, and users. These criteria include: type of service, minimum bandwidth, packet loss, delay, throughput, bit rate, cost, transmission power, received signal strength, load, mobile unit battery condition, and other user preferences. The key advantages of AHP compared to other methods include its flexibility and intuitiveness for the decision-maker, as well as the ability to check inconsistencies in decision-making [45]. Data entry in the comparison process is relatively simple for users.
AHP (Analytic Hierarchy Process) is one of the most commonly used methods in scenarios requiring the selection and ranking of alternatives based on multiple attributes. These attributes, which characterize potential alternatives, have different degrees of importance and are expressed on various scales. The AHP method facilitates decision-making and priority setting through qualitative and quantitative decision analysis.
Originally proposed by Thomas Saaty in the 1970s, the AHP method is designed for qualitative and quantitative analysis and evaluation of systems. The core principle involves defining a problem, which is then decomposed into a hierarchical structure. Each hierarchical level contains manageable elements, which can be further subdivided into more specific sets of elements. This procedure continues until the most granular elements of the problem are identified at the lowest hierarchical level. A key feature of AHP is its flexibility in constructing hierarchies to meet the specific needs of decision-makers. Metrics are used to assign scores to pairs of elements relative to a higher-level element, establishing priorities among elements at each hierarchical level. The comparison of elements is based on considering two criteria. These comparisons are conducted using the Fundamental Scale of Absolute Numbers (‘1–9 scale’) [45].
In the context of this study, AHP is utilized to assign weights to different traffic classes, i.e., alternatives, by using criteria such as delay, losses, and jitter. The process of assigning weights involves pairwise comparisons and consistency checks to ensure reliable prioritization of traffic classes. The primary objective of this model is to optimize resource allocation for the available capacity
The weight factors
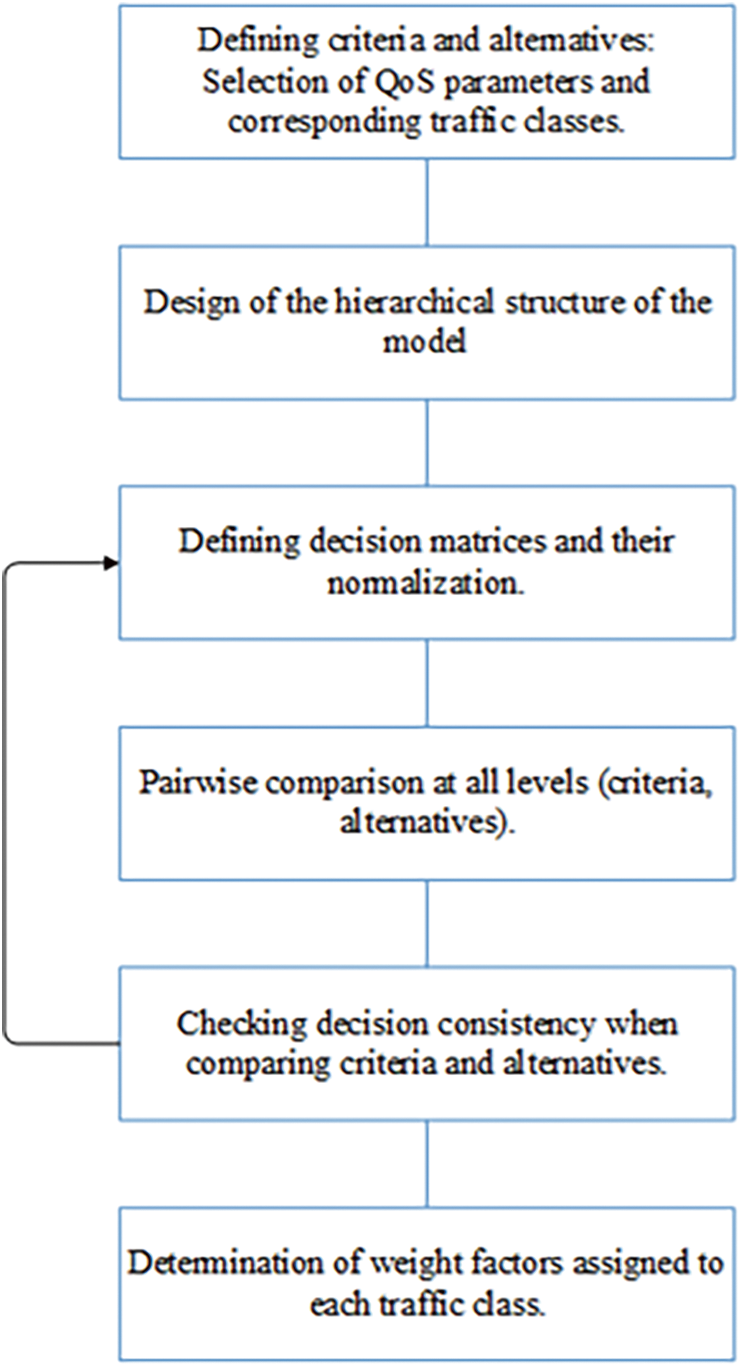
Figure 3: Flowchart for the proposed model
The flowchart in Fig. 3 consists of several phases:
1. Defining three traffic classes (
2. Designing the hierarchical structure with one common goal at the highest level, criteria (delay, losses, jitter) at the next level, and traffic classes at the lowest level.
3. Pairwise comparison matrices for the criteria are constructed to determine their relative importance.
4. Weight calculation for each traffic class, producing priority vectors based on the criteria.
Each of these phases will be elaborated upon in the following sections.
The results obtained from the implementation of the proposed traffic differentiation model in WSNs are presented. Performance metrics, including delay, packet loss, and jitter, are evaluated to demonstrate the effectiveness of the model. Additionally, a comparative analysis of these metrics across different traffic classes is provided to highlight the model’s ability to prioritize and manage network traffic efficiently using the AHP method.
4.1 Defining Criteria and Alternatives
In the first phase of solving the optimization problem, we consider a queuing system in which three traffic classes, denoted as
4.2 Design of Hierarchical Structure
When creating the hierarchical structure (Fig. 4), factors with relevant details and their contributions to the solution are considered. Given that a set of goals, criteria, and alternatives has been defined for the model in the previous phase, the hierarchical representation of the problem will serve as a comprehensive overview of complex relationships, aiding in the decision-making process.
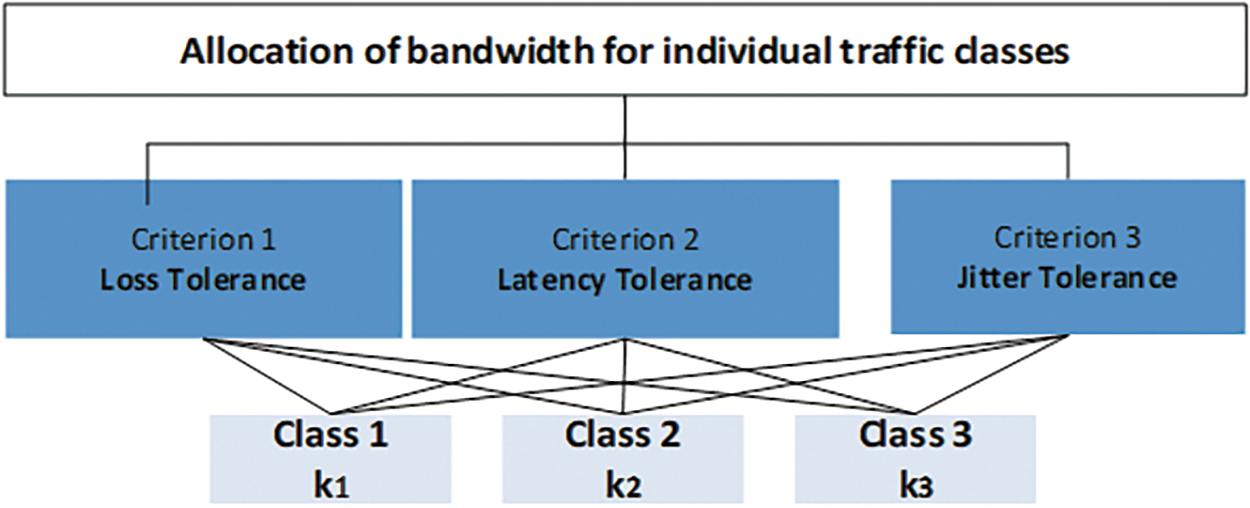
Figure 4: Hierarchical decision-making model at all levels
This hierarchical structure is further divided into sub-hierarchies, with only one common element at the highest level: the goal. The next level is characterized by setting criteria, i.e., quality parameters related to tolerance for delay, loss, and jitter. The task of prioritization involves comparing criteria and alternatives in the context of recognizing the influence of elements across hierarchical levels. After assessing the impact of all elements, priorities are determined for the entire hierarchical structure.
A set of pairwise comparison matrices is developed using three criteria, as shown in Table 3. All higher-level elements (criteria-QoS parameters) are compared with each other when creating the decision matrix. Lower-level elements (alternatives-traffic classes) are compared with elements at the higher level, thereby creating pairwise comparison matrices. The “1–9 scale” [45] is used for these comparisons, indicating the importance or dominance of one element over another in the context of the criteria or alternatives being compared.
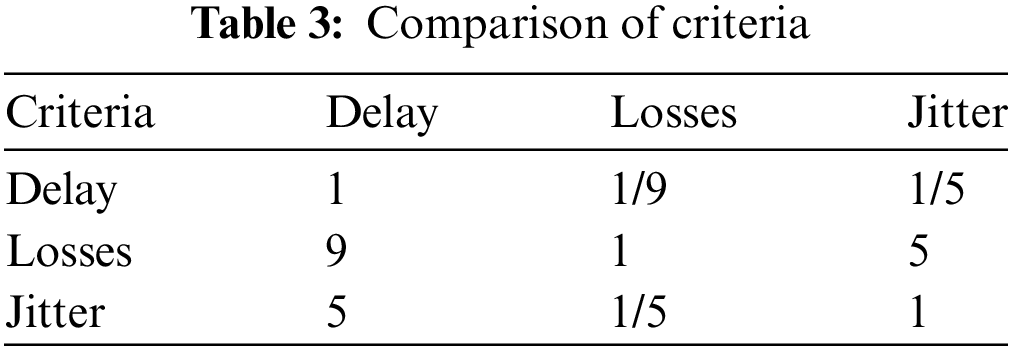
The comparison indicates the importance or dominance of one element over another with respect to the criterion type.
After the pairing process, a number from the scale is entered into the decision matrix, indicating the appropriate assessment. For example, entering the number 9 in the position (losses, delay) means that losses are 9 times more important than delay. Conversely, the value 1/9 is displayed in the position (delay, losses). The decision matrix
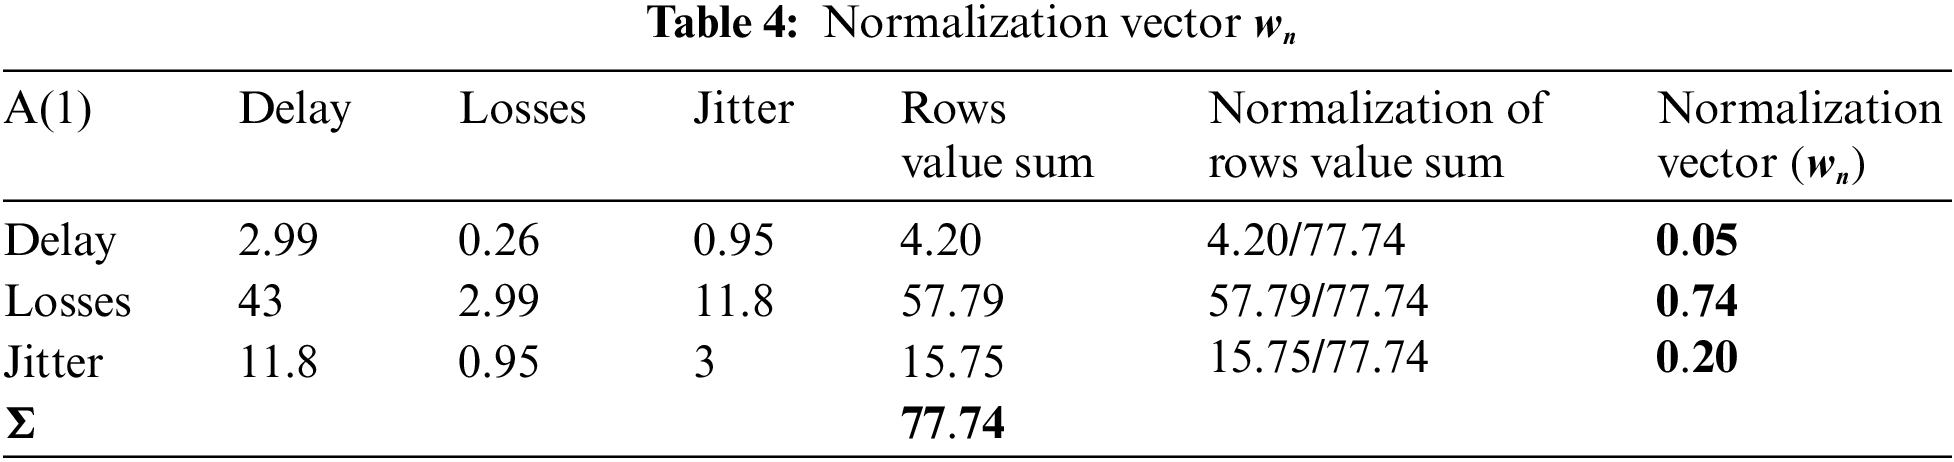
Multiplying
Normalization is carried out to achieve uniformity and enable the comparison of data. Based on the determined values of the priority vector (normalization) (see Table 4), it is observed that the most important criterion is the criterion of losses.
4.3.1 Comparison of Alternatives
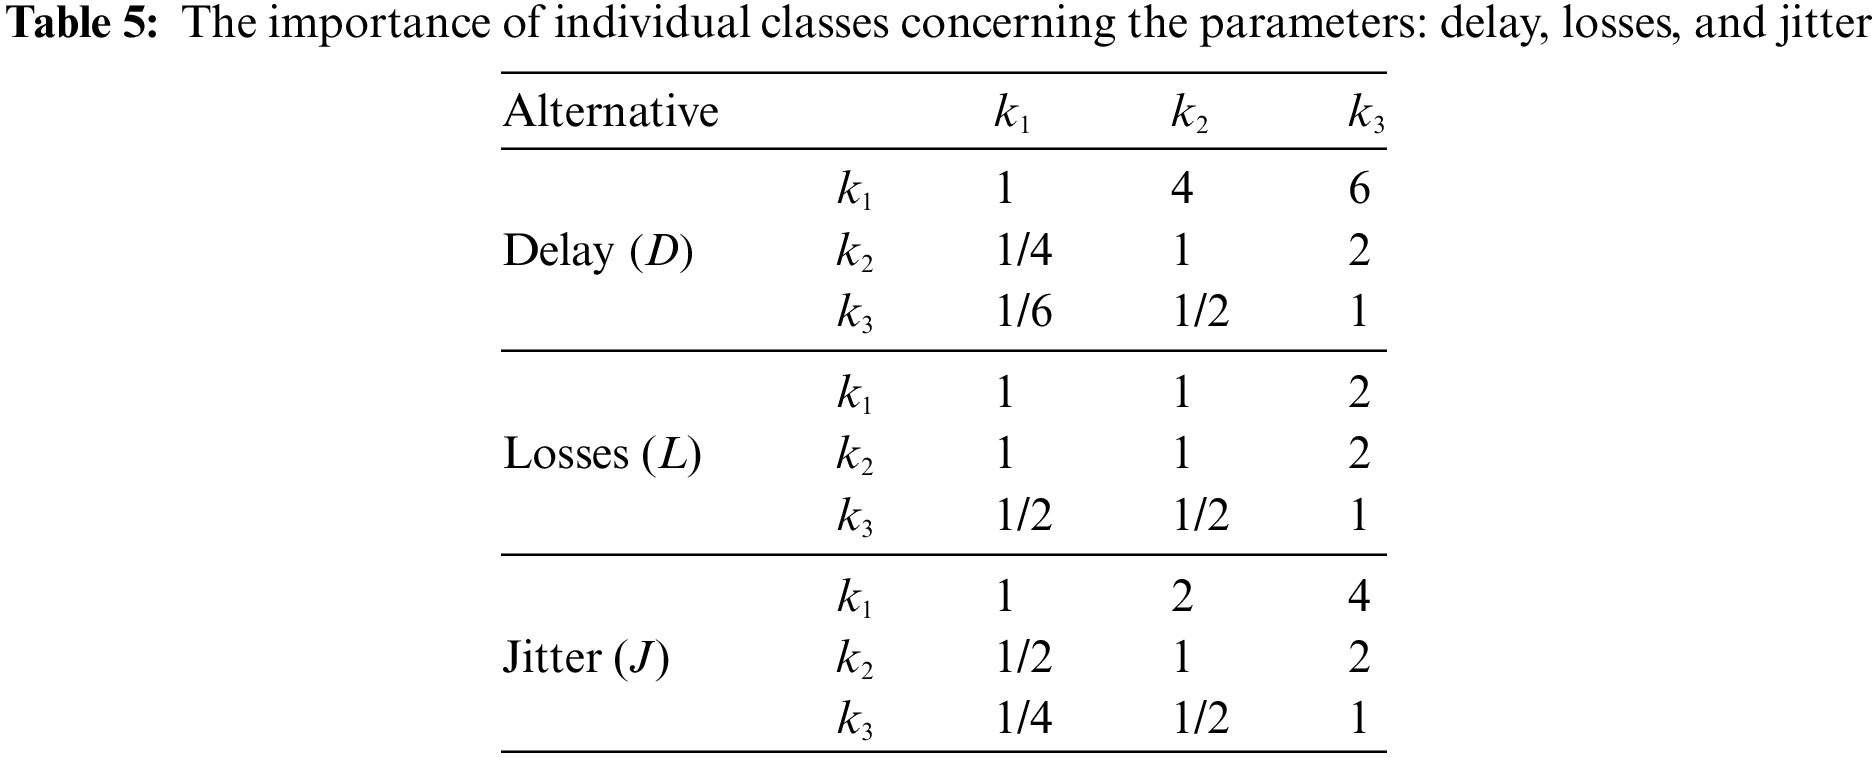
Considering the process of determining the priority vectors for individual criteria (delay, losses, and jitter), the next step is to determine the priority vector for alternatives, namely, traffic classes
I. Criterion Delay: Traffic classes
II. Criterion Losses: Traffic classes
III. Criterion Jitter: Traffic classes
Table 5 represents the ratios of assigned importance to individual classes concerning the criteria: delay, losses, and jitter. As we compare the criteria, we will also compare the alternatives and derive the priority vectors for different traffic classes. Considering that we have three criteria (
The fundamental decision matrix

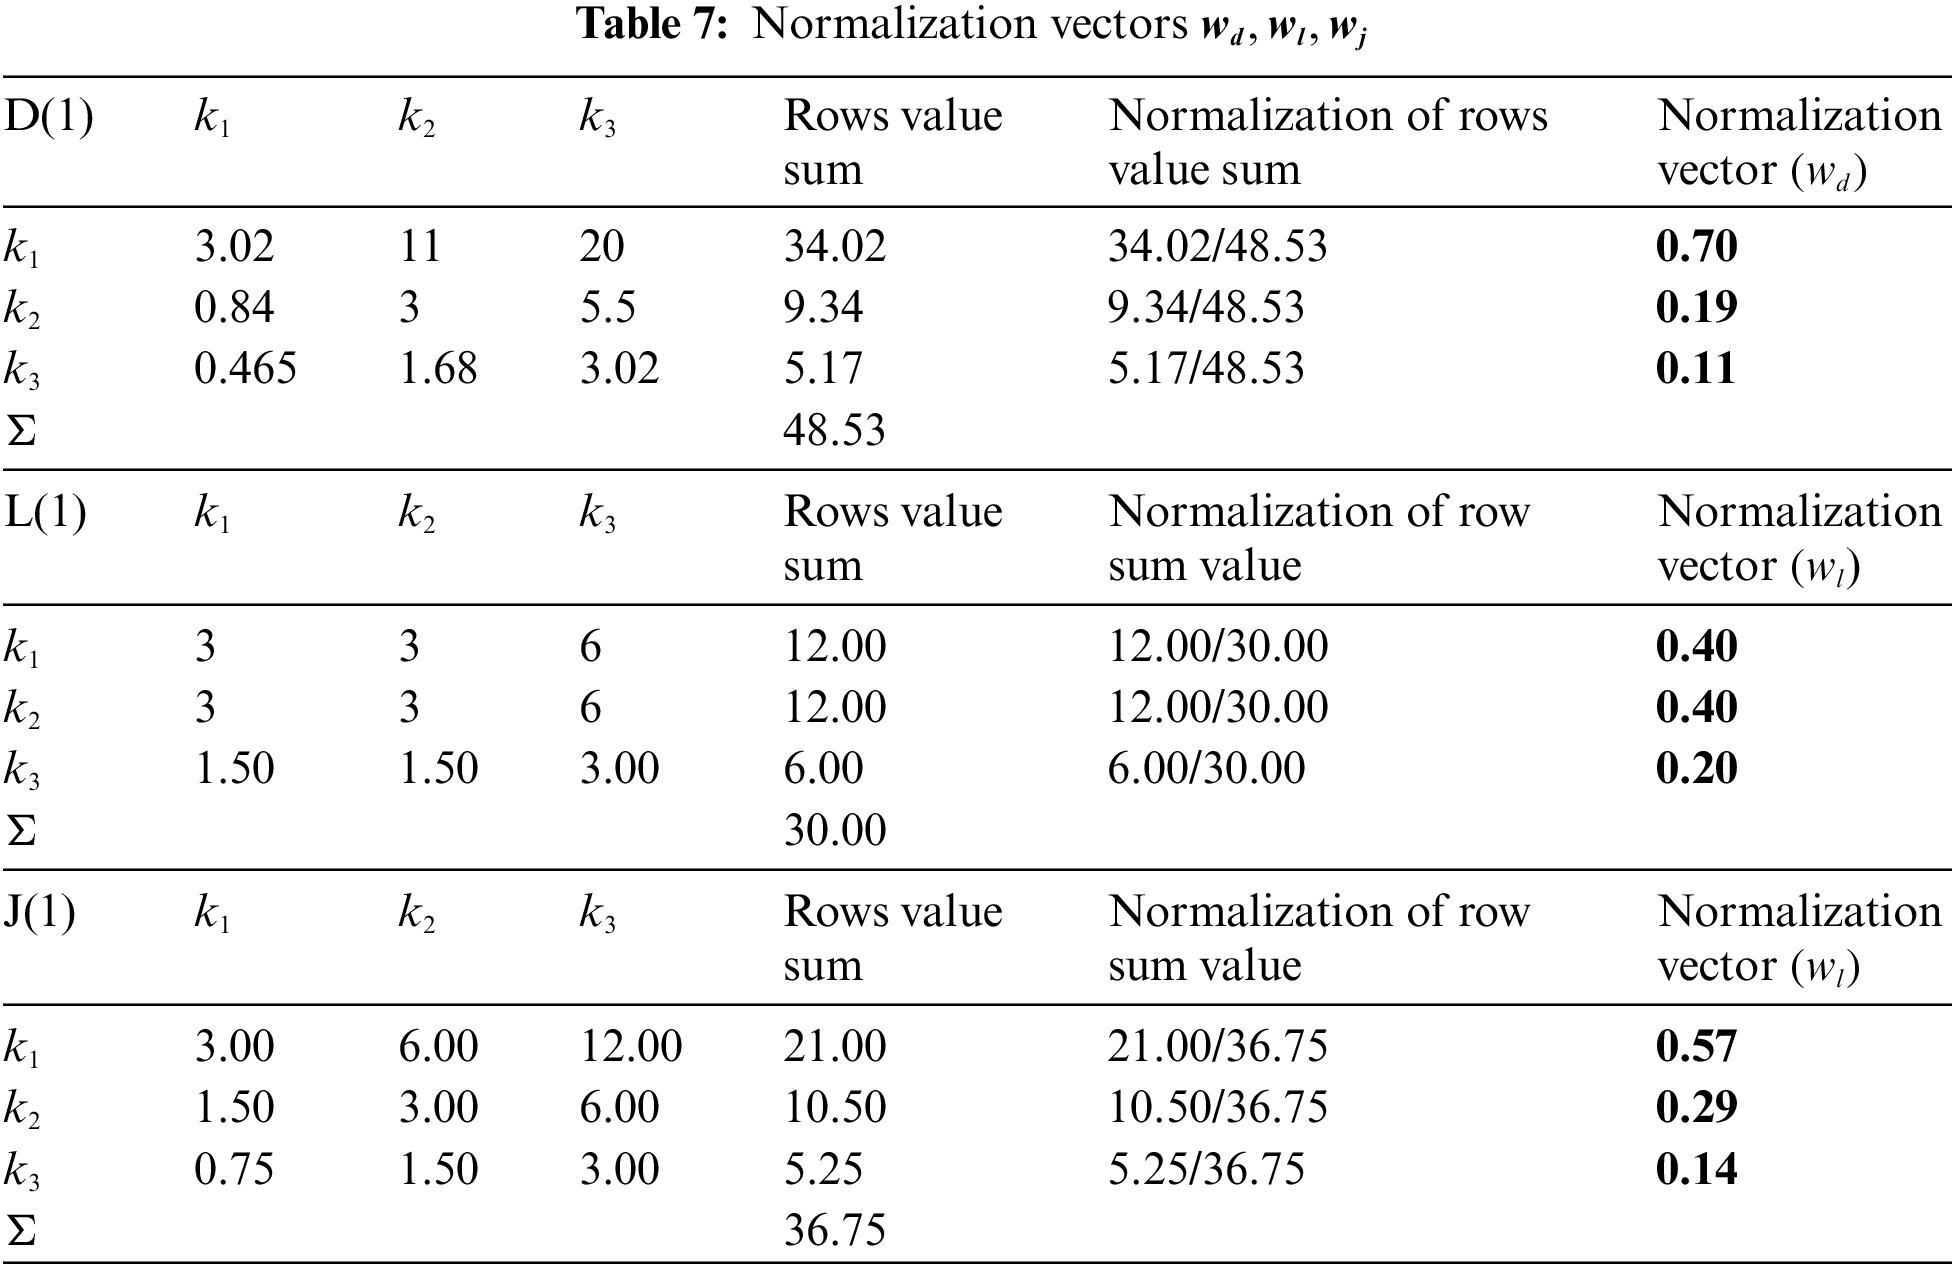
Normalization vectors obtained by above mentioned criteria
4.4 Determining the Goal Priority Vector
In the optimization process, determining goal priorities occurs in the step before the last. In the previous matrices, local priorities, i.e., the priority vectors for criteria and alternatives, have been determined (Table 7). Each column of the priority vector for an individual alternative concerning the selected criterion is multiplied by the corresponding row where the priority of each criterion is defined, resulting in the goal priority vector shown in Eq. (5).
The goal priority vector is determined as the product of the values of the criterion priority vector and the alternative priority vector. This vector ultimately provides the optimization solution for the given goal, as well as the defined criteria and alternatives. The best alternative (the traffic class with the highest priority) under the specified conditions is the one with the highest value in the goal priority vector. Table 8 provides an overview of the priority vector for individual classes concerning the criteria.

Eq. (5) represents the combination of priority vectors for individual classes based on the defined criteria (delay, loss, and jitter). The first matrix in this equation contains the normalized vectors
The highest importance in the comparison of criteria is assigned to the criterion of losses in the mutual comparison of individual criteria, as shown by vector priority
When developing this model, we consider the process of establishing specific types of connections through an appropriate link with a finite capacity
4.5 Estimation of Decision Consistency
When comparing individual criteria, the consistency of the decision-maker’s assessments is checked to verify the correctness of the obtained weight factor values. The determination of decision consistency is done according to the following expression:
where are:
We calculate the vector of the normalized sum as follows:
The consistency vector:
The principal eigenvalue is:
Furthermore, we determine the Consistency Index
and Consistency Ratio
where
The Consistency Ratio (CR) of the decision-making process is calculated (Eq. (10)) to verify the correctness of the obtained weight factor values for individual criteria and the priorities of alternatives. The results show that the CR for all factors within the matrix is within an acceptable range of values, i.e.,
5.1 Comparative Analysis with Existing Models
A broader comparative analysis between the proposed AHP model and various existing traffic differentiation and QoS models in WSNs is summarized in Table 9.
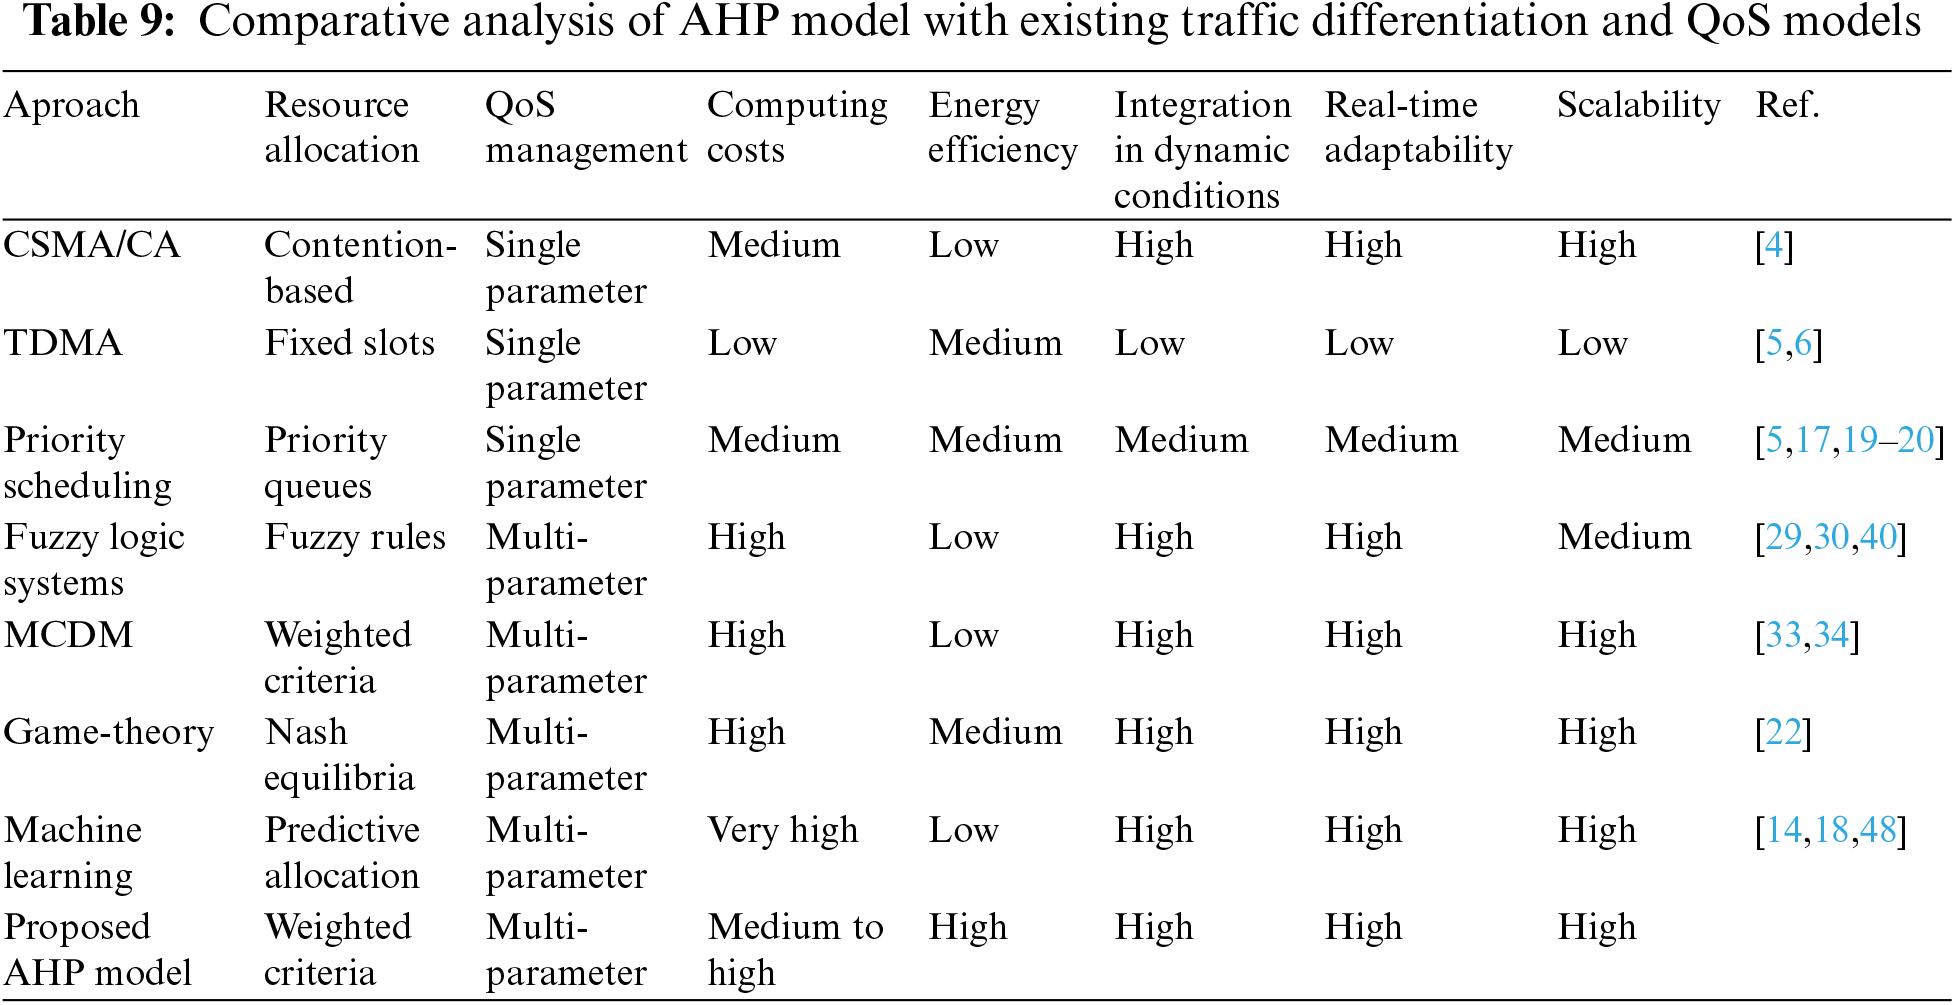
The proposed AHP model offers notable improvements over traditional WSN traffic optimization methods. Unlike TDMA-based methods, which are inefficient under variable traffic conditions due to fixed slot allocations, the AHP model dynamically adjusts to traffic variations, enhancing adaptability. Compared to CSMA/CA-based methods, which manage dynamic traffic well but suffer from energy inefficiency due to collisions, the AHP model ensures both adaptability and energy efficiency. Priority-based scheduling, while effective for different traffic classes, lacks scalability and real-time adaptability. The AHP model overcomes these limitations by integrating multiple criteria for resource allocation, thereby improving both scalability and real-time performance. Fuzzy logic and other MCDM methods offer advanced QoS management but are computationally intensive. In contrast, the AHP model achieves similar QoS improvements with lower computational overhead, optimizing resource use without excessive processing power. Game theory and machine learning models provide strategic and predictive resource allocation but require significant computational resources.
5.2 Energy Consumption Analysis
In this section, we address the complexity inherent in the AHP model and its impact on energy consumption within resource-constrained environments such as WSNs. To analyze the impact of AHP on energy consumption, we consider how different QoS parameters, such as delay, jitter, and packet loss, affect the overall energy usage of WSN nodes.
• Delay: Increased delay results in higher energy consumption because nodes must keep their communication interfaces active for longer periods, leading to faster battery drain.
• Jitter: High jitter leads to more frequent retransmissions or buffering, which consumes additional energy for packet processing and reordering.
• Packet Loss: Packet loss necessitates retransmissions, directly increasing energy usage and further straining the limited energy resources of WSN nodes.
The energy consumption analysis in this study was conducted using a formula that aligns with the energy consumption model proposed in [48]. Specifically, the model calculates the energy consumption (Eqs. (11) and (12)) of each network node by considering key QoS parameters (delay, jitter, and packet loss) and their respective impacts on power usage. The formula used is:
where:
-
-
-
-
-
-
The primary objective of the experimental analysis was to evaluate the performance of the proposed AHP traffic differentiation model against existing models, specifically Weighted Fair Queuing (WFQ) and First-In-First-Out (FIFO). The analysis focused on key QoS metrics—delay, packet loss, and jitter—across different traffic classes in WSNs. By simulating these scenarios, the study aimed to validate the efficacy of the AHP model in optimizing traffic management and enhancing energy efficiency under various network conditions.
5.3.1 Simulation Environment and Setup
To systematically assess the performance of the AHP model, the simulation was conducted using MATLAB, a tool for network analysis and simulation. The simulation environment is configured as detailed in Table 10.
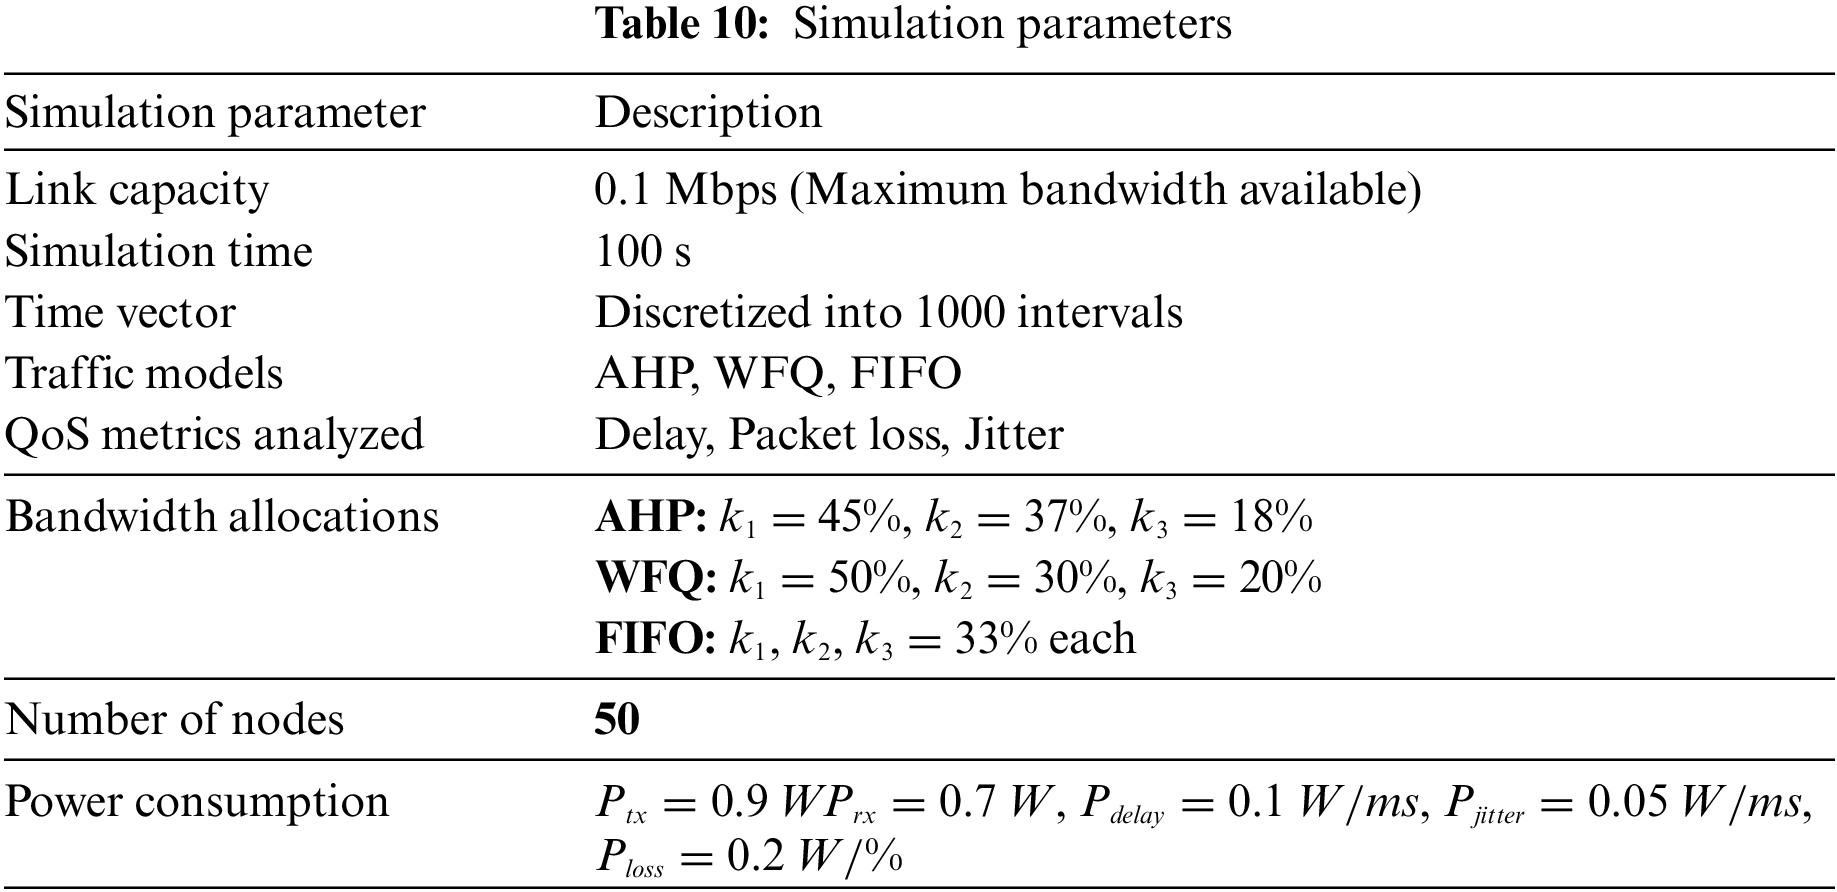
The model assumes a static network with uniform traffic distribution. Power consumption parameters are derived from typical values observed in WSNs. This model was applied across all traffic classes and scheduling methods (AHP, FIFO, and WFQ), enabling a comparative analysis of different QoS parameters. Random variations were introduced to reflect real-world network conditions, allowing for a realistic assessment of each model’s performance.
5.3.2 Quantitative Results and Analysis
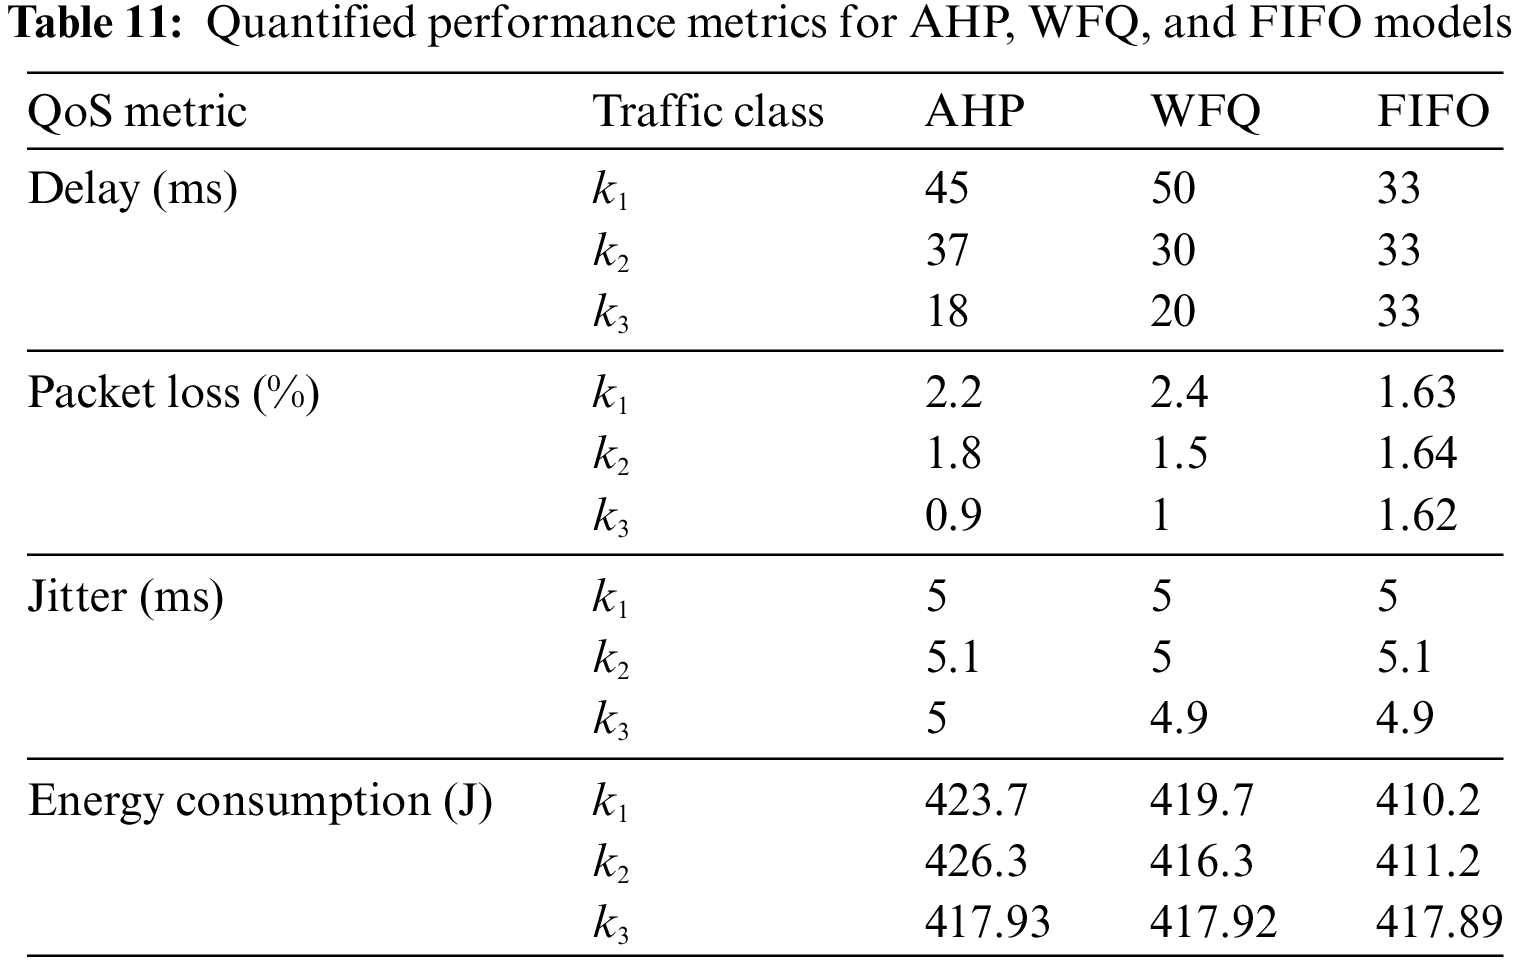
The performance of each traffic differentiation model was evaluated based on the average delay, packet loss, and jitter observed across the different traffic classes. The results are summarized in Table 11 below.
The following figures (Figs. 5–8) illustrate the comparison of delay, packet loss, jitter, and energy consumption among three different scheduling algorithms (AHP, WFQ, FIFO) across three traffic classes
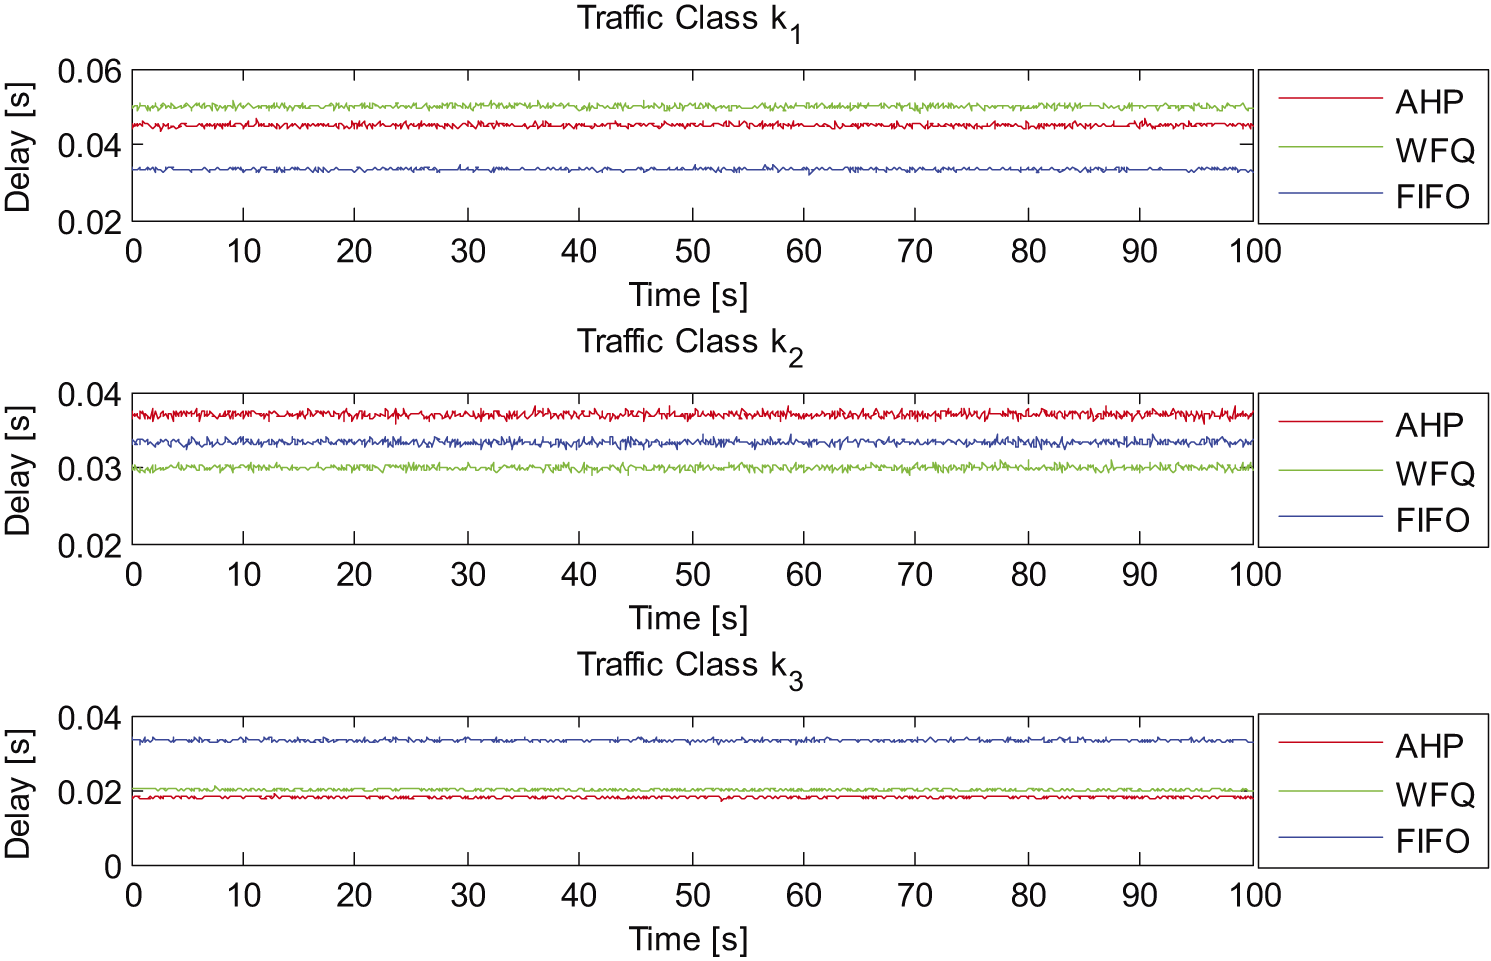
Figure 5: Delay comparison for three scheduling algorithms (AHP, WFQ, FIFO) across traffic classes
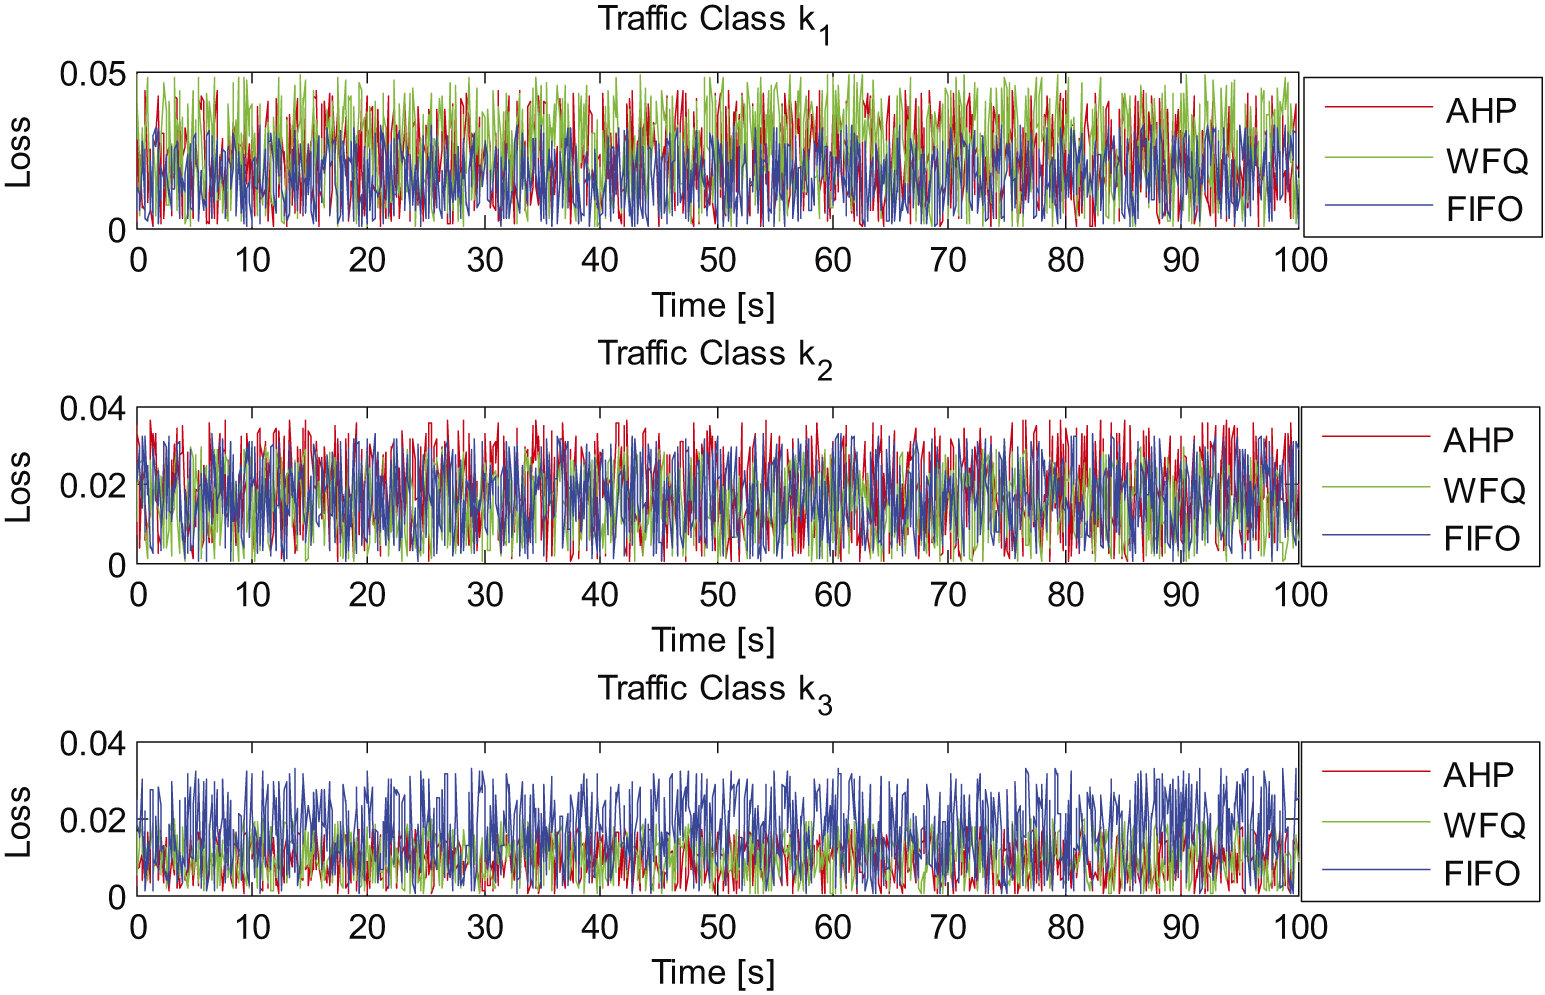
Figure 6: Packet loss comparison for three scheduling algorithms (AHP, WFQ, FIFO) across traffic class
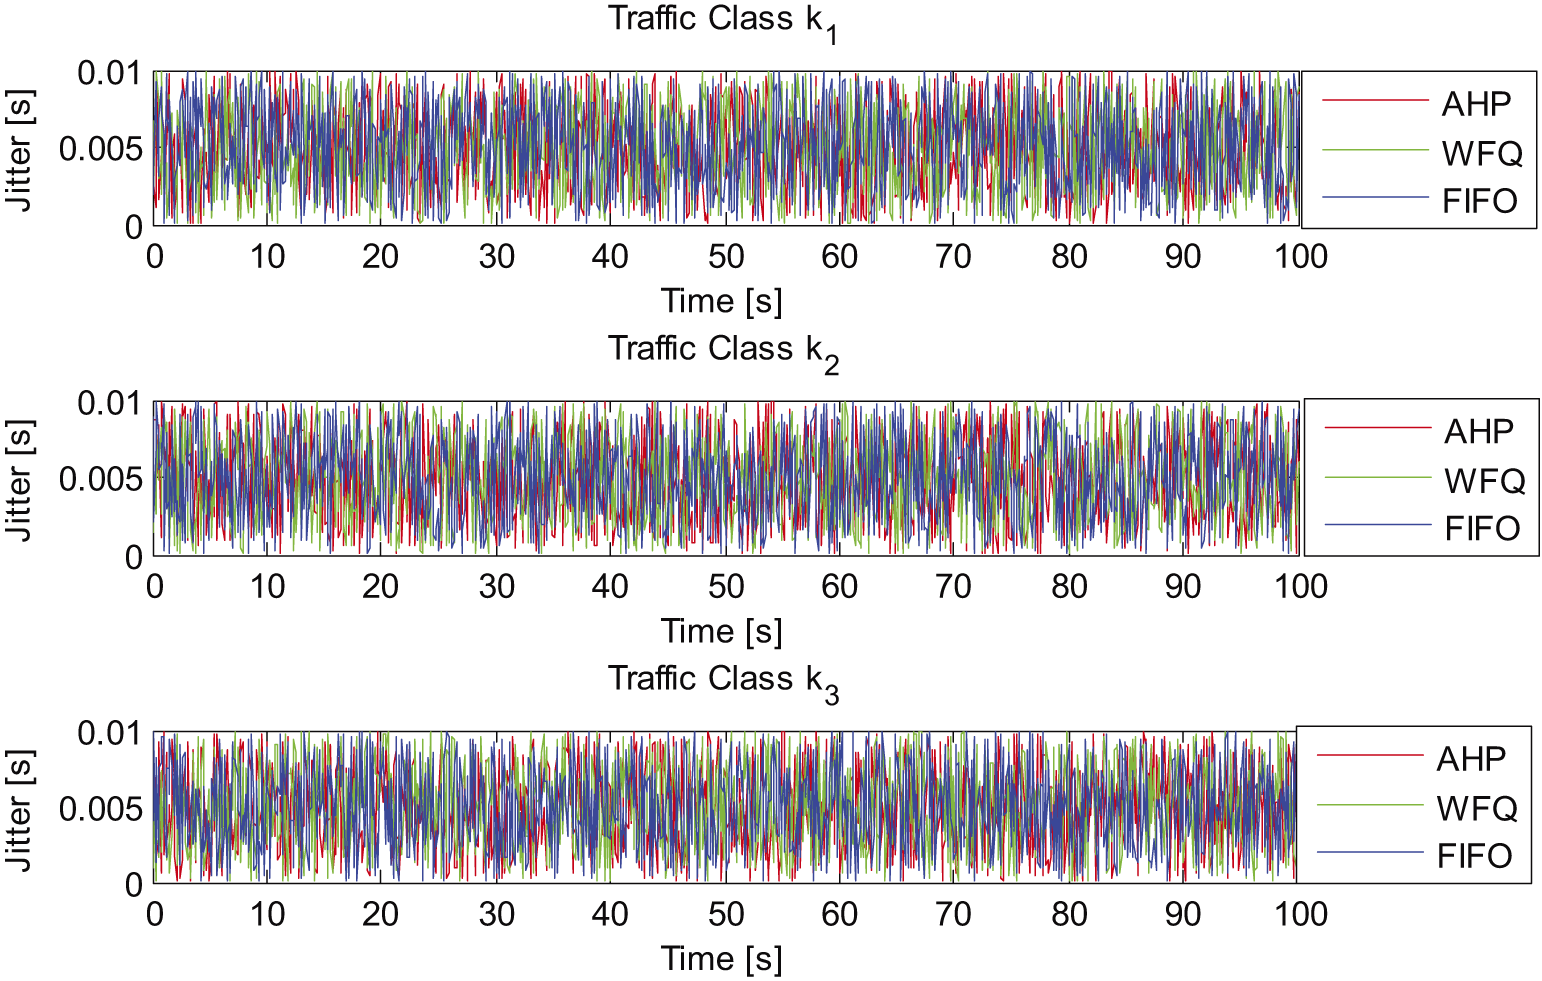
Figure 7: Jitter comparison for three scheduling algorithms (AHP, WFQ, FIFO) across traffic classes

Figure 8: Energy consumption comparison for three scheduling algorithms (AHP, WFQ, FIFO)
In the comparative analysis of traffic differentiation models in WSNs, the AHP model exhibits varied performance across different traffic classes. Specifically, the average delay is low for
When analyzing the performance of AHP, WFQ, and FIFO QoS models across parameters such as delay, packet loss, jitter, and energy consumption, each model has its strengths and weaknesses.
– Delay: AHP provides the best performance and lowest delay for high-priority traffic (
– Packet Loss: AHP excels in reducing packet loss, particularly for lower-priority traffic (
– Jitter: All models (AHP, WFQ, and FIFO) are effective in maintaining stable and predictable data transmission, with jitter consistently low across all three models. This stability is important for applications that rely on smooth and continuous data flow, such as audio or video streaming.
– Energy Consumption: FIFO stands out in terms of energy efficiency. Unlike AHP and WFQ, FIFO treats all traffic equally, which reduces the computational complexity involved in prioritizing packets. As a result, it consumes less energy, making it the best choice for environments where conserving battery life is crucial.
AHP’s ability to prioritize traffic effectively makes it the best overall model for managing delay and packet loss, especially in networks where timely and accurate data delivery is crucial. For instance, in critical infrastructure monitoring or emergency response systems, AHP ensures that the most important data is transmitted quickly and reliably. Although AHP consumes more energy than FIFO, the trade-off is justified by its superior performance in reducing delay and packet loss. In scenarios where maintaining high-quality service is more important than energy efficiency, AHP is the optimal choice.
WFQ offers balanced performance across all parameters, making it a good choice for networks that require fair resource allocation among different traffic types, particularly when energy constraints are moderate.
FIFO is ideal when energy efficiency is the top priority. It is best suited for scenarios where the network can tolerate slightly higher delays and packet loss, such as in applications where extending battery life is more critical than optimizing QoS parameters.
The experimental results indicate that the AHP model outperforms the WFQ and FIFO models, particularly in managing delay and packet loss for high-priority traffic classes. The AHP model exhibits:
– Lower delay: Especially for higher-priority traffic (
– Reduced packet loss: Particularly in critical traffic scenarios, demonstrating better congestion management.
– Consistent jitter: The AHP model maintains low jitter levels, which is crucial for time-sensitive data transmissions.
– Moderate energy consumption: While AHP consumes more energy compared to FIFO, this trade-off is justified by its superior performance in reducing delay and packet loss. For applications where service quality is more critical than energy efficiency, AHP represents the optimal choice.
Despite its advantages, the AHP model presents certain limitations:
– Complexity: The AHP model involves matrix operations and multi-criteria decision-making, which generally leads to higher computational complexity. This complexity increases with the number of criteria and alternatives, potentially resulting in longer processing times.
– Energy Constraints: Higher computational complexity can lead to increased energy consumption due to more intensive processing at the nodes. However, the optimized resource allocation might offset this by reducing the need for retransmissions and improving overall efficiency.
– Adaptability: While highly adaptable, further optimizations are needed to enhance performance across diverse network types and conditions.
– Simplified Simulation Conditions: The simulation assumes fixed link capacity and static traffic patterns, which may not accurately reflect real-world network conditions with varying loads and dynamic environments.
– Static Model Assumptions: Bandwidth allocations for AHP, WFQ, and FIFO models are static and do not adapt to changing network conditions, limiting their applicability to more complex, real-world scenarios.
– Numerical Precision and Generalizability: Results may be affected by numerical rounding errors and may not be directly generalizable to other network types or larger systems due to the simplified assumptions and focus on basic performance metrics.
Future work will focus on refining the AHP model to reduce computational overhead, improve energy management, and broaden its adaptability for a wider range of WSN applications. Special attention will be given to optimizing energy usage to ensure that the model remains effective in energy-constrained environments, such as remote or battery-powered sensor networks.
6 Conclusion and Future Research Direction
In this study, we developed a model for classifying and managing heterogeneous traffic in Wireless Sensor Networks (WSNs) using the Analytical Hierarchy Process (AHP). The model effectively categorizes traffic into three classes (
The proposed AHP model demonstrates several advantages over traditional methods, such as TDMA, CSMA/CA, and priority-based scheduling. It offers dynamic adaptability to traffic variations, improves energy efficiency, and supports real-time adaptability. Additionally, the model’s scalability and low computational overhead make it suitable for resource-constrained environments like WSNs.
The study also includes experimental results that validate the effectiveness of the proposed model under various network conditions. However, certain limitations were noted, including the need for further optimization to reduce computational complexity and energy consumption in highly dynamic network conditions. Future research could explore integrating the AHP model with machine learning and game theory approaches to enhance resource prediction and QoS management.
Overall, the AHP model provides a robust solution for traffic differentiation in WSNs, optimizing the use of available resources while maintaining the desired QoS levels. Future work should focus on refining the model for diverse network scenarios and minimizing its computational requirements to better support real-world applications. Further exploration could focus on modifying different QoS parameters within the AHP model and observing the effects on overall network performance and resource allocation efficiency. Implementing adaptive techniques that reduce the frequency of AHP calculations during periods of low network activity can conserve energy. For example, AHP could be invoked only during peak traffic periods, while simpler models like FIFO or WFQ are used otherwise. Limiting AHP calculations to critical decision-making processes while relying on less energy-intensive methods for routine operations can also help manage energy consumption more effectively.
This model can be applied in smart traffic management systems, where it prioritizes real-time data such as traffic flow, congestion alerts, and emergency vehicle routes. By efficiently managing and transmitting this critical information, the model helps optimize traffic flow, reduce congestion, and improve overall transportation efficiency in smart cities. Additionally, the AHP model can be applied in various other domains, such as environmental monitoring, smart agriculture, and healthcare systems. This model prioritizes critical data, and its particular value is in scenarios requiring rapid response to real-time data.
The results of this study can also serve as input data for developing analytical models for WSNs, which can be used in future research to analyze QoS performance metrics.
Acknowledgement: I would like to express my gratitude to all those who contributed to the completion of this research. I appreciate the support and resources provided by my institution, which greatly facilitated the research process. Special thanks to my colleagues for their valuable feedback and encouragement throughout the study.
Funding Statement: The authors received no specific funding for this study.
Author Contributions: The authors confirm their contribution to the paper as follows: Study conception and design: Adisa Hasković Džubur, Samir Čaušević, Belma Memić, Alem Čolaković; data collection: Elma Avdagić-Golub, Muhamed Begović; analysis and interpretation of results: Adisa Hasković Džubur, Samir Čaušević, Belma Memić; draft manuscript preparation: Adisa Hasković Džubur, Muhamed Begović, Elma Avdagić-Golub; supervision: Alem Čolaković. All authors reviewed the results and approved the final version of the manuscript.
Availability of Data and Materials: The datasets generated during and/or analyzed during the current study are available from the corresponding author upon reasonable request.
Ethics Approval: Not applicable.
Conflicts of Interest: The authors declare that they have no conflicts of interest to report regarding the present study.
References
1. L. Xu, R. Collier, and G. M. P. O’Hare, “A survey of clustering techniques in WSNs and consideration of the challenges of applying such to 5G IoT scenarios,” IEEE Internet Things J., vol. 4, no. 5, pp. 1229–1249, 2017. doi: 10.1109/JIOT.2017.2726014. [Google Scholar] [CrossRef]
2. Y. Sun, F. Tong, Z. Zhang, and S. He, “Throughput modeling and analysis of random access in narrowband internet of things,” IEEE Internet Things J., vol. 5, no. 3, pp. 1485–1493, 2018. doi: 10.1109/JIOT.2017.2782318. [Google Scholar] [CrossRef]
3. I. Zakariyya, “Bandwidth guarantee using class based weighted fair queue (CBWFQ) scheduling algorithm,” Int. J. Digit. Info. Wirel. Commun., vol. 5, no. 3, pp. 152–157, 2015. doi: 10.17781/P001675. [Google Scholar] [CrossRef]
4. B. Nefzi and Y. Q. Song, “QoS for wireless sensor networks: Enabling service differentiation at the MAC sub-layer using CoSenS,” Ad Hoc Netw., vol. 10, no. 4, pp. 680–695, 2012. doi: 10.1016/j.adhoc.2011.06.009. [Google Scholar] [CrossRef]
5. F. Safaei, “A simple priority-based scheme for delay-sensitive data transmission over wireless sensor networks,” Int. J. Wirel. Mobile Netw., vol. 4, no. 1, pp. 165–181, 2012. doi: 10.5121/ijwmn.2012.4112. [Google Scholar] [CrossRef]
6. E. Felemban, C. G. Lee, E. Ekici, R. Boder, and S. Vural, “Probabilistic QoS guarantee in reliability and timeliness domains in wireless sensor networks,” presented at the IEEE 24th Annu. Joint Conf. IEEE Comput. Commun. Soc., Miami, FL, USA, Mar. 13–17, 2005, vol. 4, pp. 2646–2657. [Google Scholar]
7. D. Chen and P. K. Varshney, “QoS support in wireless sensor networks: A survey,” presented at the Int. Conf. Wirel. Netw., Nevada, Las Vegas, NV, USA, Jun. 21–24, 2004. [Google Scholar]
8. H. Liu, A. Srinivasan, K. Whitehouse, and J. A. Stankovic, “Mlange: Supporting heterogeneous QoS requirements in delay tolerant sensor networks,” presented at the INSS 2010—Seventh Int. Conf. Netw. Sens. Syst., Kassel, Germany, Jun. 15–18, 2010, pp. 93–96. [Google Scholar]
9. E. Felemban, C. G. Lee, and E. Ekici, “MMSPEED: Multipath multi-SPEED protocol for QoS guarantee of reliability and timeliness in wireless sensor networks,” IEEE Trans. Mob. Comput., vol. 5, no. 6, pp. 738–754, 2006. doi: 10.1109/TMC.2006.79. [Google Scholar] [CrossRef]
10. P. McDonald, D. Geraghty, I. Humphreys, S. Farrell, and V. Cahill, “Sensor network with delay tolerance (SeNDT),” presented at the 2007 16th Int. Conf. Comput. Commun. Netw., Honolulu, HI, USA, Aug. 13–16, 2007, pp. 1333–1338. [Google Scholar]
11. B. Hull et al., “CarTel: A distributed mobile sensor computing system,” in Proc. 4th Int. Conf. Embedded Netw. Sensor Syst., Boulder, Co, USA, Oct. 31–Nov. 3, 2006, pp. 125–138. [Google Scholar]
12. A. Vahdat and D. Becker, “Epidemic routing for partially-connected ad hoc networks,” in Handbook of Systemic Autoimmune Diseases, Technical Report No. CS-2000-06, Durham, UK: Duke University; 2000. doi: 10.1145/2756509.275652. [Google Scholar] [CrossRef]
13. M. R. Nikseresht and M. Mollamotalebi, “Providing a CoAP-based technique to get wireless sensor data via IoT gateway,” Comput. Commun., vol. 172, pp. 155–168, Mar. 2020. doi: 10.1016/j.comcom.2021.03.026. [Google Scholar] [CrossRef]
14. G. S. Kori and M. S. Kakkasageri, “Classification And Regression Tree (CART) based resource allocation scheme for wireless sensor networks,” Comput. Commun., vol. 197, pp. 242–254, 2023. doi: 10.1016/j.comcom.2022.11.003. [Google Scholar] [CrossRef]
15. M. Pundir, J. K. Sandhu, and A. Kumar, “Quality-of-service prediction techniques for wireless sensor networks,” J. Phys.: Conf. Series, vol. 1950, no. 1, 2021, Art. no. 012082. [Google Scholar]
16. S. Ezdiani, S. Nor, and A. Al-anbuky, “Modelling the integrated QoS for wireless sensor networks with heterogeneous data traffic,” Open J. Internet Things, vol. 1, no. 1, pp. 1–15, 2015. [Google Scholar]
17. M. K. Giluka, T. V. Pasca, T. Priyadarshi, and B. R. Tamma, “Enhanced class based dynamic priority scheduling to support uplink IoT traffic in LTE-A networks,” J. Netw. Comput. Appl., vol. 107, pp. 93–112, 2018. doi: 10.1016/j.jnca.2018.01.010. [Google Scholar] [CrossRef]
18. P. S. Dester, F. C. S. Helder Dos Filho, and P. Cardieri, “Performance analysis of uplink traffic for machine type communication in wireless sensor networks,” presented at the IEEE Conf. Veh. Technol., Porto, Portugal, Jun. 3–6, 2018, pp. 1–5. [Google Scholar]
19. T. Samal and M. R. Kabat, “A prioritized traffic scheduling with load balancing in wireless body area networks,” J. King Saud Univ. Comput. Inf. Sci., vol. 34, no. 8, pp. 5448–5455, 2022. doi: 10.1016/j.jksuci.2020.12.023. [Google Scholar] [CrossRef]
20. Y. Sun and L. Liu, “Traffic scheduling based on queue model with priority for audio/video sensor networks,” presented at the 2nd Int. Conf. Pervasive Comput. Appl., Birmingham, UK, Jul. 6–27, 2007. [Google Scholar]
21. Q. Wang, “Traffic analysis & modeling in wireless sensor networks and their applications on network optimization and anomaly detection,” Netw. Protoc. Alg., vol. 2, no. 1, 2010. doi: 10.5296/npa.v2i1.328. [Google Scholar] [CrossRef]
22. F. Shang, X. Niu, D. He, H. Gong, and X. Luo, “Resource allocation and admission control algorithm based on non-cooperation game in wireless mesh networks,” Comput. Commun., vol. 152, no. 4, pp. 63–71, Feb. 2020. doi: 10.1016/j.comcom.2020.01.009. [Google Scholar] [CrossRef]
23. T. Mazhar et al., “Quality of Service (QoS) performance analysis in a traffic engineering model for next-generation wireless sensor networks,” Symmetry, vol. 15, no. 2, 2023. doi: 10.3390/sym15020513. [Google Scholar] [CrossRef]
24. L. Wu, J. Riihijarvi, and P. Mahonen, “A modular wireless sensor network gateway design,” in 2007 Second Int. Conf. Commun. Netw. China, Shanghai, China, 2007, pp. 882–886. [Google Scholar]
25. J. Babiarz, K. Chan, and F. Baker, “RFC 4594: Configuration guidelines for DiffServ service classes status,” Aug. 2006. doi: 10.17487/RFC4594. [Google Scholar] [CrossRef]
26. A. Čolaković, A. Hasković Džubur, and B. Karahodža, “Wireless communication technologies for the Internet of Things,” Sci. Eng. Technol., vol. 1, no. 1, pp. 1–14, 2021. doi: 10.54327/set2021/v1.i1.3. [Google Scholar] [CrossRef]
27. M. Pavan and R. Todeschini, “Multi-criteria decision making methods,” Compr. Chemometr., vol. 1, pp. 591–629, 2009. [Google Scholar]
28. C. Macharis, J. Springael, K. De Brucker, and A. Verbeke, “PROMETHEE and AHP: The design of operational synergies in multicriteria analysis—Strengthening PROMETHEE with ideas of AHP,” Eur. J. Oper. Res., vol. 153, no. 2, pp. 307–317, 2004. doi: 10.1016/S0377-2217(03)00153-X. [Google Scholar] [CrossRef]
29. A. Kalem and N. Čabrić, “Hybrid extended fuzzy AHP and fuzzy ARAS methodology for evaluating train organization systems in Bosnia and Herzegovina,” Sci. Eng. Technol., vol. 2, no. 2, pp. 43–55, 2022. doi: 10.54327/set2022/v2.i2.36. [Google Scholar] [CrossRef]
30. L. Sun, J. Ma, Y. Zhang, H. Dong, and F. K. Hussain, “Cloud-FuSeR: Fuzzy ontology and MCDM based cloud service selection,” Future Gener. Comput. Syst., vol. 57, no. 5, pp. 42–55, 2016. doi: 10.1016/j.future.2015.11.025. [Google Scholar] [CrossRef]
31. J. R. Figueira, S. Greco, B. Roy, and R. Słowiński, “An overview of ELECTRE methods and their recent extensions,” J. Multi Criteria Decis. Anal., vol. 20, no. 1–2, pp. 61–85, 2013. doi: 10.1002/mcda.1482. [Google Scholar] [CrossRef]
32. K. Santos, E. Loures, F. Piechnicki, and O. Canciglieri, “Opportunities assessment of product development process in Industry 4.0,” Proc. Manuf., vol. 11, pp. 1358–1365, 2017. doi: 10.1016/j.promfg.2017.07.265. [Google Scholar] [CrossRef]
33. H. Taherdoost and M. Madanchian, “Multi-criteria decision making (MCDM) methods and concepts,” Encyclopedia, vol. 3, no. 1, pp. 77–87, 2023. doi: 10.3390/encyclopedia3010006. [Google Scholar] [CrossRef]
34. W. Serrai, A. Abdelli, L. Mokdad, and Y. Hammal, “Towards an efficient and a more accurate web service selection using MCDM methods,” J. Comput. Sci., vol. 22, pp. 253–267, 2017. doi: 10.1016/j.jocs.2017.05.024. [Google Scholar] [CrossRef]
35. G. Aksüt, T. Eren, and H. M. Alakas, “Using wearable technological devices to improve workplace health and safety: An assessment on a sector base with multi-criteria decision-making methods,” Ain Shams Eng. J., vol. 15, no. 2, Jan. 2024, Art. no. 102423. doi: 10.1016/j.asej.2023.102423. [Google Scholar] [CrossRef]
36. H. Ma, H. Zhu, Z. Hu, K. Li, and W. Tang, “Time-aware trustworthiness ranking prediction for cloud services using interval neutrosophic set and ELECTRE,” Knowledge-Based Syst., vol. 138, pp. 27–45, 2017. doi: 10.1016/j.knosys.2017.09.027. [Google Scholar] [CrossRef]
37. M. Liu, Y. Shao, C. Yu, and J. Yu, “A heterogeneous QoS-based cloud service selection approach using entropy weight and GRA-ELECTRE III,” Math. Probl. Eng., vol. 2020, no. 1, pp. 1–17, 2020. doi: 10.1155/2020/1536872. [Google Scholar] [CrossRef]
38. J. Santhi and K. Prabha, “QOS aware vertical handover process in heterogeneous wireless network,” Meas.: Sens., vol. 26, 2023, Art. no. 100710. doi: 10.1016/j.measen.2023.100710. [Google Scholar] [CrossRef]
39. R. R. Kumar, B. Kumari, and C. Kumar, “CCS-OSSR: A framework based on hybrid MCDM for optimal service selection and ranking of cloud computing services,” Cluster Comput., vol. 24, no. 2, pp. 867–883, 2021. doi: 10.1007/s10586-020-03166-3. [Google Scholar] [CrossRef]
40. R. R. Kumar, M. Shameem, and C. Kumar, “A computational framework for ranking prediction of cloud services under fuzzy environment,” Enterp. Inform. Syst., vol. 16, no. 1, pp. 167–187, 2022. doi: 10.1080/17517575.2021.1889037. [Google Scholar] [CrossRef]
41. S. Khodaparas, A. Benslimane, and S. Yousefi, “A software-defined caching scheme for the Internet of Things,” Comput. Commun., vol. 158, pp. 178–188, 2020. doi: 10.1016/j.comcom.2020.05.002. [Google Scholar] [CrossRef]
42. K. A. Darabkh, W. K. Kassab, and A. F. Khalifeh, “LiM-AHP-G-C: Life time maximizing based on analytical hierarchal process and genetic clustering protocol for the Internet of Things environment,” Comput. Netw., vol. 176, 2020., Art. no. 107257. doi: 10.1016/j.comnet.2020.107257. [Google Scholar] [CrossRef]
43. M. Singh, G. Baranwal, and A. K. Tripathi, “QoS-aware selection of IoT-based service,” Arab. J. Sci. Eng., vol. 45, no. 12, pp. 10033–10050, 2020. doi: 10.1007/s13369-020-04601-8. [Google Scholar] [CrossRef]
44. N. Bilandi, H. K. Verma, and R. Dhir, “Energy-efficient relay node selection scheme for sustainable wireless body area networks,” Sustain. Comput.: Inf. Syst., vol. 30, 2021, Art. no. 100516. doi: 10.1016/j.suscom.2021.100516. [Google Scholar] [CrossRef]
45. T. L. Saaty, “How to make a decision: The analytic hierarchy process,” Eur. J. Oper. Res., vol. 48, no. 1, pp. 9–26, 1990. doi: 10.1016/0377-2217(90)90057-I. [Google Scholar] [CrossRef]
46. M. H. I. Hajar, G. P. N. Hakim, A. Firdausi, and E. Ramadhan, “Comparison in quality of service performance for wireless sensor network routing between fuzzy topsis and SAW algorithm,” J. Informati. J. Pengembang. IT, vol. 6, no. 2, pp. 114–118, 2021. [Google Scholar]
47. M. A. Saad, R. Jaafar, and K. Chellappan, “Variable-length multiobjective social class optimization for trust-aware data gathering in wireless sensor networks,” Sensors, vol. 23, no. 12, 2023, Art. no. 5526. doi: 10.3390/s23125526. [Google Scholar] [PubMed] [CrossRef]
48. J. Kopjak and G. Sebestyen, “Energy consumption model of sensor nodes using merged data collecting methods,” presented at the IEEE 20th Jubilee World Symp. Appl. Mach. Intell. Inf., Poprad, Slovakia, Mar. 2–5, 2022, pp. 27–30. [Google Scholar]
Cite This Article
 Copyright © 2024 The Author(s). Published by Tech Science Press.
This work is licensed under a Creative Commons Attribution 4.0 International License , which permits unrestricted use, distribution, and reproduction in any medium, provided the original work is properly cited.
 Downloads
 Citation Tools