
 Submit a Paper
 Propose a Special lssue
 Open Access
ARTICLE

Data-Driven Decision-Making for Bank Target Marketing Using Supervised Learning Classifiers on Imbalanced Big Data
1 School of Computer Science and Informatics, De Montfort University, Leicester, LE1 9BH, UK
2 Faculty of Computer Science and Information Technology, Universiti Tun Hussein Onn Malaysia, Johor, 86400, Malaysia
* Corresponding Author: Abdulghani Ali Ahmed. Email:
Computers, Materials & Continua 2024, 81(1), 1703-1728. https://doi.org/10.32604/cmc.2024.055192
Received 20 June 2024; Accepted 26 August 2024; Issue published 15 October 2024
 View Full Text
 Download PDF
Abstract
Integrating machine learning and data mining is crucial for processing big data and extracting valuable insights to enhance decision-making. However, imbalanced target variables within big data present technical challenges that hinder the performance of supervised learning classifiers on key evaluation metrics, limiting their overall effectiveness. This study presents a comprehensive review of both common and recently developed Supervised Learning Classifiers (SLCs) and evaluates their performance in data-driven decision-making. The evaluation uses various metrics, with a particular focus on the Harmonic Mean Score (F-1 score) on an imbalanced real-world bank target marketing dataset. The findings indicate that grid-search random forest and random-search random forest excel in Precision and area under the curve, while Extreme Gradient Boosting (XGBoost) outperforms other traditional classifiers in terms of F-1 score. Employing oversampling methods to address the imbalanced data shows significant performance improvement in XGBoost, delivering superior results across all metrics, particularly when using the SMOTE variant known as the BorderlineSMOTE2 technique. The study concludes several key factors for effectively addressing the challenges of supervised learning with imbalanced datasets. These factors include the importance of selecting appropriate datasets for training and testing, choosing the right classifiers, employing effective techniques for processing and handling imbalanced datasets, and identifying suitable metrics for performance evaluation. Additionally, factors also entail the utilisation of effective exploratory data analysis in conjunction with visualisation techniques to yield insights conducive to data-driven decision-making.Keywords
Nomenclature
| AdaBoost | Adaptive Boosting |
| AdaSyn SMOTE | Adaptive Synthetic (variant of SMOTE) |
| BD | Big Data/big data |
| BorderlineSMOTE2 | Variant of SMOTE |
| Class | Classification |
| DT | Decision Tree |
| EDA | Exploratory Data Analysis |
| ENN | Edited Nearest Neighbour |
| F-1 | Performance metric/Harmonic Mean |
| GS-RF | Grid-Search Random Forest |
| LR | Logistic Regression |
| ML | Machine Leaning |
| NN | Neural Network |
| RF | Random Forest |
| ROS | Random Over-Sampling |
| ROC-AUC | Receiver Operating Characteristic-Area Under Curve |
| RS-RF | Random-Search Random Forest |
| RUS | Random Under-Sampling |
| SLC | Supervised Learning Classifiers |
| SLR | Systematic Literature Review |
| SMOTE | Synthetic Minority Oversampling Technique |
| SVM | Support Vector Machine |
| XGBoost | Extreme Gradient Boosting |
| χ | Not Stated |
The integration of big data (BD) [1], machine learning (ML) [2], and data mining (DM) [3] creates a dynamic trio that propels innovation, boosts efficiency, and enhances decision-making in our data-driven world. Leveraging the power of these technologies has transformative effects with extensive impacts across various industries and research fields. BD [1], characterized by its volume, velocity, and variety, provides a vast reservoir for information extraction that has helped to set the stage for transformative technologies. The ability to analyse and utilise complex datasets, which grow exponentially in today’s interconnected world, offers organizations and industries unparalleled opportunities to gain valuable insights, make data-driven decisions, and uncover previously unknown patterns. From predictive analytics to real-time processing, big data analysis has become an essential tool driving innovation and efficiency across various sectors. It also aids in data preparation, business understanding, data modelling, and exploratory analysis to extract hidden insights and identify trends to derive meaningful information. Unearthing the wealth of knowledge within data necessitates the use of data mining technologies to uncover compelling, significant, and reliable patterns. Real-world big data can be categorised as structured, unstructured, semi-structured, and imbalanced. The significance of majority and minority classes in an imbalanced dataset depends on the research problem.
DM [3] offers a range of innovative technologies that reveal previously hidden patterns, opening new avenues for innovation and the formulation of novel theories. This has a transformative impact on theoretical development across various fields. By extracting valuable insights from vast datasets, data mining enhances understanding of customer behaviours, optimises business processes, and supports strategic planning. As a crucial component of the data analytics toolkit, data mining extracts actionable intelligence from the immense information generated in our digital world. With the availability of big data, machine learning provides an essential enhanced processing platform for data mining, exploratory analysis, and building models to address related problems.
As a subfield of artificial intelligence (AI), ML [4] enhances big data and data mining paradigms by providing the necessary algorithms and models for predictive, descriptive, and prescriptive analytics of vast and complex datasets, including imbalanced data. Through iterative learning from data, machines can improve their performance and make decisions without explicit programming. This adaptability empowers ML approaches to manage diverse tasks, from image recognition and natural language processing (NLP) to recommendation systems and autonomous vehicles. The interconnections between big data, data mining, and ML represent a transformative force, unlocking the true potential of data-driven technologies. Moreover, ML aids in outcome prediction and encompasses three types of learning: ‘supervised’, ‘unsupervised’, and ‘reinforcement learning’ [2]. Classification [4] refers to the process of predicting the target class categories by classifying the input variables. Classification lies in supervised learning that requires labelled data to train an algorithm. Classification has applications in several domains, such as medical diagnosis, spam detection, credit approval, target marketing, and sales forecasting.
Businesses gravitate towards decision-making based on historical data [5]. Given that corporations emphasizing data-driven strategies regard their data as valuable corporate assets, they proactively explore avenues to utilise it for a competitive advantage over their competitors. During the epoch of big data and ML, major corporations in different fields, such as manufacturing, information technology, marketing, logistics, finance, banking, and online sales sectors are increasingly turning toward statistically informed analytics as the way forward. Their focus is on understanding and defining consumer behaviour to increase returns on investment (ROI) [5]. Target marketing is fundamentally important in the banking sector, as it acts as a strategic channel for personalized communication with clients [6]. At the same time, target marketing and customer forecasting are important aspects of business success and require a real dataset. Real-world data could have any form and may even have imbalanced target variables [7,8].
Banks need data to understand customer forecasting, predicting, and buying behaviour for target marketing. Prior to extending loans or other credit products, bank management would predict that a loan would either be paid back or defaulted. Another scenario whether customer might be interested in new product during a marketing campaign. In this case, there are two possible outcomes for the target variable (“yes” or “no”). The bank can use ML algorithms and techniques to identify the category by training on some historical data to predict or forecast the next outcome [9]. In addition to that, there could be multiple scenarios for marketing campaigns that need prediction based on skewed or imbalanced historic datasets of customers or previous marketing campaigns. Furthermore, data analysis results and supervised learning algorithms enable executives to target different segments to pitch new products or offer an extended loan. However, the restricted availability of real-world datasets and the presence of imbalanced target variables for classification accentuate research deficiencies [10,11].
Classification of imbalanced market-based datasets relies on determining the significance of either the majority or the minority class. An imbalanced dataset exhibits a pronounced skewness in class distribution, with two or more classes containing fewer instances compared to others. Within the realm of automated machine learning, this disproportion presents hurdles during model training and evaluation, possibly leading to biased predictions and reduced effectiveness on minority classes. Although there is no standard definition to distinguish between imbalanced and balanced datasets, a general rule of thumb states that if the class distribution is 50:50, it is a balanced dataset. If it is 51:49, it is termed an imbalanced dataset. For the imbalanced dataset, the majority class and minority class, or sometimes minority classes, are categorised based on specific thresholds. Less than 25% is categorised as moderate imbalance, less than 15% as highly imbalanced, equal to or less than 5% as extremely imbalanced, and less than 1% as imbalanced with rare instances of the minority class [10,11]. Multiple domains could face problem statements with the involvement of an imbalanced dataset. The importance of majority and minority classes depends on the research problem statement. It is possible that the minority class could be treated as noise leading to biased training and testing of the classification model towards the majority class resulting in more false positives with fewer True Positives [11]. Sampling techniques offer a solution to treat imbalanced datasets in the pre-processing of data. Sampling techniques are classified into three distinct approaches: over sampling, under sampling, and hybrid sampling [8]. Under sampling approach reduces the number of majority class instances, whereas in over sampling, the number of minority class instances is increased due to generating new instances [8]. Fig. 1 shows how sampling techniques handle imbalanced datasets.
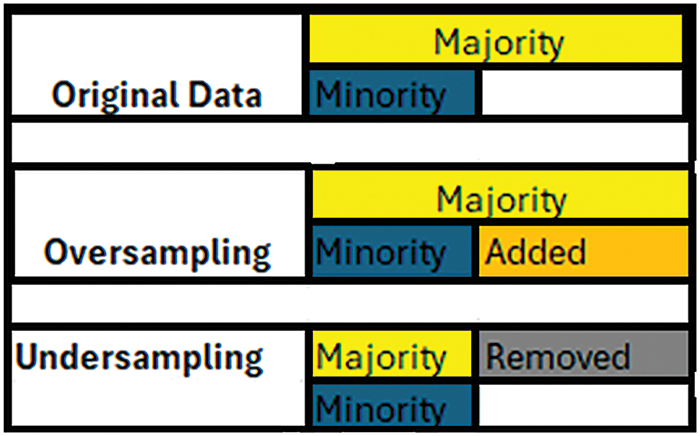
Figure 1: Sampling of imbalanced dataset
The ability to analyse trends and patterns aids decision-makers in strategising and making informed choices [1]. This research rigorously followed research methodologies, starting with the selection of related research based on search string keywords. These include data analysis, data pre-processing techniques, sampling techniques, imbalanced datasets, and classifier implementation. The present era, characterised by technological advancements and pervasive presence of BD, DM, and ML, has transformed the way in which information is generated, processed, and utilised. This transformation offers remarkable advantages and helps researchers to achieve their goals and aims. This study contributes in several ways. Firstly, it offers a critical review of related studies. Secondly, it conducts data analysis and data transformation, including data cleaning, on an imbalanced bank marketing dataset [12]. This step supports the necessary data pre-processing to understand and prepare the dataset for implementing the recommended classifier. Additionally, the study includes the implementation of two fine-tuned hyper-parameter classifiers. Lastly, it conducts a critical evaluation of the results based on five relevant metrics. In our work, the evaluation focuses on the Harmonic Mean Score (F-1 score) and Area Under the Curve (AUC), considering the importance of the minority class. We then assess the performance of the classifiers by comparing their results when implemented on an imbalanced dataset to the results obtained when implementing the same classifiers with sampling techniques [13].
This paper is structured as follows. Section 2 presents the methodology of our research. The related works are reviewed in Section 3. Then, we discuss our experiment setup with different conditions or parameters for implementation and results in Section 4. Section 5 concludes the paper and provides directions for future work.
The methodology of this study consists of two main components: the first part focuses on the selected Systematic Literature Review (SLR), while the second component describes the methodology flowchart. The literature review in this study follows the Kitchenham and Charters SLR approach [14], as depicted in Fig. 2. This approach consists of three phases: planning, conducting, and reporting.
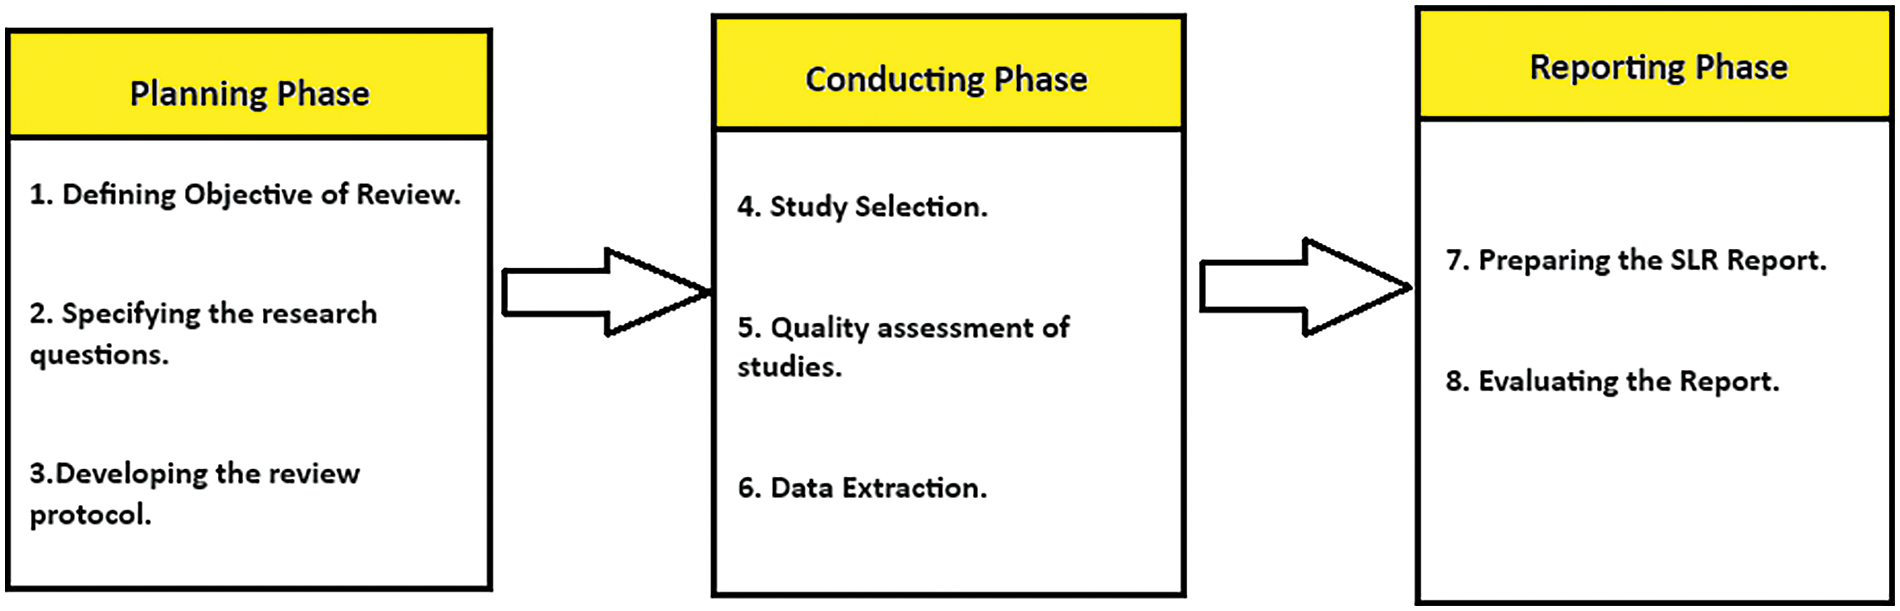
Figure 2: Kitchenham and Charters SLR approach
In the planning phase, we define the review’s purpose, specify research questions, and develop a review protocol. The purpose of the review in this study is to identify the optimal model for classifying imbalanced data. To achieve this, a systematic literature review is conducted on existing related studies, and various recommended techniques and classification models are implemented for performance evaluation. This helps in identifying the optimal model as a solution to the research problem. Our research questions are formulated based on data analysis techniques, data pre-processing techniques, classifiers, and performance evaluation metrics. The aim is to provide an ideal solution by utilising the finest data analysis and data pre-processing techniques to identify the best-performing classifier for imbalanced datasets. The review protocol includes the identification of potentially relevant studies from search results based on a search string. The conducting phase entails the selection of relevant studies, conducting quality assessments of these studies, and extracting valuable data from them. Screening is performed based on inclusion and exclusion criteria. We then thoroughly analyse the remaining articles selected after detailed screening of the studies. In the third phase, the report is prepared, and the key highlights of the reviewed SLR are evaluated.
In this paper, our methodology involves the classification of an imbalanced bank marketing dataset with data analysis and pre-processing to facilitate data-driven decision-making. We utilised a public dataset from the University of California, Irvine (UCI), an online data repository [12], comprising sixteen input variables and one target variable. We performed exploratory data analysis (EDA) and data visualisation to uncover the data patterns and insights. EDA involves examining and understanding data to extract insights, identify patterns, and relationships among variables, and highlight key characteristics. For graphical EDA, we used visualisation techniques to create plots, charts, and maps using Python libraries such as Matplotlib, Seaborn, and Plotly in Jupyter Notebook. Once the nuances and key issues in the dataset are understood through EDA, data pre-processing prepares the dataset to be used in the model. Data pre-processing includes the cleaning of the dataset by removing the outliers and missing values. Furthermore, we employed Binning and Label encoding to categorise variables to engineer our utilised dataset. We then performed binning on variables like ‘age’, ‘balance’, ‘job’, ‘day’, ‘month’, ‘duration’, ‘campaign’, ‘pdays’, and ‘previous’ in our dataset to group data into discrete intervals. Afterward, we applied label encoding to assign a unique integer to each category to facilitate the classifier’s implementation. Data sampling is then employed to handle the imbalance in the distribution of classes. We performed undersampling, and oversampling to address the imbalance in the target variable. Finally, we applied multiple classifiers to the pre-processed dataset and evaluated the results on five different performance metrics of Accuracy, Precision, F-1 score, AUC, and Recall. Fig. 3 shows the flowchart of the implementation methodology.
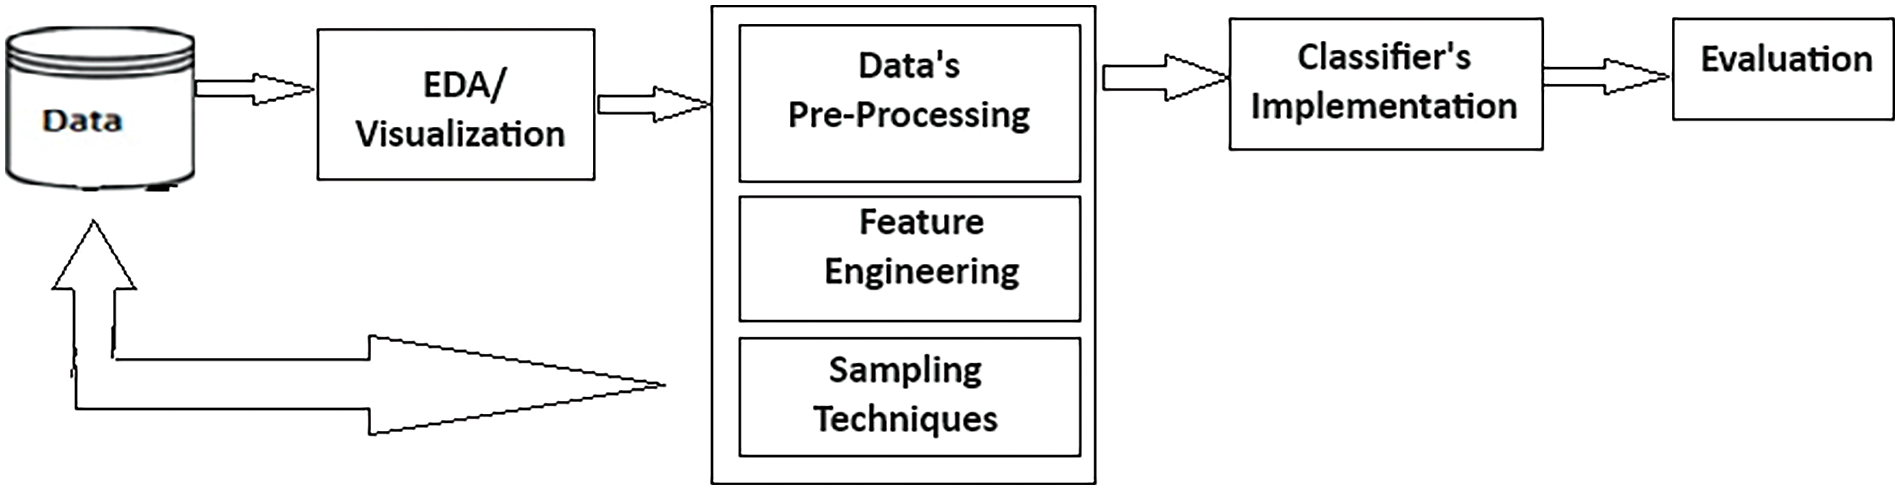
Figure 3: Methodology flowchart
This section presents the search strategy according to the Kitchenham SLR approach for related literature, including papers filtering criteria, and a discussion on relevant research selected in sub-sections: Review of published literature, including SLR papers and case studies. We refined our search string by starting from examining the best classifiers, data analysis and processing, and literature about imbalanced datasets used in recent academic research to address various gaps across different domains. We also explored studies concerning big data analytics in business and industries, concluding with the selection of relevant literature based on its strengths and limitations through the lens of our search string, inclusion, and exclusion criteria. An online search engine (Google Scholar) served as our primary tool for sourcing scholarly material. Our search string included keywords such as “data analytics used in different fields,” AND “top classifiers with their strengths and limitations,” AND “handling Imbalance datasets” AND “case studies of classifier’s implementation on datasets.” This is further explained in Table 1, which comprises keywords with Boolean “OR” and “AND” for our search string.
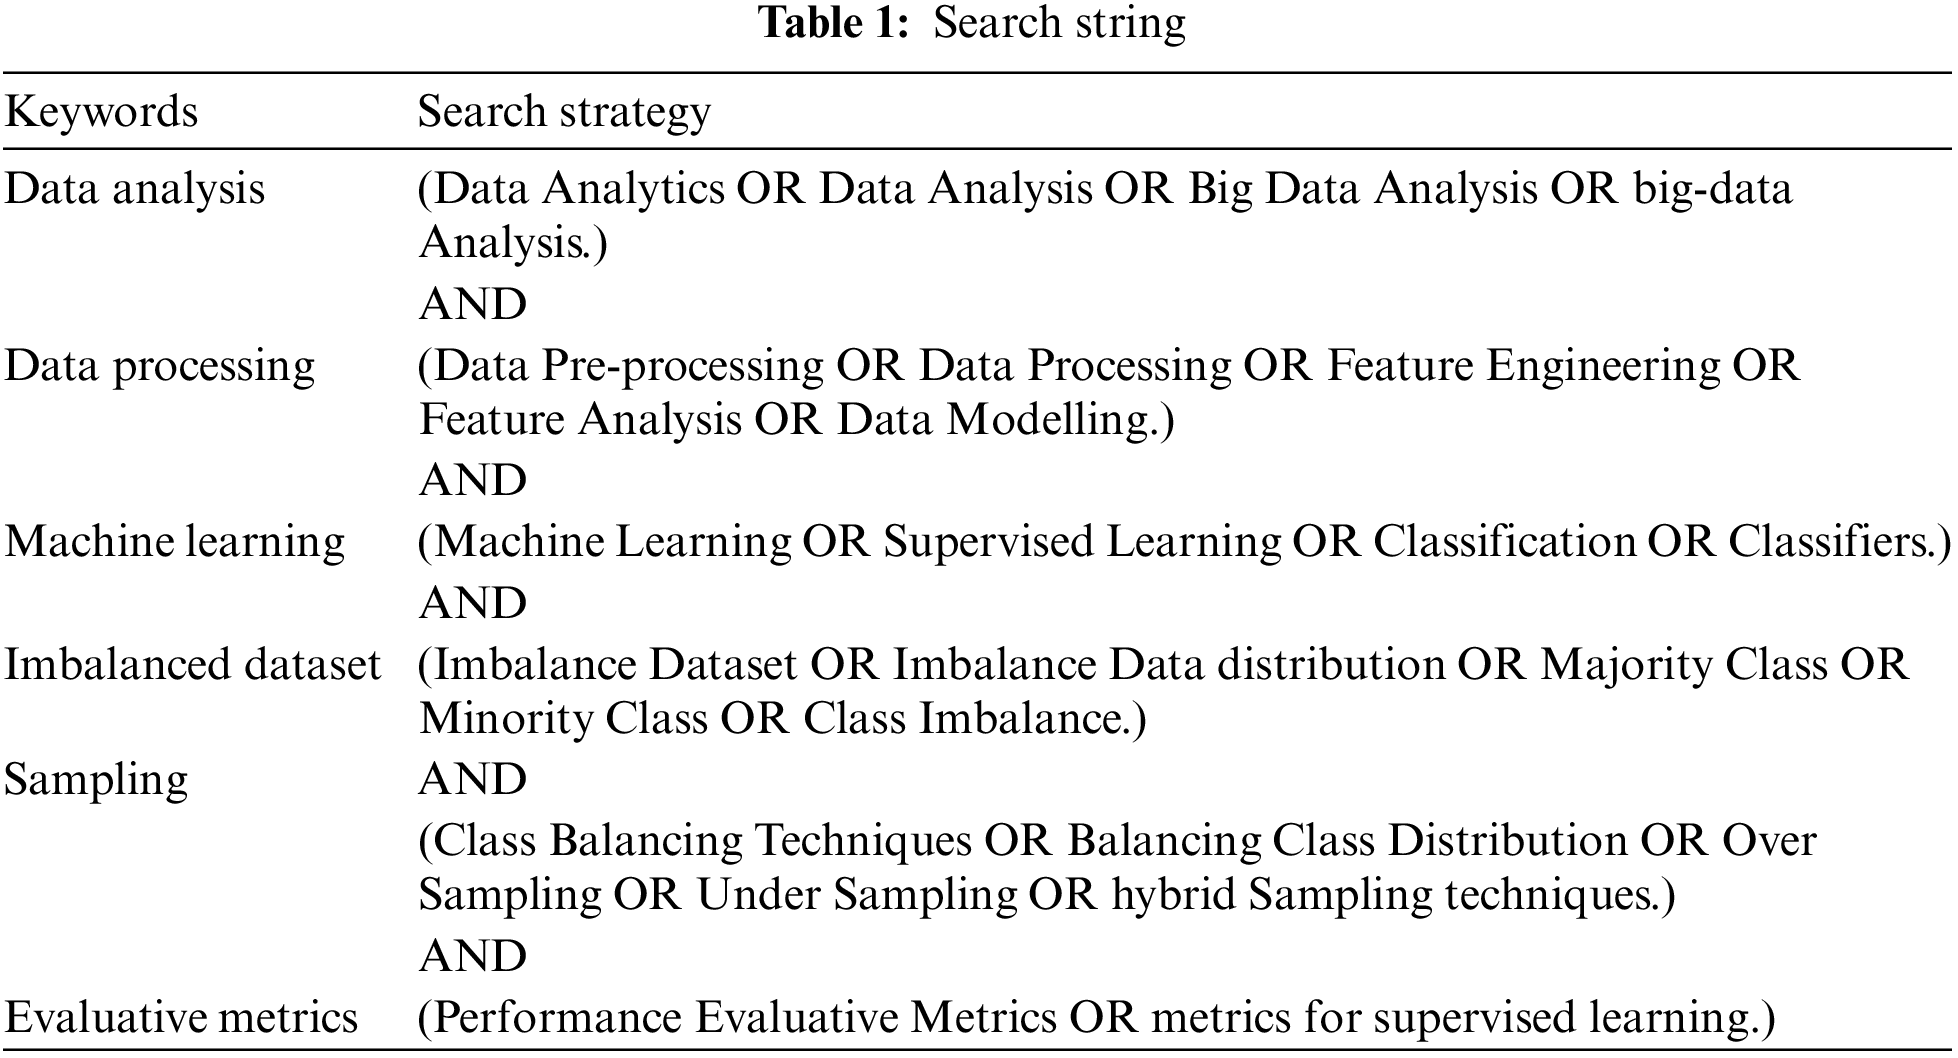
The strategy for reviewing related literature encompassed digital libraries including; Institute of Electrical and Electronics Engineers (IEEE), ScienceDirect, Scopus, Springer Link. These are well-known research sources with multi-disciplinary fields of research [11]. About 16,500 research articles were found in 0.14 s on Google Scholar search engine initially while following our basic search string. The filtering process was carried out on the exclusion criteria which comprised: The study is not written in English; Some keywords match but the overall context was not supportive of the research purpose; The full text of the study is not accessible; and the study is a short research article. Inclusion criteria limit the year of publication to within the last decade (2014–2024). After excluding duplicates, we identified over 1270 research publications in the online libraries that were pertinent to our research context and search string.
Our search results revealed numerous manuscripts, which partially answer or entirely support our research purpose while offering novel insights about using established algorithms for classifying different datasets in diverse fields, with feature engineering techniques and systematic summaries of past related literature. Some research studies pertinent to our related literature were selected from recent years after applying a systematic search strategy and filtering process. These studies fall into three categories. Firstly, reviewed published studies having academic papers other than case studies (Lit. Review). Secondly, case studies of the classifier’s implementation (Class. Case studies), and thirdly, case studies of the classifier’s implementation on imbalanced datasets (Class. Case studies with Imbalanced data). We identified appropriate implementation methodologies and evaluation metrics from related works. We carefully examined all selected studies to choose classifiers and sampling techniques for our study. Fig. 4 displays a chart depicting the selected studies for reviewing the state-of-the-art.
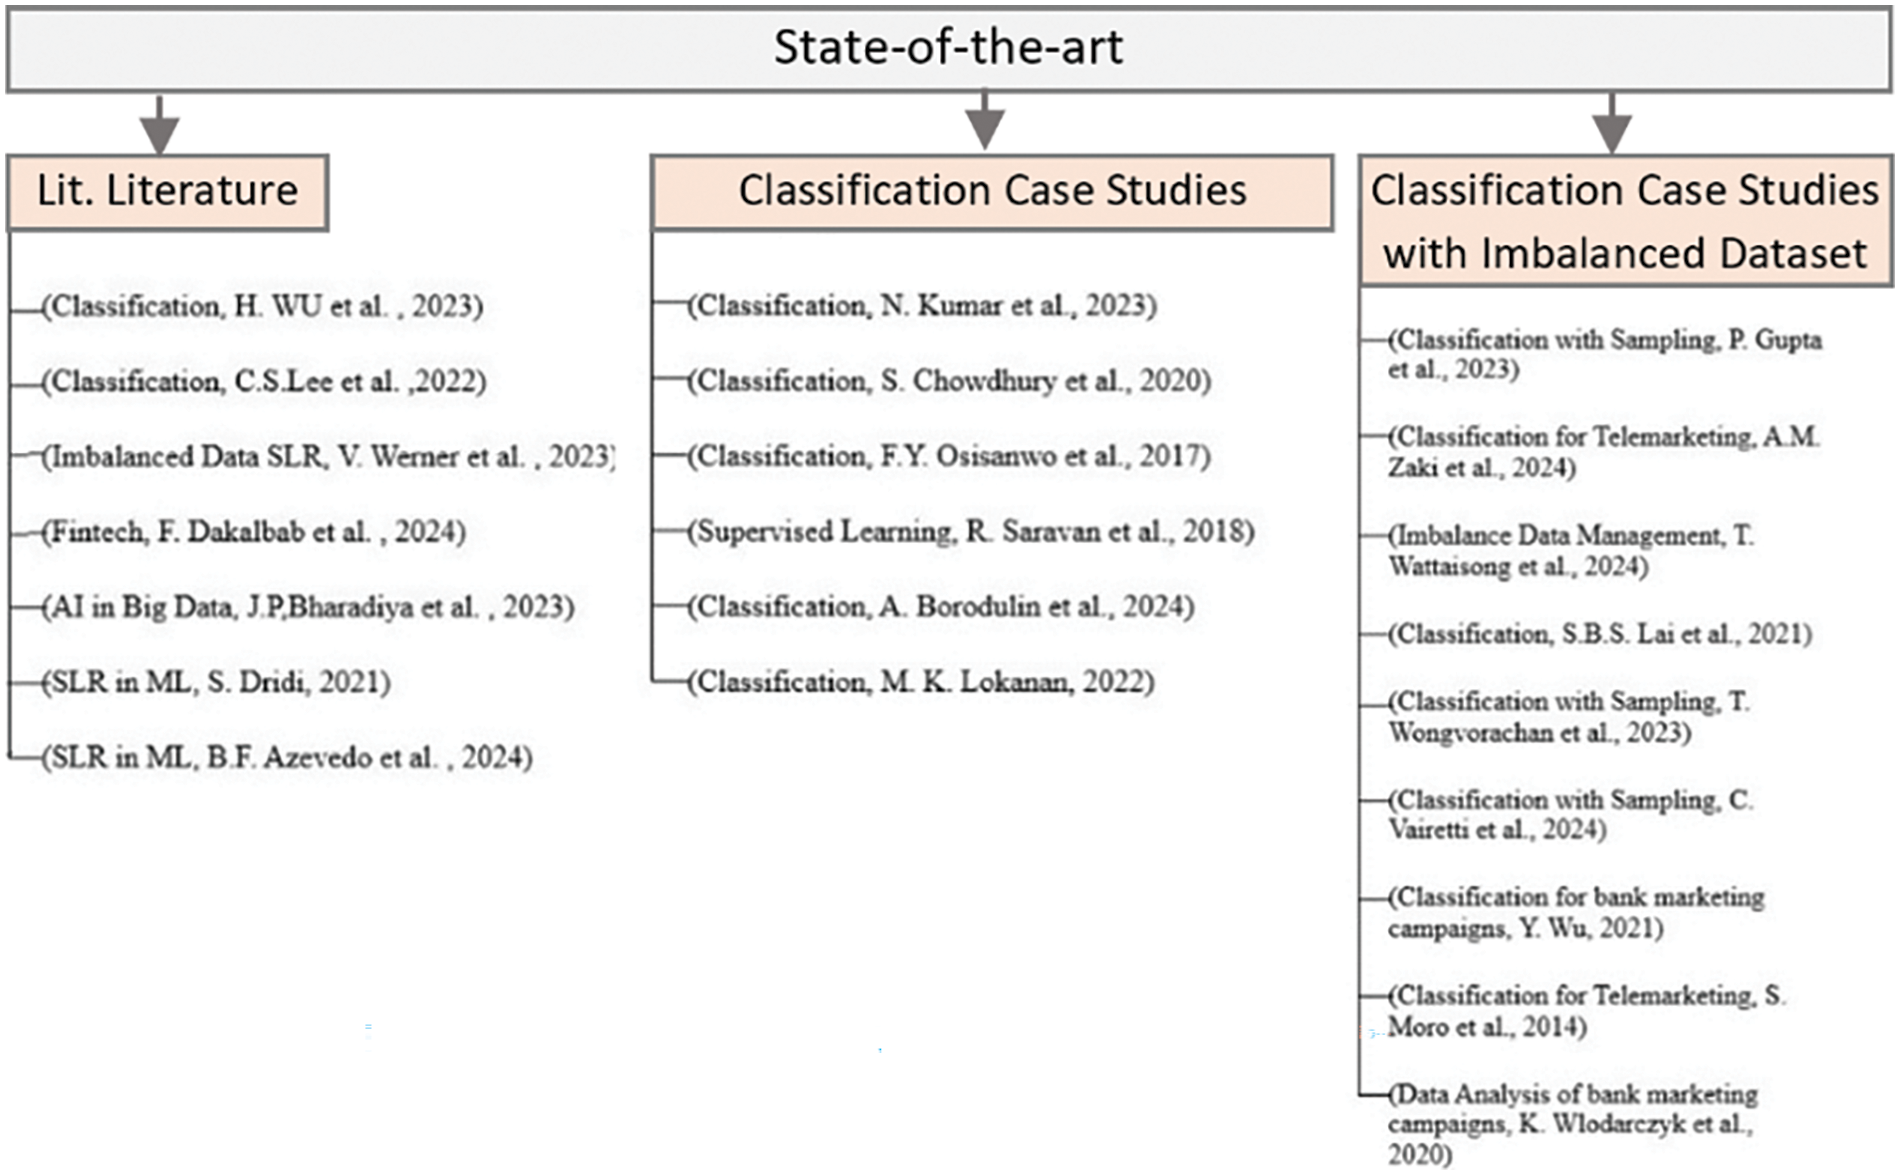
Figure 4: Shows the reviewed studies in the state of the art [1,4–6,8–11,13–27]
3.1 Review of Published Literature
We reviewed and summarized some academic studies, including systematic mapping studies, published in different journals and conferences to understand the concepts of ‘Supervised learning’, ‘Imbalanced dataset’, ‘Classification’, and the strengths and limitations of different classifiers with their basic principles and pseudocodes. Study [1] illustrated the impact of big data analytics in the banking industry. The purpose of this case study was to help enterprises gain valuable knowledge about big data implementation in practice and improve their information management ability. Thus, as they accumulate experience, they can reuse or adapt the proposed method to achieve a sustainable competitive advantage. Referring to the theories of technological frames of reference and transaction cost theory, that study also proposed a framework to address an overarching research question: “How can big data analytics be effectively adopted to help the banking industry improve performance in terms of customer segmentation and product affinity prediction?”.
Another study [5] systematically reviewed studies on predictive analytics and Decision Tree (DT) in business research. The authors selected 24 published studies on predictive analytics based on customer relationship management, healthcare, fraud detection, underwriting, education, and manufacturing. The paper also investigated the predictive tools used (methodology or algorithms) in the studies and identified the key takeaways of the selected studies published from 2018 to 2021. Another part of the review is based on DT, a known classifier in supervised learning. In this part of the review, the authors selected 20 studies and examined their domains of study, the algorithms or methodologies they used, and the key outcomes of the studies published from 2019 to 2021.
In the study [11], the authors provided an SLR using a systematic mapping methodology according to guidelines proposed by Peterson et al in 2015. Through the systematic mapping methodology, the authors assessed 9927 research papers from 7 digital libraries relating to sampling techniques for ML and selected 35 such papers published from 2013 to 2020 related to domains like health, finance, and engineering after the filtering process. The study concluded that oversampling techniques used with classic ML models are the most common, but sampling solutions with Neural Networks (NN) or with ensemble ML models are the best performers. The authors indicated that hybrid sampling techniques have the potential to perform better. They also termed Simulation-based synthetic oversampling as a future pre-processing solution.
Study [14] performed SLR according to Kitchenham and charter’s guidelines and provided insights into AI techniques used in financial trading after analysing the selected 143 research papers published between 2015 and 2023. The authors tried to answer four research questions while highlighting and identifying eight financial markets, commonly studied with a focus on stock markets, the FOREX market, and cryptocurrency trading. Machine learning, deep learning, and reinforcement learning were utilised as AI techniques in the reviewed literature, with a higher number of research papers focused on deep learning, and only 10% of research papers being related to classification. During and after the pandemic of Corona Virus (COVID-19) stock market crash, many research works were published on the topic of fintech with a focus on fundamental trading analysis, technical analysis, and trading strategies. The study listed forty AI techniques (traditional and hybrid) with multiple evaluation metrics following a systematic mapping review. The authors recommended future research aiming to develop an automated financial trading system that predicts the market after technical and fundamental analysis. To achieve this aim, researchers should focus on developing models with maximum risk control behaviour and building additional crisis detectors for risk analysis. Furthermore, this study suggests research pathway of developing approach for determination of best automated model and fintech system.
In a comparative study on business intelligence (BI) and AI conducted through the lens of big data analytics [15], the authors reviewed the literature and highlighted the scope, importance, usage, software and hardware resources, and the role of BI, AI, and ML in data analytics. Study [16] also systematically reviewed the literature on supervised learning techniques and algorithms. The research questions formulated for this review aimed to figure out the types of approaches or algorithms used, which performance evaluation metrics were employed, and the strengths and limitations of each study on supervised learning. The authors selected digital libraries like IEEE, the Association for Computing Machinery (ACM), and ScienceDirect when searching for articles published from January 2011 to August 2021. They ended up with 57 studies after implementing inclusive and exclusive search strategies for review. This study found classifiers such as Logistic Regression (LR), Support Vector Machine (SVM), DT, Adaptive Boosting (AdaBoost), Extreme Gradient Boosting (XGBoost), Naïve Bayes (NB), K-nearest neighbours (KNN), and Random Forest (RF), are the widely used supervised learning algorithms. The authors also identified Accuracy, Precision, Recall, F-1 score, AUC, and Mean Absolute Error (MAE) as widely used evaluation metrics. Furthermore, about 60% of the selected studies were related to the medical field.
Study [17] presented an extensive review of published literature between 2019 and 2021 on hybrid techniques based on optimisation and machine learning models. The authors reviewed 479, 200 and 450 research publications from Scopus, IEEE, and Web of Science, respectively. According to the authors, there is a notable surge in research towards the advancement of bio-inspired algorithms accompanied by fusion or diverse methodologies of machine learning. A discernible conclusion proposes substantial future research in bio-inspired strategies, particularly rooted in Swarm Optimisation or Genetic algorithms to enhance ML models. This paper contributes to knowledge discovery by conducting a comparative analysis of the performance and adaptability of hybrid techniques based on optimisation and ML across different domains.
In the literature review, most of the selected research papers are published as SLR that contain reviews of papers on classification, data analytics with feature engineering, and sampling techniques, which provide a brief understanding of historic research work and proposed research gaps related to our problem statement published between 2014 and 2024 [5,14,17]. All of these studies describe the importance and impact of AI and ML models along with pre-processing techniques in different domains including medical and financial fields. We also reviewed some case studies, which are subdivided and distinguished based on the dataset distribution ratio from different domains.
3.2 Case Studies of Classifiers Implementation
This section includes a scholarly examination of studies that implemented different classifiers to address their respective research questions. This section includes case studies with structured, unstructured, or semi-structured datasets; excluding case studies with imbalanced datasets. For example, the study [18] investigated credit card fraud detection using the RF algorithm on a dataset based on customer behaviour. The study assessed Accuracy and Precision by using DT, RF, LR, and AdaBoost as classifiers and found that RF outperformed others with a 94.40% accuracy score. Another study [19] assessed classifier performance using a dataset of abstracts fetched from different existing research. The dataset consists of 107 research abstracts, with 36 related to Science and Social Sciences and 35 from Business. They used DT, SVM, KNN, and NB to classify research abstracts into classes of Science, Business, and Social Sciences based on ‘term frequency-inverse document frequency’ and ‘bag of words’, while evaluating their performance on accuracy, precision, recall, and F-1 score. SVM again outperforms other classifiers in comparative results. Data pre-processing involves tokenisation, text cleaning, stop-word removal, stemming, and feature extraction.
In research work [20], analysis and classification were performed on diabetes data using the Waikato Environment for Knowledge Analysis (WEKA) tool with SVM, RF, and NB classifiers. Once again, SVM demonstrated superior performance compared with the other classifiers, particularly under a binary target variable. However, the study also noted that RF performed well in terms of Accuracy, Precision, and MAE under the binary target variable. Meanwhile, the authors in the study [21] discussed various probabilistic and linear classifiers under supervised learning, including Boosting, DT, RF, SVM, NN classifiers, LR, NB, and the maximum entropy classifier. Study [22] utilised ML classifiers to analyse and predict real estate pricing using a multi-attribute dataset. The study implemented Kohonen maps, NN, and DT on a real estate dataset from the online platform for machine learning (Kaggle); subsidiary of Google LLC. Despite several limitations, the authors found that DT performed well in terms of Accuracy, which was the sole metric used for evaluation. In Study [23], the author named NB and RF as the two best-performing models for predicting bank money laundering transactions compared with LR and Categorical Boosting (CatBoost). Furthermore, they verified through the results that the Artificial Neural Network (ANN) model slightly outperformed all aforementioned classic ML models.
The concluding results of the reviewed existing works are presented in terms of Accuracy, Recall, Precision, and F-1 score. Table 2 presents the results for the comparative evaluation of reviewed case studies with classifier implementations on different datasets. (χ represents ‘Not Stated’ in Tables 2 and 3 as defined in the Nomenclature of the draft).
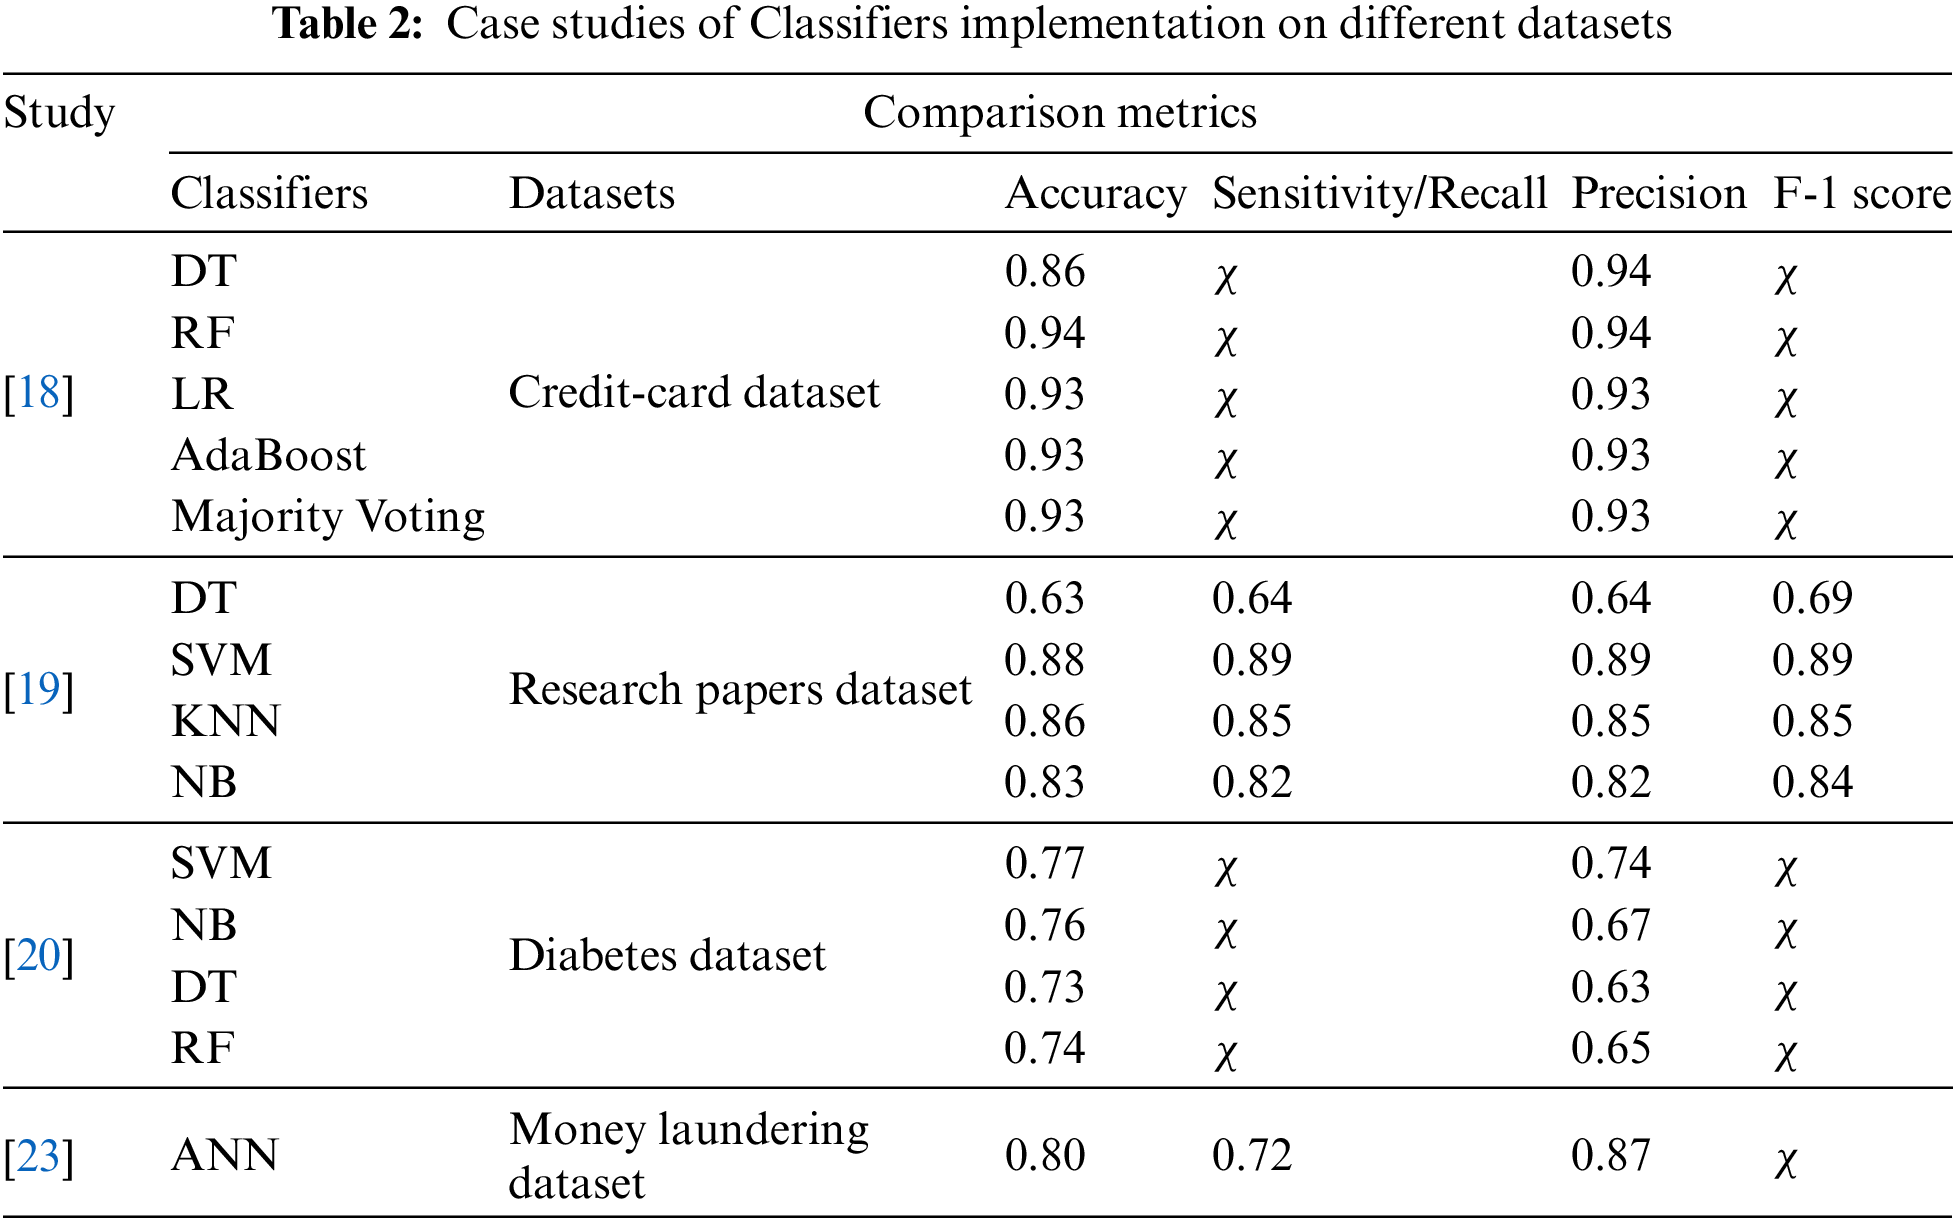
To summarise Table 2, the studies listed in the table utilise diverse types of datasets and focus on various research areas, demonstrating the versatility and effectiveness of machine learning models across different domains. These studies employed conventional classifiers, yielding diverse results on performance metrics, which supports the statement that “the performance of classification depends not only on the selection of the algorithm but also on the quality and form of the input dataset” [14]. This also reiterates that traditional classifiers, with fine-tuned hyper parameters, can produce acceptable results for classification problems. This underscores the necessity of research on combining multiple techniques and algorithms with optimised hyperparameter tuning to achieve robust results. Most of the studies used and recommend Accuracy, Precision, Recall, and F-1 score as relevant performance metrics.
3.3 Case Studies of Classifiers Implementation on Imbalanced Dataset
This section includes the revision of academic case studies on classifiers applied to imbalanced datasets. One of the objectives of these studies was the critical evaluation of classifiers on real-world imbalanced datasets. While recapitulating the study [4], the authors offered significant insights into how imbalanced data can affect the performance of ML models in detecting credit card fraud. Furthermore, the research proposes techniques, such as Random Oversampling (ROC), Random Undersampling (RUS), and Synthetic Minority Oversampling Technique (SMOTE) to balance the dataset and improve the performance of XGBoost, thereby enhancing the overall accuracy of fraud detection systems. ROS performed better than the other two techniques. Among basic classifiers, XGBoost gives better results than LR, DT, and ANN in terms of Accuracy, Precision, Recall, and F-1 score. After applying ROS, the XGBoost classifier achieved an F-1 score of 0.99.
Meanwhile, the problem statement of the study [6] is to explore the use of predictive analytics and ML in direct marketing using a bank marketing dataset. The objectives of this case study were to predict potential customers and assess the performance of different classifiers on customer-related datasets. To achieve their research objectives, the authors implemented KNN, LR, Gaussian Naïve Bayes (GNB), DT, and RF while assessing performance based on Accuracy, Sensitivity, Specificity, Positive Predictive Value, Negative Predictive Value, and F-1 score. RF classifier appeared as the best-performing model in terms of predictive power compared with the other classifiers in this study.
Study [8] conducted a comparative evaluation by assessing and ranking 66 distinct variations of minority oversampling techniques for handling imbalanced data using Positional Voting Rules (Borda Count Score) and Non-Parametric Test (Kruskal-Wallis Test Score). They selected 50 datasets from online data repositories like UCI and Open Platform for Machine Learning (OpenML) with the distribution of 20 and 30 sets of data, respectively. They ranked Minority Cloning Technique, Cluster-Based Synthetic Oversampling, SMOTE with Iterative Partitioning Filter, and Proximity Weighted Synthetic Oversampling as the top 4 imbalanced data handling techniques on the F-measure and Kruskal-Wallis Test Score for selected implementation on 30 OpenML datasets with DT, RF, and XGBoost as baseline classifiers. They also evaluated the execution time of these four best balancing techniques, including SMOTE, on the 20 UCI repository datasets. The empirical results concluded that Minority Cloning Technique, Cluster-Based Synthetic Oversampling, and SMOTE with Polynomial Fitting were the top three in terms of execution time and F-measure among the imbalanced data handling methods used in the study.
Study [9] evaluated the performance of AdaBoost, XGBoost, and LR on imbalanced data by implementing these classifiers on three UCI repository datasets with 5% (Glass dataset), 10% (Ecoli dataset), and 25% (Wi-Fi dataset) imbalance rates (Minority class distribution). The authors concluded that all three classifiers performed worst on 5% imbalanced data, slightly better on 10% imbalanced, and much better on the 25% imbalanced data. Furthermore, the increase in sample size and the decrease in the percentage of minority classes implied that the classifiers failed to predict the minority cases effectively, treating them as noise. Additionally, all three methods exhibited overfitting issues. The study also revealed that LR yielded better results for the 5% imbalanced dataset, XGBoost performed well on the 10% imbalanced dataset, while AdaBoost had the best results on the 25% imbalanced dataset.
The study [10] aimed to inform Education Data Mining (EDM) researchers about the operation, advantages, and limitations of selected resampling techniques, including ROS, RUS, and SMOTE. The study primarily focused on Radom Forest with hyperparameter tuning on grid search (GS-RF) as the chosen model for performance evaluation on imbalance dataset for learning. The authors selected Accuracy, Precision, Recall, AUC, and F-1 score as the evaluation metrics. It also included two types of datasets taken from the National Centre for Education Statistics (NCES); moderate imbalance with 23.7% minority class and extreme imbalance with 6.6% minority class. The authors acknowledged the limitations of this study, such as the use of a single dataset and the challenge of finding the optimal hyperparameter values. Furthermore, they recommended exploring different combinations of resampling techniques and classification algorithms in the context of education data mining for future research. They also proposed the use of ROS for moderately imbalanced data and hybrid resampling for extremely imbalanced data to produce the best results in the context of EDM.
Study [13] highlighted the need for efficient sampling techniques to address bias in prediction when dealing with BD. The authors presented a novel resampling method named SMOTENN; a fusion comprised of RUS, SMOTE, and Edited Nearest Neighbour (ENN) under the MapReduce framework. The authors state that the proposed resampling method complements the neighbourhood of the minority class with efficient implementation and performance on small, medium, and large datasets. They also studied ENN alongside two other SMOTE variants known as Borderline SMOTE and Safe Level SMOTE, for resampling. The experimentation utilised DT and RF as baseline classifiers on large datasets after processing with ENN, SMOTE, ENN+SMOTE, and SMOTENN while using Geometric mean measure as the Performance metric. The authors suggested the need for State-of-the-art approach for imbalanced BD classification with high-dimensional datasets.
Authors [24] performed basic data analysis and classification on a real bank marketing dataset [12]. This paper included the implementation of SVM, ANN, LR, and RF as classifiers and one-hot encoding on all features during feature engineering. The paper concluded that the ‘job’; an input variable, did not affect the target variable. Furthermore, the RF classifier demonstrated the best performance among all the classifiers in handling the imbalanced target variable. In another study [25], data analysis was performed based on the ‘contacts’ and ‘duration’ of calls for the marketing campaign. The authors analysed a dataset with 150 features and carried out semi-automatic feature selection during the modelling phase to reduce the number of features. They used intuitive knowledge and adapted the forward selection method to reduce the features to 22 during the feature selection phase. The authors also performed the dataset classification using SVM, NN, and DT. Overall, the NN classifier performed better compared to the other classifiers on AUC and Area of the LIFT cumulative cure (ALIFT), which were the metrics used for comparison. NN achieved the best results by giving 0.8 on AUC and 0.7 on ALIFT under the rolling window scheme. Study [26] performed data analysis and used one-hot encoding in data processing. The authors also implemented KNN, Linear regression, and LR as classifiers, with fine-tuning to form different models. Their results showed that KNN model 3 performed better in terms of Accuracy, Precision, Sensitivity, and Specificity than other models presented in the study.
In [27], the authors used two ensemble models and one hybrid ensemble learning model namely random subspace, multi-boosting, and random subspace multi-boosting respectively, to build a prediction model that could further improve the success of telemarketing in the banking industry. In this study, the authors selected independent input variables through a partial dependence plot and described their impact on the target variable. They implemented SMOTE to handle the imbalanced nature of the dataset. They found that hybrid ensemble learner random subspace-multi-boosting had the best prediction performance with the selected independent variables. Results for the hybrid ensemble learner showed 0.94 for the F-1 score and 0.98 for the AUC on the bank marketing dataset.
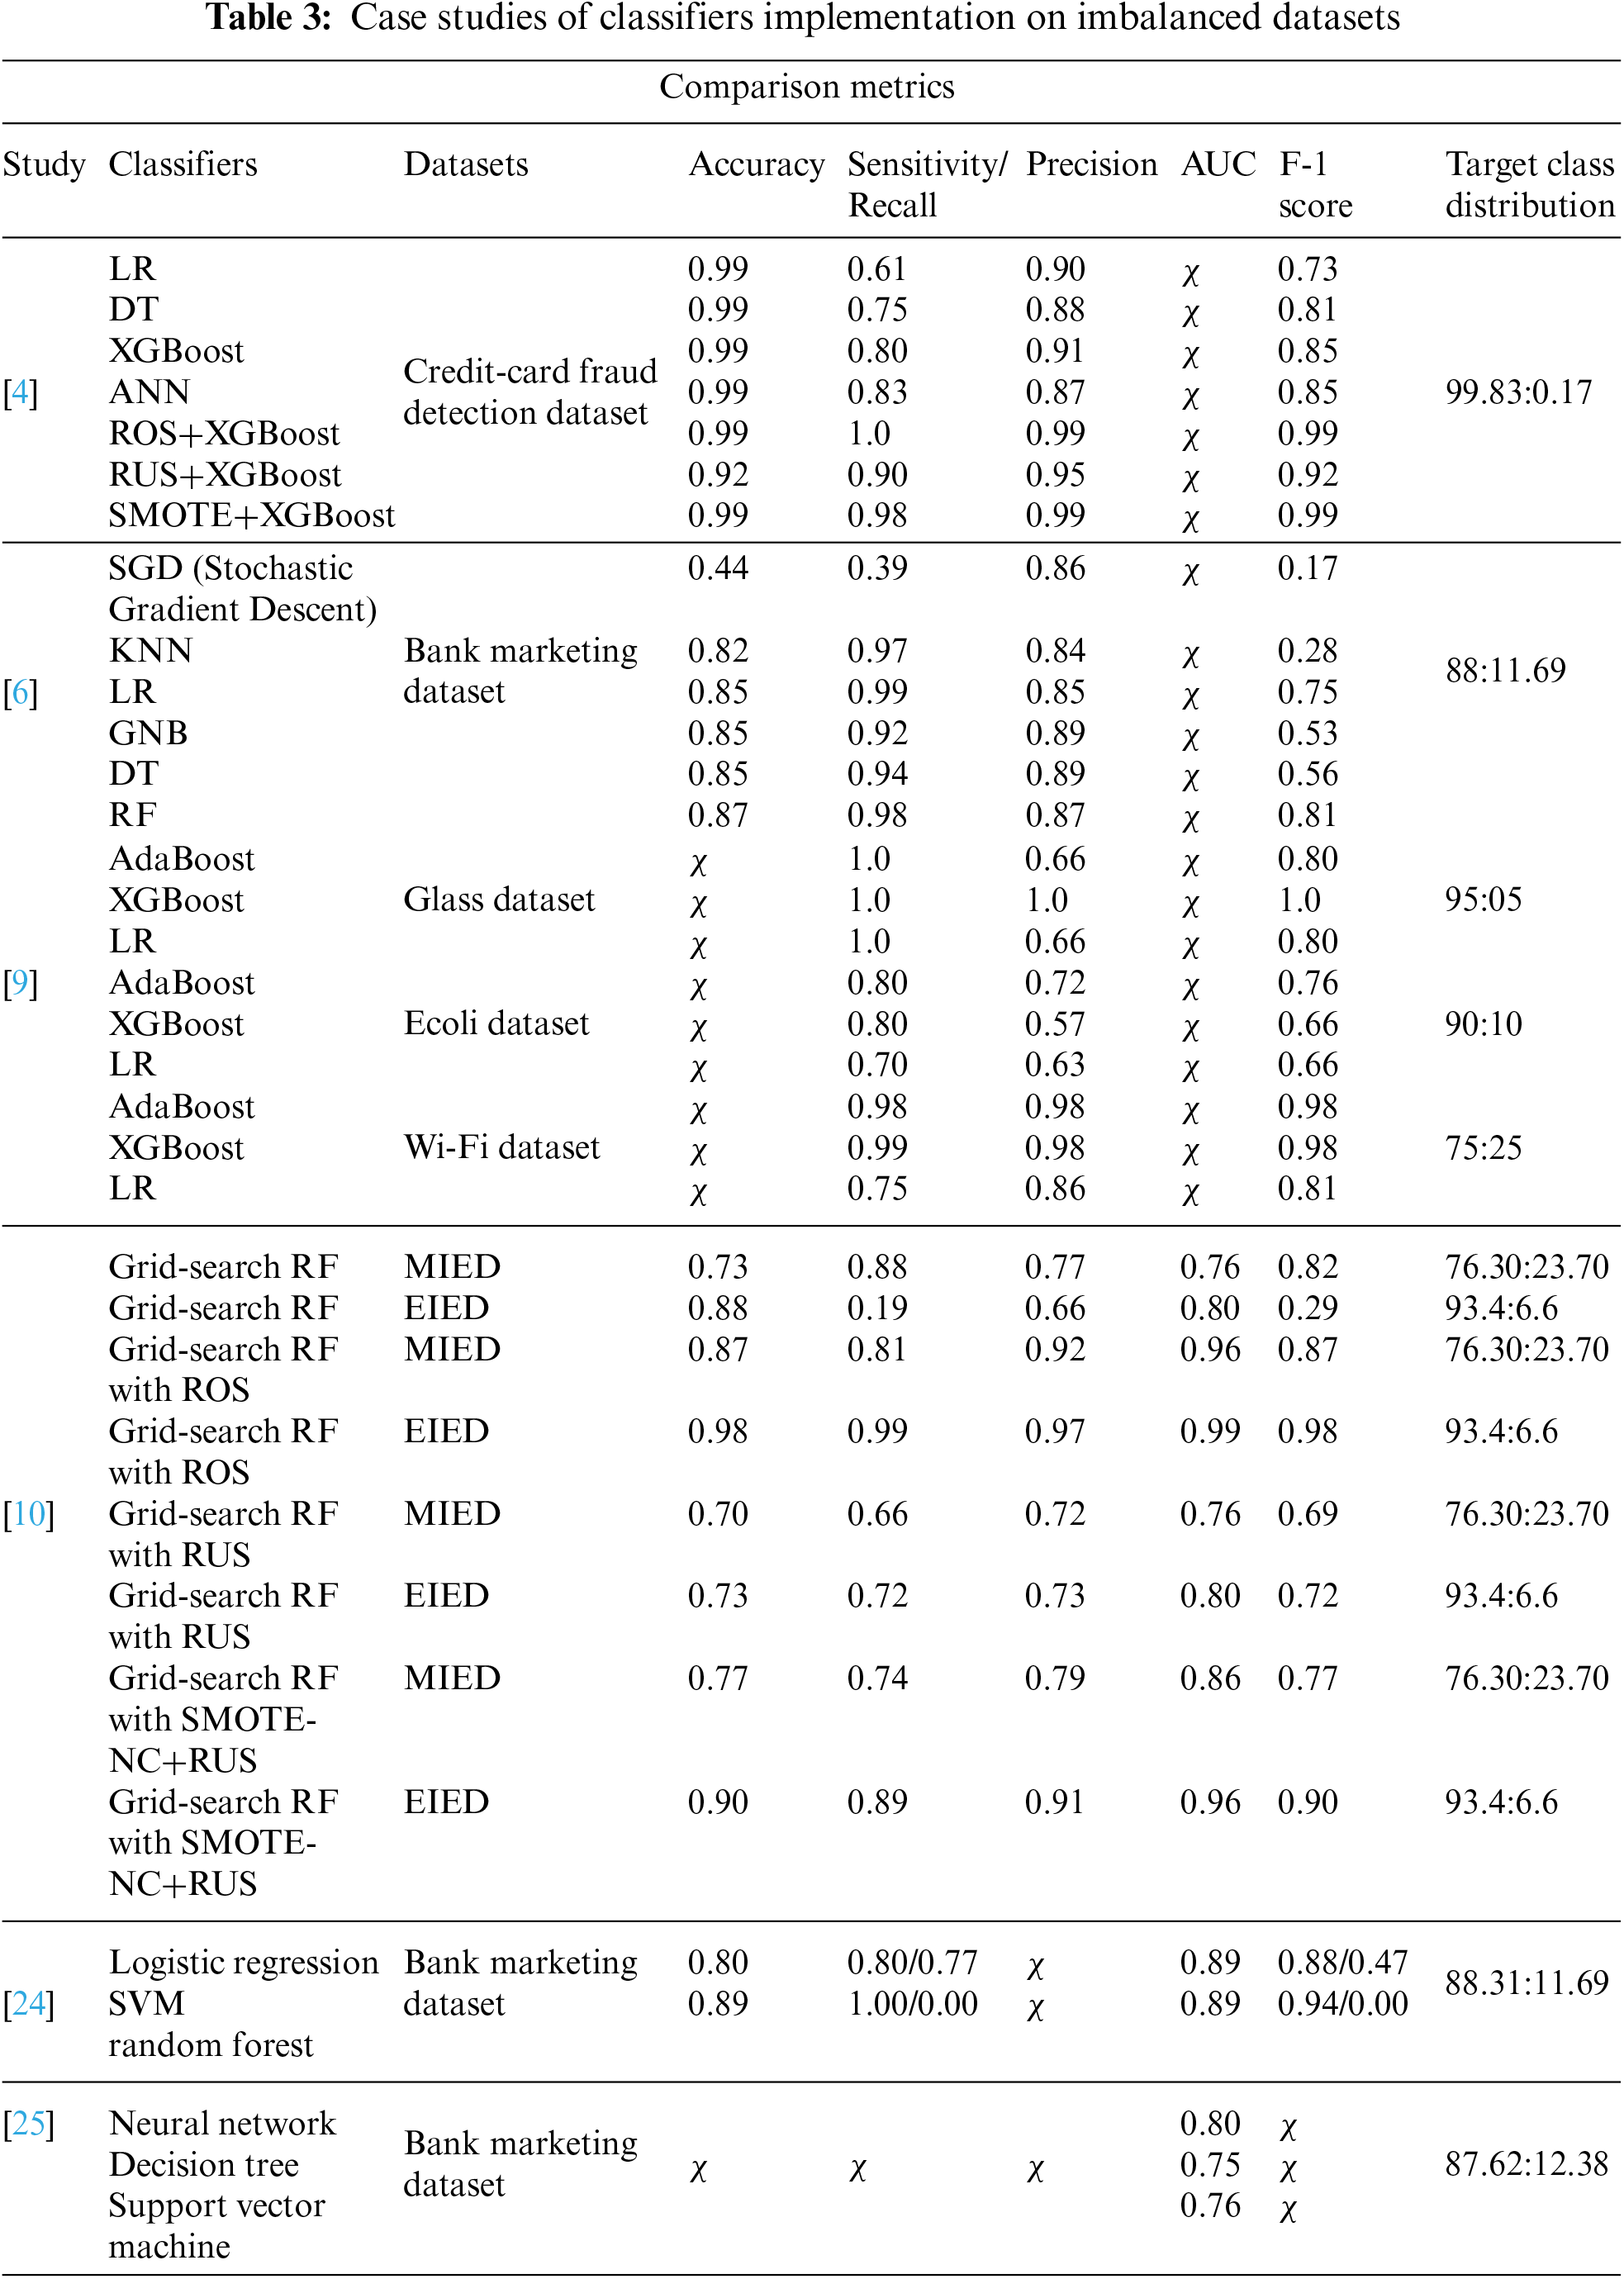
The results of the reviewed existing works in terms of Accuracy, AUC, Recall, Precision, F-1 score, and target class distribution are shown in Table 3. This table presents the outcomes after a comparative evaluation of reviewed case studies with classifier implementation on imbalanced datasets.
Different case studies on the implementation of classifiers for imbalanced datasets conclude that the classifier’s performance depends on the target class distribution and the results of feature engineering. Sometimes, simple classifiers yield reasonable results, but when combined with sampling techniques, their performance improves significantly. To illustrate this, we evaluate the outcomes of different studies. For example, the study [24,25] applied multiple different classifiers on the same banking dataset with imbalanced target class distribution, using fewer evaluative metrics under different conditions. Although in the study [6], RF gives a better F-1 score but misses the AUC score for better analysis of classifiers performance in terms of underfitting or overfitting. In the study [25], the F-1 score is missing through which we could analyse the classifier’s performance on the majority class or on the minority class of the target variable. Study [24] showed better performance on the majority class of the target variable but performed poorly on the minority class, suggesting that the classifiers might treat the minority class as noise. Study [9] implemented multiple classifiers on different datasets with varying class distributions of the target variable and provided satisfactory results on the F-1 score. However, it lacked accuracy and AUC scores, which are important for result analysis. Study [4], demonstrated the implementation of sampling techniques alongside the XGBoost classifier, yielding quite reliable results for a highly imbalanced target variable with only 492 instances of the minority class. Study [10] implemented GS-RF, alongside different sampling techniques on education related dataset with different class distributions in the target variable. This study recommended that GS-RF with ROS provides better results on moderately imbalanced and extremely imbalanced education datasets. Authors extensively evaluated the performance of RF as a baseline classifier on education related imbalanced datasets before and after sampling techniques, providing a conceptual foundation for classifying imbalanced banking big data.
Based on the reviewed studies, RF, DT, AdaBoost, and XGBoost classifiers have demonstrated their effectiveness under various conditions and datasets. Consequently, we chose to utilise these classifiers in our analysis. Additionally, the study [10] recommended illustrating the performance of the hyperparameter random forest model. Therefore, we included Radom Forest with hyperparameter tuning on grid search (GS-RF) and random forest with hyperparameter tuning on Random Search (RS-RF) for implementation and performance evaluation on a highly imbalanced marketing dataset. Past studies [4,10] suggested the use of accuracy, precision, recall, AUC, and F-1 score as performance evaluation metrics. Moreover, Wu [24] highlighted that one-hot encoding introduced a curse of dimensionality issue, leading to the selection of label encoding for feature engineering. The initial selection criteria for sampling techniques were based on the basic advantages and limitations of the selected sampling techniques. As RUS and ROS are traditional sampling techniques, the rest of the sampling techniques are built on both, such as SMOTE, which is a minority oversampling technique. The process of generating redundant synthetic values in the minority class is named SMOTE. As the inclusion of redundant instances or variables can negatively affect the performance of the resampling strategy [13], we sought out SMOTE variants. Adaptive Synthetic SMOTE (AdaSyn SMOTE) only generates variables when and where classification is difficult, thereby improving accuracy [8]. RUS has the limitation of dealing with noise and could possibly cause the loss of useful instances and variables from the feature space, so we opted for Borderline SMOTE2; a variant of SMOTE where data values are generated for oversampling based on the values near the minority class borderline. According to a study [13], most publications have adopted SMOTE and its variants for oversampling large imbalanced dataset. We choose SMOTE, AdaSyn SMOTE, and Borderline SMOTE2 along with ROS, and RUS for performance evaluation on our dataset as sampling techniques. The performance of classifiers, however, depends not only on the selected algorithms but also on the quality of input data [13]. In this study, we selected multiple variants of sampling techniques for implementation to evaluate the performance of classifiers both before and after applying the sampling techniques, setting the best-performing classifier as the baseline [8,11,13].
In the current experiment, we used Jupyter Notebook with Python language, implementing libraries like scikit-learn (Sklearn) and imbalance-learn (Imblearn) under various random states and conditions of the machine, sampling techniques, and classifiers for a comprehensive implementation of classifiers with sampling techniques and subsequent performance evaluation. The following subsections describe the experiment settings, data analysis with label encoding, and classification results before and after sampling techniques with the discussion of the findings. For this experiment, we used the Portuguese bank marketing dataset [12] which consists of 45,211 instances or values with 17 variables, including “y” as the target variable. The Portuguese bank dataset contains data related to marketing campaigns. The target variable ‘y’ indicates “yes” and “no” for the current marketing campaign. The target variable in our dataset is highly imbalanced, where “yes” values are only of 11.69% while the rest are “no” values in the target variable. We conducted EDA, feature engineering using label encoding and applied sampling techniques in Jupyter Notebook using Python libraries, along with implementing ML classifiers.
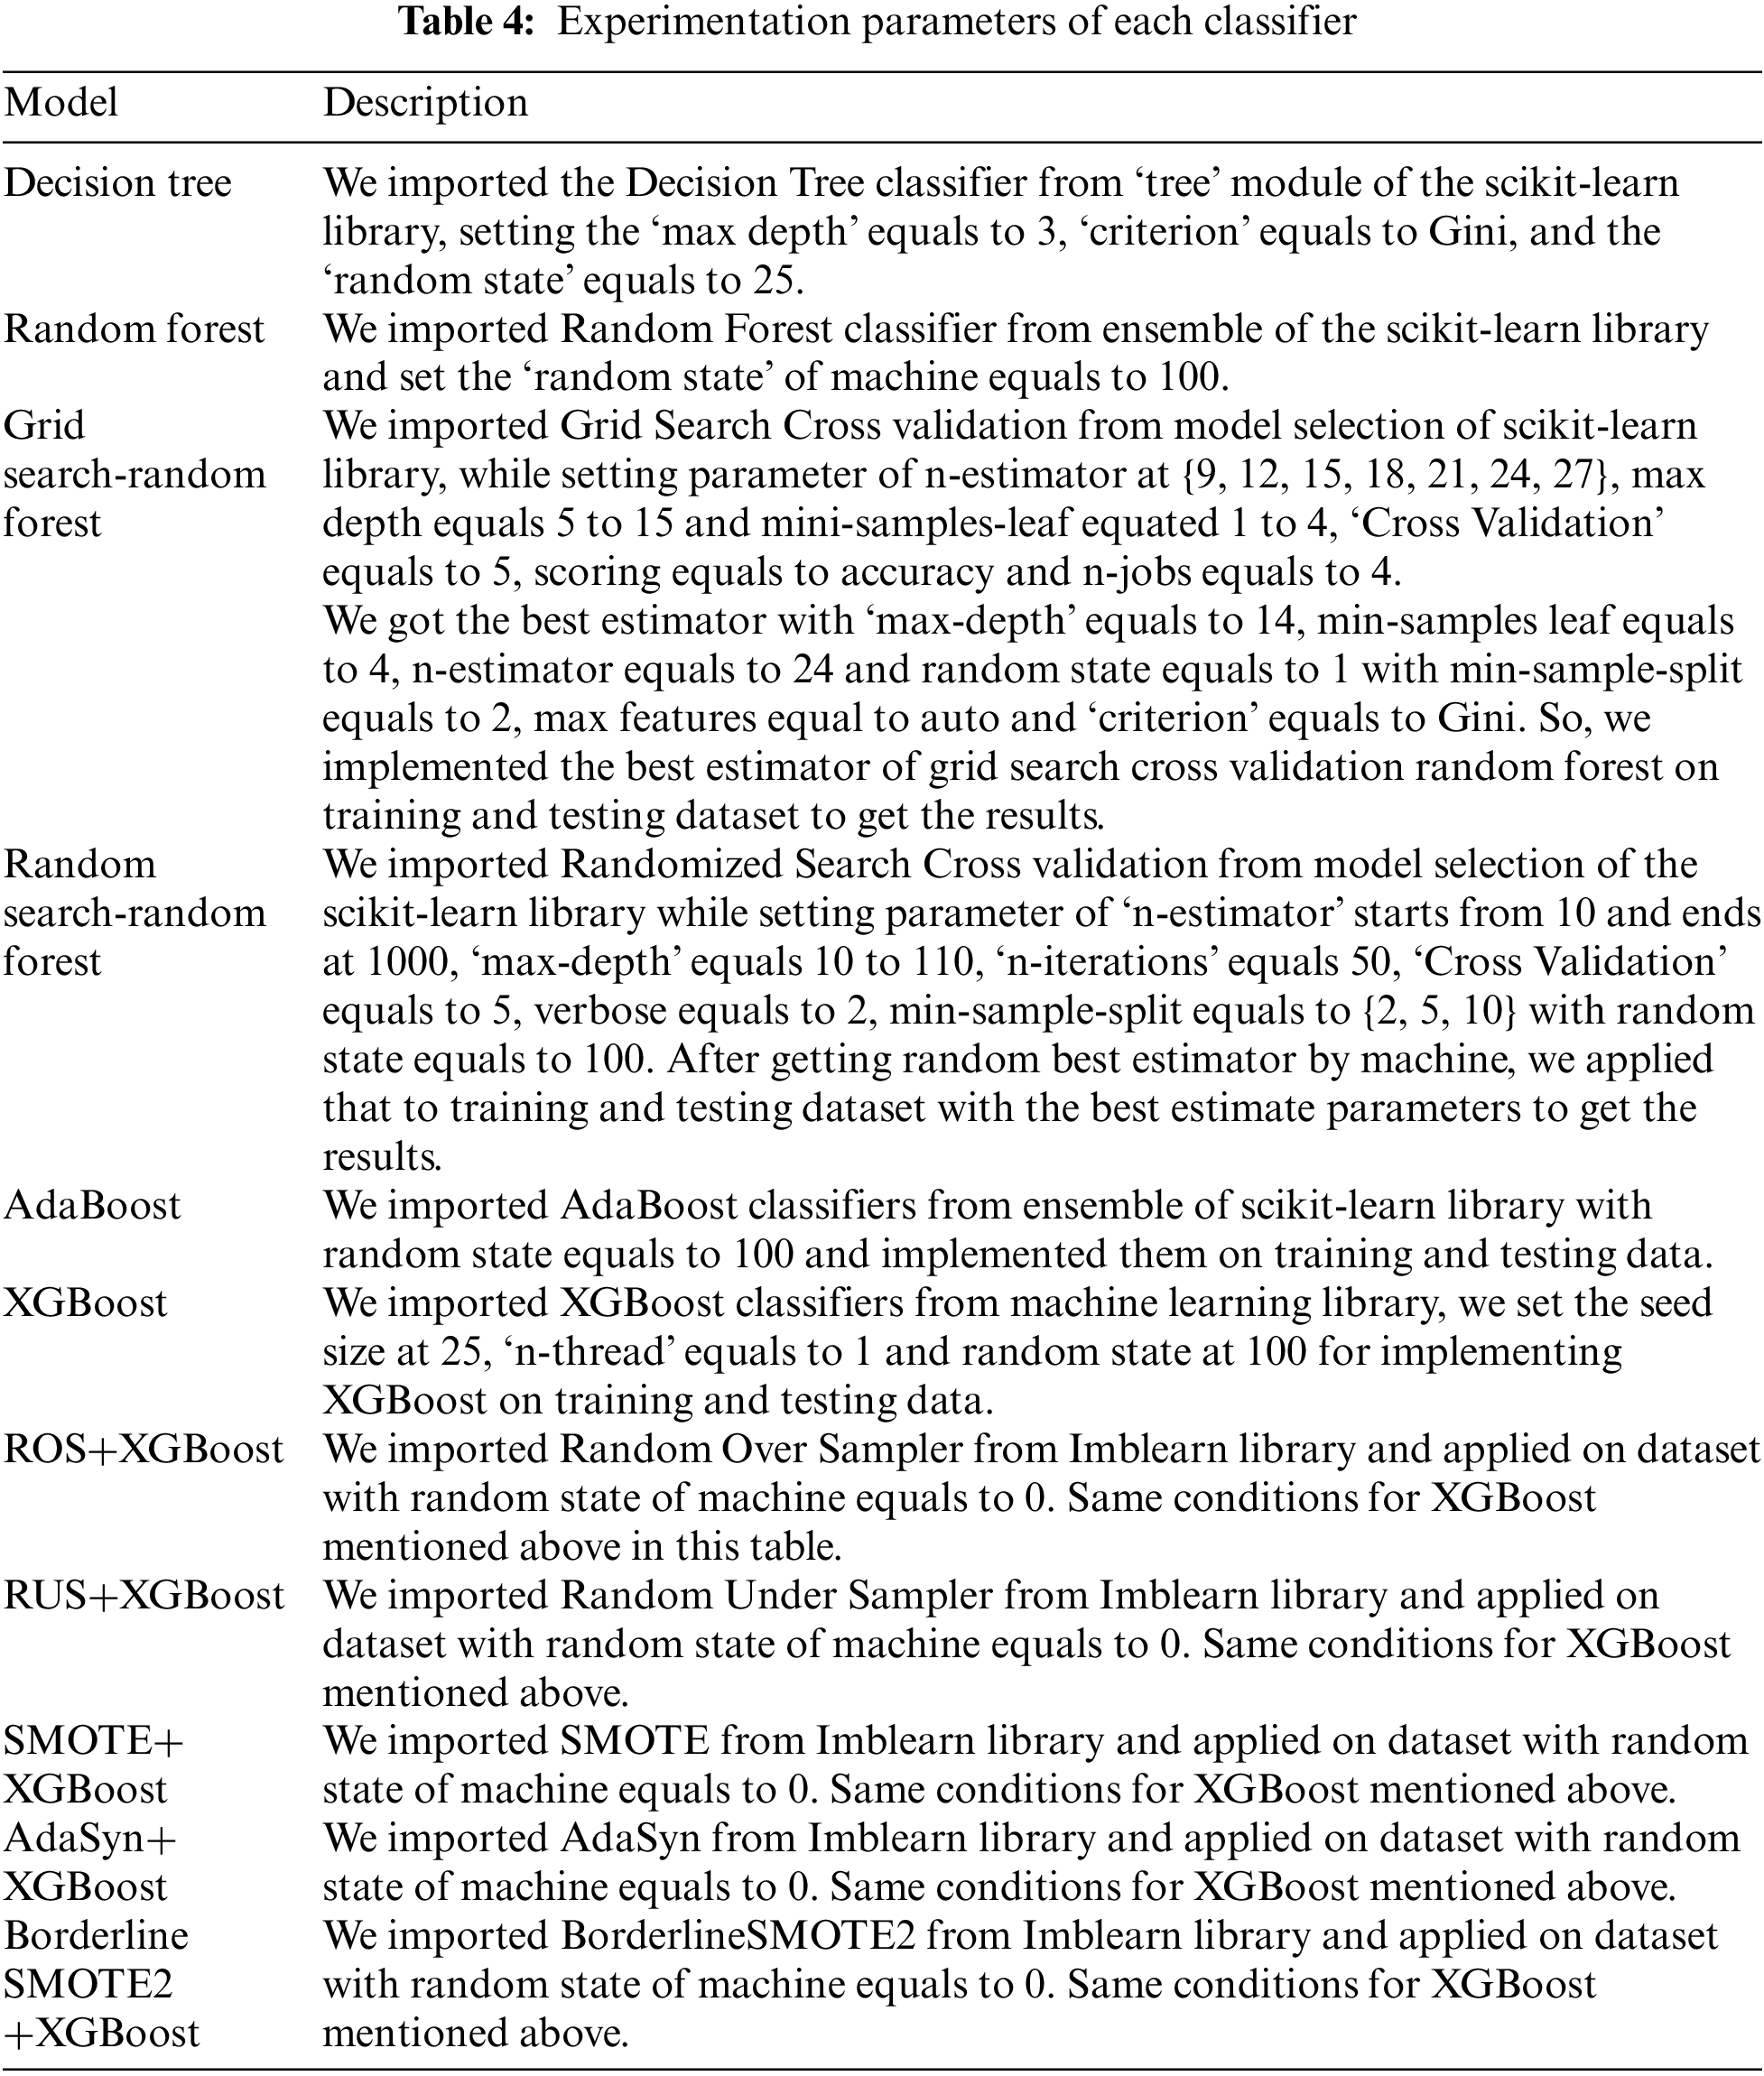
After EDA and feature engineering, we split our dataset into training and testing data for the implementation and performance evaluation of classifiers under supervised learning. For this purpose, we imported the train-test split function from the model selection module of the Scikit-Learn Library. We split the data into a 70:30 proportion, where 70% of the data was used for training, and 30% was used for testing under a random state of machine on 100. After splitting, the training dataset had 31,647 instances or values with 16 input variables or features and “y” as the output variable or target variable. For testing, we had 13,564 instances with the same input and output variables. Given that the experiment test bed conditions and system parameters, such as the random state and classifier parameters, can affect the results. Therefore, we conducted multiple iterations of experimentation using different classifiers and sampling techniques with varying parameters and the random state of the machine to obtain optimal results. Table 4 displays the random state of the machine and experiment parameters for each classifier or sampling technique that yielded the best results in our implementation.
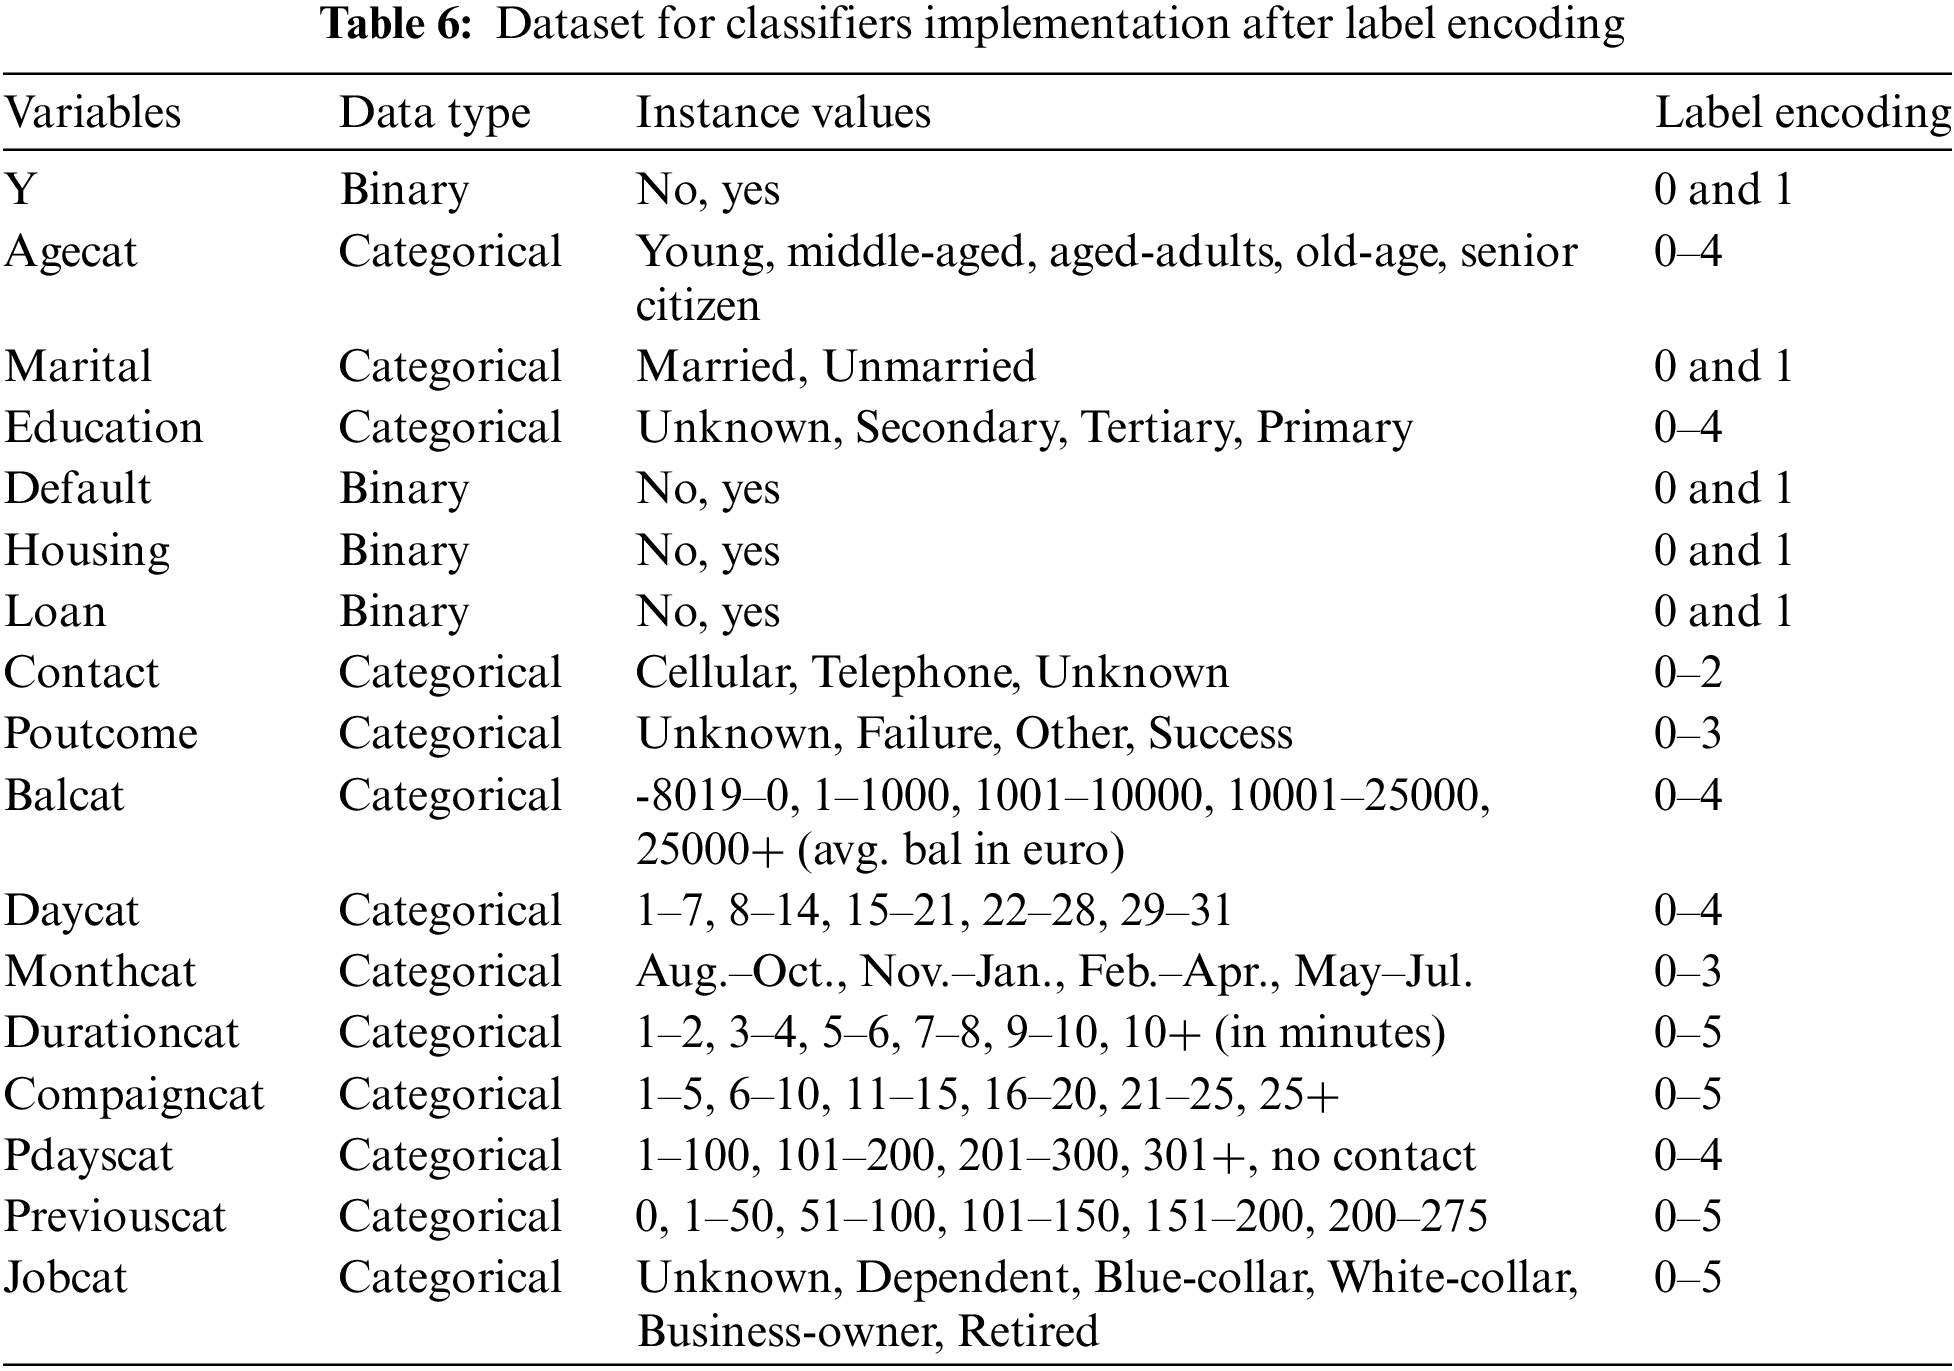
Label encoding was used for feature engineering as our dataset does not have high cardinality, which could lead to overfitting. Label encoding makes it easier for algorithms to interpret and understand categorical data within a distinct number of categories. By applying label encoding, each category is represented by a unique integer, sometimes ordinal in nature [28]. In our dataset [12] ‘Marital’ had three distinct values of “married”, “single”, and “divorced”, which were changed to 0, 1, and 2 after label encoding to simplify the classifier’s task. We also used a fundamental set of data categorisation techniques in data analysis and data engineering for classifier implementation. For classification purpose, the data categorisation process involves organising and grouping data into meaningful categories or classes based on certain criteria or class attribute patterns. Data categorising entails training a model to forecast the category or class to which new data points pertain [28].
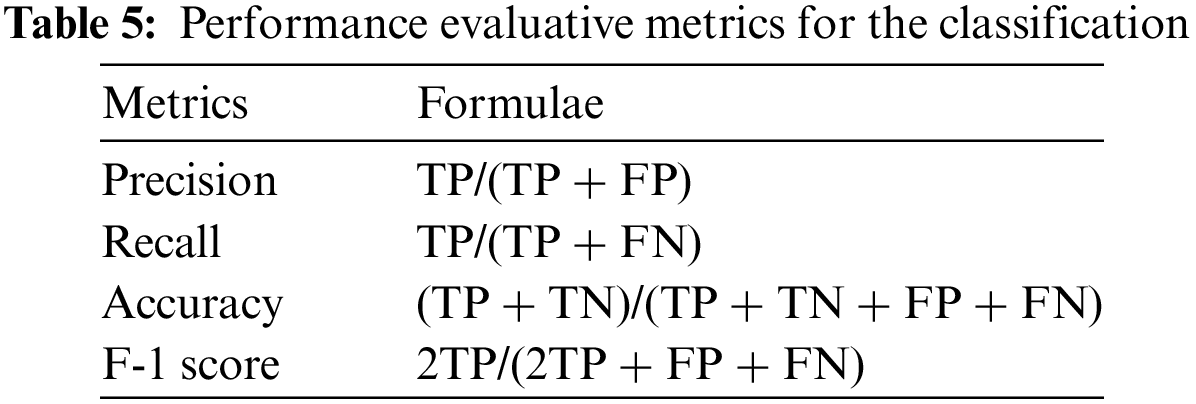
Fig. 5 and Table 5 show the confusion matrix, which plays a crucial role in classifier evaluation [10]. After reading the related work and considering the highly imbalanced target variable, DT, RF, GS-RF, RS-RF, AdaBoost, and XGBoost were chosen as initial classifiers for implementation, while Precision, Recall, Accuracy, F-1 score, and AUC were selected as metrics for performance evaluation.
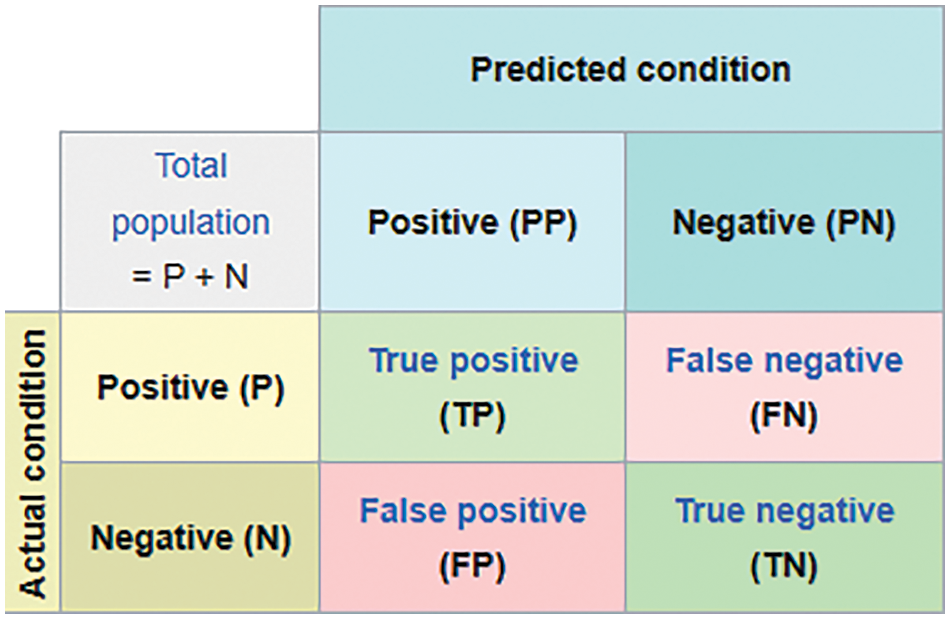
Figure 5: Confusion matrix of a classifier
4.1 Data Analysis with Label Encoding
Our results are divided into two parts. Firstly, we present the data analysis results, which include EDA, visualisation, and feature engineering. The second part holds classification results and their evaluation based on different metrics. The data analysis involved EDA and data visualisation to understand the emerging dataset patterns. In a basic exploratory analysis, we used different data-frame methods and functions [24,25] to gain a fundamental understanding of each column’s data values commonly called instances, including the target variable. The exploratory analysis reveals that our dataset has 45,211 instances and 17 variables or features. The “y” column is our target variable, and the other 16 are the input variables. It is necessary for classification under a supervised learning environment to have labelled dataset. The results indicate that there are no missing values, with different data types. In the ‘age’ column, the minimum and maximum ages are 18 and 95 years, respectively, however shows right skewness among instances. The results show that 2085 counts of age 32 appear in the age column, which is the highest. Minute counts of age above 75 years in our dataset.
Meanwhile, there are 12 unique categories in the ‘job’ input variable, with the highest counts of the blue-collar category. Three unique categories appear in the ‘marital’ column, with most of the instances indicating a married status. Our target variable has two unique categories, with 5289 counts of “yes” and 39,922 counts of “no”, indicating a highly imbalanced distribution in the target variable. The percentage proportion reveals that less than 12% of individuals have a “yes” value, making this group crucial for devising future strategies for target marketing or offering new products. The visualisation analysis includes plots of various input variables, both individually and in relation to the target variable. Some plots show counts, while others display the percentage proportion of values in the dataset, which can help us to understand hidden trends and overall patterns. Selected visualisation results are shown in Fig. 6a,b for reference.
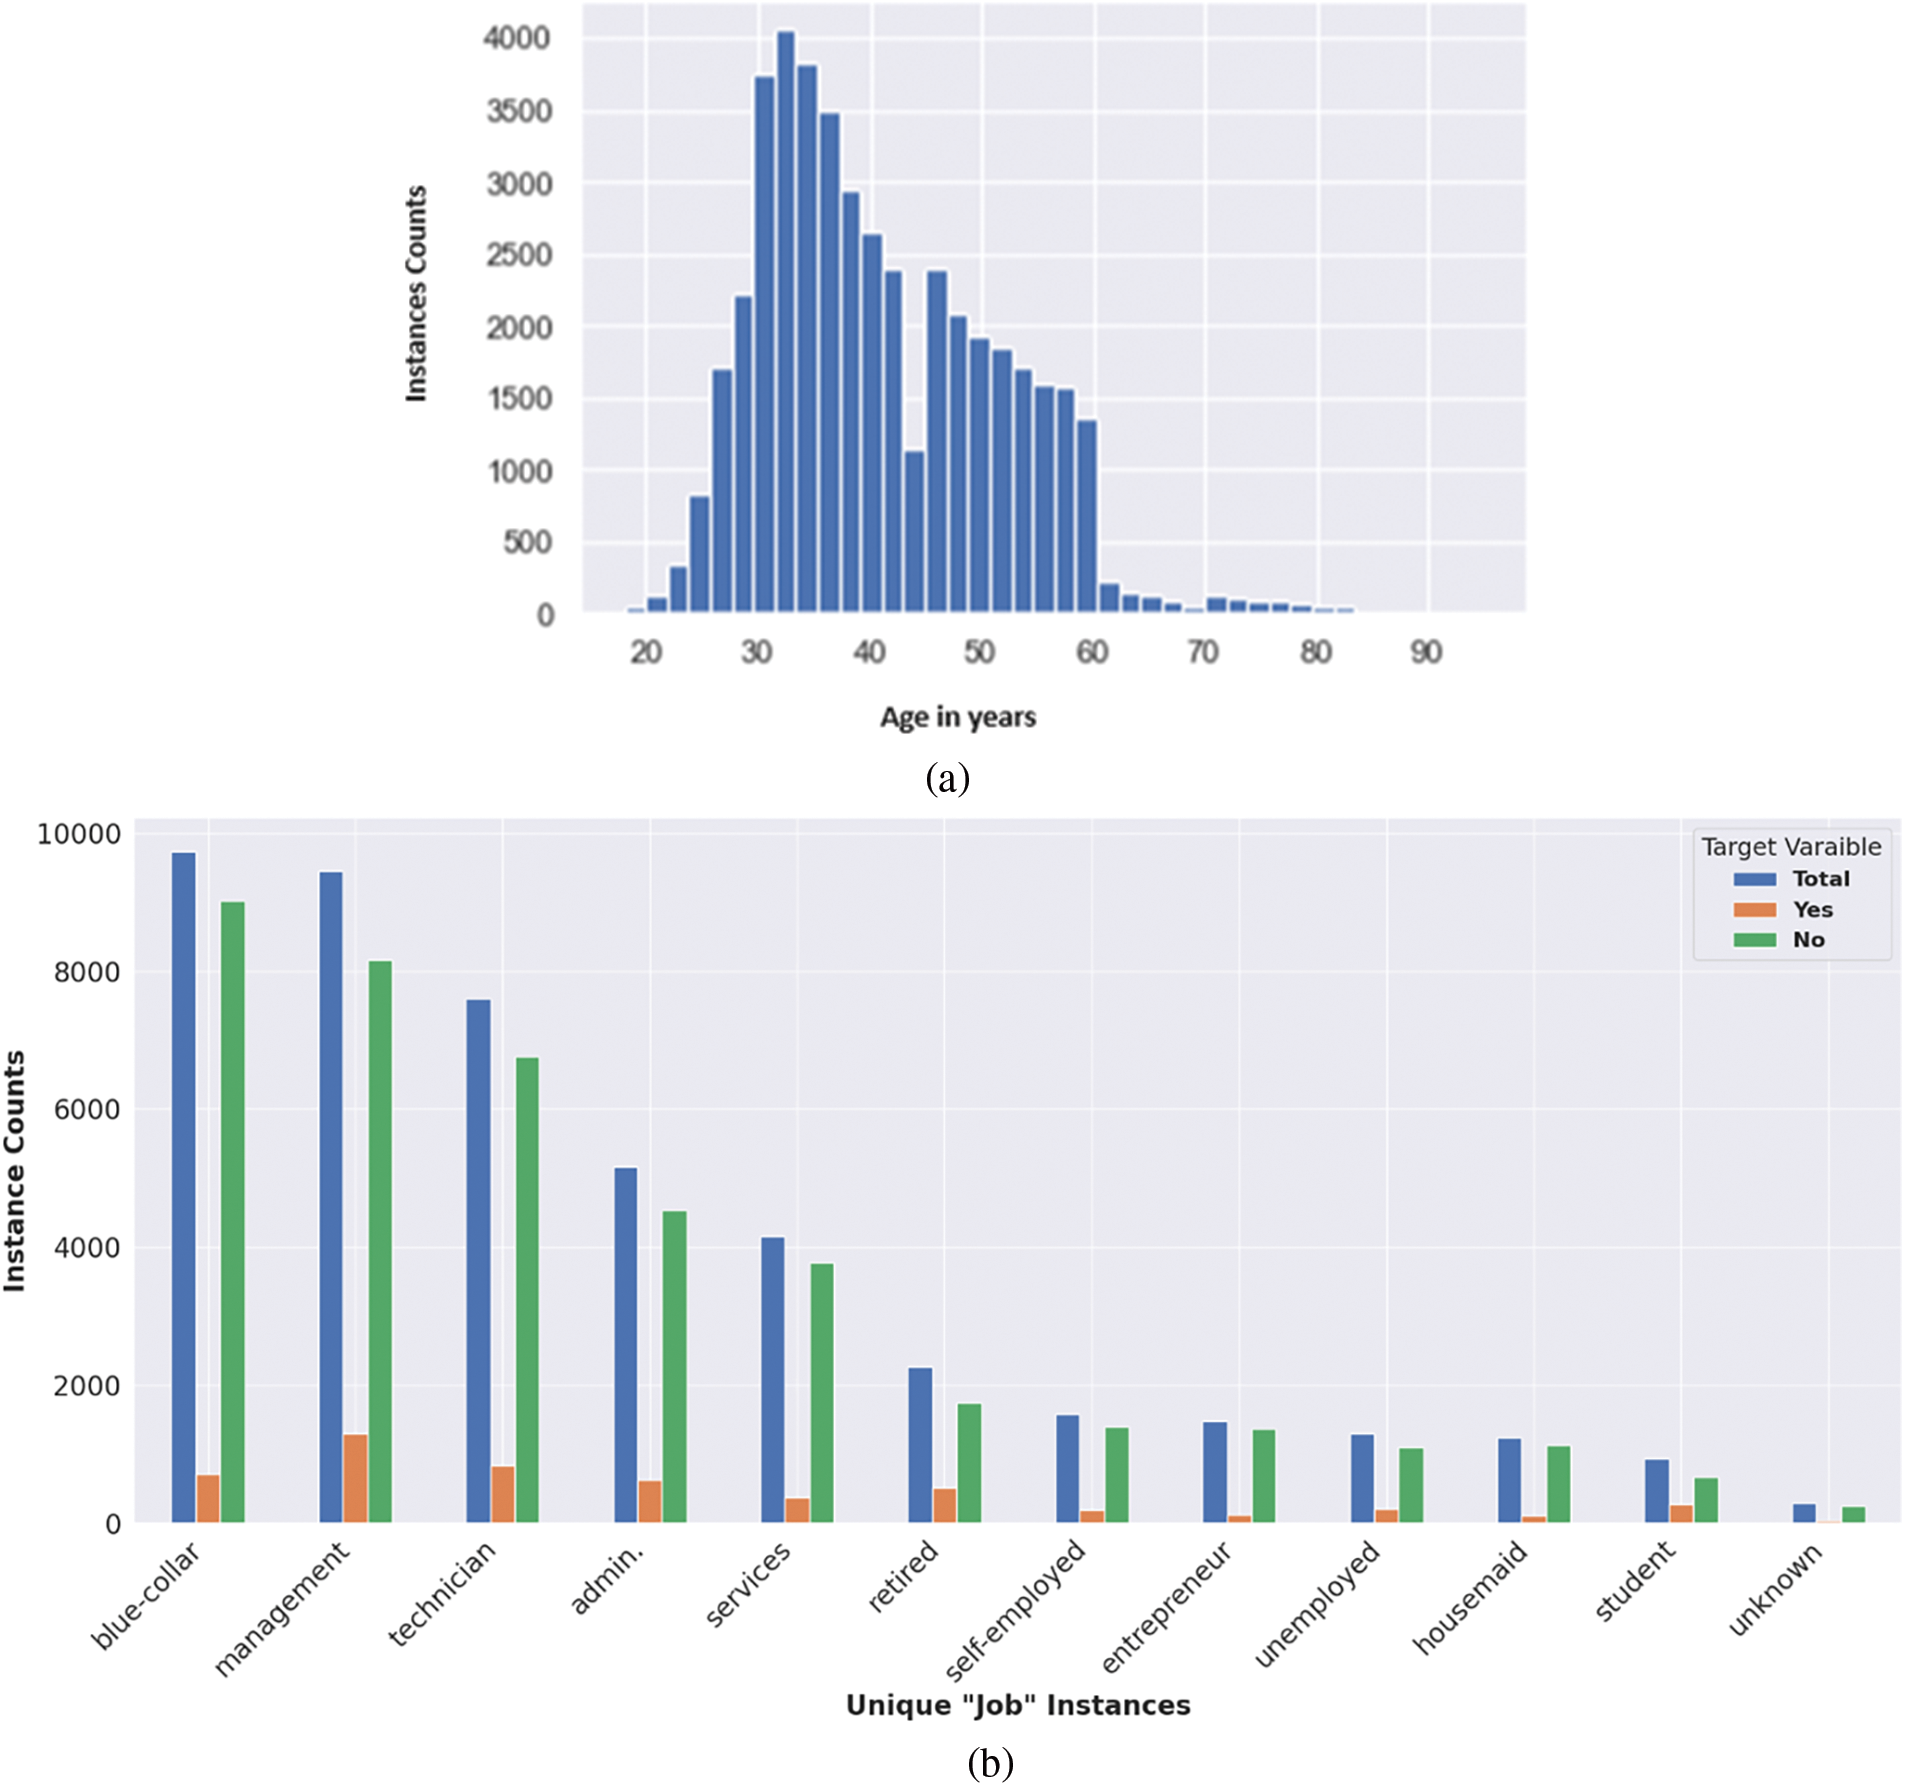
Figure 6: (a) Visualisation of right-skewed “Age” variable. (b) Visualization result of “Job” variable with counts of “y” variable
After EDA and data visualisation, we transformed the dataset through feature engineering (i.e., binning and label encoding). The final data set, after label encoding, has all data columns representing feature values in the form of 0, 1, 2, 3, 4, and 5, as shown in Fig. 7 and Table 6.
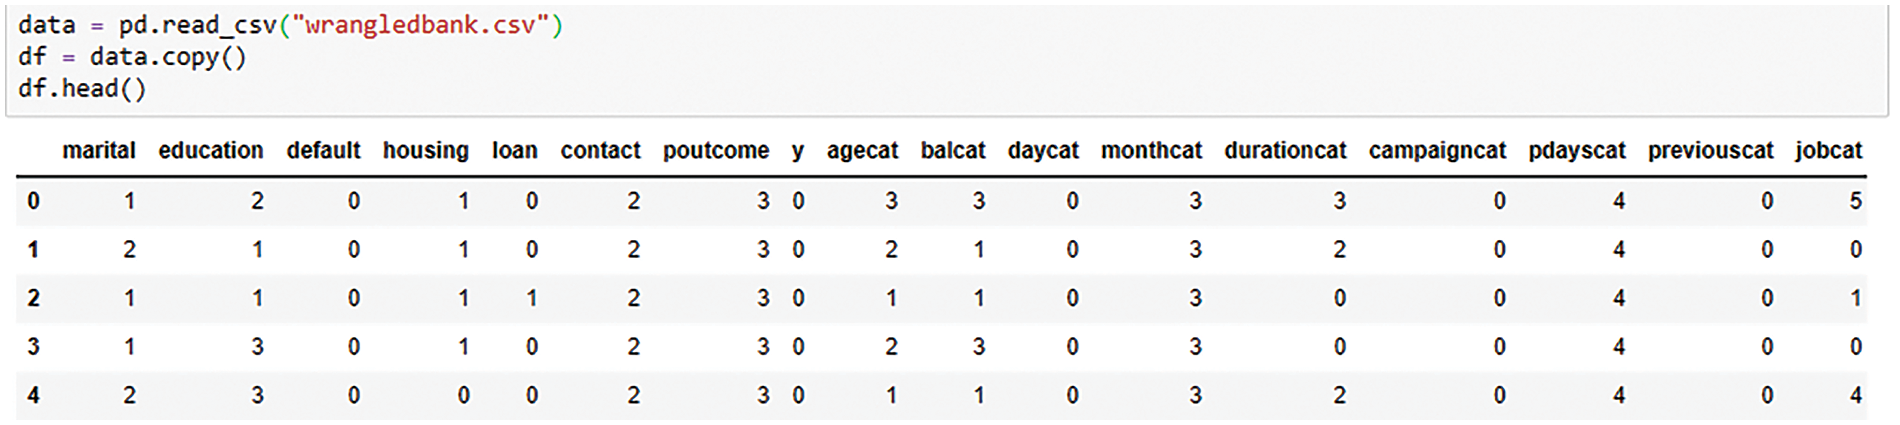
Figure 7: Data categorisation and Label Encoding results
Using the post-analysis processed dataset, we evaluated the performance of the implemented classic classifiers in terms of Accuracy, Precision, Recall, F-1 score, and AUC score. According to the confusion matrix, the accuracies of all classifiers are good; however, in our case, the F-1 score is a more important metric, where XGBoost and RS-RF performed well on a highly imbalanced target variable dataset. Furthermore, the values of Precision, Recall, and F-1 score for predicting a “yes” target value are not as good across all the classifiers used, compared with the “no” target value of target variable. AUC score is good for all classifiers, but XGBoost shows better results on the F-1 score in our case. The AUC score for GS-RF, RS-RF, and XGBoost is approximately 90% which is exceptionally good. Once again features ‘durationcat’ and ‘contact’ have proved to be the most prominent feature in our implementation results as shown in Fig. 9 [25]. Table 7 and Figs. 8 and 9 show the complete results for evaluation.
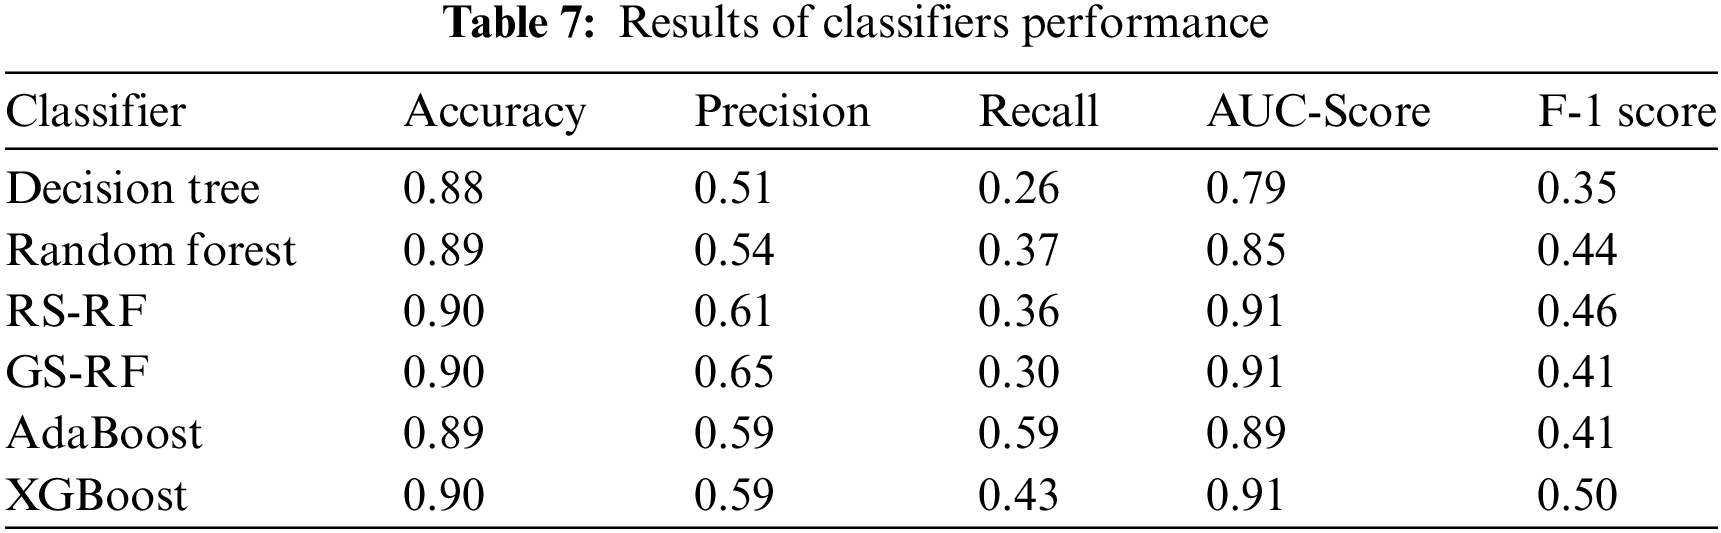
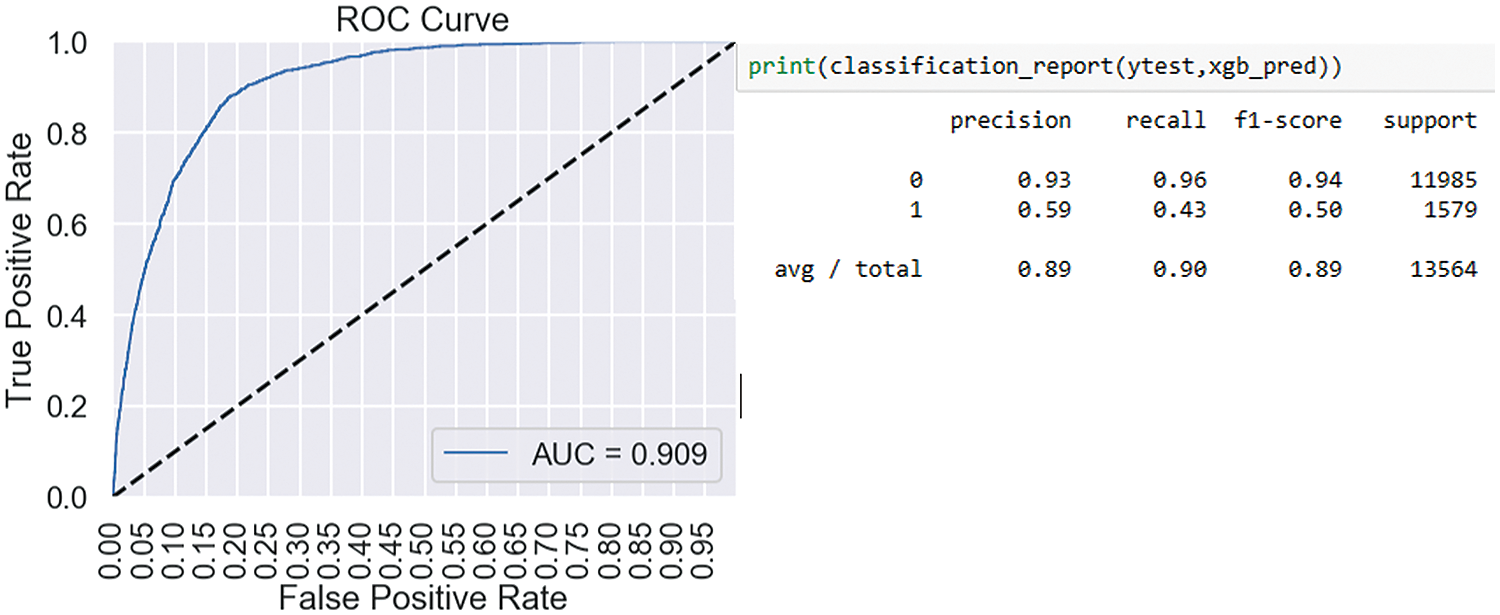
Figure 8: Result of XGBoost classifier
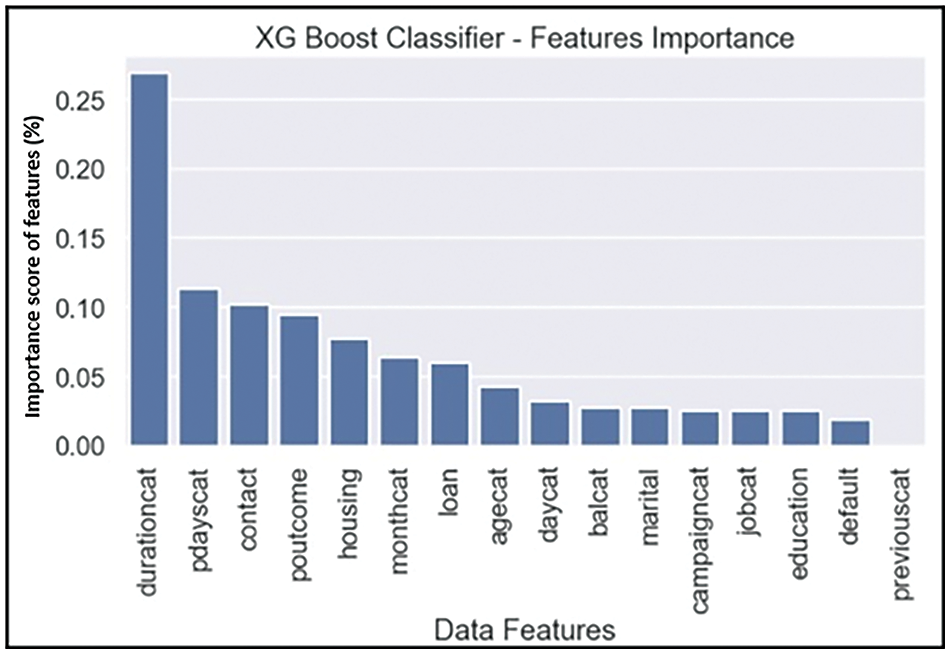
Figure 9: Feature importance graph result
Given our highly imbalanced target variable, predicting positive outcomes accurately is important. The F-1 scores of all implemented classifiers fell short; however, XGBoost yielded better results than the other classifiers. Therefore, we used XGBoost as the baseline classifier with the implementation of sampling techniques on the imbalanced dataset.
4.3 Classification Results with Sampling Techniques
Imbalanced big data classification has been acknowledged as a machine learning problem [13]. As shown in Table 7, while XGBoost outperformed the others in terms of the F-1 score, it still fell short of expectations. Therefore, we implemented XGBoost as a baseline classifier on the dataset processed with different sampling techniques to handle the imbalanced dataset. Our implementation results show that the performance of XGBoost as a baseline classifier increased on the dataset treated with the Borderline SMOTE2 sampling technique. The AUC score and Recall values also showed an improvement. The feature ‘durationcat’; after feature engineering proved to be the most important among feature space. Table 8 and Figs. 9–11 show the complete result for evaluation of Borderline SMOTE2+XGBoost performance. Fig. 11 shows the feature importance score derived by the model.
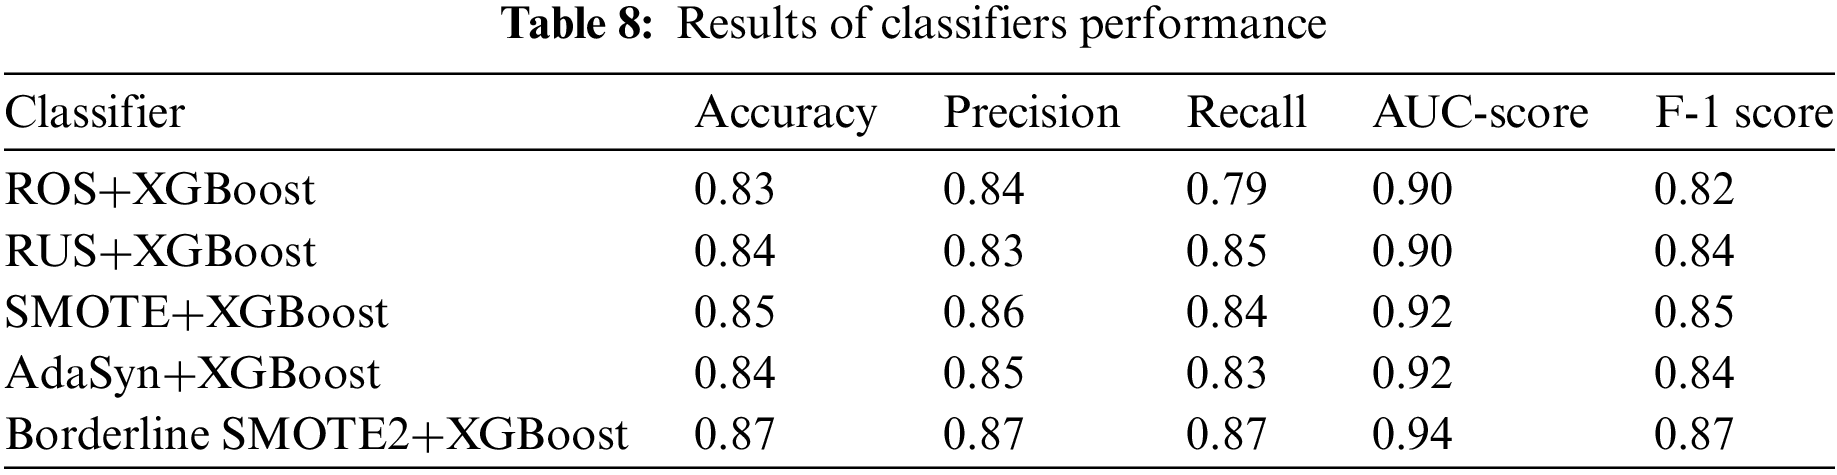
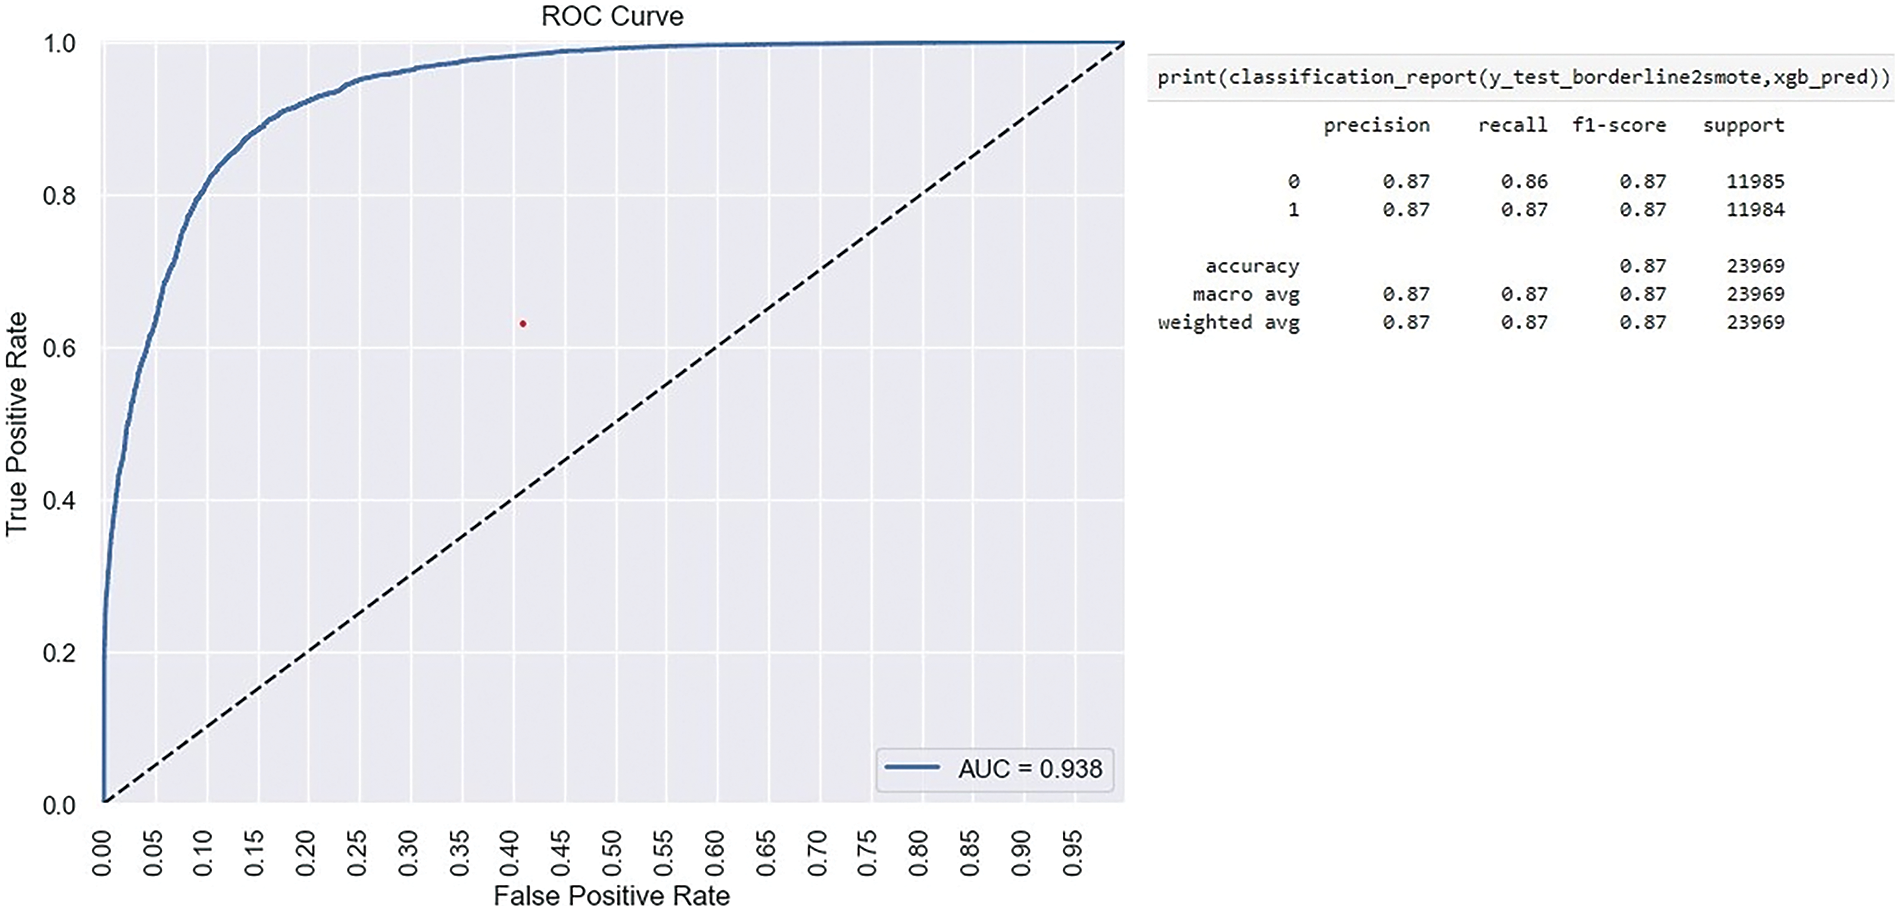
Figure 10: Result of XGBoost classifier
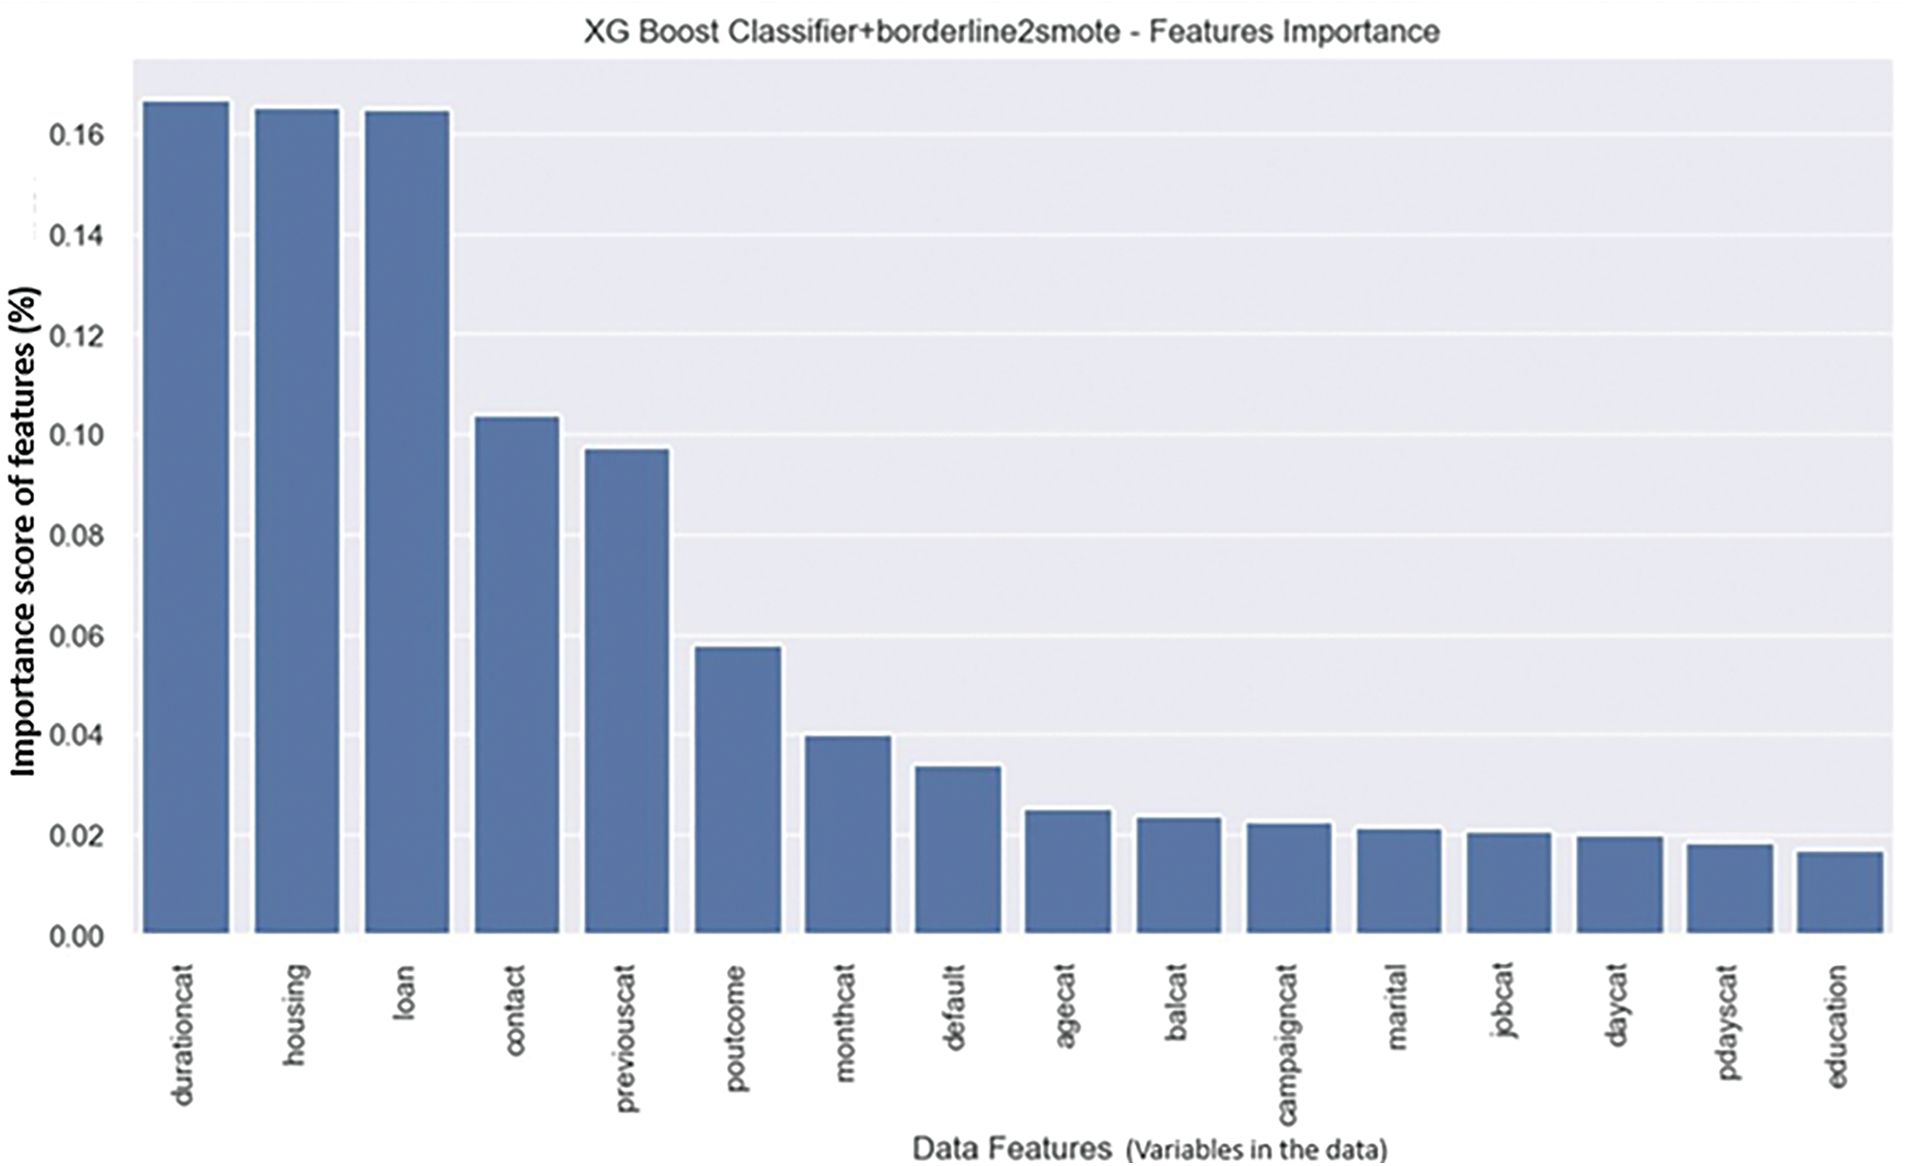
Figure 11: Feature importance graph result
After applying different sampling techniques to the dataset, the performance of the XGBoost classifier significantly improved across all performance metrics. The bank marketing dataset was classified using XGBoost after applying BorderlineSMOTE2, and it performed well on all selected metrics. A score of 0.94 on AUC and 0.87 on F-1 score demonstrates the improvement in XGBoost’s performance. Previously, the F-1 score of XGBoost was 0.51 on imbalanced dataset without the implementation of any sampling techniques. The feature ‘durationcat’ proved to be the most important feature among the datasets.
Key insights obtained from bank marketing data after data analysis help in decision-making and formulation of marketing strategies. Data-driven decision-making helps the bank stay ahead of its competitors and plan for both the short and long term while making informed decisions. It also helps to identify key features and hidden patterns for formulating an effective marketing strategy, which could be a win-win proposition for both the bank and the customer. Our results highlight the key and notable features of the bank marketing data, which are critical for data-driven decision-making. The data features ‘durationcat’, ‘housing’, and ‘loan’ are critical and prominent in deciding the decision-making strategy for targeted marketing.
This study addressed the research questions by reviewing multiple data analysis techniques to highlight patterns and hidden insights from a quantitative dataset. Analysis methods are implemented to identify the correlation among variables of the dataset. Exploratory data analysis results highlighted the presence of highly imbalanced target variables with 88.30% of ‘no’ values and 11.70% of ‘yes’ values. For data pre-processing, we implemented data cleaning, feature engineering, and label encoding to transform the data for classifiers implementation. Furthermore, we implemented classifiers recommended by the recent literature, selecting after SLR. Moreover, we treated the imbalanced data with sampling techniques to handle the imbalance phenomenon. BorderlineSMOTE2 sampling technique enhanced the performance of XGBoost from 0.51 to 0.87 on the F-1 score and 0.94 from 0.91 on the AUC score.
While findings of implemented classifiers, recommended in studies [4,10] showed good accuracy, their recall and precision values fell short in predicting the minority class (1 or “yes” target value) before the implementation of sampling techniques. The AUC score for GS-RF, RS-RF, and XGBoost was approximately 90%, indicating excellent performance. Given our highly imbalanced target variable with only 11.69% representing the minority class, F-1 score becomes a crucial performance metric, where XGBoost performs positively compared to other classic classifiers used. Upon applying BorderlineSMOTE2, the performance of the XGBoost experienced a significant enhancement when using the sampled dataset. The F-1 score surged from 0.51 to 0.87 and the AUC score enhanced to 0.94 from 0.91. The combination of BorderlineSMOTE2 with XGBoost yielded positive results, exhibiting minimal overfitting and reduced data loss. Most of our findings align with prior research documented in reviewed studies [4,10,11].
In our future research, we will address the challenge imposed by the limited availability of banking datasets, primarily due to concerns about security and privacy. Our approach will involve exploring alternative methodologies and strategies to acquire larger-scale datasets from the banking industry, which will encompass an increased number of features and instances. This expansion will enable us to conduct a more comprehensive evaluation of the performance exhibited by supervised learning models. Furthermore, our future work will focus on the development of novel models that integrate optimisation techniques, sampling methods, and machine learning models specifically tailored to the unique characteristics of banking big data. By seamlessly combining these components, we aim to contribute significantly to the classification of imbalanced datasets prevalent in the banking domain. Ultimately, this research direction will facilitate and enhance data-driven decision-making processes within the banking industry.
Acknowledgement: The authors would like to extend their gratitude to the Kimberlin Library Administration and the Faculty of Computing, Engineering, and Media at De Montfort University for providing the space and resources essential to completing this research study.
Funding Statement: This research received support from the Cyber Technology Institute (CTI) at the School of Computer Science and Informatics, De Montfort University, United Kingdom, along with financial assistance from Universiti Tun Hussein Onn Malaysia and the UTHM Publisher’s office through publication fund E15216.
Author Contributions: Study, conception, design, interpretation of results, manuscript preparations: Fahim Nasir. Conception, design, resources, writing review & editing: Abdulghani Ali Ahmed. Visualisation, funding acquisition: Mehmet Sabir Kiraz. Reviewed the implementation and concluding results while administrating this project: Iryna Yevseyeva. Resources, writing review & editing, funding acquisition: Mubarak Saif. All authors reviewed the results and approved the final version of the manuscript.
Availability of Data and Materials: A bank marketing data set is publicly available for use on University of California, Irvine (UCI) repository [12] and recommended for classification studies.
Ethics Approval: Not applicable.
Conflicts of Interest: The authors declare that they have no conflicts of interest to report regarding the present study.
References
1. H. Wu, J. L. Hung, and L. Liu, “Impact of big data analytics on banking: A case study,” J. Enterp. Inf. Manag., vol. 36, no. 2, pp. 459–479, Mar. 2023. [Google Scholar]
2. S. B. Kotsiantis, I. Zaharakis, and P. Pintelas, “Supervised machine learning: A review of classification techniques,” Emerg. Artif. Intell. Appl. Comput. Eng., vol. 160, no. 1, pp. 3–24, Apr. 2007. [Google Scholar]
3. X. Shu and Y. Ye, “Knowledge discovery: Methods from data mining and machine learning,” Soc. Sci. Res., vol. 110, Feb. 2023, Art. no. 102817. doi: 10.1016/j.ssresearch.2022.102817. [Google Scholar] [PubMed] [CrossRef]
4. P. Gupta, A. Varshney, M. R. Khan, R. Ahmed, M. Shuaib and S. Alam, “Unbalanced credit card fraud detection data: A machine learning-oriented comparative study of balancing techniques,” Procedia Comput. Sci., vol. 218, no. 1, pp. 2575–2584, Jan. 2023. doi: 10.1016/j.procs.2023.01.231. [Google Scholar] [CrossRef]
5. C. S. Lee, P. Y. S. Cheang, and M. Moslehpour, “Predictive analytics in business analytics: Decision tree,” Adv. Decis. Sci., vol. 26, no. 1, pp. 1–29, Sep. 2022. [Google Scholar]
6. A. M. Zaki, N. Khodadadi, W. H. Lim, and S. K. Towfek, “Predictive analytics and machine learning in direct marketing for anticipating bank term deposit subscriptions,” Am. J. Bus. Oper. Res., vol. 11, no. 1, pp. 79–88, Jan. 2024. doi: 10.54216/AJBOR.110110. [Google Scholar] [CrossRef]
7. M. Binjubeir, A. A. Ahmed, M. A. B. Ismail, A. S. Sadiq, and M. K. Khan, “Comprehensive survey on big data privacy protection,” IEEE Access, vol. 8, pp. 20067–20079, Mar. 2019. doi: 10.1109/ACCESS.2019.2962368. [Google Scholar] [CrossRef]
8. T. Watthaisong, K. Sunat, and N. Muangkote, “Comparative evaluation of imbalanced data management techniques for solving classification problems on imbalanced datasets,” Stat. Optim. Inf. Comput., vol. 12, no. 2, pp. 547–570, Jan. 2024. doi: 10.19139/soic-2310-5070-1890. [Google Scholar] [CrossRef]
9. S. B. S. Lai, N. H. N. B. M. Shahri, M. B. Rahman, and A. B. Rambli, “Comparing the performance of AdaBoost, XGBoost, and logistic regression for imbalanced data,” Math. Stat., vol. 9, no. 3, pp. 379–385, Nov. 2021. doi: 10.13189/ms.2021.090320. [Google Scholar] [CrossRef]
10. T. Wongvorachan, S. He, and O. Bulut, “A comparison of undersampling, oversampling, and SMOTE methods for dealing with imbalanced classification in educational data mining,” Information, vol. 14, no. 1, Jan. 2023, Art. no. 54. doi: 10.3390/info14010054. [Google Scholar] [CrossRef]
11. V. Werner de Vargas, J. A. Schneider Aranda, R. Dos Santos Costa, P. R. Da Silva Pereira, and J. L. Victória Barbosa, “Imbalanced data preprocessing techniques for machine learning: A systematic mapping study,” Knowl. Inf. Syst., vol. 65, no. 1, pp. 31–57, 2023. doi: 10.1007/s10115-022-01772-8. [Google Scholar] [PubMed] [CrossRef]
12. S. Moro, P. Rita, and P. Cortez, “Bank marketing,” in UCI Machine Learning Repository, 2014. doi: 10.24432/C5K306. [Google Scholar] [CrossRef]
13. C. Vairetti, J. L. Assadi, and S. Maldonado, “Efficient hybrid oversampling and intelligent undersampling for imbalanced big data classification,” Expert. Syst. Appl., vol. 246, pp. 123–149, Jul. 2024. [Google Scholar]
14. F. Dakalbab, M. A. Talib, Q. Nassir, and T. Ishak, “Artificial intelligence techniques in financial trading: A systematic literature review,” J. King Saud Univ.—Comput. Inf. Sci., vol. 36, no. 3, Mar. 2024, Art. no. 102015. doi: 10.1016/j.jksuci.2024.102015. [Google Scholar] [CrossRef]
15. J. P. Bharadiya, “A comparative study of business intelligence and artificial intelligence with big data analytics,” Am. J. Artif. Intell., vol. 7, no. 1, p. 24, Jun. 2023. [Google Scholar]
16. S. Dridi, “Supervised learning–A systematic literature review,” Dec. 2021. doi: 10.31219/osf.io/tysr4. [Google Scholar] [CrossRef]
17. B. F. Azevedo, A. M. A. Rocha, and A. I. Pereira, “Hybrid approaches to optimization and machine learning methods: A systematic literature review,” Mach. Learn., vol. 113, no. 7, pp. 4055–4097, Jan. 2024. doi: 10.1007/s10994-023-06467-x. [Google Scholar] [CrossRef]
18. N. Kumar, K. Tomar, T. Sharma, P. Jyala, D. Malik and I. Dawar, “Customer behaviour-based fraud detection of credit card using a random forest algorithm,” in 2023 Int. Conf. Artif. Intell. Appl. (ICAIA) Alliance Technol. Conf. (ATCON-1), Bangalore, India, Apr. 21–22, 2023, pp. 1–5. doi: 10.1109/ICAIA57370.2023. [Google Scholar] [CrossRef]
19. S. Chowdhury and M. P. Schoen, “Research paper classification using supervised machine learning techniques,” in 2020 Intermountain Eng., Technol. Comput. (IETC), Orem, UT, USA, IEEE, Oct. 2–3, 2020, pp. 1–6. [Google Scholar]
20. F. Y. Osisanwo, J. E. T. Akinsola, O. Awodele, J. O. Hinmikaiye, O. Olakanmi and J. Akinjobi, “Supervised machine learning algorithms: Classification and comparison,” Int. J. Comput. Trends Technol. (IJCTT), vol. 48, no. 3, pp. 128–138, Jun. 2017. doi: 10.14445/22312803/IJCTT-V48P126. [Google Scholar] [CrossRef]
21. R. Saravanan and P. Sujatha, “A state of art techniques on machine learning algorithms: A perspective of supervised learning approaches in data classification,” in 2018 Second Int. Conf. Intell. Comput. Control Syst. (ICICCS), Madurai, India, IEEE, Jun. 14–15, 2018, pp. 945–949. [Google Scholar]
22. A. Borodulin, A. Gladkov, A. Gantimurov, V. Kukartsev, and D. Evsyukov, “Using machine learning algorithms to solve data classification problems using multi-attribute dataset,” BIO Web Conf., vol. 84, Jan. 2024, Art. no. 02001. doi: 10.1051/bioconf/20248402001. [Google Scholar] [CrossRef]
23. M. E. Lokanan, “Predicting money laundering using machine learning and artificial neural networks algorithms in banks,” J. Appl. Secur. Res., vol. 19, no. 1, pp. 20–44, Aug. 2022. doi: 10.1080/19361610.2022.2114744. [Google Scholar] [CrossRef]
24. Y. Wu, “Big data project-bank marketing campaign,” Rev. Appl. Socio-Econ. Res., vol. 21, no. 1, pp. 99–110, 2021. [Google Scholar]
25. S. Moro, R. Laureano, and P. Cortez, “A data driven approach to predict the success of bank telemarketing,” Decis. Support Syst., vol. 62, no. 3, pp. 22–31, Jun. 2014. doi: 10.1016/j.dss.2014.03.001. [Google Scholar] [CrossRef]
26. K. Wlodarczyk and K. S. Ikani, “Data analysis of a Portuguese marketing campaign using bank marketing dataset,” 2020, Accessed: Aug. 10, 2023. [Online]. Available: https://www.researchgate.net/publication/339988208 [Google Scholar]
27. C. Xie, J. L. Zhang, Y. Zhu, B. Xiong, and G. J. Wang, “How to improve the success of bank telemarketing? Prediction and interpretability analysis based on machine learning,” Comput. Indus. Eng., vol. 175, Jan. 2023, Art. no. 108874. doi: 10.1016/j.cie.2022.108874. [Google Scholar] [CrossRef]
28. S. Suthaharan, “Machine learning models and algorithms for big data classification,” Integr Ser. Inf. Syst., vol. 36, pp. 1–12, 2016. doi: 10.1007/978-1-4899-7641-3. [Google Scholar] [CrossRef]
Cite This Article
 Copyright © 2024 The Author(s). Published by Tech Science Press.
This work is licensed under a Creative Commons Attribution 4.0 International License , which permits unrestricted use, distribution, and reproduction in any medium, provided the original work is properly cited.
 Downloads
 Citation Tools