
 Submit a Paper
 Propose a Special lssue
 Open Access
ARTICLE

Paraelectric Doping Simultaneously Improves the Field Frequency Adaptability and Dielectric Properties of Ferroelectric Materials: A Phase-Field Study
1 School of Materials Science and Engineering, Collaborative Innovation Center of Ministry of Education and Shanxi Province for High-Performance Al/Mg Alloy Materials, North University of China, Taiyuan, 030051, China
2 Beijing Advanced Innovation Center for Materials Genome Engineering, University of Science and Technology Beijing, Beijing, 100083, China
3 Institute of Materials Intelligent Technology, Liaoning Academy of Materials, Shenyang, 110004, China
* Corresponding Author: Yuhong Zhao. Email:
(This article belongs to the Special Issue: Multiscale Computational Methods for Advanced Materials and Structures)
Computers, Materials & Continua 2024, 81(1), 213-228. https://doi.org/10.32604/cmc.2024.055169
Received 19 June 2024; Accepted 13 September 2024; Issue published 15 October 2024
 View Full Text
 Download PDF
Abstract
Recent years, the polarization response of ferroelectrics has been entirely studied. However, it is found that the polarization may disappear gradually with the continually applied of electric field. In this paper, taking K0.48Na0.52NbO3(KNN) as an example, it was demonstrated that the residual polarization began to decrease when the electric field frequency increased to a certain extent using a phase-field methods. The results showed that the content of out-of-plane domains increased first and then decreased with the increase of applied electric field frequency, the maximum polarization disappeared at high frequencies, and the hysteresis loop became elliptical. In order to further study the abnormal changes of hysteresis loops of ferroelectrics under high electric field frequency, we analyzed the hysteresis loop and dielectric response of solid solution 0.1SrTiO3-0.9K0.48Na0.52NbO3. It was found that the doped hysteresis loop maintained its shape at higher frequency and the dielectric constant increased. This kind of doping has a higher field frequency adaptability, which has a key guiding role in improving the dielectric properties of ferroelectric thin films and expanding the frequency application range of ferroelectric nano memory.Keywords
Adjusting the domain structure of ferroelectric thin films by varying the electric field frequency holds significant research implications for nano-electronics applications [1,2], including non-volatile memory [3], energy-related devices [4,5], and sensors [6]. Research has demonstrated that the electric field frequency influences the magnitude of the coercive field and the residual polarization [7–9]. Su et al. [10] showed that the frequency-dependent changes in the hysteresis loops of ferroelectric materials result from the direct competition between the velocity of polarization evolution and the velocity of the external load, observing elliptic hysteresis loops at high frequencies. Zhou et al. [11] also found that the residual polarization increases with frequency within a certain range until reaching a critical value. Zhang et al.’s [12] research indicated that domain structures exhibit higher sensitivity to epitaxial strain at low electric field frequencies, while the polarization vector faces difficulty in achieving a 180° switch at high frequencies due to the rapid alternation of the electric field. These studies collectively demonstrate that the electric field frequency dependence of ferroelectric thin films significantly impacts the domain structure, and the polarization response to the field frequency in most ferroelectric thin films exhibits a critical value. Doping may serve as an effective method to overcome this critical frequency [13].
Studies have shown that when the components of ferroelectric solid solutions vary within a certain range, the dielectric constant is related to the frequency, which also impacts the characteristic parameters of ferroelectric thin films [14]. In other words, chemical modification can affect the residual polarization and coercive force field of thin films [15]. Qi et al. [16] obtained ferroelectric materials with excellent comprehensive properties by using NaNbO3 doping to refine grains in BiFeO3-based solid solutions, demonstrating a similarity to the influence of frequency [17]. Therefore, composition changes may affect polarization at different frequencies [18]. K0.48Na0.52NbO3 (KNN) is a solid solution of the antiferroelectric NaNbO3 and ferroelectric KNbO3 [19], which has the potential for high residual polarization [20] and low coercive field, and exhibits good dielectric, electro-mechanical, and piezoelectric properties [21]. Additionally, KNN demonstrates significant polarization changes in the presence of an external electric field [22], and the introduction of SrTiO3 (STO) may enhance the relaxation behavior of KNN.
This study employs the phase-field method to simulate the domain structure of potassium sodium niobate (KNN) thin films under varying electric field frequencies. The results reveal a non-linear relationship between the out-of-plane domain and frequency, with the domain initially increasing and subsequently decreasing as the frequency changes. Based on these findings, the authors propose a method of doping strontium titanate (STO) to enhance the frequency adaptability of the electric field. The formation of a paraelectric-ferroelectric-antiferroelectric solid solution effectively overcomes the limitations of the original frequency stability while simultaneously improving the dielectric constant. This research provides valuable insights into optimizing the dielectric properties of ferroelectric materials and expanding their applicable frequency range in nano-ferroelectric devices.
The phase-field method has emerged as a prominent computational approach for predicting the evolution of nano and mesoscopic microstructures and properties during materials processes [23–26]. It is a computational technique that can calculate, simulate, and predict the spatiotemporal evolution of material microstructure [27–29]. In ferroelectric thin films, the results of domain and domain wall motion can be expressed by polarization [30–32]; thus, the polarization vector
where
In this expression,
Landau energy is commonly employed to characterize the inherent thermodynamic transformation of a material during a phase transition [34–36]. In the vicinity of the phase transition point, the system’s free energy is reduced, and the free energy density can be expanded in the parent phase by applying Landau’s theory of second-order phase transitions.
The Landau energy coefficient
The elastic energy density can be expressed as an integral of stress and strain,
where
The electrostatic energy density can be expressed as the integral of the electric field and the electric displacement,
In this formula,
The expression for the gradient energy can be written as follows:
where
In this work, all simulations are performed at
3 Simulation Results and Analysis
3.1 Evolution of Domain Structure at Different Frequencies
Fig. 1 illustrates the domain direction, where the R phase represents a rhomboid phase with its domain direction pointing out of the plane, the O phase is an orthogonal phase with its domain structure pointing in the plane, and the T phase is a tetragonal phase. The stable domain structure of KNN thin films at various frequencies is depicted in Fig. 2, with different colored areas indicating distinct electrical domains. The specific domain types are denoted on the right. Under a constant applied electric field, the domain structure remains stable without evolution. It is evident that eight types of domains are involved in the switching process, exhibiting a periodic change. Below a frequency of 0.001 step−1, the in-plane domain gradually decreases with increasing frequency, while the opposite trend is observed above this frequency. Fig. 3 presents the polarization vectors at different frequencies, where the direction of the in-plane vector remains nearly constant, and the change in the polarization vector solely involves the variation of the Z-axis polarization component as the electric field frequency increases. Additionally, numerous small-angle domain walls are observed at frequencies below 0.001 step−1, potentially resulting from the brief driving time of electrostatic energy. Similar domain phenomena occur at high frequencies. Before the critical frequency, the in-plane O domain content decreases with increasing frequency, while the out-of-plane R domain content increases. The O domain comprises O1+, O1−, O2+, and O2− domains, with the corresponding R phase domains being R1+, R3+, R4+, and R2+, respectively. Notably, the variation of these eight domains solely involves the Z-axis polarization component, aligning with the observed changes in the polarization vector diagram. The domain evolution process at high frequencies is the inverse of that at low frequencies. Although the types of domains involved remain consistent, the out-of-plane domain content decreases while the in-plane domain content increases, as shown in Fig. 4. Before a frequency of 0.01 step−1, the content of T1+, T1−, T2+, T2−, and other domains increases with rising frequency, potentially due to the gradual transformation of the out-of-plane component of the R domain to the in-plane component, resulting in a decrease in the Z-axis component. Above a frequency of 0.02 step−1, the Z-axis component increases due to the reduction of the O domain content, leading to an increase in the out-of-plane component of the R domain. Consequently, the content of the T3+ domain, which is a Z-axis component, also increases.
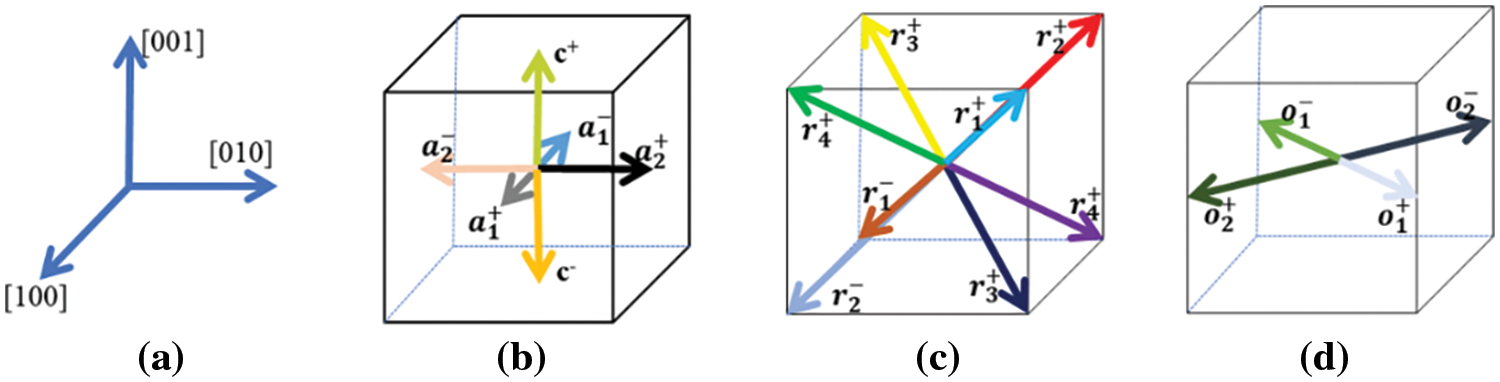
Figure 1: Schematic diagram of different electric domain orientations (a) Axis; polarization component of the (b) T domain (c) R domain (d) Partial O domain
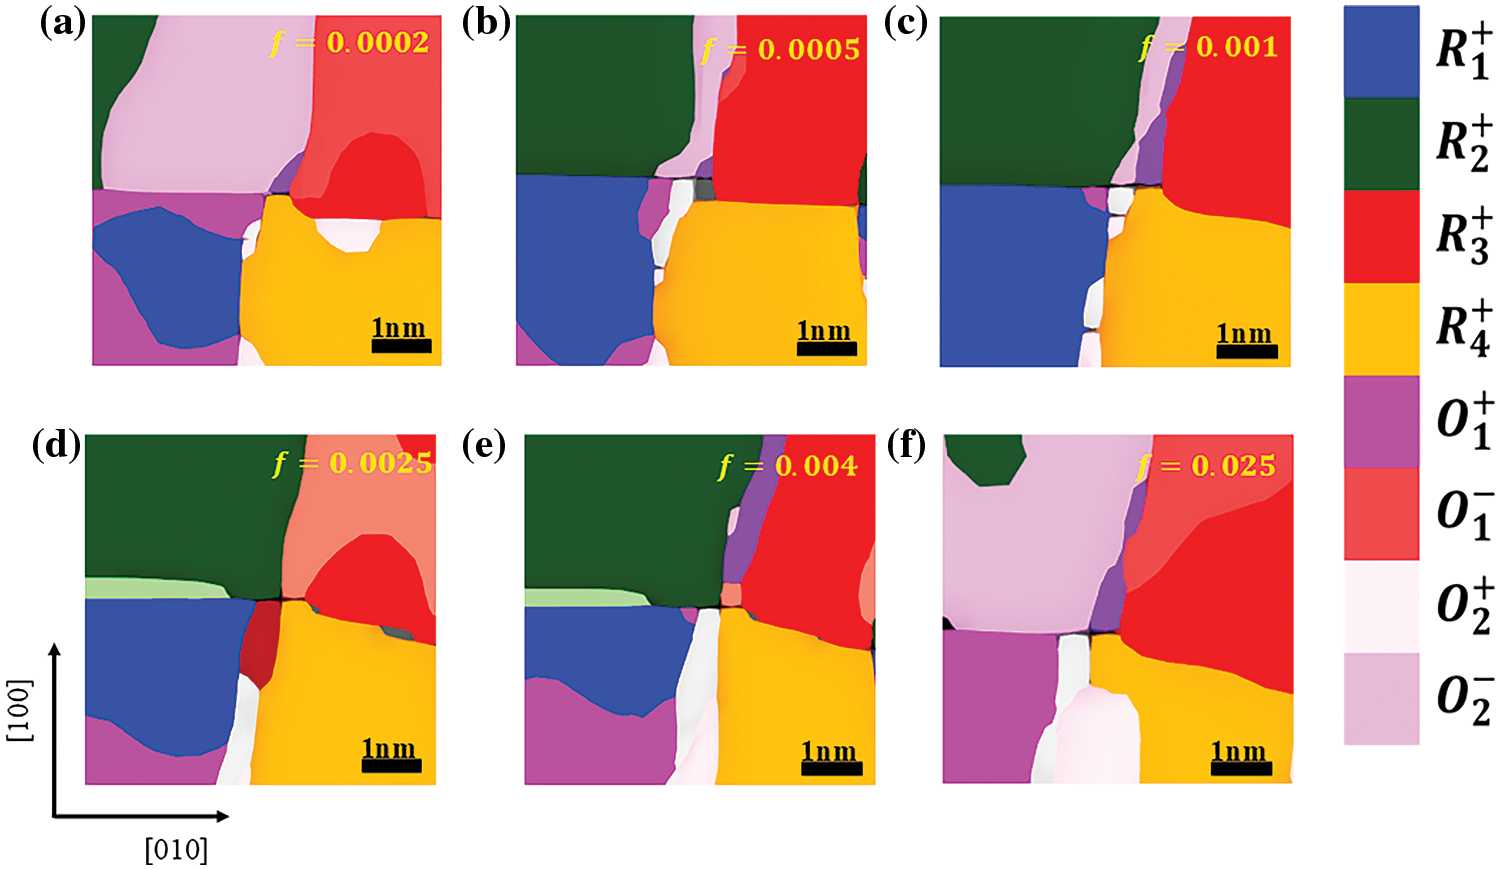
Figure 2: Domain structure of K0.48Na0.52NbO3 thin films in stable state at different frequencies (a) 0.0002 step−1 (b) 0.0005 step−1 (c) 0.001 step−1 (d) 0.0025 step−1 (e) 0.004 step−1 and (f) 0.025 step−1
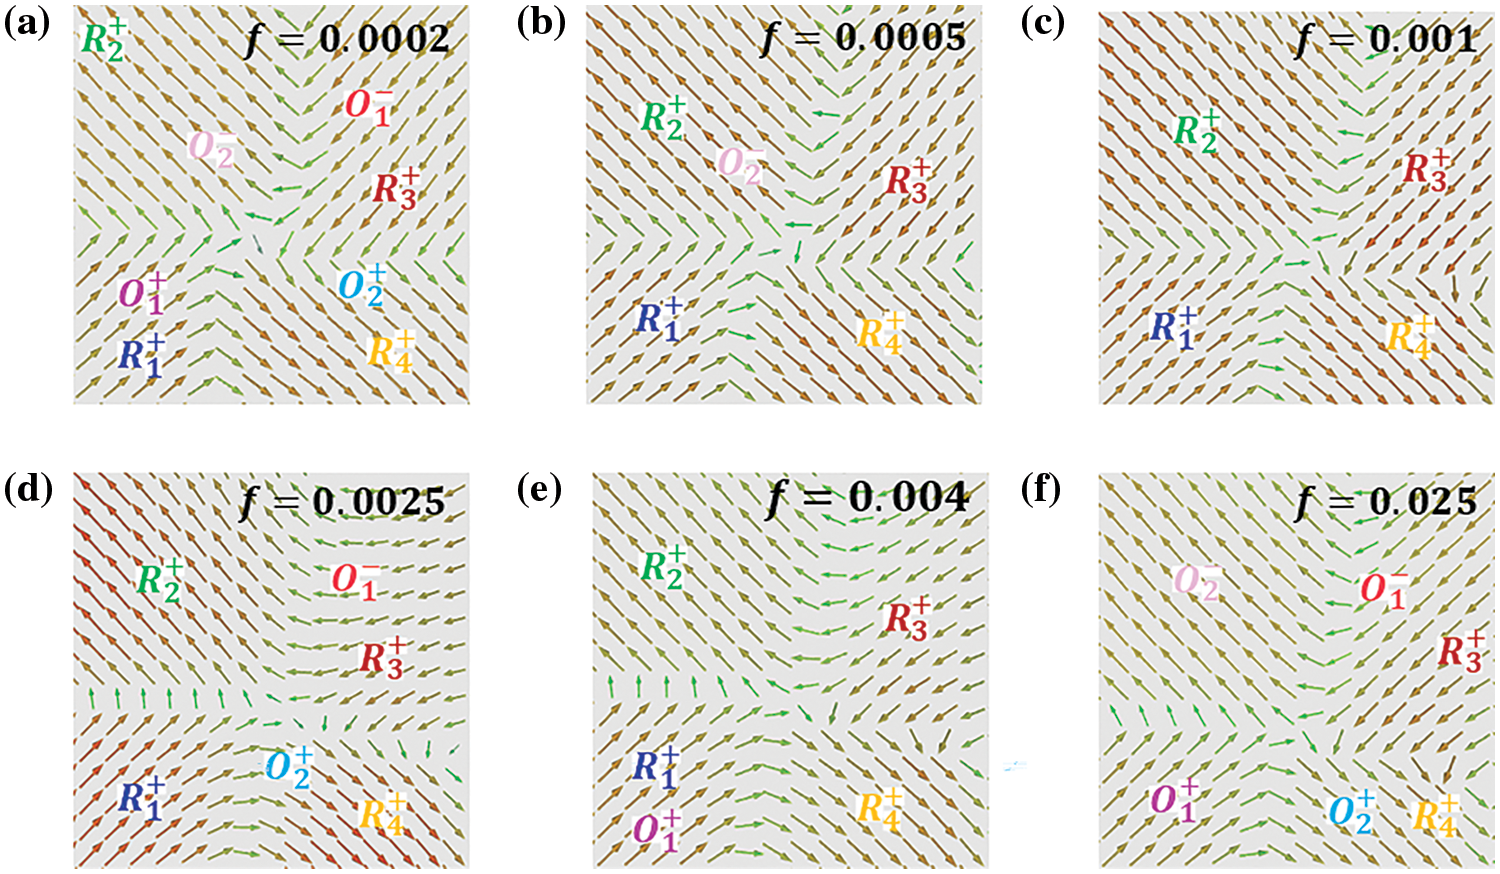
Figure 3: The Polarization vector diagram of K0.48Na0.52NbO3 films is at different frequencies (a) 0.0002 step−1 (b) 0.0005 step−1 (c) 0.001 step−1 (d) 0.0025 step−1 (e) 0.004 step−1 and (f) 0.025 step−1
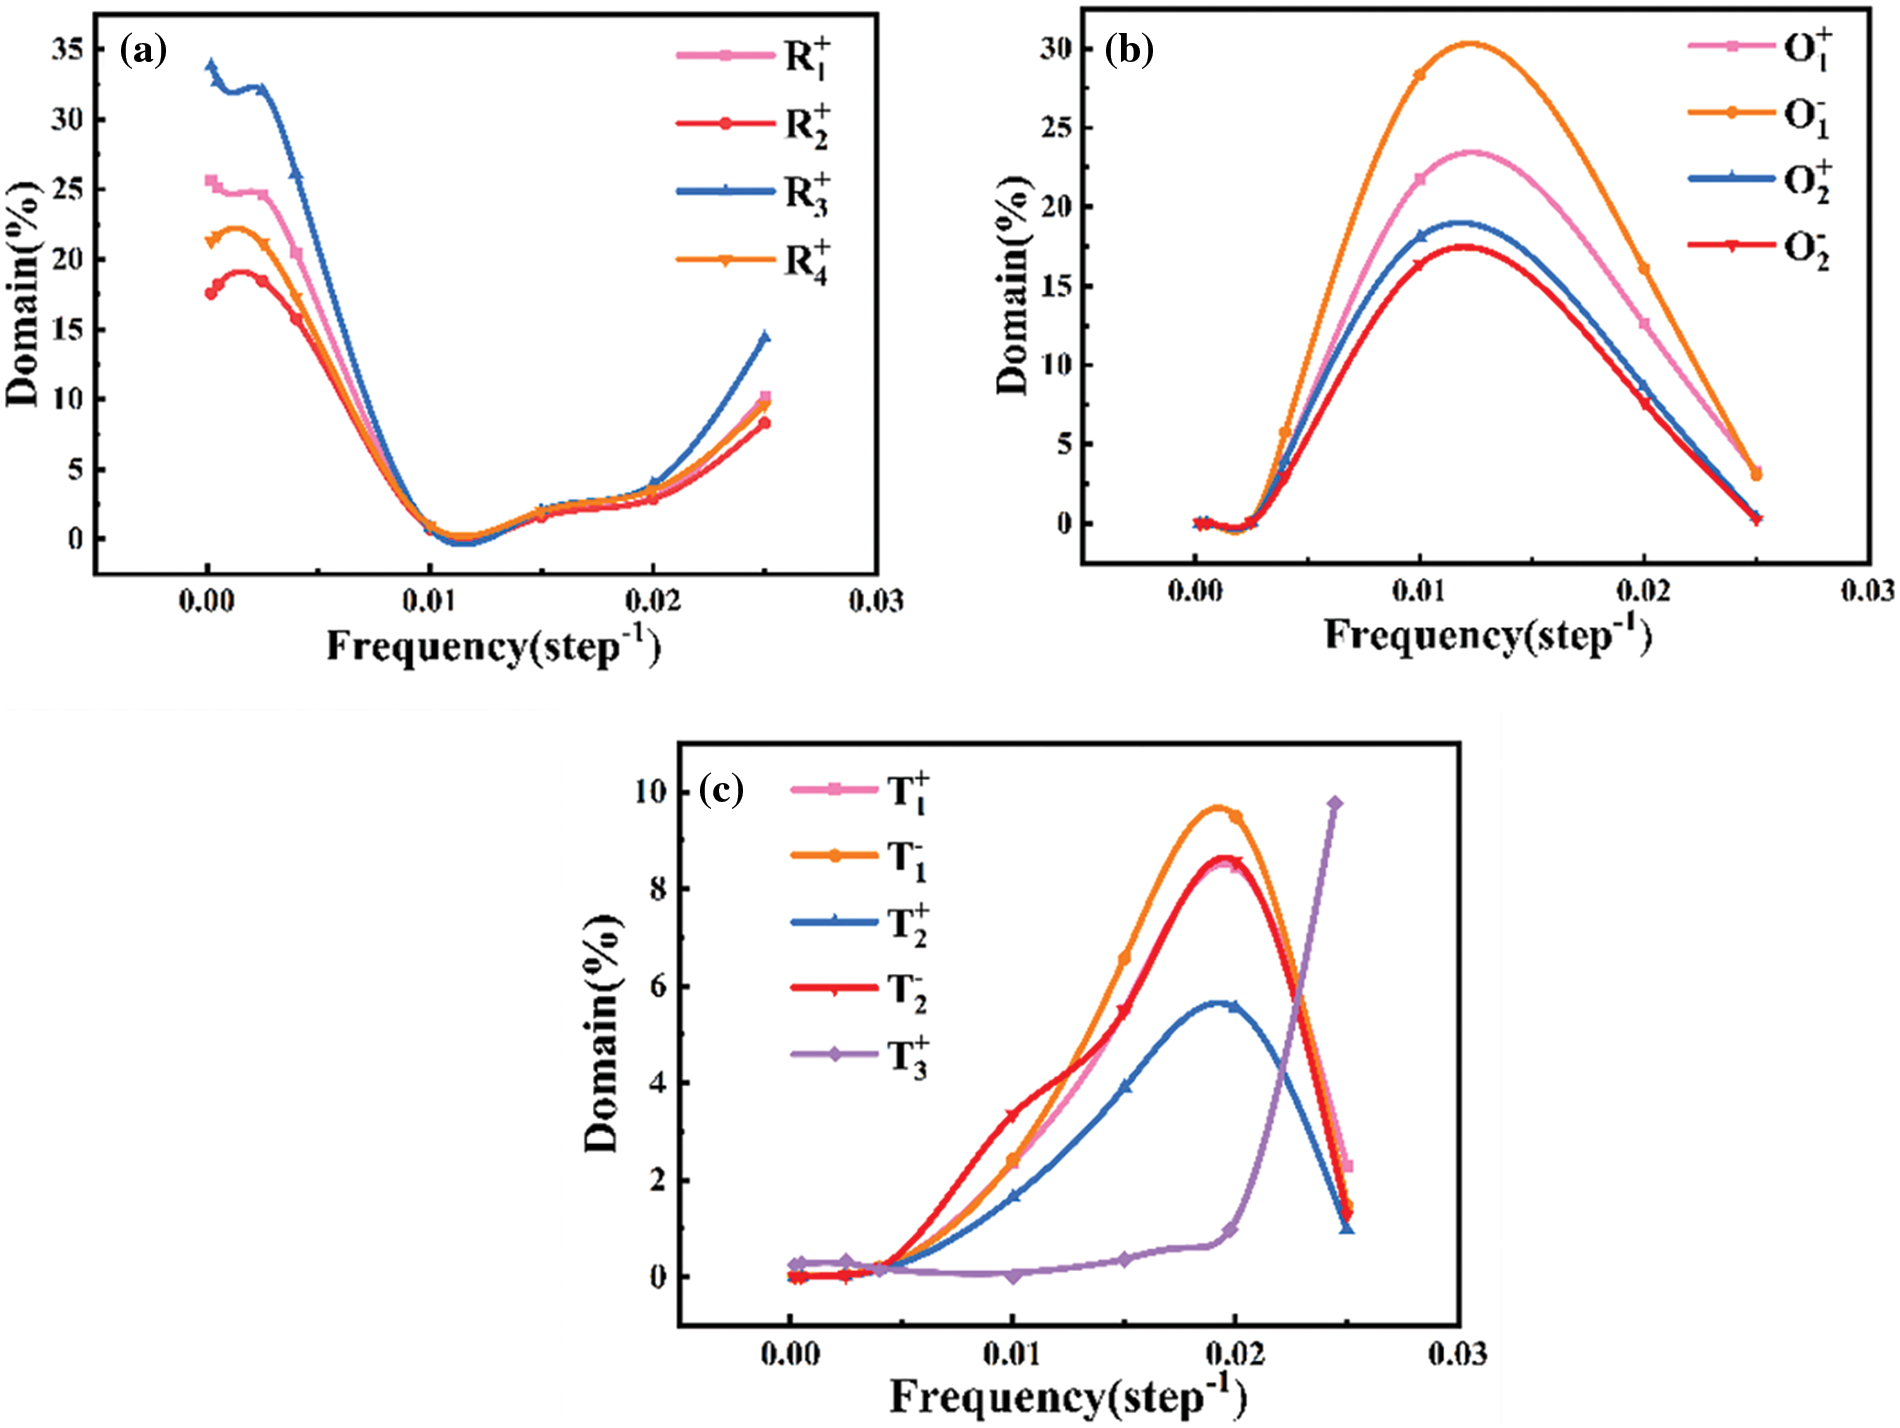
Figure 4: The domain content of KNN thin films changes at different frequencies (a) Variation of R domain content (b) Variation of O domain content (c) Variation of T domain content
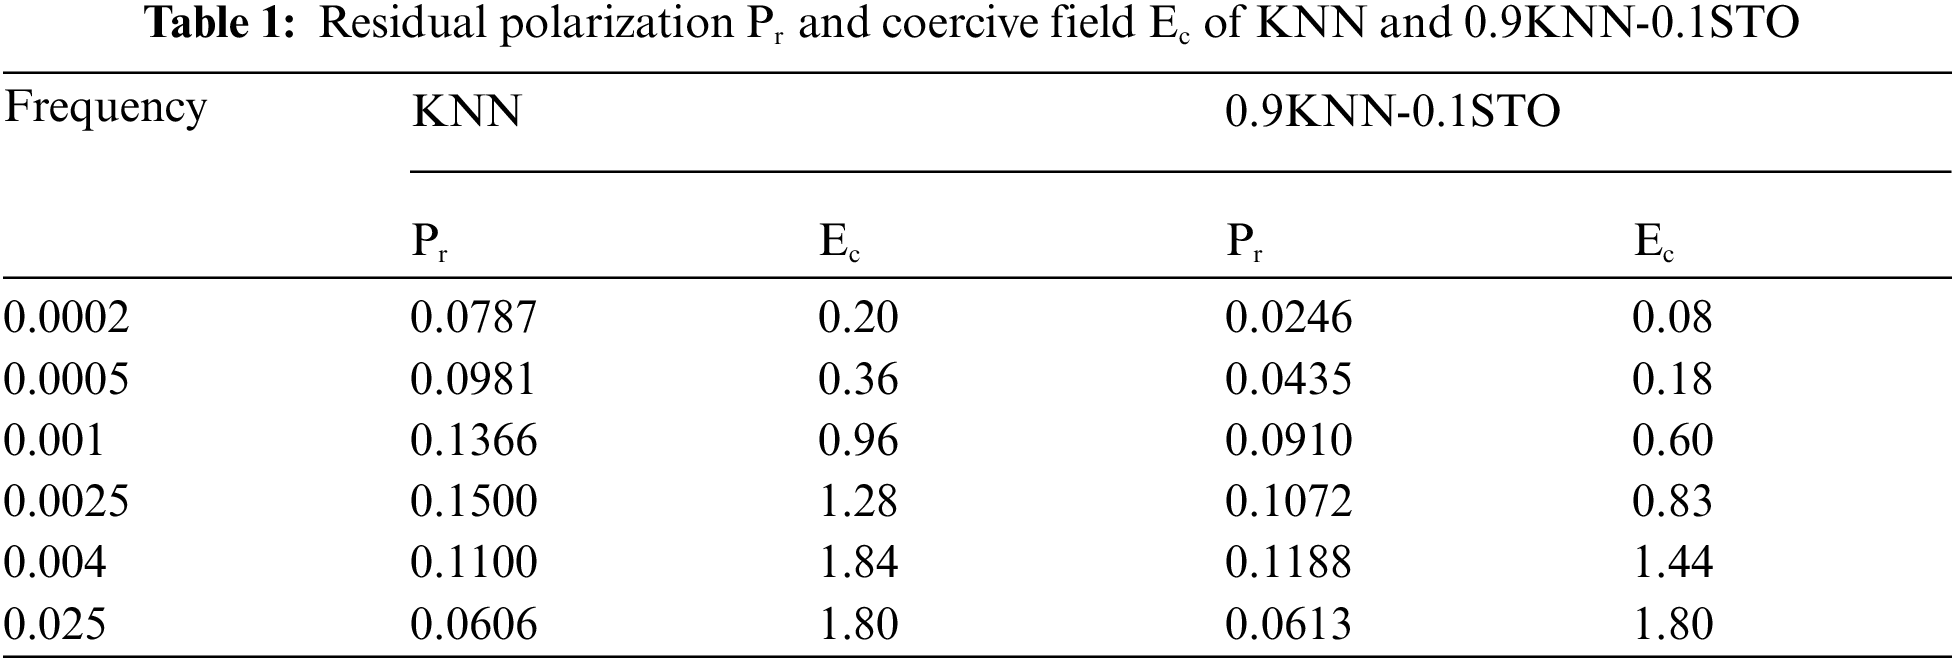
In the hysteresis loops of KNN thin films at different frequencies, it is observed that as the frequency increases, the coercive field approaches the applied electric amplitude, as depicted in Fig. 5. The hysteresis loops maintain their normal shape with the frequency change in Fig. 6a–c, while the residual polarization and coercive electric field increase with the rise in frequency, as presented in Table 1. Generally, when the external electric field is applied to the maximum value, the polarization also reaches its peak value, Pmax. However, starting from Fig. 6d, the maximum polarization value appears at a point lower than the amplitude of the electric field, and subsequently, the polarization decreases with the increase in the applied electric field. When the electric field frequency surpasses a critical value, the maximum polarization disappears, and the shape of the hysteresis loop gradually transforms into an abnormal elliptical form. As the electric field is gradually unloaded, the polarization increases with the decrease in the electric field, reaching its maximum value at the point of residual polarization. With the increase in the reverse electric field, the coercive field approaches the maximum electric field [45], as illustrated in Fig. 6e. The emergence of the “banana” hysteresis loop may be attributed to a change in the polarization order within the film when the frequency is altered, leading to partial cancellation and resulting in this loss of hysteresis loop. This phenomenon indicates a significant alteration in the material’s properties, rendering it unsuitable for most applications of ferroelectric thin films.
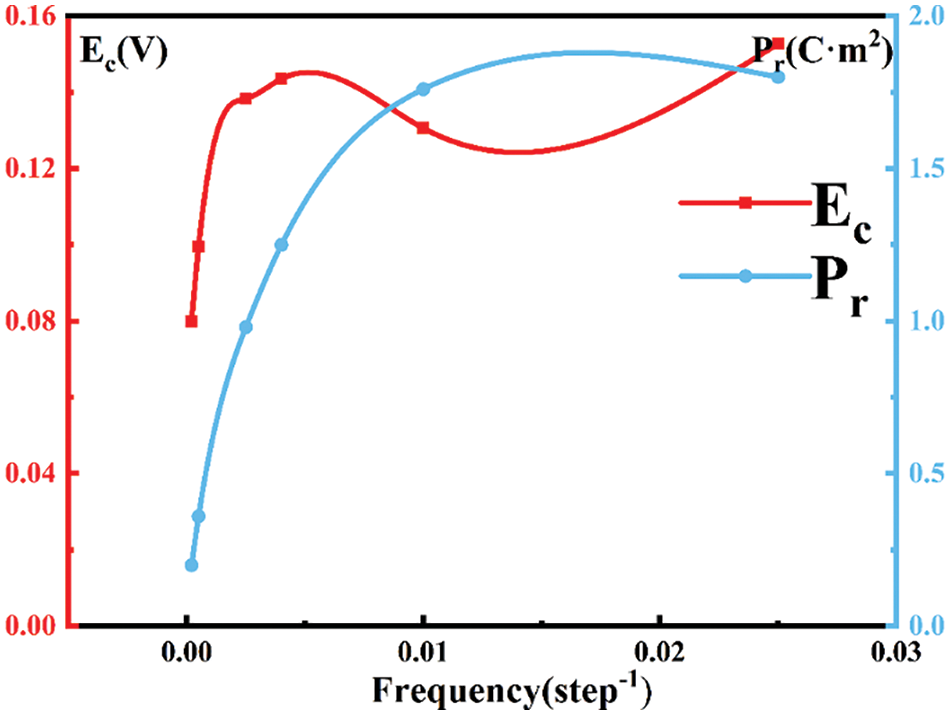
Figure 5: Changes in residual polarization and coercive field of KNN with frequency variation

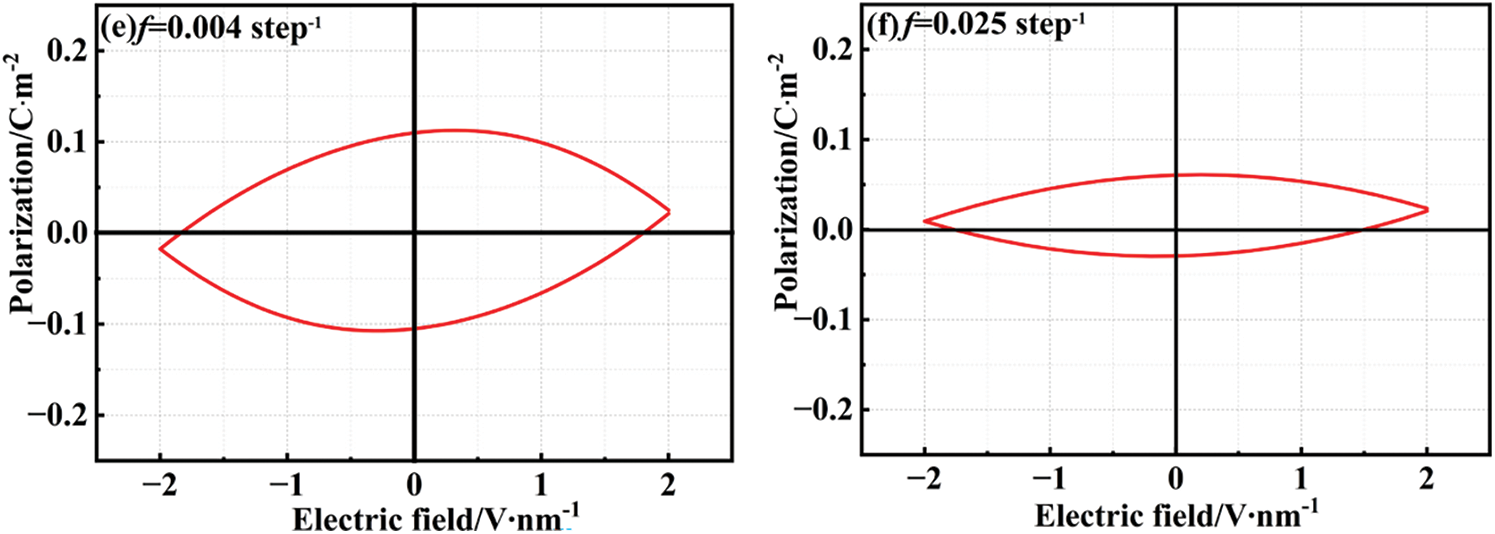
Figure 6: Hysteresis loop of KNN thin film (a) 0.0002 step−1 (b) 0.0005 step−1 (c) 0.001 step−1 (d) 0.0025 step−1 (e) 0.004 step−1 and (f) 0.025 step−1
3.2 Influence of Frequency of Composition Change on Hysteresis Loops and Dielectric Constants
To further investigate ferroelectrics’ polarization response effects under high electric field frequencies, we introduce a paraelectric phase, STO, to the KNN system. The introduction of a paraelectric phase may decrease residual polarization and coercive electric field. Additionally, STO may disrupt long-range ordered ferroelectric dipoles, increase domain wall quantity, and enhance the film’s relaxation properties [46]. Experiments have demonstrated that when x = 0.1, the solid solution of (1-x) KNN-xSTO exhibits significant relaxation behavior [14], which may improve frequency stability. Consequently, the components used in the simulation are 0.9K0.48Na0.52NbO3-0.1SrTiO3. Table 1 presents the residual polarization Pr and coercive force Ec corresponding to pure KNN thin films. The Pr and Ec of doped solid solution thin films near the frequency of 0.001 are significantly smaller than those of pure KNN thin films. When the frequency is 0.0025 step−1 and the stable domain structure has evolved, the hysteresis loop of the solid solution thin films does not change significantly, as shown in Fig. 7d. If the field frequency does not exceed this value, the R domain content continues to increase, and the change in residual polarization in the hysteresis loop when the R domain content reaches its maximum does not differ significantly from pure KNN, as shown in Fig. 7a–c. The difference is that the hysteresis loop will not exhibit a shape similar to that in Fig. 6d until the electric field frequency surpasses 0.004 step−1, as shown in Fig. 7e–f. This phenomenon indicates that the introduction of paraelectric STO can effectively delay the formation of an elliptic hysteresis loop. Table 1 reveals that before this frequency, the residual polarization and coercive field of the solid solution material are smaller than those of KNN at the same frequency, improving the material’s performance to some extent. The disparate polarization switching processes of these two components at the same frequency may result from grain refinement. The ionic radii of Sr and Ti ions are 0.144 nm and 0.061 nm, respectively, which are smaller than those of K ions (0.164 nm) and Nb ions (0.064 nm), causing lattice distortion [14]. Moreover, comparing the domain structures of the two different components at the same frequency, as shown in Fig. 8, reveals that the content of domains with equal (1,0,0) orientation is significantly reduced in the STO-doped material due to the charge difference between A and B ions in the perovskite material.
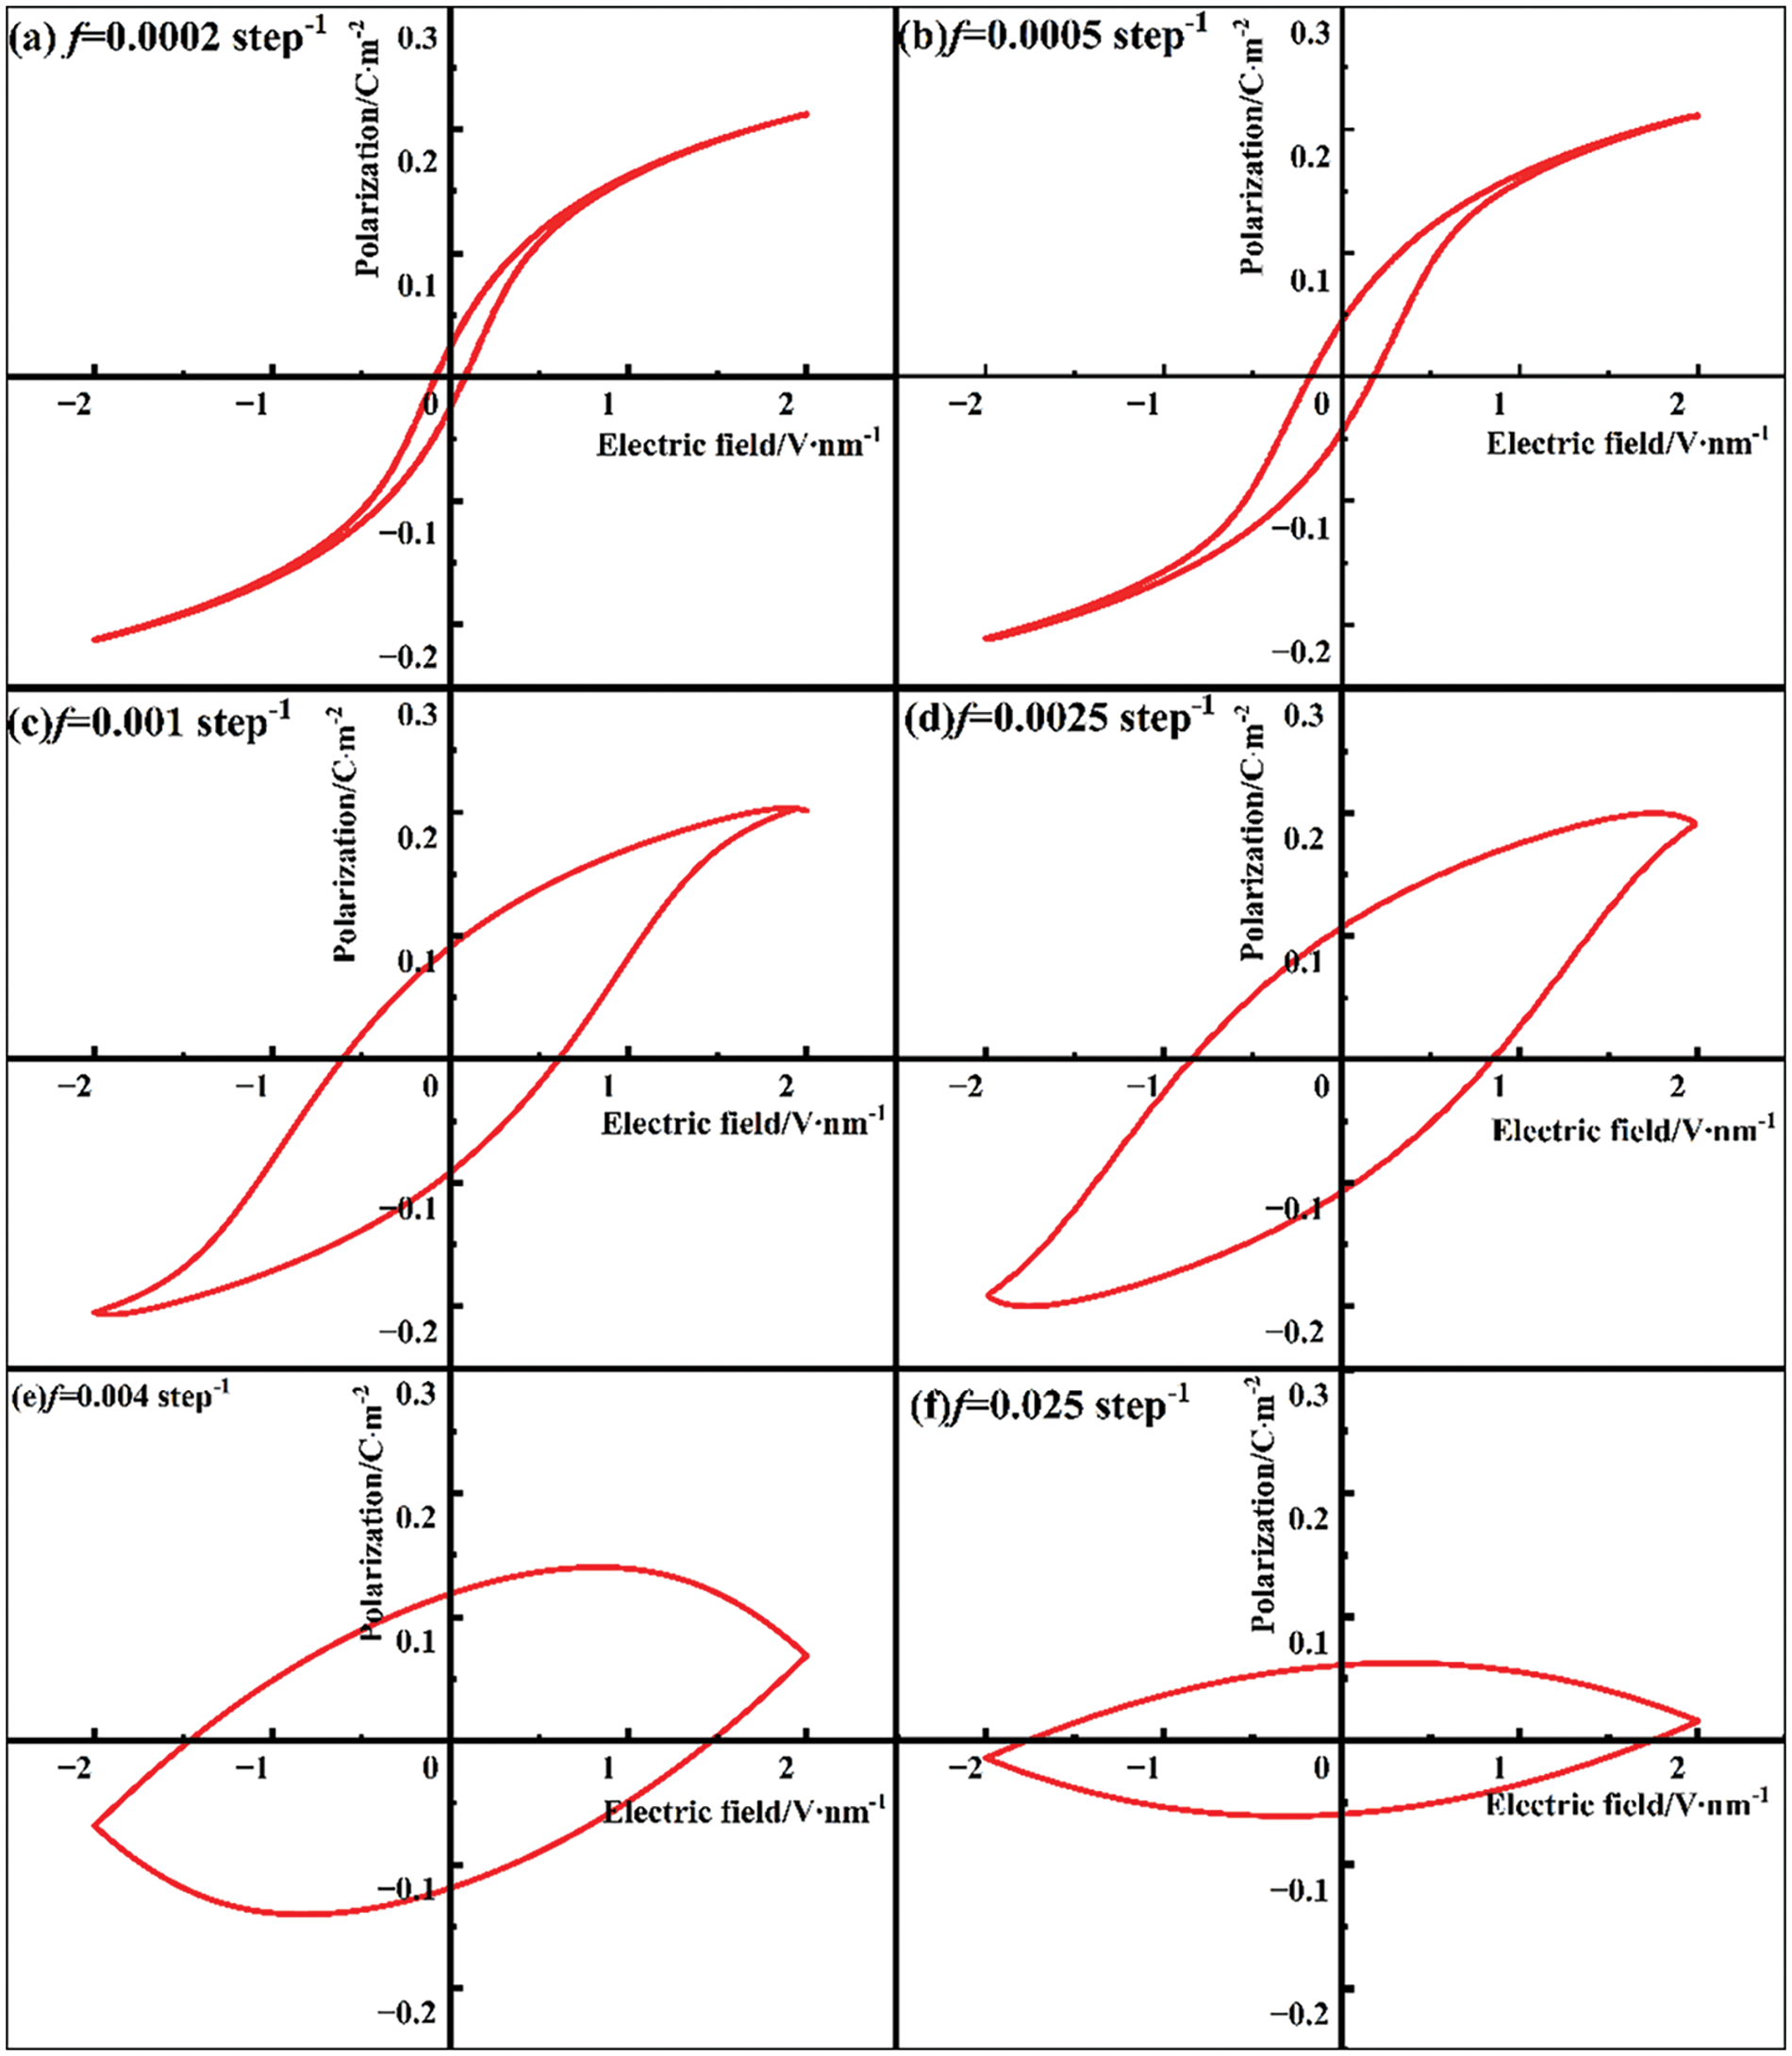
Figure 7: KNN-STO hysteresis loops at different frequencies (a) 0.0002 step−1 (b) 0.0005 step−1 (c) 0.001 step−1 (d) 0.0025 step−1 (e) 0.004 step−1 and (f) 0.025 step−1
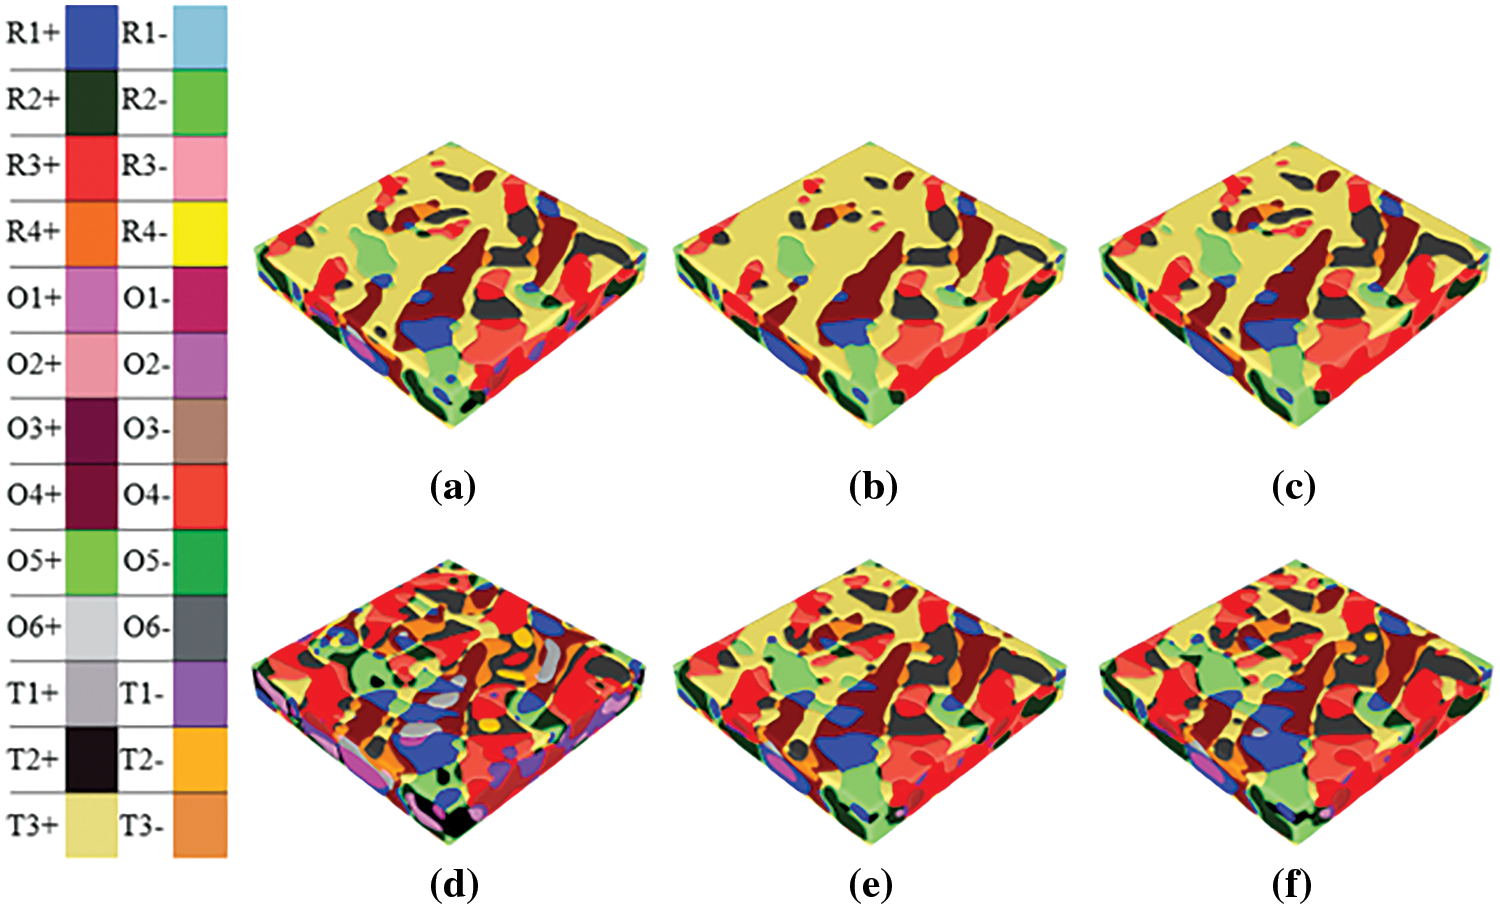
Figure 8: Real-time domain switching behavior at 0.025 step−1: KNN (a) Pmax (b) Pr (c) Ec and 0.9KNN-0.1STO (d) Pmax (e) Pr (f) Ec
4.1 Domain Changes at Different Frequencies
During the polarization switching process induced by frequency variation, the domain initially tends to switch in the direction of the applied electric field upon its application. As the electric field is removed, the domain gradually switches toward the in-plane orientation. In this reversal process, the electrostatic energy serves as the primary driving force, as illustrated in Fig. 9. It is evident that the energy changes exhibit distinct patterns at the lowest and highest frequencies. At the lowest frequency, the three energy components increase numerically with the increase of the applied electric field, with the electrostatic energy exhibiting the most significant change, indicating its role as the main driving force of domain switching. The electrostatic energy is closely correlated with the applied electric field, resulting in its value following a trend consistent with the applied electric field. At the maximum frequency, the values of elastic energy and Landau energy remain nearly constant, while the electrostatic energy displays a parabolic trend. In this case, the main driving force of domain switching remains the electrostatic energy. However, due to the short duration of electric field application under the high-frequency condition, the electrostatic energy in the high-frequency electric field is considerably smaller compared to that in the low-frequency electric field.
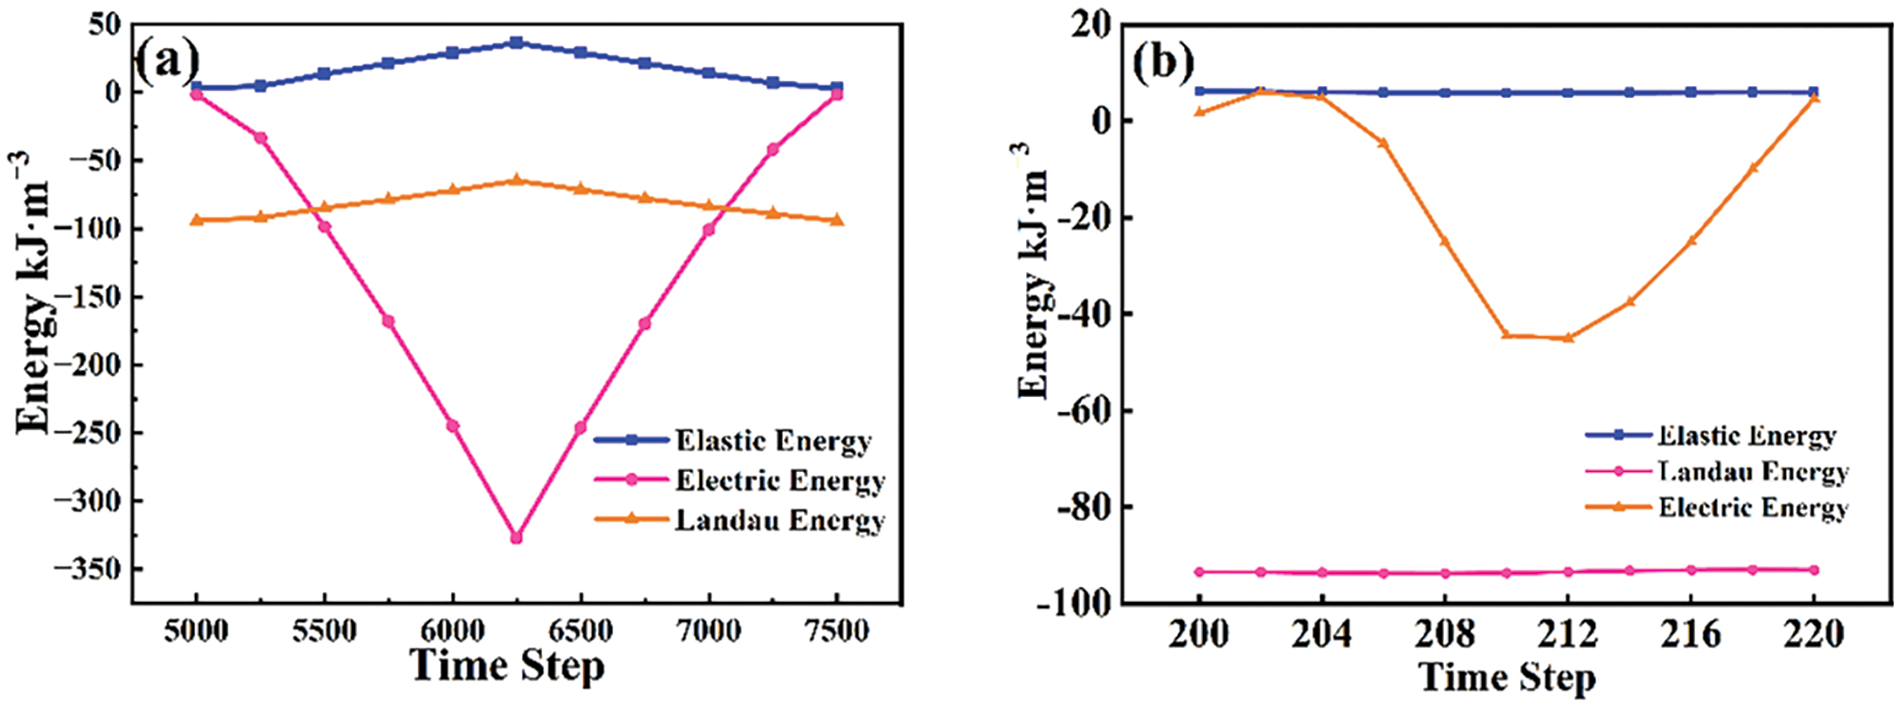
Figure 9: Changes of elastic, electrostatic and landau energies at (a) 0.002 step−1 and (b) 0.025 step−1 frequencies
Lower electrostatic energy corresponds to a shorter polarization reversal process, with polarization reversal beginning to recover to its initial state after a brief period. Consequently, the polarization intensity caused by domain switching consistently fluctuates around the applied electric field, as illustrated in Fig. 10. Under low-frequency electric fields, polarization can be completely switched. At 0.001 step−1, the switching time becomes relatively prolonged. In contrast, under high-frequency electric fields, the extent of domain switching is minimal and fails to match the rate of change in the applied electric field. As a result, the Z-axis polarization component of the domain diminishes under high-frequency electric fields, leading to the formation of only a few R domains. This indicates that the content of in-plane domains at residual polarization is substantial.
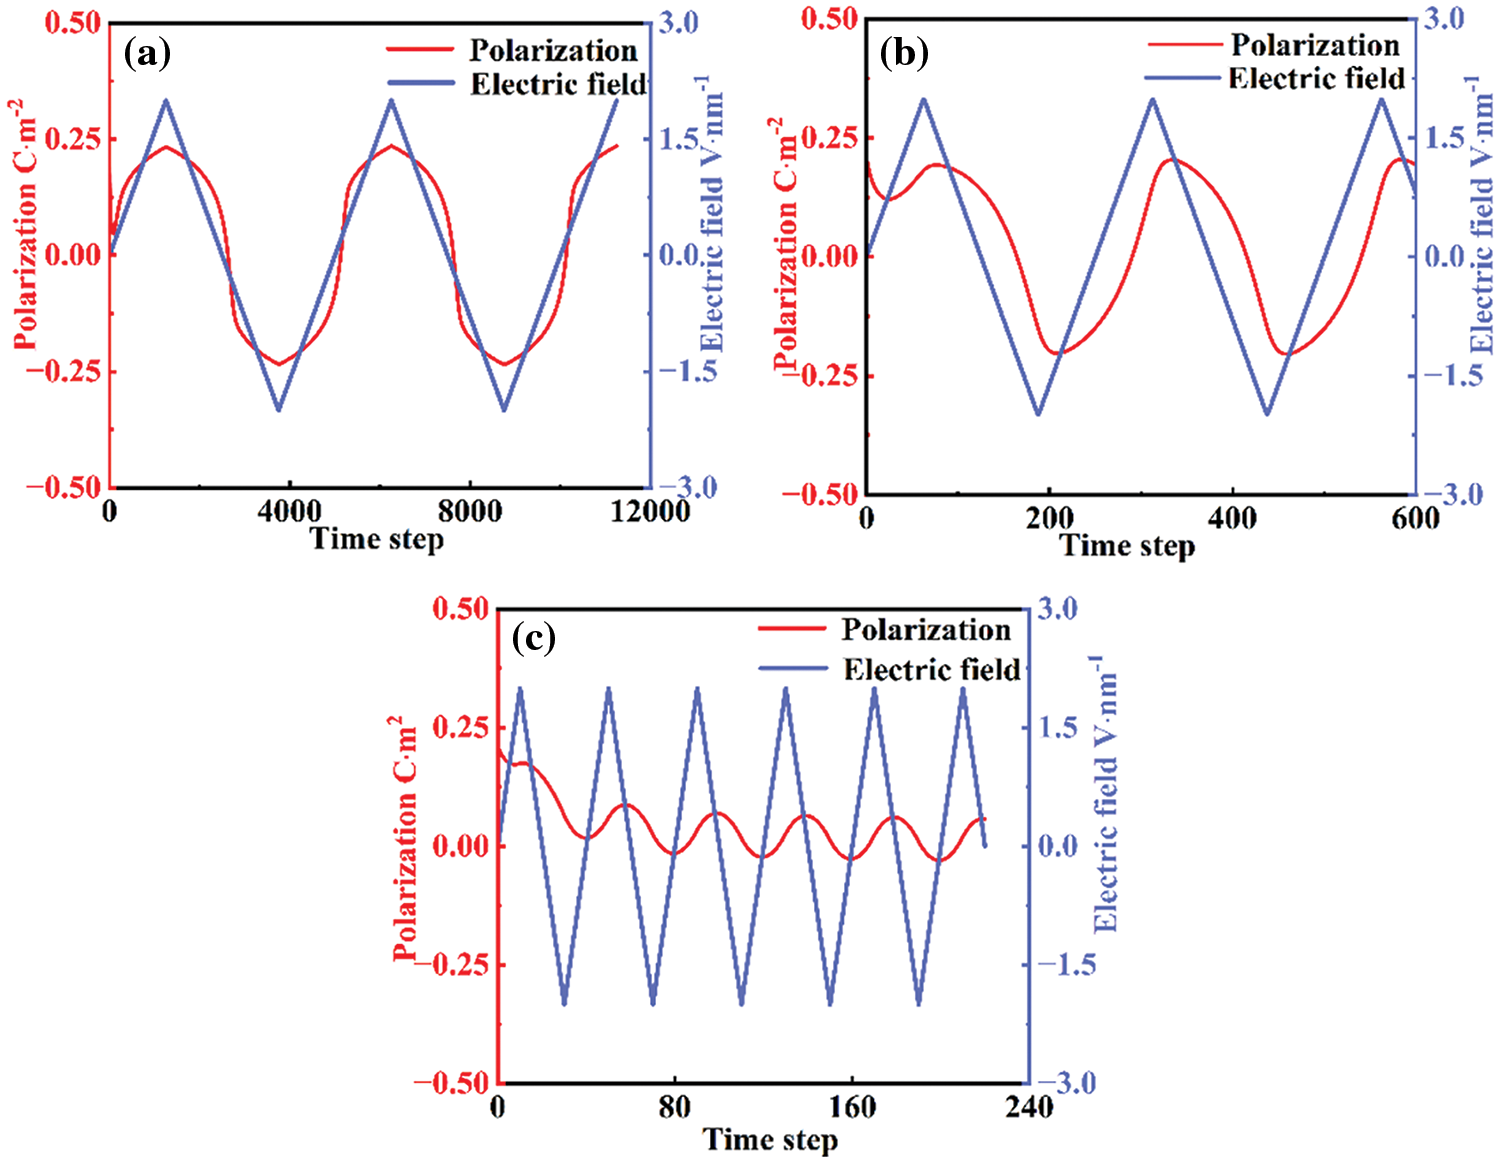
Figure 10: Real-time relationship between polarization switch and applied electric field at frequency of (a) 0.0002 step−1 (b) 0.001 step−1 (c) 0.025 step−1
4.2 Composition Changes Improve Dielectric Properties of Thin Films
Altering the material composition enhances the film’s frequency stability range, as doping or substitution modifies the material’s microstructure. The addition of STO may disrupt the long-range ordered ferroelectric dipoles in the KNN-STO solid solution, and the radii of Sr2+ and Ti4+ ions are relatively small. Lattice distortion caused by substituting K+ and Nb5+ ions in KNN may reduce the film’s stability, influencing the material’s phase transition [47]. Differences in ionic radii may also induce oxygen vacancies in the lattice, resulting in relaxation behaviors and broadening the film’s frequency application range. Fig. 11 illustrates that the material’s dielectric constant decreases gradually with increasing frequency, potentially due to the rapid change in electric field direction at high frequencies, whereby the charge lacks sufficient time to respond to the applied electric field changes. At room temperature, in conjunction with the phase diagram, it is evident that domains with the three polarization components (P1, P2, P3) exhibit relative stability in KNN thin films without mismatch strain. Fig. 4 demonstrates that the content of domains with the Z-axis component initially decreases and subsequently increases with increasing frequency, exhibiting a minimum value of around 0.01 step−1. The film’s stability is compromised near this frequency. Solid solution doping delays the occurrence of the component’s minimum frequency, thereby enhancing the film’s stability.
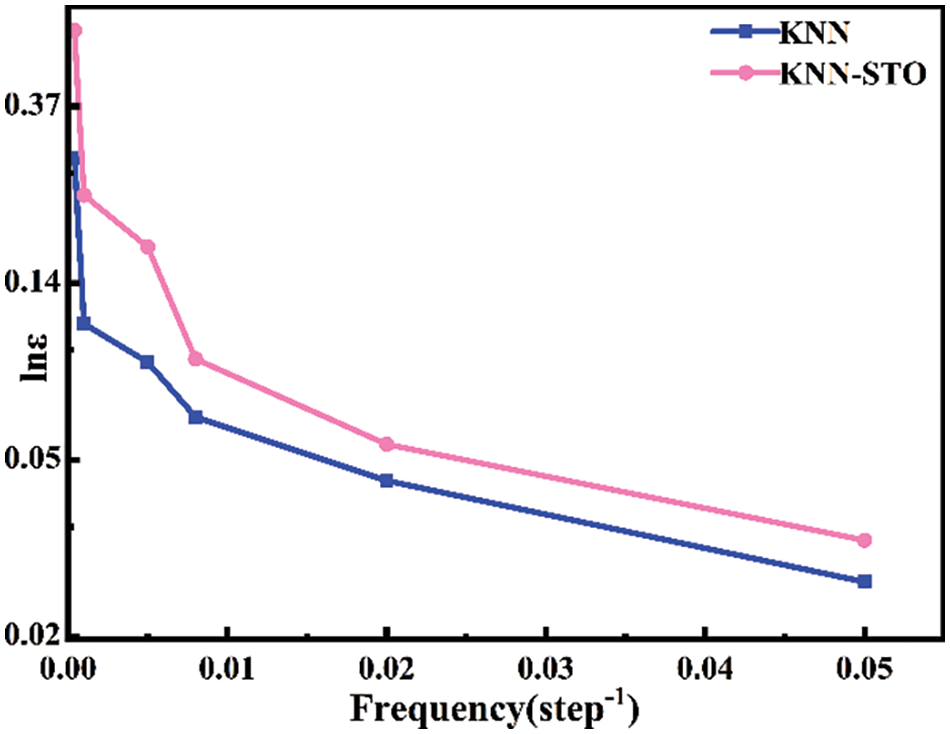
Figure 11: Changes of dielectric constants of KNN and 0.9KNN-0.1STO thin film
In this paper, the variation of hysteresis loops under different electric field frequencies was studied through the phase field method. By analyzing the domain content, the difference in the switching mechanism of the KNN domain under different frequencies was clarified. At the residual polarization at lower frequencies, the O-domain content in the plane decreases with the increase of frequency, and the material belongs to the normal application range. When the frequency is greater than 0.001 step−1, the polarization switch is inhibited, and the domain content changes little during the loading field to the unloading field, which makes that the maximum polarization disappears and the residual polarization content decreases, which is very bad for the application of ferroelectric thin films. Based on this, it is proposed to mix STO and KNN in a ratio of 1:9. The addition of STO decreases the domain content of the solid solution (1,0,0) polarization orientation, and increases the domain content in the plane, indicating that the application frequency range of ferroelectric thin films can be expanded by chemical substitution method. Moreover, doping reduces the residual polarization and improves the dielectric properties of the thin films, which provides important guidance for the further expansion of ferroelectric applications.
Acknowledgement: The authors would like to thank the editors and reviewers for their valuable work, as well as the supervisor and family for their valuable support during the research process.
Funding Statement: The work was supported by National Defense Basic Scientific Research Program of China (Grant Nos. JCKY2020408B002, WDZC2022-12).
Author Contributions: Study conception and design: Zhi Wang, Jinming Cao, Zhonglei Liu, Yuhong Zhao; data collection: Zhi Wang, Jinming Cao, Zhonglei Liu; analysis and interpretation of results: Zhi Wang, Jinming Cao, Zhonglei Liu, Yuhong Zhao; draft manuscript preparation: Zhi Wang, Yuhong Zhao. All authors reviewed the results and approved the final version of the manuscript.
Availability of Data and Materials: All the study data are included in the article.
Ethics Approval: Not applicable.
Conflicts of Interest: The authors declare that they have no known competing financial interests or personal relationships that could have appeared to influence the work reported in this paper.
References
1. Y. H. Ren, O. Kurt, H. B. Cheng, T. Le, S. Greenbaum and J. Ouyang, “Electrical field driven structural evolutions of polymorphic nanodomains in ferroelectric Ba(Zr,Ti)O3 films,” Adv Electron. Mater., vol. 8, no. 10, Oct. 2022, Art. no. 2200465. doi: 10.1002/aelm.202200465. [Google Scholar] [CrossRef]
2. M. H. Tang, G. J. Dong, Y. Sugiyama, and H. Ishiwara, “Frequency-dependent electrical properties in Bi(Zn0.5Ti0.5)O3 doped Pb(Zr0.4Ti0.6)O3 thin film for ferroelectric memory application,” Semicond Sci. Technol., vol. 25, no. 3, Jan. 2010, Art. no. 035006. doi: 10.1088/0268-1242/25/3/035006. [Google Scholar] [CrossRef]
3. K. J. Lee, T. Y. Yang, D. W. Chou, and Y. H. Wang, “Hybrid ferroelectric P (VDF-TrFE)/BZT insulators for pentacene-based nonvolatile memory applications,” IEEE Electron Device Lett., vol. 43, no. 9, pp. 1463–1466, Jul. 2022. doi: 10.1109/LED.2022.3188664. [Google Scholar] [CrossRef]
4. Y. Li et al., “Phase-field simulations of tunable polar topologies in lead-free ferroelectric/paraelectric multilayers with ultrahigh energy-storage performance,” Adv. Mater., vol. 34, no. 13, Apr. 2022, Art. no. 2108772. doi: 10.1002/adma.202108772. [Google Scholar] [PubMed] [CrossRef]
5. J. J. Wang, Y. J. Su, B. Wang, J. Ouyang, Y. H. Ren and L. Q. Chen, “Strain engineering of dischargeable energy density of ferroelectric thin-film capacitors,” Nano Energ., vol. 72, no. 80, Jun. 2020, Art. no. 104665. doi: 10.1016/j.nanoen.2020.104665. [Google Scholar] [CrossRef]
6. W. Shin et al., “Synergistic improvement of sensing performance in ferroelectric transistor gas sensors using remnant polarization,” Mater. Horiz., vol. 9, no. 6, pp. 1623–1630, Apr. 2022. doi: 10.1039/d2mh00340f. [Google Scholar] [PubMed] [CrossRef]
7. J. N. Wilson, J. M. Frost, S. K. Wallace, and A. Walsh, “Dielectric and ferroic properties of metal halide perovskites,” APL Mater., vol. 7, no. 1, Jan. 2019, Art. no. 010901. doi: 10.1063/1.5079633. [Google Scholar] [CrossRef]
8. H. H. Wu, S. G. Cao, J. M. Zhu, and T. Y. Zhang, “The frequency-dependent behavior of a ferroelectric single crystal with dislocation arrays,” Acta Mech., vol. 228, no. 8, pp. 2811–2817, Dec. 2015. doi: 10.1007/s00707-015-1512-2. [Google Scholar] [CrossRef]
9. X. Chen et al., “Temperature dependence of ferroelectricity and domain switching behavior in Pb(Zr0.3Ti0.7)O3 ferroelectric thin films,” Ceram. Int., vol. 45, no. 14, Oct. 2019, Art. no. 18030. doi: 10.1016/j.ceramint.2019.06.022. [Google Scholar] [CrossRef]
10. Y. Su, N. Liu, and G. Weng, “A phase field study of frequency dependence and grain-size effects in nanocrystalline ferroelectric polycrystals,” Acta Mater., vol. 87, no. 1, pp. 293–308, Apr. 2015. doi: 10.1016/j.actamat.2015.01.015. [Google Scholar] [CrossRef]
11. G. Z. Zhou et al., “On ferroelectric domain polarization switching mechanism subject to an external electric field by simulations with the phase-field method,” Sci. China Tech. Sci., vol. 56, no. 5, pp. 1129–1138, Feb. 2013. doi: 10.1007/s11431-013-5135-3. [Google Scholar] [CrossRef]
12. Q. N. Zhang, X. D. Xia, J. Wang, and Y. Su, “Effects of epitaxial strain, film thickness and electric-field frequency on the ferroelectric behavior of BaTiO3 nano films,” Int. J. Solids Struct., vol. 144–145, no. 6, pp. 32–45, Jul. 2018. doi: 10.1016/j.ijsolstr.2018.04.012. [Google Scholar] [CrossRef]
13. C. H. Jang, H. S. Kim, H. Kim, and H. Y. Cha, “Temperature-and frequency-dependent ferroelectric characteristics of metal-ferroelectric-metal capacitors with atomic-layer-deposited undoped HfO2 films,” Materials, vol. 15, no. 6, Feb. 2022, Art. no. 2097. doi: 10.3390/ma15062097. [Google Scholar] [PubMed] [CrossRef]
14. A. Kupec and B. Malič, “Structural and dielectric properties of the lead-free (1−x)K0.5Na0.5NbO3–xSrTiO3 thin films from solutions,” Alloys Compd., vol. 596, no. 25, pp. 32–38, May 2014. doi: 10.1016/j.jallcom.2014.01.193. [Google Scholar] [CrossRef]
15. Y. H. Zhao et al., “Development of phase-field modeling in materials science in China: A review,” Acta Metall. Sin. (Engl. Lett.), vol. 36, no. 11, pp. 1749–1775, Aug. 2023. doi: 10.1007/s40195-023-01593-w. [Google Scholar] [CrossRef]
16. H. Qi and R. Z. Zuo, “Linear-like lead-free relaxor antiferroelectric (Bi0.5Na0.5)TiO3–NaNbO3 with giant energy-storage density/efficiency and super stability against temperature and frequency,” J. Mater. Chem., vol. 7, no. 8, Jan. 2019, Art. no. 3971. doi: 10.1039/c8ta12232f. [Google Scholar] [CrossRef]
17. Y. P. Guo, K. Kakimoto, and H. Ohsato, “Dielectric and piezoelectric properties of lead-free (Na0.5K0.5)NbO3–SrTiO3 ceramics,” Solid State Commun., vol. 129, no. 5, pp. 279–284, Feb. 2004. doi: 10.1016/j.ssc.2003.10.026. [Google Scholar] [CrossRef]
18. H. Pan et al., “Giant energy density and high efficiency achieved in bismuth ferrite-based film capacitors via domain engineering,” Nat. Commun., vol. 9, no. 1, May 2018, Art. no. 1813. doi: 10.1038/s41467-018-04189-6. [Google Scholar] [PubMed] [CrossRef]
19. X. Y. Zhao, J. J. Wang, and L. Q. Chen, “A thermodynamic study of phase transitions and electrocaloric properties of K0.5Na0.5NbO3 single crystals,” Appl. Phys. Lett., vol. 116, no. 9, Mar. 2020, Art. no. 092902. doi: 10.1063/1.5144056. [Google Scholar] [CrossRef]
20. J. Barr and S. Beckman, “Electrocaloric response of KNbO3 from a first-principles effective Hamiltonian,” Mater Sci. Eng. B, vol. 196, pp. 40–43, Jun. 2015. doi: 10.1016/j.mseb.2015.02.004. [Google Scholar] [CrossRef]
21. R. Kumar, A. Kumar, and S. Singh, “Large electrocaloric response and energy storage study in environmentally friendly (1−x) K0.5Na0.5NbO3–xLaNbO3 nanocrystalline ceramics,” Sustain. Energ. Fuels, vol. 2, no. 12, pp. 2698–2704, Sep. 2018. doi: 10.1039/c8se00276b. [Google Scholar] [CrossRef]
22. M. J. Zhou, J. J. Wang, L. Q. Chen, and C. W. Nan, “Strain, temperature, and electric-field effects on the phase transition and piezoelectric responses of K0.5Na0.5NbO3 thin films,” J. Appl. Phys., vol. 123, no. 15, Apr. 2018, Art. no. 154106. doi: 10.1063/1.5027505. [Google Scholar] [CrossRef]
23. T. Xin et al., “Phase transformations in an ultralight BCC Mg alloy during anisothermal aging,” Acta Mater., vol. 239, no. 15, Oct. 2022, Art. no. 118248. doi: 10.1016/j.actamat.2022.118248. [Google Scholar] [CrossRef]
24. W. W. Kuang, H. F. Wang, X. Li, J. B. Zhang, Q. Zhou and Y. H. Zhao, “Application of the thermodynamic extremal principle to diffusion-controlled phase transformations in Fe-C-X alloys: Modeling and applications,” Acta Mater., vol. 159, no. 15, pp. 16–30, Oct. 2018. doi: 10.1016/j.actamat.2018.08.008. [Google Scholar] [CrossRef]
25. X. L. Tian, Y. H. Zhao, Y. L. Guo, F. Q. Xu, and H. Hou, “Cooperative effect of strength and ductility processed by thermomechanical treatment for Cu-Al-Ni alloy,” Mater Sci. Eng., vol. 849, no. 1, Aug. 2022, Art. no. 143485. doi: 10.1016/j.msea.2022.143485. [Google Scholar] [CrossRef]
26. T. Xin et al., “Ultrahigh specific strength in a magnesium alloy strengthened by spinodal decomposition,” Sci. Adv. Vol., vol. 7, no. 23, pp. 1–9, Jun. 2021. doi: 10.1126/sciadv.abf3039. [Google Scholar] [PubMed] [CrossRef]
27. Z. L. Liu, “Topological vortex structure and conductance information storage in ferroelectric ceramics were investigated via phase field method,” M.S. thesis, North Univ. of China, Taiyuan, China, 2023. [Google Scholar]
28. Z. L. Liu, J. M. Cao, Z. Wang, and Y. H. Zhao, “Phase-field method explored ferroelectric vortex topology structure and morphotropic phase boundaries,” Acta Phys. Sin., vol. 72, no. 3, Feb. 2023, Art. no. 037702. doi: 10.7498/aps.72.20221898. [Google Scholar] [CrossRef]
29. L. Q. Chen and Y. H. Zhao, “From classical thermodynamics to phase-field method,” Prog. Mater. Sci., vol. 124, no. 2, Feb. 2022, Art. no. 100868. doi: 10.1016/j.pmatsci.2021.100868. [Google Scholar] [CrossRef]
30. W. L. Zhong, Ferroelectric physics. Beijing, China: Science Press, 2000. [Google Scholar]
31. H. Cheng et al., “Demonstration of ultra-high recyclable energy densities in domain-engineered ferroelectric films,” Nat. Commun., vol. 8, no. 1, Dec. 2017, Art. no. 1999. doi: 10.1038/s41467-017-02040-y. [Google Scholar] [PubMed] [CrossRef]
32. T. Sluka, A. K. Tagantsev, D. Damjanovic, M. Gureev, and N. Setter, “Enhanced electromechanical response of ferroelectrics due to charged domain walls,” Nat. Commun., vol. 3, no. 1, Mar. 2012, Art. no. 748. doi: 10.1038/ncomms1751. [Google Scholar] [PubMed] [CrossRef]
33. B. Wang, H. N. Chen, J. J. Wang, and L. Q. Chen, “Ferroelectric domain structures and temperature-misfit strain phase diagrams of K1-xNaxNbO3 thin films: A phase-field study,” Appl. Phys. Lett., vol. 115, no. 9, Aug. 2019, Art. no. 092902. doi: 10.1063/1.5116910. [Google Scholar] [CrossRef]
34. J. B. Zhang et al., “Rapid solidification of non-stoichiometric intermetallic compounds: Modeling and experimental verification,” Acta Mater, vol. 148, no. 115, pp. 86–99, Apr. 2018. doi: 10.1016/j.actamat.2018.01.040. [Google Scholar] [CrossRef]
35. Y. H. Zhao, K. Liu, H. Hou, and L. Q. Chen, “Role of interfacial energy anisotropy in dendrite orientation in Al-Zn alloys: A phase field study,” Mater. Des., vol. 216, no. 9, Apr. 2022, Art. no. 110555. doi: 10.1016/j.matdes.2022.110555. [Google Scholar] [CrossRef]
36. S. Pradhan, M. Rath, A. David, D. Kumar, W. Prellierm and M. R. Rao, “Thickness-dependent domain relaxation dynamics study in epitaxial K0.5Na0.5NbO3 ferroelectric thin films,” ACS Appl. Mater. Interfaces, vol. 13, no. 30, pp. 36407–36415, Jul. 2021. doi: 10.1021/acsami.1c05699. [Google Scholar] [PubMed] [CrossRef]
37. K. M. Rabe et al., Physics of Ferroelectrics: A Modern Perspective. Heidelberg, Berlin, Germany: Springer Science & Business Media, 2007. [Google Scholar]
38. T. Yang and L. Q. Chen, “Dynamical phase-field model of coupled electronic and structural processes,” NPJ Comput. Mater., vol. 8, no. 1, Jun. 2022, Art. no. 130. doi: 10.1038/s41524-022-00820-9. [Google Scholar] [CrossRef]
39. H. Pohlmann, J. J. Wang, B. Wang, and L. Q. Chen, “A thermodynamic potential and the temperature-composition phase diagram for single-crystalline K1-xNaxNbO3 (0≤x≤0.5),” Appl. Phys. Lett., vol. 110, no. 10, Mar. 2017, Art. no. 102906. doi: 10.1063/1.4978360. [Google Scholar] [CrossRef]
40. Y. H. Zhao, “Editorial: Phase field method and integrated computing materials engineering,” Front. Mater., vol. 10, Feb. 2023, Art. no. 1145833. doi: 10.3389/fmats.2023.1145833. [Google Scholar] [CrossRef]
41. Y. H. Zhao, B. Zhang, H. Hou, W. Chen, and M. P. Wang, “Phase-field simulation for the evolution of solid/liquid interface front in directional solidification process,” J. Mater. Sci. Technol., vol. 35, no. 6, pp. 1044–1052, Jun. 2019. doi: 10.1016/j.jmst.2018.12.009. [Google Scholar] [CrossRef]
42. Y. H. Zhao, “Understanding and design of metallic alloys guided by phase-field simulations,” npj Comput. Mater., vol. 9, no. 1, Jun. 2023, Art. no. 94. doi: 10.1038/s41524-023-01038-z. [Google Scholar] [CrossRef]
43. Y. H. Zhao, T. Z. Xin, S. Tang, H. F. Wang, X. D. Fang and H. Hou, “Applications of unified phase-field methods to designing microstructures and mechanical properties of alloys,” MRS Bull., vol. 49, no. 6, pp. 613–625, Jun. 2024. doi: 10.1557/s43577-024-00720-x. [Google Scholar] [CrossRef]
44. Y. H. Zhao, “Integrated unified phase-field modeling (UPFM),” MGE Adv., vol. 2, no. 2, Jun. 2024, Art. no. e44. doi: 10.1002/mgea.44. [Google Scholar] [CrossRef]
45. J. F. Scott, “Ferroelectrics go bananas,” J. Phys.: Condens. Matter, vol. 20, no. 2, Dec. 2008, Art. no. 021001. doi: 10.1088/0953-8984/20/02/021001. [Google Scholar] [CrossRef]
46. H. Pan et al., “Ultrahigh-energy density lead-free dielectric films via polymorphic nanodomain design,” Science, vol. 365, no. 6453, pp. 578–582, Aug. 2019. doi: 10.1126/science.aaw8109. [Google Scholar] [PubMed] [CrossRef]
47. C. W. Bing et al., “Flexible lead-free film capacitor based on BiMg0.5Ti0.5O3-SrTiO3 for high-performance energy storage,” Chem. Eng. J., vol. 445, no. 1, Oct. 2022, Art. no. 136728. doi: 10.1016/j.cej.2022.136728. [Google Scholar] [CrossRef]
Cite This Article
 Copyright © 2024 The Author(s). Published by Tech Science Press.
This work is licensed under a Creative Commons Attribution 4.0 International License , which permits unrestricted use, distribution, and reproduction in any medium, provided the original work is properly cited.
 Downloads
 Citation Tools