
 Submit a Paper
 Propose a Special lssue
 Open Access
ARTICLE

Multi-Label Feature Selection Based on Improved Ant Colony Optimization Algorithm with Dynamic Redundancy and Label Dependence
1 School of Computer, Hubei University of Technology, Wuhan, 430068, China
2 Xining Big Data Service Administration, Xining, 810000, China
3 Wuhan Fiberhome Technical Services Co., Ltd., Wuhan, 430205, China
* Corresponding Author: Zhiwei Ye. Email:
(This article belongs to the Special Issue: Metaheuristic-Driven Optimization Algorithms: Methods and Applications)
Computers, Materials & Continua 2024, 81(1), 1157-1175. https://doi.org/10.32604/cmc.2024.055080
Received 16 June 2024; Accepted 01 September 2024; Issue published 15 October 2024
 View Full Text
 Download PDF
Abstract
The world produces vast quantities of high-dimensional multi-semantic data. However, extracting valuable information from such a large amount of high-dimensional and multi-label data is undoubtedly arduous and challenging. Feature selection aims to mitigate the adverse impacts of high dimensionality in multi-label data by eliminating redundant and irrelevant features. The ant colony optimization algorithm has demonstrated encouraging outcomes in multi-label feature selection, because of its simplicity, efficiency, and similarity to reinforcement learning. Nevertheless, existing methods do not consider crucial correlation information, such as dynamic redundancy and label correlation. To tackle these concerns, the paper proposes a multi-label feature selection technique based on ant colony optimization algorithm (MFACO), focusing on dynamic redundancy and label correlation. Initially, the dynamic redundancy is assessed between the selected feature subset and potential features. Meanwhile, the ant colony optimization algorithm extracts label correlation from the label set, which is then combined into the heuristic factor as label weights. Experimental results demonstrate that our proposed strategies can effectively enhance the optimal search ability of ant colony, outperforming the other algorithms involved in the paper.Keywords
Multi-label datasets often involve intricate scenarios and learning tasks that fall outside the realm of single-label learning, thus presenting a new obstacle in machine learning. In this case, multi-label learning has been developed, expanding the association pattern from one instance corresponding to one label in single-label learning to one instance corresponding to a collection of labels [1]. This broadens the application scenarios of single-label learning and enhances the accuracy and efficiency in predicting complex multi-semantic information. Another characteristic of multi-label data is its high feature dimensionality. The discriminative features in high-dimensional data [2] are strongly correlated with numerous labels. However, the features that affect multi-label classification occupy only a portion, or even a small portion, of the feature set, while the remaining feature set is inundated with numerous redundant and irrelevant features. These redundant or irrelevant features not only increase the computational cost of machine learning algorithms but also waste valuable computing resources. Additionally, they consume significant storage space and increase storage requirements.
Feature selection is the direct removal of redundant and irrelevant features from the original feature set, thereby achieving a reduction of the feature set. The technique preserves the original features, leading to an improved understanding of data and better performance of learning algorithms [3]. Feature selection is widely used in supervised machine-learning paradigms [4–8]. In feature selection, it is crucial to obtain the optimal feature subset by finding those highly correlated with labels and non-redundant. Therefore, it is essential to consider both of these factors simultaneously to ensure that the selected features have a high predictive power and some interpretability. For example, Yang et al. [9] proposed a multi-strategy assisted multi-objective WOA (MSMOWOA) to address feature selection. Ye et al. [10] proposed a novel ensemble framework for intrusion detection. It used an improved Hybrid Breeding Optimization (HBO) to address the cruse of dimensionality and improve the Intrusion Detection System (IDS) performance. More and more evolution computation or swarm-intelligence based optimization algorithms are applied for feature selection.
Common swarm intelligence optimization algorithms include Particle Swarm Optimization (PSO) [11], Grey Wolf Optimizer (GWO) [12], Ant Colony Optimization (ACO) [13], Whale Optimization Algorithms (WOA) [14], and Chimp Optimization Algorithm [15]. Compared to other swarm intelligence optimization algorithms that require a combination of learning algorithms to find the optimal feature subset, ACO can transform the feature selection process into a graph search where ants navigate through nodes representing features, thus offering greater flexibility. When dealing with high-dimensional data, filtered methods using only the internal structural information of the data are more efficient and do not require a combination of learning algorithms. Furthermore, these methods can be integrated into the heuristic factors of the ACO algorithm [16,17] to enhance search efficiency. Additionally, ACO can directly optimize filtered methods for multi-label feature selection [18–20]. The ACO algorithm demonstrates commendable efficiency when optimizing filtered multi-label feature selection techniques. Nevertheless, it does not fully capitalize on the correlational information between features and labels, along with that between labels. For filtered methods, fully utilizing the information inherent in the data is crucial for identifying the optimal subset of features [21]. At the same time, the ACO algorithm struggles to pinpoint the ideal solution when dealing with high-dimensional problems. Consequently, it is worth further investigating how to augment the search optimization ability of ant colonies, which could, in turn, enhance the performance of multi-label feature selection.
Some practice and research have been done, for example, Paniri et al. proposed a filtered technique, denominated as a multi-label feature selection algorithm based on ant colony optimization (MLACO) [18]. This method marked the pioneering application of a filter approach to enhance multi-label feature selection using the ACO algorithm. It conducts a search within the feature space, iteratively identifying the most pertinent features with minimal redundancy in relation to class labels. After the introduction of MLACO, Paniri et al. advanced an innovative approach termed Ant Colony Optimization plus Temporal Difference Reinforcement Learning (ANT-TD) [19], which converted the inherent heuristic search process of an ant colony into a Markov chain framework. The conversion utilized temporal difference reinforcement learning, thereby facilitating a continuous learning paradigm of ants throughout the search process. Concurrent with these developments, Hatami et al. embarked on the creation of a weighted feature map predicated on mutual information [20]. This endeavor utilized mutual information as the cornerstone for designing an innovative adaptive function tailored to the pheromone update process, thereby enhancing the efficacy of the feature selection process. Kakarash et al. developed a KNN Graph to meticulously portray all features along with the interconnections between them [22]. Subsequently, density peak clustering is used to group similar features into one cluster. To identify the least redundant features, the probability of the ant colony staying in one cluster during the search process is lower than jumping into another cluster.
Based on the previous foundation, in the paper, the ACO algorithm is used to construct a search space based on relevance information. The feature selection process is converted into the search procedures of ACO to obtain the optimal subset of features containing discriminative features. This enhancement is designed to augment the dimensionality reduction capabilities for high-dimensional data within multi-label scenarios and to increase the efficiency of multi-label learning. The main contributions of the proposed method are as follows:
1) The proposed method is an improvement upon ACO-based multi-label feature selection that incorporates dynamic redundancy and label correlation. The existing multi-label feature selection methods based on ACO have achieved a certain effect, they ignore the dynamic redundancy between the feature subset and the selected feature in the optimization process and also ignore a feature of multi-label data: label correlation. Unlike existing methods, which primarily focus on the static redundancy among features, our approach addresses the dynamic redundancy that emerges as ant colonies navigate and it accounts for a key aspect of multi-label data, namely label correlation. The paper uses ACO to search for correlations among labels. Then these correlations are transformed into label weights and incorporated into heuristic factors. By embracing dynamic redundancy and label correlation, our enhancement strategy significantly improves the performance of multi-label feature selection using ACO.
2) Experiments are performed on seven benchmark datasets from multiple fields, including text categorization and image annotation. Our method performance is evaluated using four criteria, including Hamming loss (HL), Average-precision (AP), One-error loss (0–1), and Micro-F1. These assessments demonstrate that our method outperforms other feature selection methods.
The rest of the paper is organized as follows: Section 2 introduces the multi-label feature selection, elaborating on their integration to address the multi-label classification problem. Section 3 describes the primary ACO, highlighting the principles of dynamic redundancy and label correlation. Section 4 offers a comprehensive explanation of the proposed method entire process. Section 5 summarizes the experimental outcomes achieved with the proposed method across seven datasets, as well as a comparative analysis with existing techniques. Finally, Section 6 outlines potential directions for future research endeavors.
This section delineates an overview of multi-label classification and multi-label feature selection along with a discussion of two widely used methods for tackling challenges in multi-label classification challenges.
2.1 Overview of Multi-Label Classification
There are generally two approaches for addressing multi-label classification issues: problem transformation and algorithmic adaptation. Problem transformation involves converting the multi-label classification task into multiple single-label classification tasks, allowing the use of established, robust single-label classification algorithms. For instance, the Binary Relevance (BR) method transforms the multi-label problem into a series of binary classification tasks [23]. The BR algorithm uses the entire dataset and trains a binary classifier for each label. When training a classifier for a specific label, only the information pertinent to that label is considered, and other labels are ignored. This approach, however, has a notable disadvantage: it overlooks label correlation. Consequently, label combinations that are dependent on one another may not be predicted in certain datasets. In contrast, the Classifier Chains (CC) algorithm mitigates these issues, delivering improved classification performance with the added benefit of a low time complexity of the BR algorithm [24]. The CC algorithm enhances the BR algorithm by transitioning from individually training binary classifiers to a sequential training process. However, a notable limitation of this method is the difficulty and complexity involved in detecting such correlations, rendering them non-trivial to ascertain. The algorithm adaptation method diverges from the problem transformation approach in its fundamental premise: rather than altering the multi-label classification problems or data, it enhances existing single-label classification algorithms to accommodate and resolve multi-label classification issues directly. The advantage of this strategy is that it circumvents the potential loss of information that can occur during the transformation process. Multi-Label Learning-K-Nearest Neighbor (ML-KNN), which is a multi-label iteration of the K-Nearest Neighbor (KNN) [25], serves as an example of this approach.
2.2 Multi-Label Feature Selection
Feature selection [3] is one of the most important techniques used in machine learning to preprocess data, aimed at curating a subset of the most pertinent features from a vast pool to facilitate accurate classification. Essentially, feature selection can be regarded as a combinatorial optimization problem. It has been applied in different fields, including traveling thief problems [26], text feature selection [27], cancer classification [28], and network traffic identification [29]. Meanwhile, feature selection can be combined with different intelligent optimization algorithms to solve practical problems, such as the Greylag Goose Optimization Algorithm [30], the Hybrid Sine-Cosine Chimp Optimization Algorithm [31] and the WOA [32]. For multi-label data, the filtered subset of features enables the classifier to assign multiple labels to individual instances effectively. In feature selection, it is crucial to identify the optimal subset of features by finding those that are both highly correlated with labels and non-redundant. For example, Asilian Bidgoli et al. [33] proposed an enhanced iteration of the super-multi-objective binary Non-Dominated Sorting Genetic Algorithm-Ⅲ (NSGA-III) algorithm, which optimized the Hamming loss, feature subset size, feature label relevance, and computational complexity of features concurrently. Hashemi et al. [34] introduced the Multi-label Graph-based Feature Selection (MGFS). They first calculated the correlation distance between features and each class label, creating the Correlation Distance Matrix (CDM). They constructed a complete weighted feature map using the Euclidean distance applied to the CDM. Finally, the importance of the graph nodes was determined using the weighted PageRank algorithm of mean. Gonzalez-Lopez et al. [35] utilized two techniques, Euclidean Paradigm Maximization and Geometric Mean Maximization, to select features. The experiments affirmed that the proposed distributed approach effectively selected features with maximum relevance and minimum redundancy, while fully respecting predefined time constraints.
In this section, the implementation of the ACO algorithm in the realm of feature selection is succinctly elucidated.
3.1 Ant Colony Optimization Algorithm for Feature Selection
The ACO algorithm is a widely used optimization technique that imitates the foraging pattern of real-life ants. These ants maintain specific search patterns through a special chemical substance called pheromones. In recent years, this algorithm has seen an increased application in the realm of multi-label feature selection. Ants are a common sight in nature and follow specific patterns when searching for food. They maintain these patterns through the use of a special chemical called pheromones. In nature, ants aim to take the shortest path between their nest and their food source. As they travel, they deposit pheromones on the path, which gradually evaporate, leading to a decrease in their concentration along all pathways. Volatilization is a crucial process that aids in overcoming the challenge of being trapped in local minima and enhances exploration of the search space. Therefore, the concentration of pheromones can significantly influence the path that ants follow, making them more likely to choose paths with higher pheromone concentrations. As a result, ants gradually tend to traverse the shortest path. ACO algorithms frequently convert feature selection processes into the process of an ant colony wandering through a graph. The graph is generally composed of the correlation between features and labels, as well as the redundancy between features. The wandering process of the ant colony is primarily impacted by the pheromone update rule and the state transfer rule.
3.2 Dynamic Redundancy and Label Correlation
In the feature selection process of ACO, the choice of the subsequent feature usually hinges on the redundancy between it and the previous one. However, this static redundancy strategy will result in poor prediction accuracy for certain datasets.
To evaluate the redundancy of previously chosen features and potential ones, a dynamic computational strategy is proposed as in Eq. (1). Suppose that
where
Label relevance is paramount in multi-label learning. To improve the performance of multi-label learning through feature selection, the impact of label correlation needs to be considered. For filtered methods, information theory techniques are often utilized to measure label correlation. The pairwise correlations between labels are computed using symmetric uncertainty in information theory. The formula for symmetric uncertainty is given as Eq. (2):
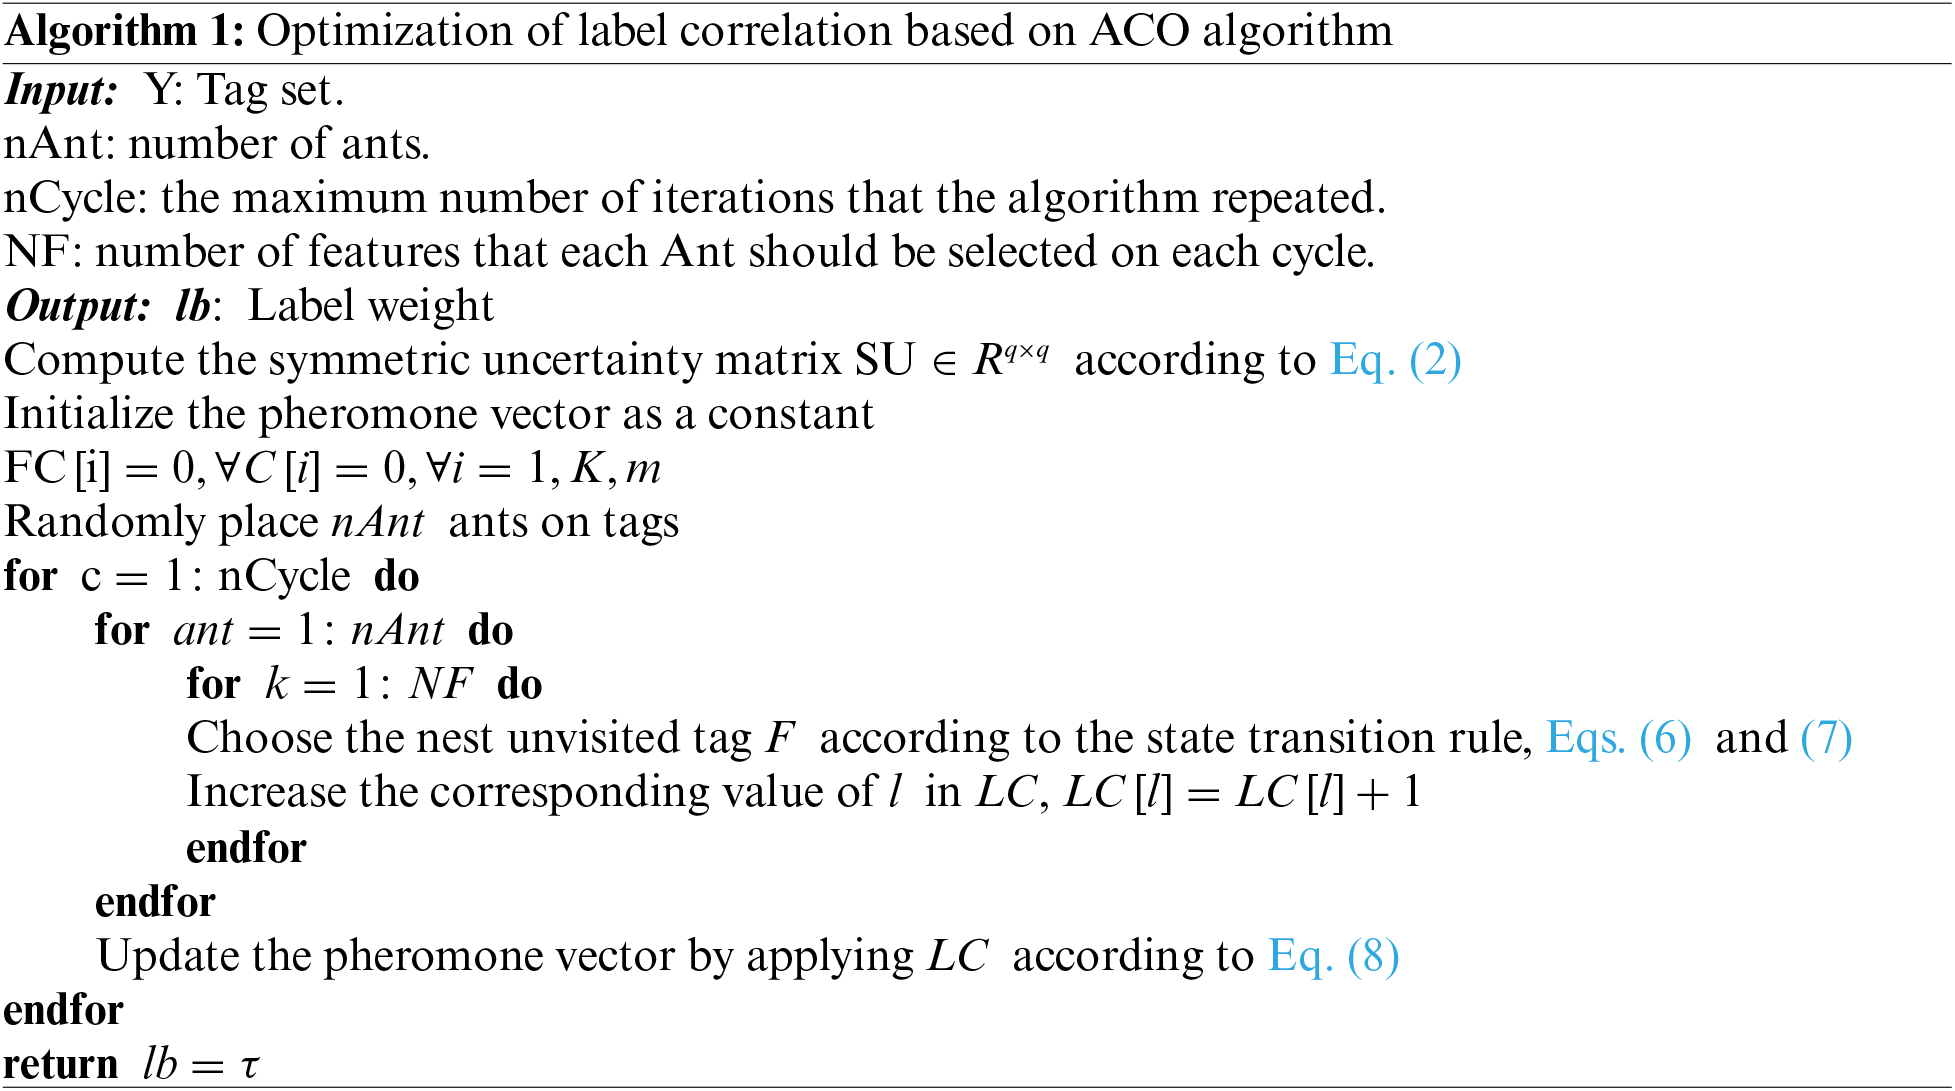
Eq. (2) calculates the pairwise correlation between labels, serving as a heuristic factor for ACO. Here,
The state transition rule is employed during runtime to construct ant paths:
where
where
The paper proposes a multi-label feature selection based on improved ACO by dynamic redundancy and label correlation. The essence of this approach is to explore the correlation between labels using an improved ACO, convert the correlation into label weights, and integrate them into heuristic factors.
In this subsection, feature relevancy and feature label relevancy are computed separately, and then the label relevancy obtained from the ACO algorithm is integrated into the feature label relevancy. Cosine similarity and Pearson correlation coefficient are used in calculating the correlations. Cosine similarity is a mathematical measure, as shown in Eq. (10):
where
The Pearson correlation coefficient is one of the most popular similarity measures, calculated as shown in Eq. (11):
where
To separately evaluate the redundancy between features and the correlation between features and class labels, the redundancy matrix
The proposed approach weights the relevance between each feature and all class labels through labels, preserving and incorporating all feature-label relevance.
The construction of the subset is also the process of information accumulation, feedback, and iteration. The coding method used pheromones as feature weights, that is, it obtains feature ordering by sorting the pheromone values, thus obtaining the feature subset. During the process of wandering of ant colony, the characteristics of the next visit are determined by state transition rules, which encompass two strategies, a probabilistic transfer strategy, and a greedy transfer strategy:
where
where
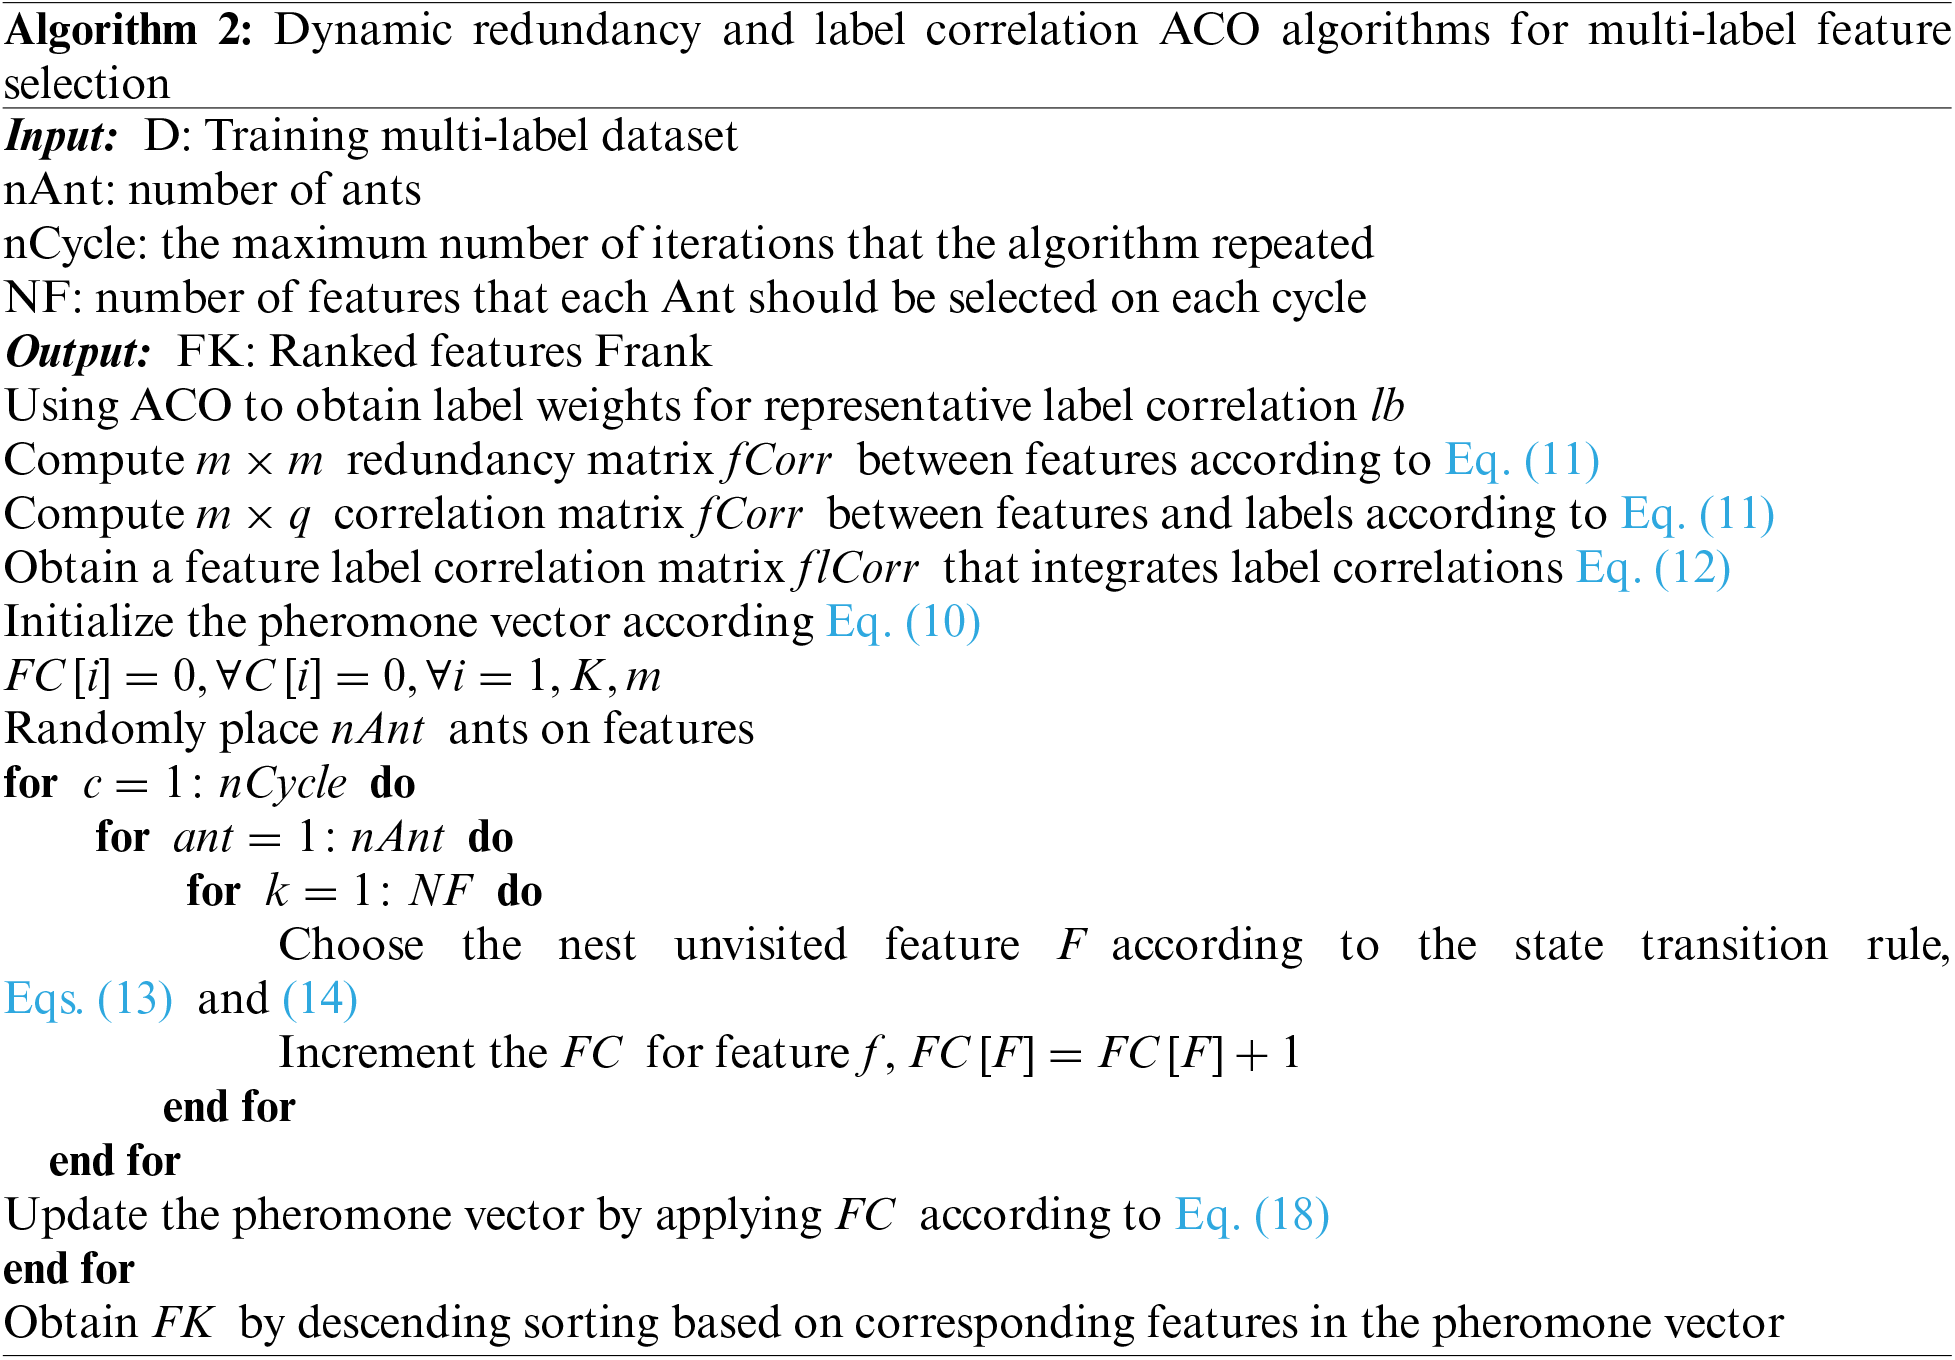
The ant colony selects features and accumulates pheromone values using the aforementioned strategy. The values in the pheromone correspond to the weights of the features. Algorithm 2 provides a detailed description of the proposed method. The specific flow chart is shown in Fig. 1. The computational complexity of the proposed method is analyzed. Firstly, the label weight
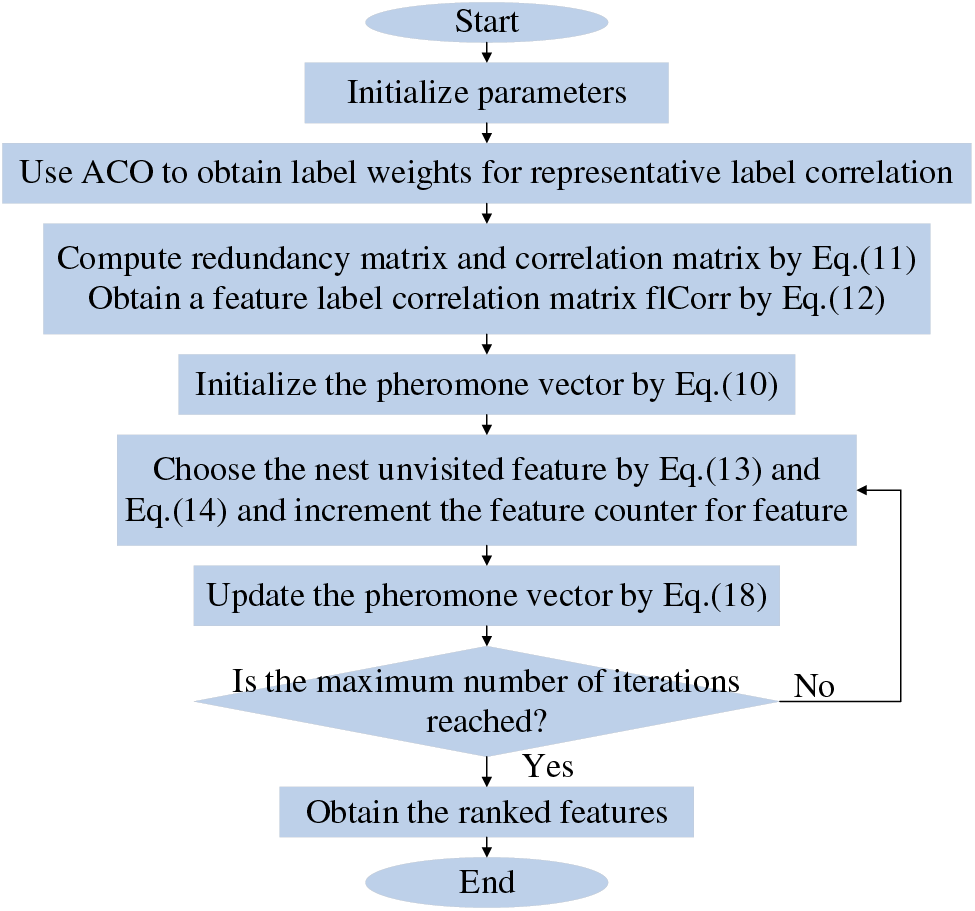
Figure 1: Algorithm 2 flow chart
5 Experiment Results and Discussions
In this section the efficacy of the proposed method is rigorously evaluated across seven multi-label datasets with five filter methods. Subsequently, a thorough presentation of the results is provided, complemented by an extensive analysis and interpretation of the findings.
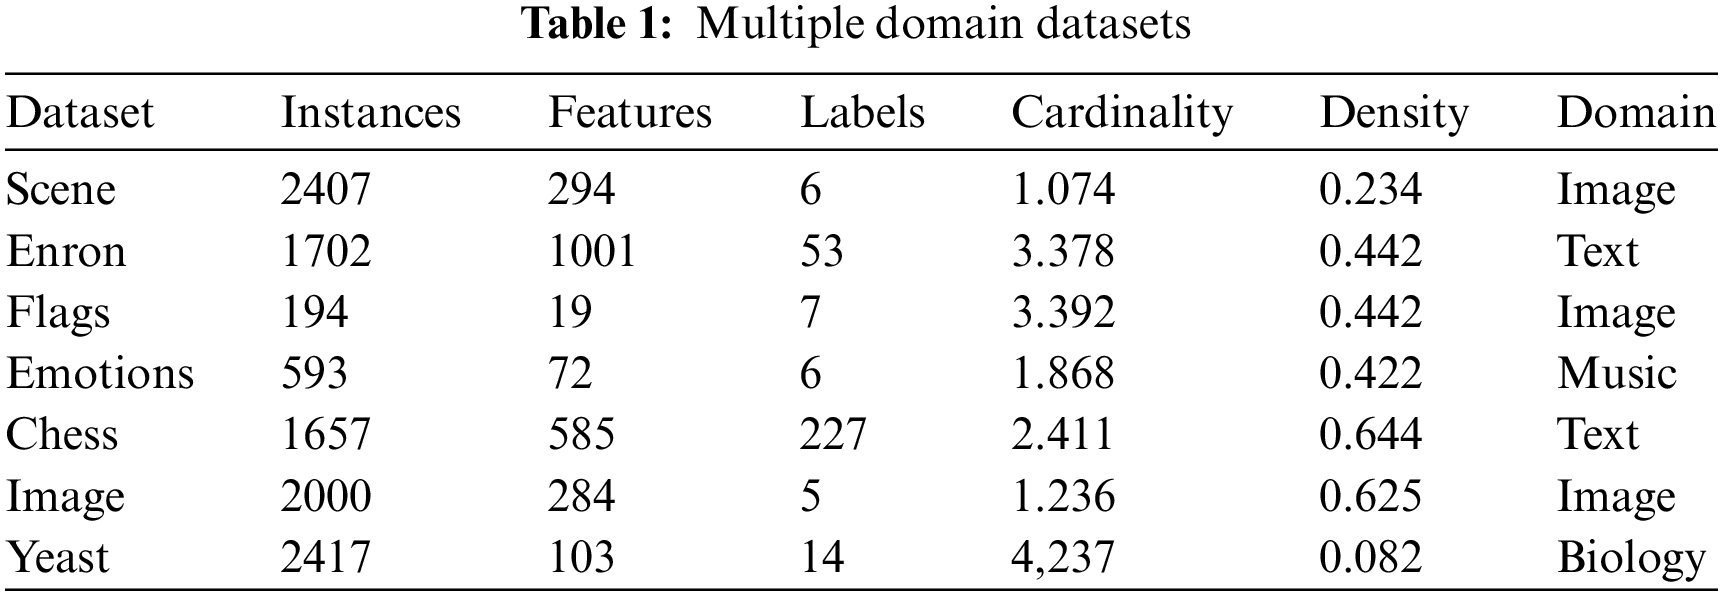
In this work, comprehensive experiments are carried out on authentic public datasets from various domains, including images, text, and biology, as shown in Table 1. It illustrates the number of instances, the number of features, the number of labels, cardinality (average number of labels for per instance), density, and domains for each data set.
The study presents an analysis and discussion of the seven publicly accessible multi-label datasets that were utilized, as well as the five filter methods that were compared, while the performance of all methods is evaluated using four multi-label categorical evaluation metrics. The paper compares the proposed method with MLACO [18], MCLS [36], ELA-Chi [37], PPT-Chi [37], and PPT-MI [37]. MLACO is based on the graph frame and adopts ACO. MCLS uses popular learning transformation and constraints on label space. PPT-CHI, PPT-MI, and ELA-Chi are classic problem-based transformation methods based on mutual information.
The parameters for the comparison methods have been specified. In the MLACO [18] algorithm, the maximum number of iterations is set to 40
Figs. 2–5 illustrate the performance variance of all methods on seven datasets with different sizes of feature subsets. Based on the results, the following observation can be deduced: From the results shown in Fig. 2a, it can be seen that the proposed method outperforms all other methods, achieving the best results. Furthermore, with an increasing number of features, the proposed method exhibits remarkable stability and consistently surpass the compared algorithms. It is observed from Fig. 2b highlights that the performance metrics, particularly one-error and average-precision, exhibit stability with the incremental increase in features. Despite the observed fluctuations and a decline in performance concerning hamming loss and micro-F1 measures, the proposed method consistently maintains a considerable superiority to comparative approaches. The observations from Fig. 3a reveal that all methods exhibit their highest variability on the Flags dataset, which can be attributed to its inherently low feature dimensionality. Additionally, it is discernible that an increase in the number of features does not consistently enhance the classification performance of algorithms. Analysis across the four evaluative metrics indicates that the performance of the proposed method falls short of the benchmark set by comparative methodologies exclusively when dealing with subsets of features with the limited size. Fig. 3b presents the results on the Emotions dataset. The overall trend is the same as the performance on the Scene dataset, with the difference being that the gap between the other methods and the proposed method is more pronounced, especially in hamming loss measures.
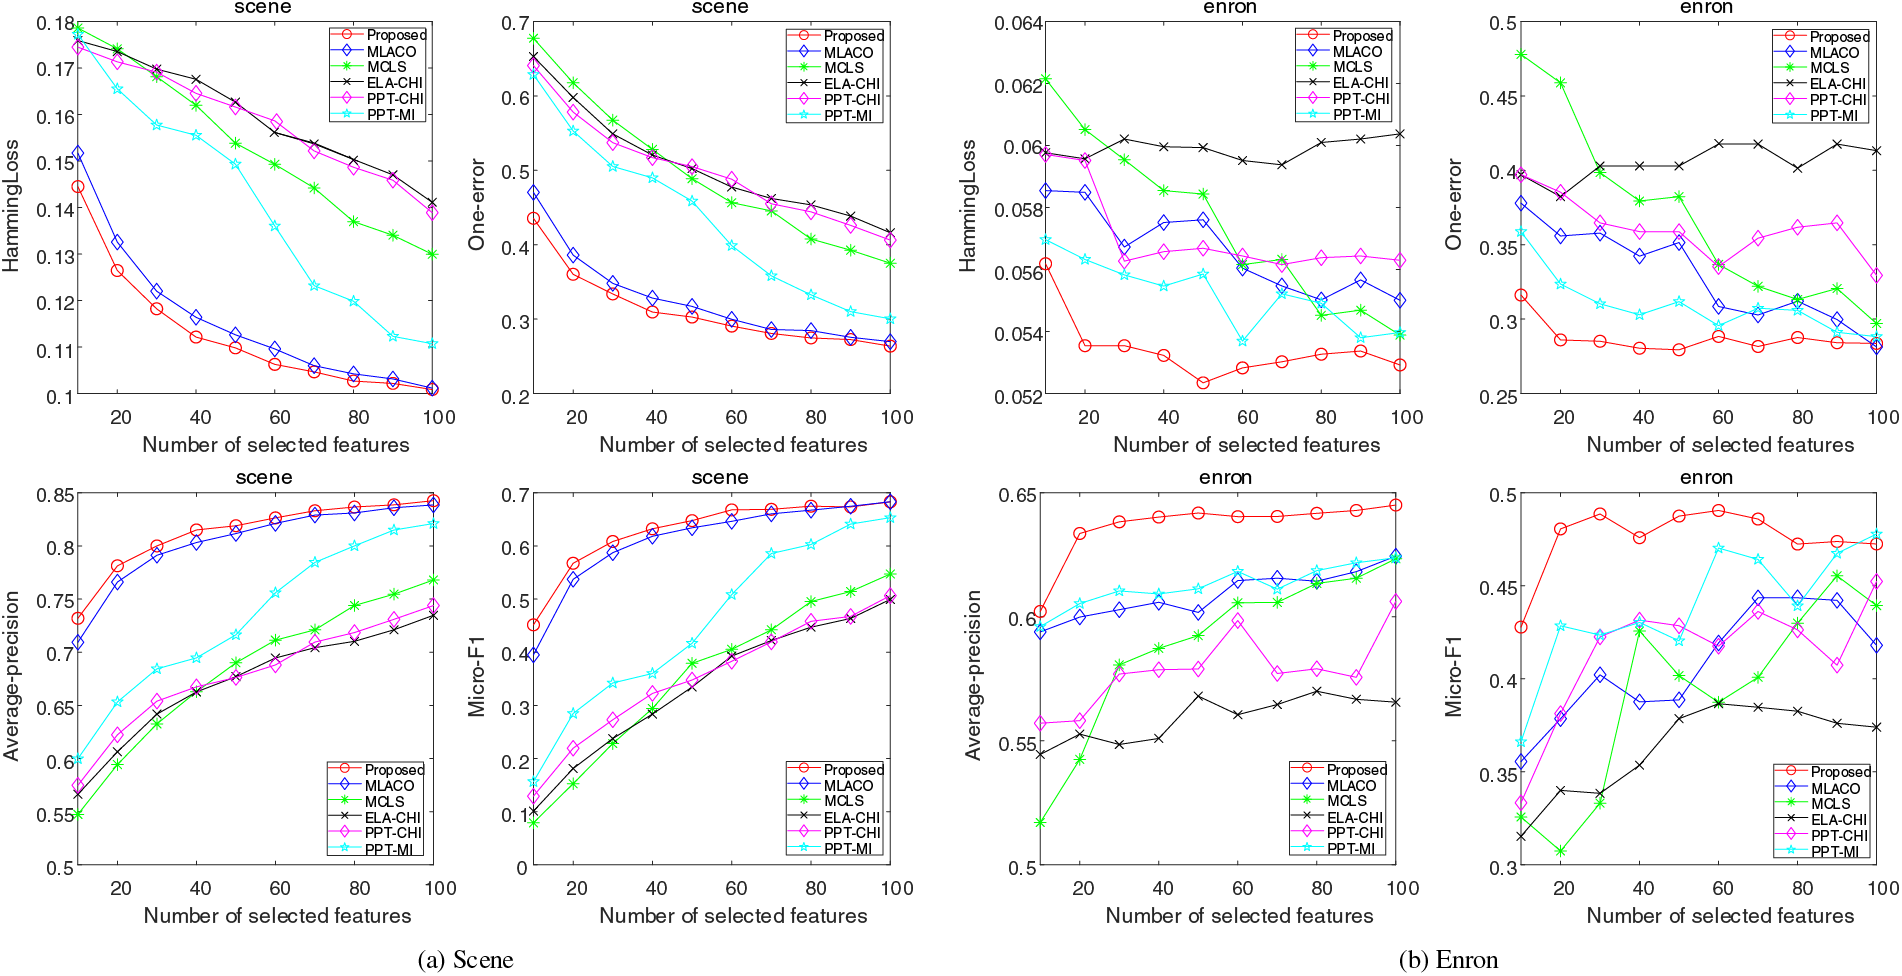
Figure 2: Results of four evaluation indicators on Scene and Enron datasets
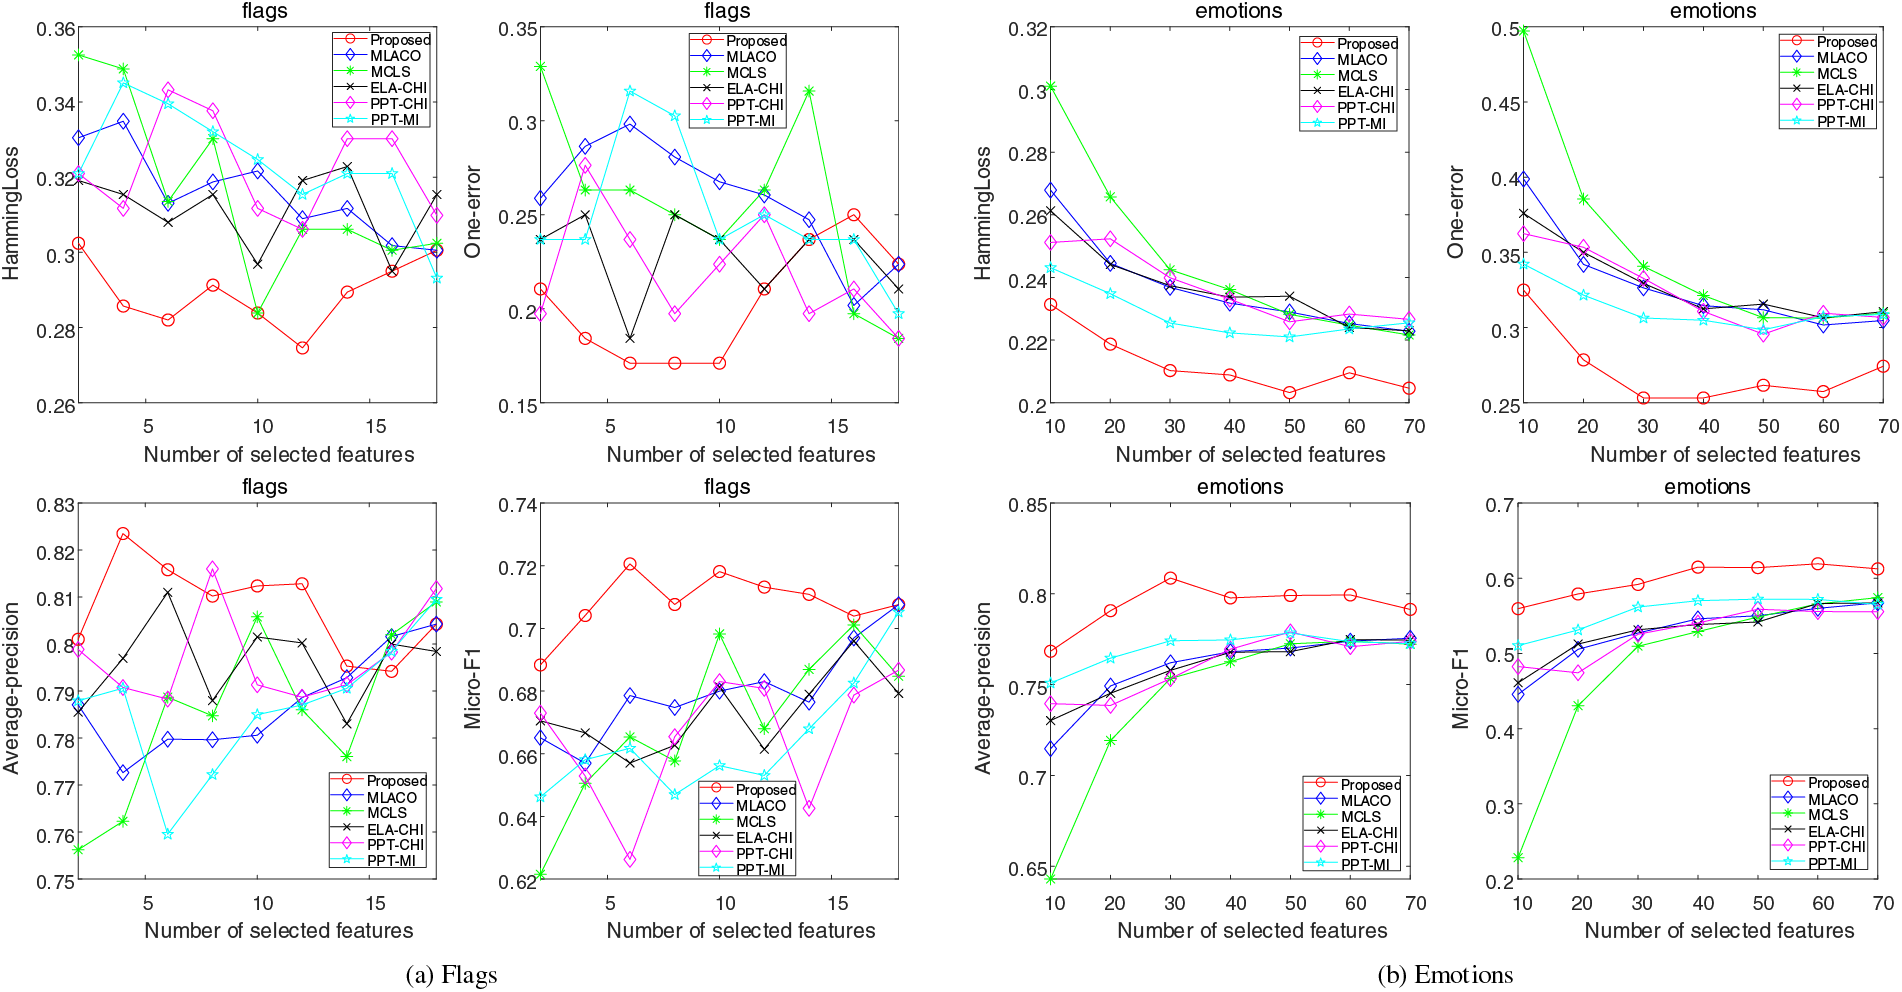
Figure 3: Results of four evaluation indicators on Flags and Emotions datasets
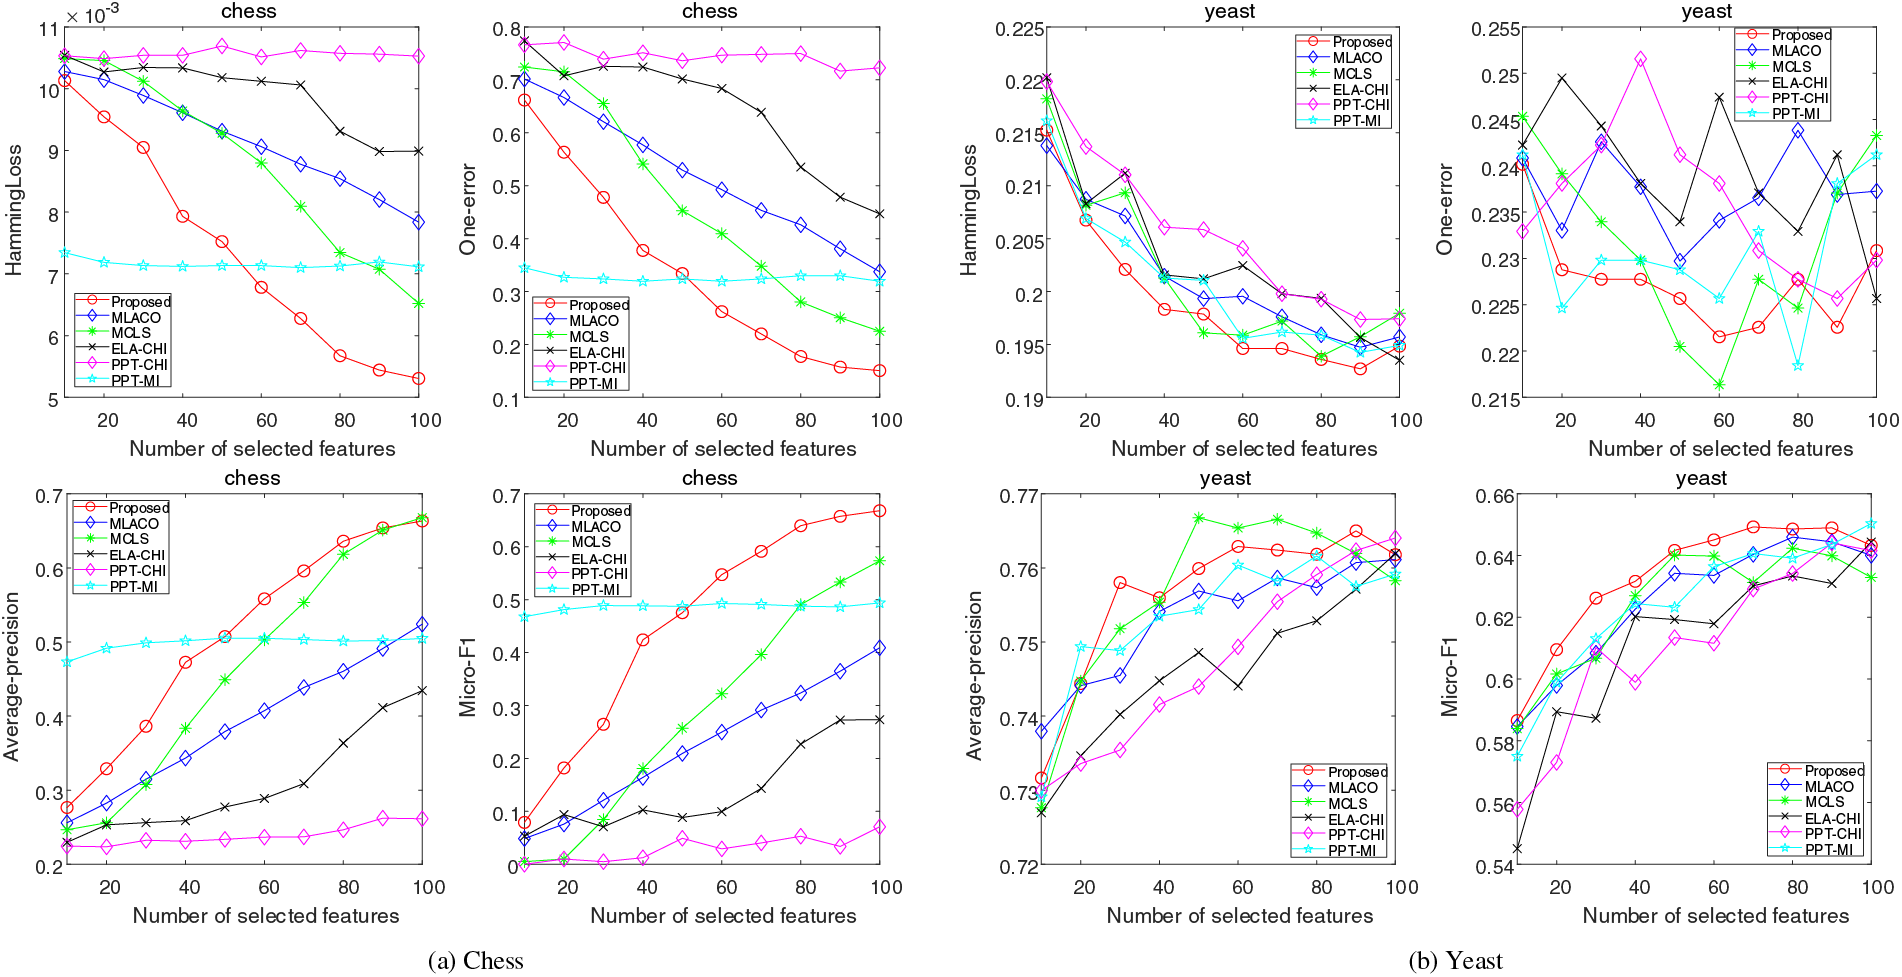
Figure 4: Results of four evaluation indicators on Chess and Yeast datasets
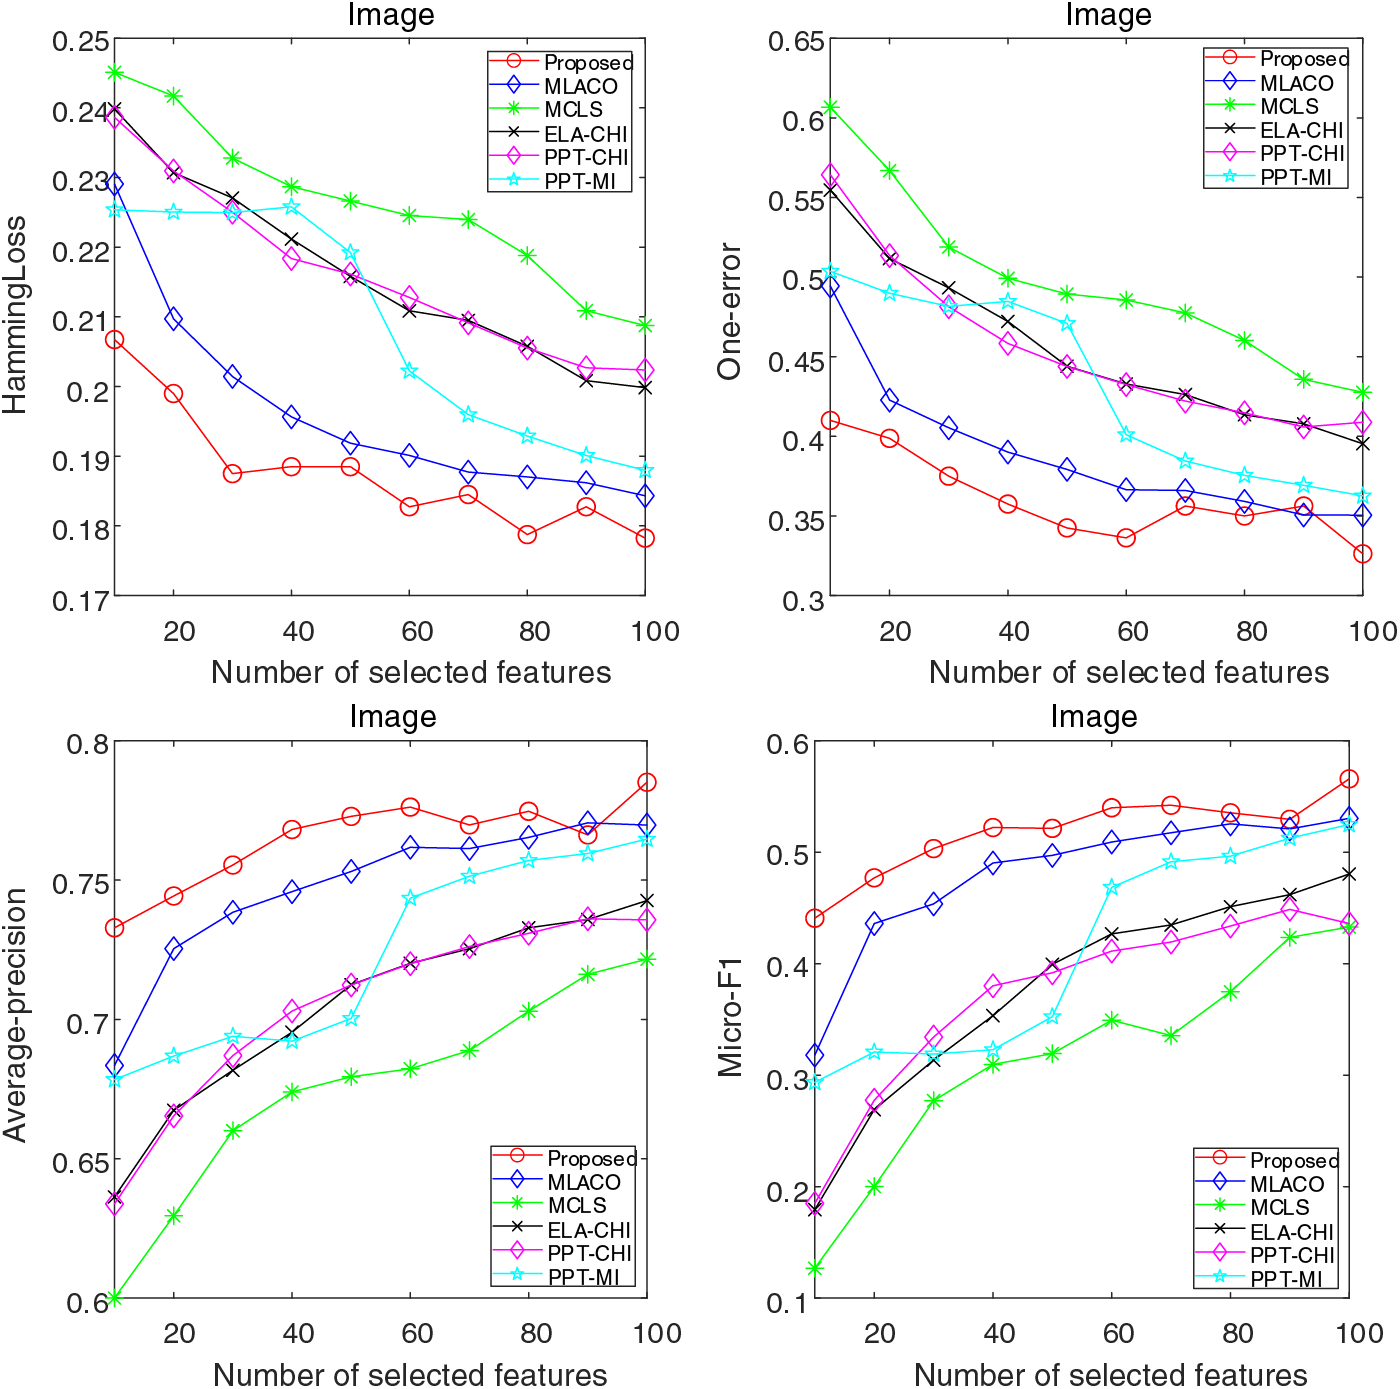
Figure 5: Results of four evaluation indicators on Image dataset
As depicted in Fig. 4a, the performance of the proposed method is observed to be inferior to that of PPT-MI for feature counts less than 60. Beyond the threshold of 60 features, the proposed method asserts its unequivocal superiority across various evaluation metrics. This observation underscores the nuanced efficacy of the proposed method in relation to feature quantity and its comparative advantage over a spectrum of evaluative criteria. According to the results in Fig. 4b, it displays that the proposed method does not match the MCLS in terms of one-error rate and average-precision. Nevertheless, it remains competitive relative to other evaluated methods, such as MLACO. Moreover, for most other evaluation metrics, the proposed method outperforms all compared counterparts. The noticeable decrease in the effectiveness of the proposed method, especially in the Yeast dataset, can likely be attributed to the minimal correlation between labels within the dataset. From the Fig. 5, it can be seen that the performance of the proposed method is monotonically improved with a relatively small feature subset size. Although it is not as stable as the other methods as the feature subset size increases, but remains highly competitive in terms of classification error rate and accuracy. From the overall trend, it can be seen that with the increasing size of feature subset, the classification error of the proposed method consistently decreases, the classification accuracy continues to rise. This improvement sets the proposed method apart from the compared methods, demonstrating its superior performance.
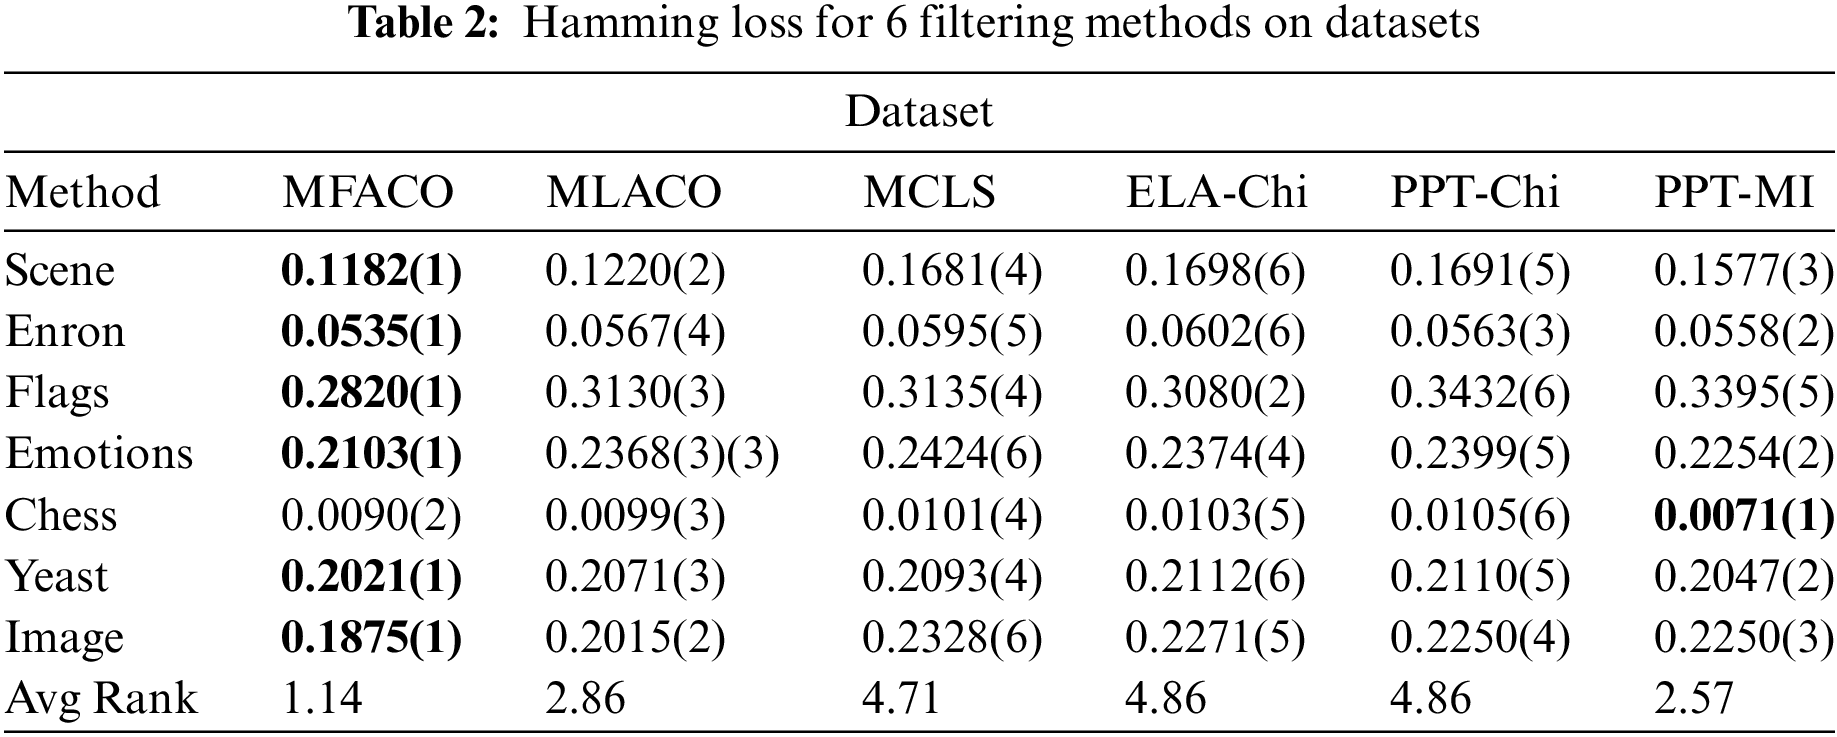
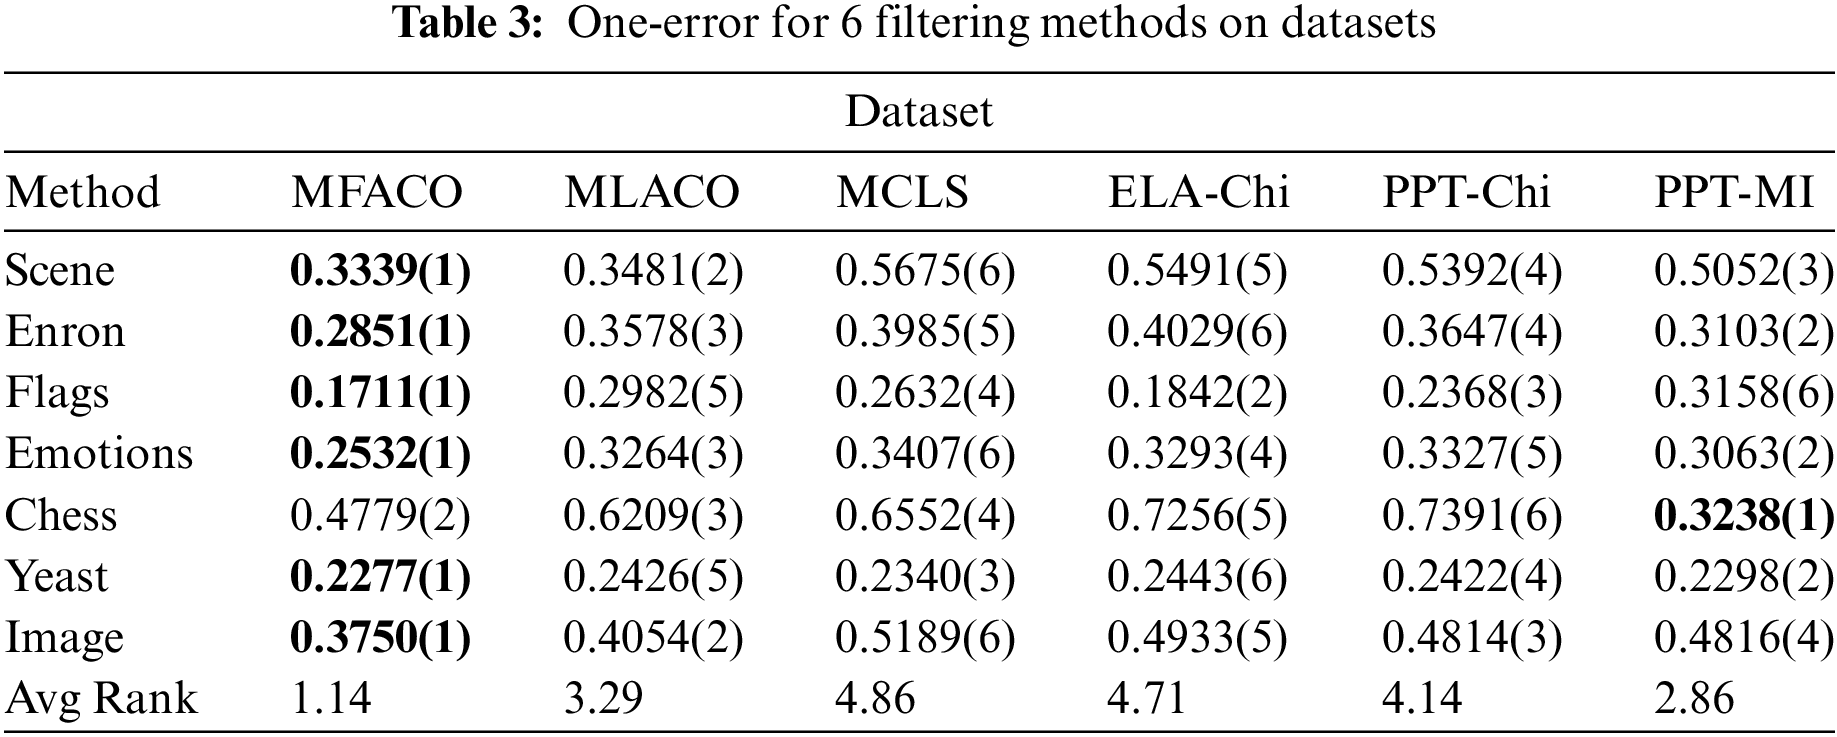
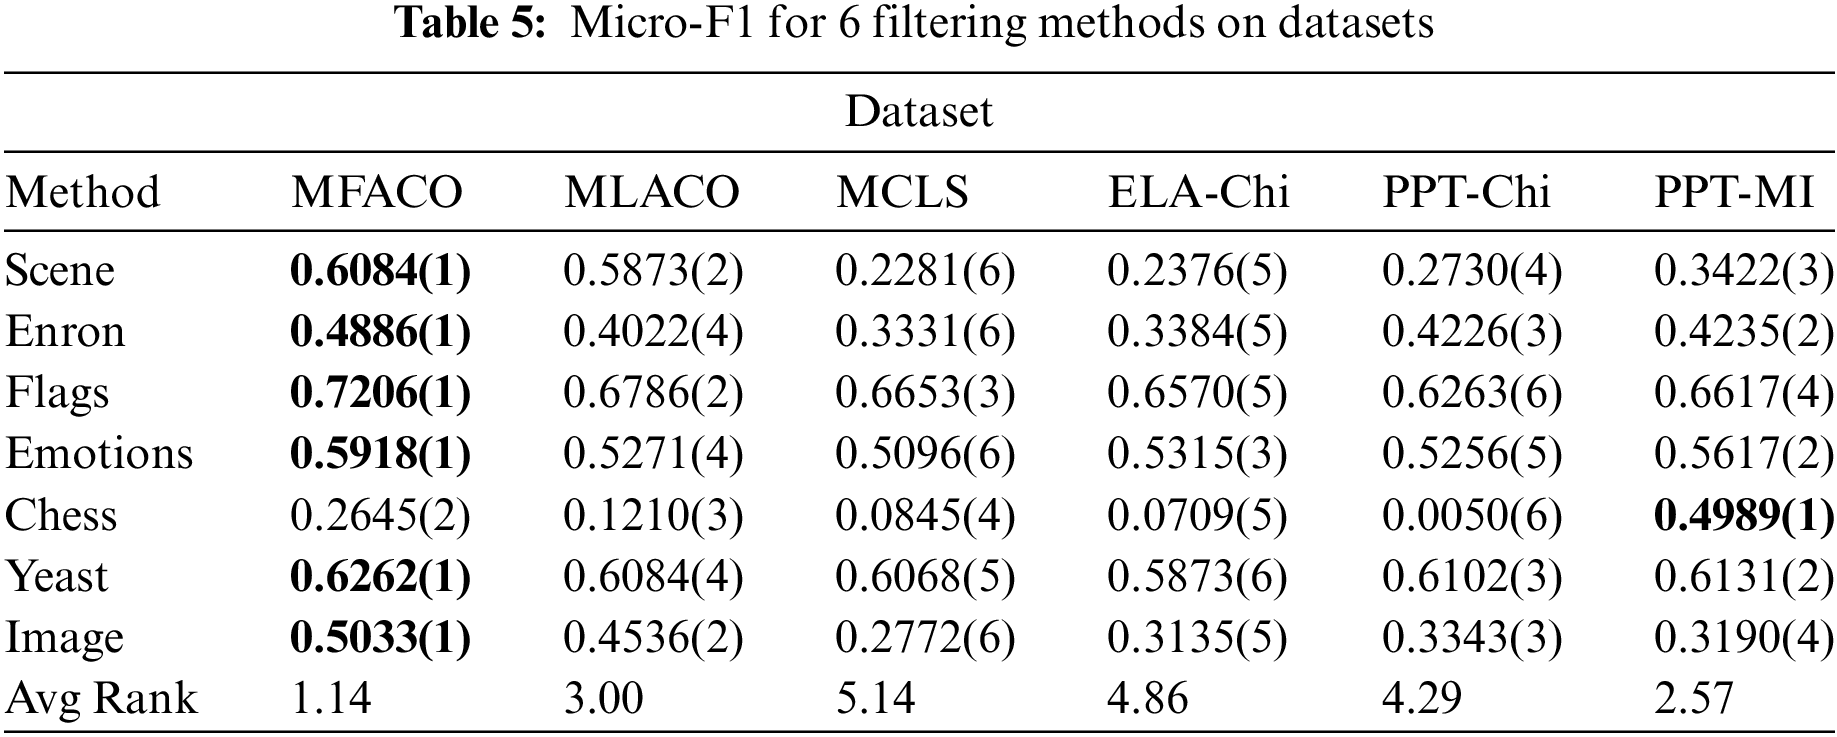
To further demonstrate the effectiveness of the proposed method, quantitative analysis is employed to demonstrate its performance. This involves the use of a feature subset composed of the top 30 features derived from the feature ranking outcomes. The rankings of each method on various datasets are presented in the Tables 2–5 with AvgRank signifying the mean ranking of the performance of each method on all datasets. The boldface in the table indicates the best performance, and the numbers in parentheses indicate the relative ranking of the six algorithms on each evaluation metric for each dataset. In the analysis presented across four tables, the proposed method consistently ranks the top position, with the only exception being its position on the Chess dataset. However, on other data sets, the proposed method significantly performs better than other methods. Additionally, the proposed method attains the highest AvgRank, which is an aggregate performance measure across all metrics. On the four evaluation metrics across the seven datasets, the method achieves average improvements of 6.81%, 18.01%, 6.33%, and 25.14%, respectively, in comparison to MLACO. These improvements indicates that dynamic redundancy and label correlation significantly enhances the search capabilities of the ACO algorithm. Therefore, the proposed method achieves highly competitive performance compared with all the comparing methods.

Based on the previous experimental results, the aim is to compare and analyze the performance of the implemented multi-label feature selection methods. The superiority of the proposed methods is further evaluated. In this subsection, two statistical tests commonly used for multi-label feature selection, namely Friedman test and Posterior Nemenyi test, are used to verify the significance of the variances among the methods.
Initially, the proposed method is tested to obtain multi-label feature selection. If the calculated value Friedman statistic
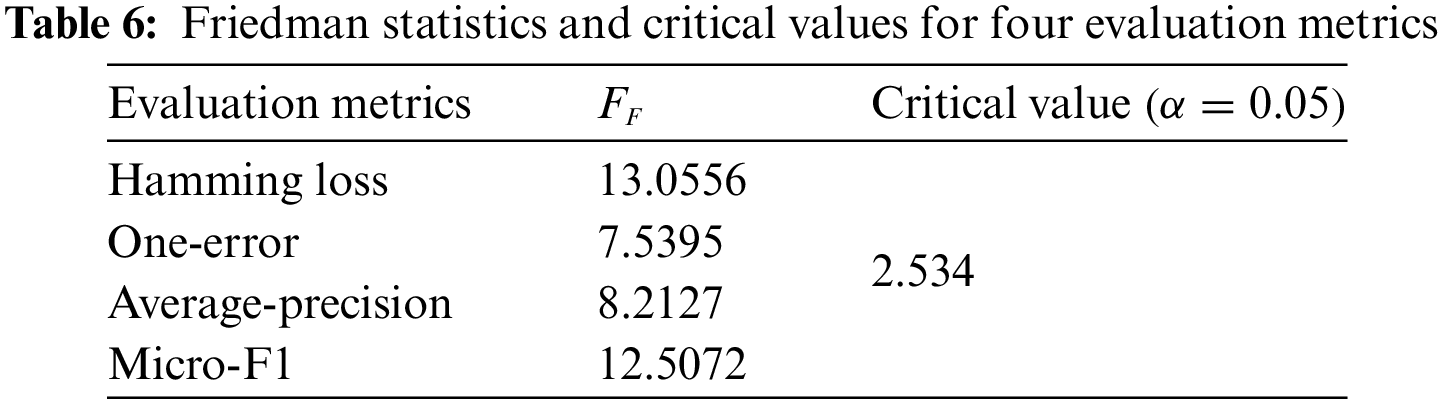
The results from Table 6 indicate that the Friedman statistics for all four evaluation indicators are significantly higher than the critical value, thus rejecting the null hypothesis made. The statistical differences between the methods are also compared visually using the post-hoc test Nemenyi test. The smaller the mean ranking is the better the characterization performance. The mean ranking difference between two methods is compared with the critical distance, if the mean ranking difference is greater than the critical distance then there is a significant difference between the two. The critical distance is indicated by a solid red line. CD (Critical Difference) is calculated as shown in Eq. (19):
where
From Fig. 6, it can be seen that the performance difference between the implemented method and MCLS, ELA-CHI, and PPT-Chi is the most significant. Although the difference between PPT-MI and MLACO is not significant, within a critical distance, the proposed method evaluates first in the ranking, while MLACO is ranked back on average. Taken together, the proposed method has strong competitiveness and gains some performance improvement compared with MLACO. This verifies the effectiveness of incorporating dynamic redundancy and label correlation as correlation information.
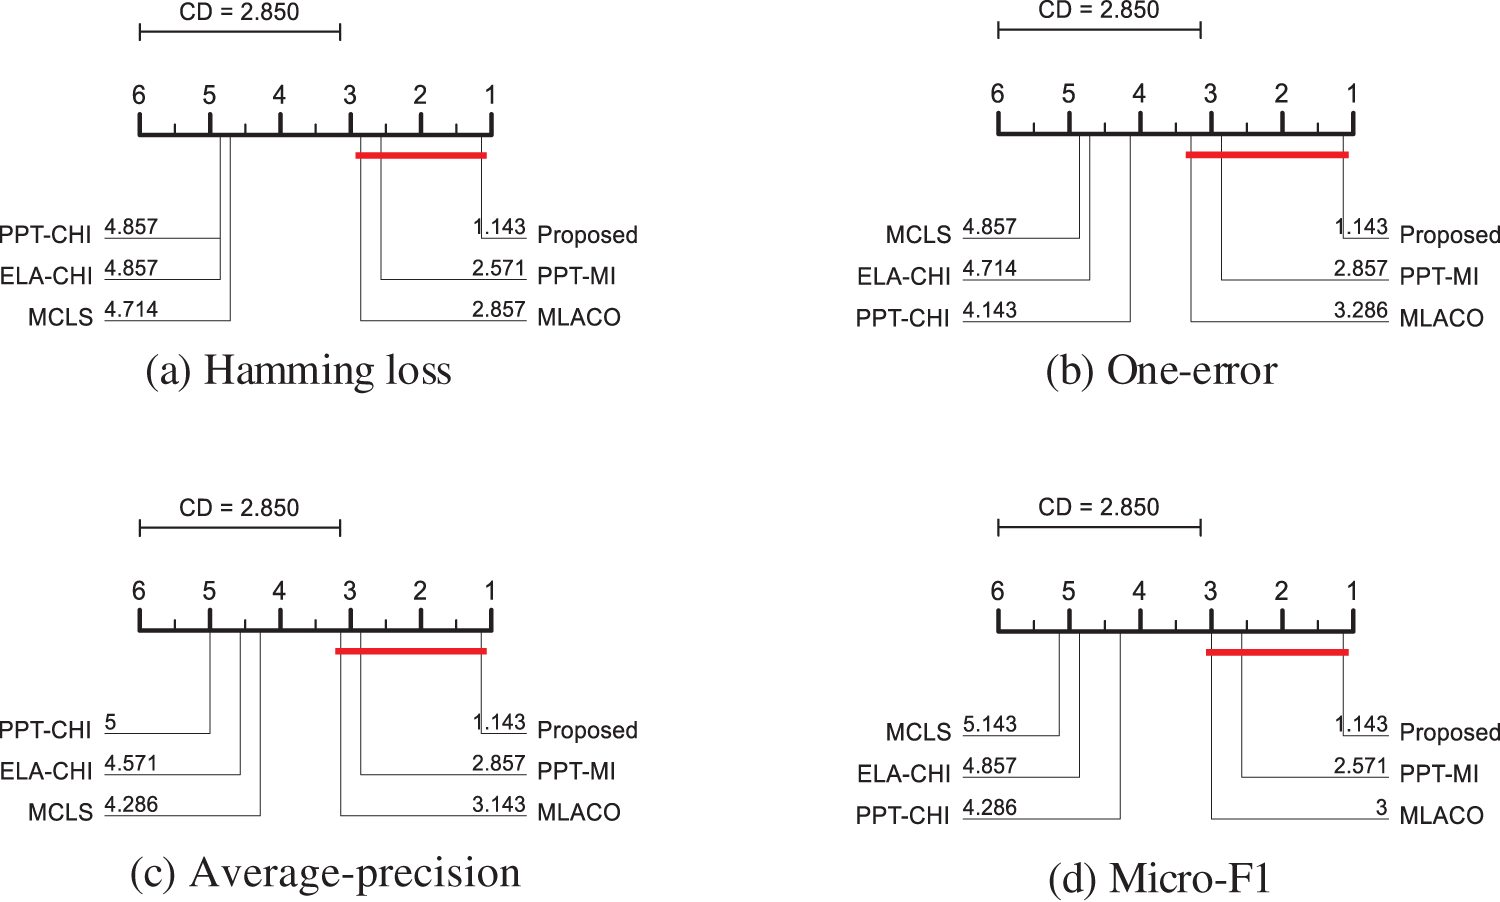
Figure 6: CD map of the four evaluation indicators
In the paper, a multi-label feature selection method is implemented that enhances ACO through the incorporation of dynamic redundancy and label correlation. Firstly, a concept of dynamic redundancy is proposed to ensure that the ant colony pays attention to the change of the redundancy of the selected feature subset at the same time as it wanders around, aiming to yield the lowest possible redundancy in the selected feature set. Secondly, the label relevance matrix is optimized individually by the ant colony to obtain the label weights, and then the label weights are integrated into the feature label relevance, which both incorporates the label relevance and retains all the feature label relevance. The above two strategies enhance the optimization ability of the ant colony, which enables the ant colony to capture discriminative features to obtain the optimal feature subset. The proposed method is compared with filtered methods, other state-of-the-art methods and classical methods that are also used for ACO. It demonstrates superior performance across four evaluation metrics on seven datasets, testifying that search efficacy of ACO has been enhanced and that it successfully pinpoints discriminative features.
Acknowledgement: The authors would like to thank the anonymous reviewers and the editor for their valuable suggestions, which greatly contributed to the improved quality of this article.
Funding Statement: This research was supported by National Natural Science Foundation of China (Grant Nos. 62376089, 62302153, 62302154, 62202147) and the key Research and Development Program of Hubei Province, China (Grant No. 2023BEB024).
Author Contributions: The authors confirm contribution to the paper as follows: study conception and design: Ting Cai, Chun Ye, Zhiwei Ye, Ziyuan Chen; data collection: Chun Ye, Zhiwei Ye, Ziyuan Chen, Mengqing Mei; analysis and interpretation of results: Mengqing Mei, Haichao Zhang, Wanfang Bai, Peng Zhang; draft manuscript preparation: Ting Cai, Chun Ye, Zhiwei Ye, Haichao Zhang. All authors reviewed the results and approved the final version of the manuscript.
Availability of Data and Materials: The data that support the findings of this study are openly available in the Mulan database at the link https://mulan.sourceforge.net/datasets-mlc.html (accessed on 31 August 2024) and the multi-label classification database at http://www.uco.es/kdis/mllresources/ (accessed on 31 August 2024).
Ethics Approval: Not applicable.
Conflicts of Interest: The authors declare that they have no conflicts of interest to report regarding the present study.
References
1. W. Qian, J. Huang, F. Xu, W. Shu, and W. Ding, “A survey on multi-label feature selection from perspectives of label fusion,” Inf. Fusion, vol. 100, 2023, Art. no. 101948. doi: 10.1016/j.inffus.2023.101948. [Google Scholar] [CrossRef]
2. Y. Zhang, J. Wu, Z. Cai, and P. S. Yu, “Multi-view multi-label learning with sparse feature selection for image annotation,” IEEE Trans. Multimedia, vol. 22, no. 11, pp. 2844–2857, Nov. 2020. doi: 10.1109/TMM.2020.2966887. [Google Scholar] [CrossRef]
3. M. Nssibi, G. Manita, and O. Korbaa, “Advances in nature-inspired metaheuristic optimization for feature selection problem: A comprehensive survey,” Comput. Sci. Rev., vol. 49, 2023, Art. no. 100559. doi: 10.1016/j.cosrev.2023.100559. [Google Scholar] [CrossRef]
4. B. Abdollahzadeh and F. S. Gharehchopogh, “A multi-objective optimization algorithm for feature selection problems,” Eng. Comput., vol. 38, pp. 1845–1863, 2022. doi: 10.1007/s00366-021-01369-9. [Google Scholar] [CrossRef]
5. F. Saberi-Movahed et al., “Dual regularized unsupervised feature selection based on matrix factorization and minimum redundancy with application in gene selection,” Knowl.-Based Syst., vol. 256, 2022, Art. no. 109884. doi: 10.1016/j.knosys.2022.109884. [Google Scholar] [CrossRef]
6. W. Shu, Z. Yan, J. Yu, and W. Qian, “Information gain-based semi-supervised feature selection for hybrid data,” Appl. Intell., vol. 53, no. 6, pp. 7310–7325, 2023. doi: 10.1007/s10489-022-03770-3. [Google Scholar] [CrossRef]
7. Y. Wang, H. Tian, T. Li, and X. Liu, “A two-stage clonal selection algorithm for local feature selection on high-dimensional data,” Inf. Sci., vol. 677, 2024, Art. no. 120867. doi: 10.1016/j.ins.2024.120867. [Google Scholar] [CrossRef]
8. J. Wang, P. Xu, X. Ji, M. Li, and W. Lu, “MIC-SHAP: An ensemble feature selection method for materials machine learning,” Mater. Today Commun., vol. 37, 2023, Art. no. 106910. doi: 10.1016/j.mtcomm.2023.106910. [Google Scholar] [CrossRef]
9. D. Yang, C. Zhou, X. Wei, Z. Chen, and Z. Zhang, “Multi-strategy assisted multi-objective whale optimization algorithm for feature selection,” Comput. Model. Eng. Sci., vol. 140, no. 2, pp. 1563–1593, 2024. doi: 10.32604/cmes.2024.048049. [Google Scholar] [CrossRef]
10. Z. Ye, J. Luo, W. Zhou, M. Wang, and Q. He, “An ensemble framework with improved hybrid breeding optimization-based feature selection for intrusion detection,” Future Gener. Comput. Syst., vol. 151, no. 3, pp. 124–136, 2023. doi: 10.1016/j.future.2023.09.035. [Google Scholar] [CrossRef]
11. Y. Tang, K. Huang, Z. Tan, M. Fang, and H. Huang, “Multi-subswarm cooperative particle swarm optimization algorithm and its application,” Inf. Sci., vol. 677, 2024, Art. no. 120887. doi: 10.1016/j.ins.2024.120887. [Google Scholar] [CrossRef]
12. Q. Yang, J. Liu, Z. Wu, and S. He, “A fusion algorithm based on whale and grey wolf optimization algorithm for solving real-world optimization problems,” Appl. Soft Comput., vol. 146, 2023, Art. no. 110701. doi: 10.1016/j.asoc.2023.110701. [Google Scholar] [CrossRef]
13. A. Z. Ye et al., “High-Dimensional feature selection based on improved binary ant colony optimization combined with hybrid rice optimization algorithm,” Int. J. Intell. Syst., vol. 1, pp. 1–27, 2023. doi: 10.1155/2023/1444938. [Google Scholar] [CrossRef]
14. M. Alzaqebah et al., “Improved whale optimization with local-search method for feature selection,” Comput. Mater. Contin., vol. 75, no. 1, pp. 1371–1389, 2023. doi: 10.32604/cmc.2023.033509. [Google Scholar] [CrossRef]
15. C. Chandrashekar, P. Krishnadoss, V. K. Poornachary, and B. Ananthakrishnan, “MCWOA Scheduler: Modified chimp-whale optimization algorithm for task scheduling in cloud computing,” Comput. Mater. Contin., vol. 78, no. 2, pp. 2593–2616, 2024. doi: 10.32604/cmc.2024.046304. [Google Scholar] [CrossRef]
16. M. Ghosh, R. Guha, R. Sarkar, and A. Abraham, “A wrapper-filter feature selection technique based on ant colony optimization,” Neural Comput. Appl., vol. 32, no. 12, pp. 7839–7857, 2020. doi: 10.1007/s00521-019-04171-3. [Google Scholar] [CrossRef]
17. W. Ma, X. Zhou, H. Zhu, L. Li, and L. Jiao, “A two-stage hybrid ant colony optimization for high-dimensional feature selection,” Pattern Recognit., vol. 116, 2021, Art. no. 107933. doi: 10.1016/j.patcog.2021.107933. [Google Scholar] [CrossRef]
18. M. Paniri, M. B. Dowlatshahi, and H. Nezamabadi-Pour, “MLACO: A multi-label feature selection algorithm based on ant colony optimization,” Knowl.-Based Syst., vol. 192, 2020, Art. no. 105285. doi: 10.1016/j.knosys.2019.105285. [Google Scholar] [CrossRef]
19. M. Paniri, M. B. Dowlatshahi, and H. Nezamabadi-pour, “Ant-TD: Ant colony optimization plus temporal difference reinforcement learning for multi-label feature selection,” Swarm Evol. Comput., vol. 64, 2021, Art. no. 100892. doi: 10.1016/j.swevo.2021.100892. [Google Scholar] [CrossRef]
20. M. Hatami, S. R. Mahmood, and P. Moradi, “A graph-based multi-label feature selection using ant colony optimization,” in 10th Int. Symp. Telecommun. (IST), Tehran, Iran, 2020, pp. 175–180. [Google Scholar]
21. A. K. Shukla, P. Singh, and M. Vardhan, “A hybrid framework for optimal feature subset selection,” J. Intell. Fuzzy Syst., vol. 36, no. 3, pp. 2247–2259, 2019. doi: 10.3233/JIFS-169936. [Google Scholar] [CrossRef]
22. Z. A. Kakarash, F. Mardukhia, and P. Moradi, “Multi-label feature selection using density-based graph clustering and ant colony optimization,” J. Comput. Des. Eng., vol. 10, no. 1, pp. 122–138, 2023. doi: 10.1093/jcde/qwac120. [Google Scholar] [CrossRef]
23. O. Luaces, J. Díez, J. Barranquero, J. J. del Coz, and A. Bahamonde, “Binary relevance efficacy for multilabel classification,” Prog. Artif. Intell., vol. 1, no. 4, pp. 303–313, 2012. doi: 10.1007/s13748-012-0030-x. [Google Scholar] [CrossRef]
24. J. Read, B. Pfahringer, G. Holmes, and E. Frank, “Classifier chains for multi-label classification,” Mach. Learn., vol. 85, no. 3, pp. 333–359, 2011. doi: 10.1007/s10994-011-5256-5. [Google Scholar] [CrossRef]
25. M. L. Zhang and Z. H. Zhou, “ML-KNN: A lazy learning approach to multi-label learning,” Pattern Recognit., vol. 40, no. 7, pp. 2038–2048, 2007. doi: 10.1016/j.patcog.2006.12.019. [Google Scholar] [CrossRef]
26. A. Nikfarjam, A. Neumann, and F. Neumann, “Evolutionary diversity optimisation for the traveling thief problem,” in Proc. Genet. Evol. Comput. Conf., New York, NY, USA, Jul. 2022, pp. 749–756. [Google Scholar]
27. H. Chen, X. Zhou, and D. Shi, “A chaotic antlion optimization algorithm for text feature selection,” Int. J. Comput. Intell. Syst., vol. 15, no. 1, 2022, Art. no. 41. doi: 10.1007/s44196-022-00094-5. [Google Scholar] [CrossRef]
28. H. AlShamlan and H. AlMazrua, “Enhancing cancer classification through a hybrid bio-inspired evolutionary algorithm for biomarker gene selection,” Comput. Mater. Contin., vol. 79, no. 1, pp. 675–694, 2024. doi: 10.32604/cmc.2024.048146. [Google Scholar] [CrossRef]
29. Q. Wu, H. Xu, and M. Liu, “Applying an improved dung beetle optimizer algorithm to network traffic identification,” Comput. Mater. Contin., vol. 78, no. 3, pp. 4091–4107, 2024. doi: 10.32604/cmc.2024.048461. [Google Scholar] [CrossRef]
30. E. S. M. El-Kenawy, N. Khodadadi, S. Mirjalili, A. A. Abdelhamid, M. M. Eid, and A. Ibrahim, “Greylag goose optimization: Nature-inspired optimization algorithm,” Expert. Syst. Appl., vol. 238, 2024, Art. no. 122147. doi: 10.1016/j.eswa.2023.122147. [Google Scholar] [CrossRef]
31. S. Wang, Q. Yuan, W. Tan, T. Yang, and L. Zeng, “SCChOA: Hybrid sine-cosine chimp optimization algorithm for feature selection,” Comput. Mater. Contin., vol. 77, no. 3, pp. 3057–3075, 2023. doi: 10.32604/cmc.2023.044807. [Google Scholar] [CrossRef]
32. B. Kaur, S. Rathi, and R. K. Agrawal, “Enhanced depression detection from speech using quantum whale optimization algorithm for feature selection,” Comput. Biol. Med., vol. 150, 2022, Art. no. 106122. doi: 10.1016/j.compbiomed.2022.106122. [Google Scholar] [PubMed] [CrossRef]
33. A. Asilian Bidgoli, H. Ebrahimpour-Komleh, and S. Rahnamayan, “A novel binary many-objective feature selection algorithm for multi-label data classification,” Int. J. Mach. Learn. Cyber, vol. 12, no. 7, pp. 2041–2057, 2021. doi: 10.1007/s13042-021-01291-y. [Google Scholar] [CrossRef]
34. A. Hashemi, M. B. Dowlatshahi, and H. Nezamabadi-Pour, “MGFS: A multi-label graph-based feature selection algorithm via PageRank centrality,” Expert. Syst. Appl., vol. 142, 2020, Art. no. 113024. doi: 10.1016/j.eswa.2019.113024. [Google Scholar] [CrossRef]
35. J. Gonzalez-Lopez, S. Ventura, and A. Cano, “Distributed multi-label feature selection using individual mutual information measures,” Knowl.-Based Syst., vol. 188, 2020, Art. no. 105052. doi: 10.1016/j.knosys.2019.105052. [Google Scholar] [CrossRef]
36. R. Huang, W. Jiang, and G. Sun, “Manifold-based constraint Laplacian score for multi-label feature selection,” Pattern Recognit. Lett., vol. 112, no. 3, pp. 346–352, 2018. doi: 10.1016/j.patrec.2018.08.021. [Google Scholar] [CrossRef]
37. K. J. Kim and C. H. Jun, “Dynamic mutual information-based feature selection for multi-label learning,” Intell. Data Anal., vol. 27, no. 4, pp. 891–909, 2023. doi: 10.3233/IDA-226666. [Google Scholar] [CrossRef]
Cite This Article
 Copyright © 2024 The Author(s). Published by Tech Science Press.
This work is licensed under a Creative Commons Attribution 4.0 International License , which permits unrestricted use, distribution, and reproduction in any medium, provided the original work is properly cited.
 Downloads
 Citation Tools