
 Submit a Paper
 Propose a Special lssue
 Open Access
ARTICLE

Efficient and Cost-Effective Vehicle Detection in Foggy Weather for Edge/Fog-Enabled Traffic Surveillance and Collision Avoidance Systems
1 Department of Computer Science, National Textile University, Faisalabad, 37610, Pakistan
2 College of Computer and Information Sciences, Imam Mohammad Ibn Saud Islamic University (IMSIU), Riyadh, 11432, Saudi Arabia
3 Department of Computer Science, University of Agriculture, Faisalabad, 38000, Pakistan
* Corresponding Author: Qaisar Abbas. Email:
Computers, Materials & Continua 2024, 81(1), 911-931. https://doi.org/10.32604/cmc.2024.055049
Received 14 June 2024; Accepted 02 September 2024; Issue published 15 October 2024
 View Full Text
 Download PDF
Abstract
Vision-based vehicle detection in adverse weather conditions such as fog, haze, and mist is a challenging research area in the fields of autonomous vehicles, collision avoidance, and Internet of Things (IoT)-enabled edge/fog computing traffic surveillance and monitoring systems. Efficient and cost-effective vehicle detection at high accuracy and speed in foggy weather is essential to avoiding road traffic collisions in real-time. To evaluate vision-based vehicle detection performance in foggy weather conditions, state-of-the-art Vehicle Detection in Adverse Weather Nature (DAWN) and Foggy Driving (FD) datasets are self-annotated using the YOLO LABEL tool and customized to four vehicle detection classes: cars, buses, motorcycles, and trucks. The state-of-the-art single-stage deep learning algorithms YOLO-V5, and YOLO-V8 are considered for the task of vehicle detection. Furthermore, YOLO-V5s is enhanced by introducing attention modules Convolutional Block Attention Module (CBAM), Normalized-based Attention Module (NAM), and Simple Attention Module (SimAM) after the SPPF module as well as YOLO-V5l with BiFPN. Their vehicle detection accuracy parameters and running speed is validated on cloud (Google Colab) and edge (local) systems. The mAP50 score of YOLO-V5n is 72.60%, YOLO-V5s is 75.20%, YOLO-V5m is 73.40%, and YOLO-V5l is 77.30%; and YOLO-V8n is 60.20%, YOLO-V8s is 73.50%, YOLO-V8m is 73.80%, and YOLO-V8l is 72.60% on DAWN dataset. The mAP50 score of YOLO-V5n is 43.90%, YOLO-V5s is 40.10%, YOLO-V5m is 49.70%, and YOLO-V5l is 57.30%; and YOLO-V8n is 41.60%, YOLO-V8s is 46.90%, YOLO-V8m is 42.90%, and YOLO-V8l is 44.80% on FD dataset. The vehicle detection speed of YOLO-V5n is 59 Frame Per Seconds (FPS), YOLO-V5s is 47 FPS, YOLO-V5m is 38 FPS, and YOLO-V5l is 30 FPS; and YOLO-V8n is 185 FPS, YOLO-V8s is 109 FPS, YOLO-V8m is 72 FPS, and YOLO-V8l is 63 FPS on DAWN dataset. The vehicle detection speed of YOLO-V5n is 26 FPS, YOLO-V5s is 24 FPS, YOLO-V5m is 22 FPS, and YOLO-V5l is 17 FPS; and YOLO-V8n is 313 FPS, YOLO-V8s is 182 FPS, YOLO-V8m is 99 FPS, and YOLO-V8l is 60 FPS on FD dataset. YOLO-V5s, YOLO-V5s variants and YOLO-V5l_BiFPN, and YOLO-V8 algorithms are efficient and cost-effective solution for real-time vision-based vehicle detection in foggy weather.Keywords
Road traffic collisions are the primary cause of injuries, specifically for persons aged 5–29, with approximately 1.3 million people dying a year. About 93% of the world’s road traffic fatalities occur in low- to middle-income countries, which have about 60% of the world’s vehicles and cost 3% of most countries’ gross domestic product [1]. According to the Pakistan bureau of statistics traffic accidents annual report for 2022, in 2020–2021, the total number of reported traffic accidents was 10,429, with 4721 cases of fatal accidents and 5708 cases of non-fatal accidents. In total, 5816 people were killed, 12,886 were injured, and 15,351 vehicles were affected [2]. The number of reported road and traffic accidents is still increasing, causing fatal and non-fatal injuries and deaths, road and infrastructure damage, increasing traffic congestion on the roads, individual’s financial, health, and life loss, putting the load on hospitals, etc. Inclement weather is the leading cause of road fatalities among traffic crashes. According to ten years of statistics from the national highway traffic safety administration, 21% of vehicle crashes, 19% of crash injuries, and 16% of crash fatalities are due to inclement or adverse weather conditions [3]. Adverse weather conditions such as fog, snow, rain, hail, slush, ground blizzards, and strong winds negatively affect driving behavior, visibility distance, traffic flow characteristics, vehicle performance, surface conditions, and road safety. Fog, fog condition, foggy weather, or foggy area will result in the reduction of the road visibility distance, which is an alarming situation because it distracts the normal driving behavior (car following, speed adjustments, and lane changing) and reduces the efficiency of the traffic operations, hence resulting in road traffic crashes [4]. State-of-the-art vehicle detection systems are the key solution to modern traffic surveillance, driver assistance, and automated driving systems [5,6]. Object detection is a critical area of research in computer vision. Object detection algorithms use camera sensors to locate and classify objects in indoor and outdoor environments. Cameras are now more accurate at detecting objects and more cost-effective than other sensors [7]. Rectangular bounding boxes locate the detected objects and further classify or categorize them. Object detection for any real-time application involves object classification, semantic, and instance segmentation [8]. IoT enabled smart transportation systems and vehicle detection techniques are the essential technologies for traffic efficiency, optimization, and surveillance [9,10]. Vehicle detection characteristics, challenges, algorithms, and applications are presented in Fig. 1.
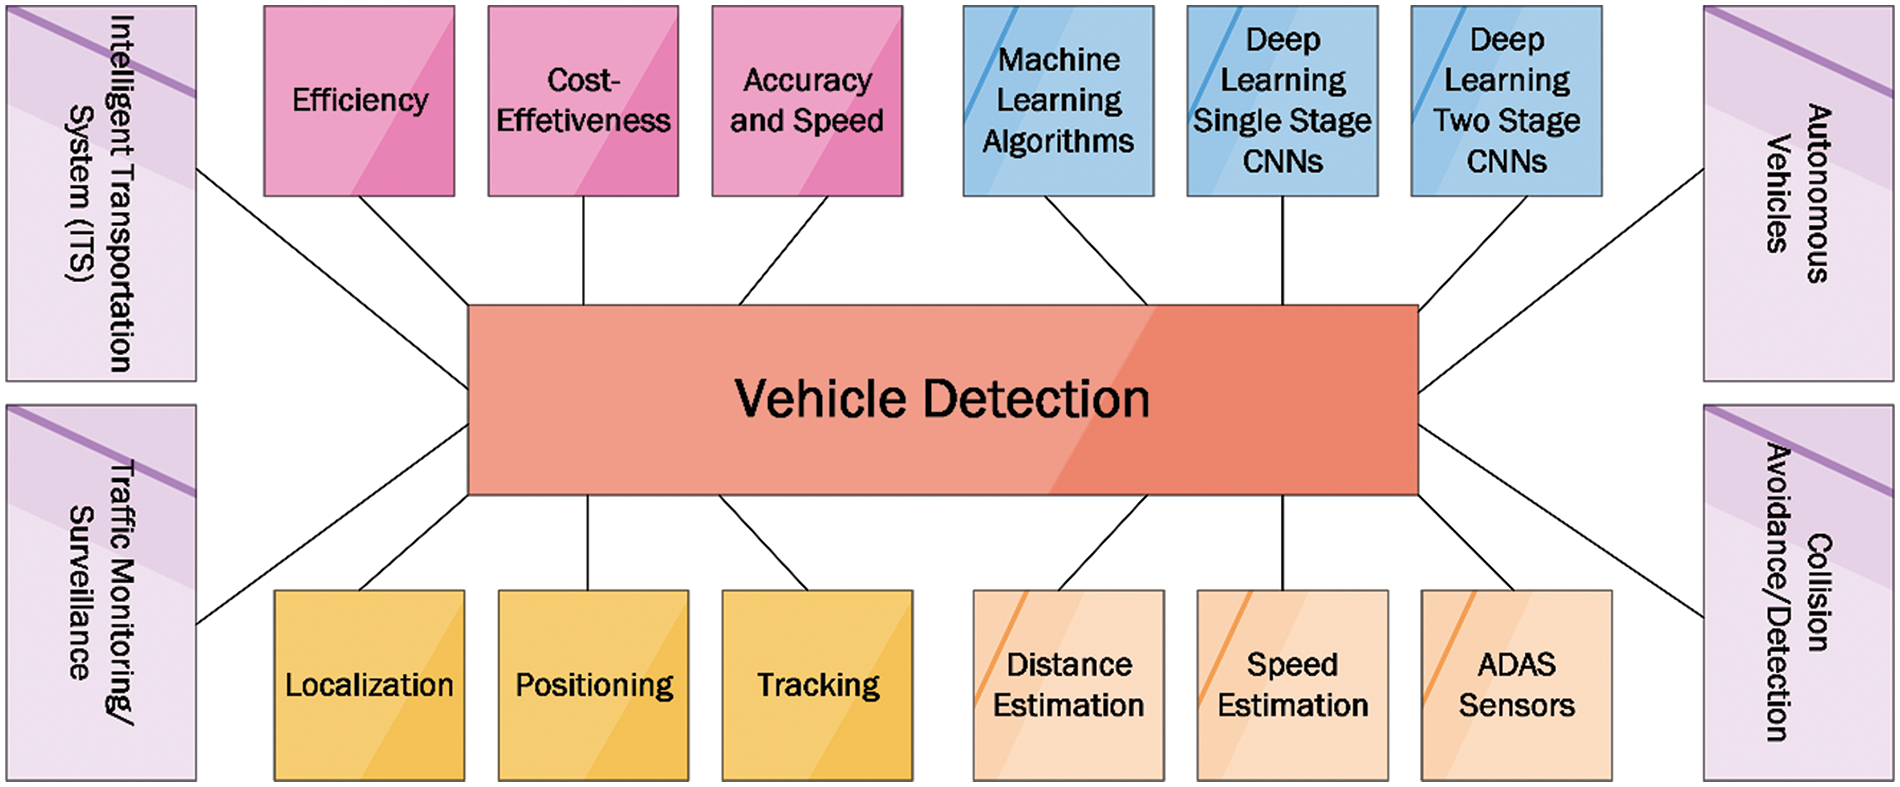
Figure 1: Vehicle detection characteristics, challenges, algorithms, and applications
Generally, object detection consists of the localization of the object instances in an image as well as the classification of the object into multiple categories by applying methods such as Histogram of Oriented Gradient (HOG), scale invariant feature transform, spatial pyramid matching, deformable part model, and selective search [11]. Single-stage object detection algorithms are also known as non-region proposal or dense prediction algorithms. These algorithms are based on single simpler network architecture for feature extraction, feature fusion, and detection. The famous Single-stage object detection algorithms are single shot detector, You Only Look Once (YOLO) and its versions (YOLO-V1-YOLO-V8), fully convolutional one-stage, EfficientDet, and detection transformer algorithms. YOLO has emerged as a key object detection model, excelling in real-time environments with remarkable accuracy and speed. Traditional region-based detection models often struggled with speed because they required multiple passes over an image to identify objects. These models are computationally demanding, limiting their use in real-time applications. In contrast, YOLO’s one-shot detection approach greatly increased the speed of object detection. By dividing the entire image into a grid and making predictions directly within each grid cell, YOLO achieved impressive real-time processing, making it especially beneficial for applications that need quick and accurate object identification in practical and dynamic environment [12]. Single-stage object detection algorithms, more specifically YOLO-V5 and YOLO-V8 supports realtime speed of object detection with reasonable accuracy. Two-stage object detection algorithms are also known as region proposal or sparce prediction algorithms. These algorithms are based on region proposal network to extract the region of interest for better feature extraction, feature fusion, and finally the classification/detection network. The famous Two-stage object detection algorithms are Region-based CNN (R-CNN), fast R-CNN, faster R-CNN, spatial pyramid pooling networks, and feature pyramid network. Two-stage object detection algorithms supports higher accuracy with reasonable realtime detection speed as compared to YOLO-V5 and YOLO-V8 algorithms [12–14]. Attention Mechanism (AM) of deep CNN are inspired by the human visual system. The human visual system helps humans to efficiently and effectively analyze and to focus on the most important parts of the normal to complex scenes in real-time. In deep CNNs, attention mechanism is treated as the dynamic weight assignment process. The AMs adaptively select and assign weights to the features of the input image in such a way that, the important regions got best suitable weights [15,16]. In YOLO, attention mechanisms can enhance the model’s focus on specific areas of an image that are crucial for object detection. Incorporating attention mechanisms in YOLO can improve the model’s accuracy and speed by concentrating on the most relevant areas of the image [17]. Convolutional Block Attention Module (CBAM) [18], Normalized-based Attention Module (NAM) [19], and Simple Attention Module (SimAM) [20] are the most prominent AM techniques used to improve object detection algorithms performance. A weighted Bi-directional Feature Pyramid Network (BiFPN) [21], which allows easy and fast multi-scale feature fusion is also considered with YOLO-V5l.
Main Contributions
1. Vehicle detection methodology is proposed to evaluate the efficiency and cost-effectiveness of vehicle detection on cloud and edge in foggy weather.
2. Vehicle detection is achieved by utilizing the YOLO-V5 and YOLO-V8 state-of-the-art deep learning algorithms with Intersection Over Union (IOU) and Complete IOU (CIOU) loss functions, and post-processing algorithm Non-Maximum Suppression (NMS). Furthermore, YOLO-V5s variants (YOLO-V5s_CBAM, YOLO-V5s_NAM, YOLO-V5s_SimAM) and YOLO-V5l_BiFPN are also proposed and evaluated.
3. Vehicle detection performance is evaluated on the DAWN and FD foggy weather vehicle detection datasets. DAWN and FD datasets are pre-processed, customized, and self-annotated to four vehicle detection classes: cars, buses, trucks, and motorcycles.
4. Several state-of-the-art vehicle detection performance metrics are utilized, such as precision, recall, precision-recall curve, F1 score, mean average precision, per-processing time, inference time, and post-processing NMS time in terms of efficiency and effectiveness of the solution.
5. YOLO-V5, YOLO-V5s variants, and YOLO-V8 vehicle detection system empowers IoT edge/fog and cloud enabled traffic surveillance and collision avoidance.
The paper’s overall organization is given as follows. The literature review section presented the state-of-the-art literature in the field of object detection and vehicle detection more specifically using YOLO series of algorithms, and state-of-the-art related work. The step-by-step vehicle detection methodology section provides the data collection, pre-processing, self-annotation, customization of DAWN and FD datasets, experimental parameters, and evaluation metrics setup for training and validation of YOLO-V5 and YOLO-V8 models. The results section presents the vehicle detection results of YOLO-V5, YOLO-V5s variants, YOLO-V5l_BiFPN, and YOLO-V8 models on the DAWN and FD datasets. The comparative analysis and discussion section, presents the vehicle detection performance of YOLO-V5, YOLO-V5s variants, YOLO-V5l_BiFPN, and YOLO-V8 algorithms in terms of accuracy and speed on DAWN and FD datasets. Lastly, the conclusion and future work section summarizes the current working and future perspective of the presented research work.
Computer vision based deep learning algorithms and IoT technologies enables real-time video processing and analytics for smart cities [22]. The structure of deep learning algorithms regarding the backbone and other network layers is essential in speed and accuracy tradeoffs. So, an efficient and lightweight vehicle detection network will be the ultimate goal of modern deep learning-based CNNs. Single-stage object detection algorithms are faster for Frame Per Second (FPS) to meet real-time vehicle detection requirements than two-stage algorithms. Still, they only face the challenge of lower accuracy [23]. You Only Look Once (YOLO) is a state-of-the-art, single-stage deep learning algorithm [24]. YOLO uses a deep neural network architecture to generate or predict object bounding boxes and class-level probabilities of objects in a single pass directly from the input images. YOLO detects and classifies objects by utilizing classification as a regression problem. The YOLO algorithm divides the input images into grid cells, predicting class-level probabilities, confidence scores, bounding boxes, and detecting objects. The YOLO version 5 (YOLO-V5) and YOLO version 8 (YOLO-V8) are proposed by ultrasonics. The YOLO-V5 backbone network is based on Cross Stage Partial (CSP) darknet and YOLO-V8 is based on improved CSP darknet. According to the overall network architecture point of view, the main difference between YOLO-V5 and YOLO-V8 is the use of CSP bottleneck convolutional layers. The YOLO-V5 uses C3 module that is based on CSP bottleneck with 3 convolutional layers, whereas YOLO-V8 uses C2F module that is the faster implementation of CSP bottleneck with 2 convolutional layers. The YOLO-V5 neck uses path aggregation network and YOLO-V8 neck uses improved path aggregation network. YOLO-V5 uses feature pyramid network and YOLO-V8 uses improved FPN. The YOLO-V5 is based on leaky ReLU activation function and YOLO-V8 uses Sigmoid Linear Unit (SiLU) activation function. YOLO-V5 uses CIOU loss function, whereas YOLO-V8 additionally uses distribution focal loss and variance focal loss functions. The more advanced hyper-parameters and data augmentation techniques are available with YOLO-V8 algorithm as compared to YOLO-V5 [25,26]. These algorithms offer better speed and improved accuracy than the previous versions. These algorithms are classified into five models; nano, small, medium, large, and extra-large. YOLO-V5 and YOLO-V8 nano to extra-large models have characteristics such a more extensive network size, more network layers, more parameters, a more complex architecture, more accuracy, and more processing time for inference.
The performance evaluation was performed on the DAWN dataset using only the YOLO-V5n model. They only focused on domain-shift analysis and the effect of transfer learning without providing vehicle detection results and analysis [27]. Another study focused on performance evaluation on Roboflow datasets using only the YOLO-V5s model. They evaluated vehicles, pedestrians, and traffic sign detection [28]. Vehicle detection performance analysis of YOLO-V5 models (s, m, l) and YOLOv7 models was performed. They evaluated it based on the DAWN and augmented DAWN datasets [29]. Another study of vehicle detection based on YOLO-V4 on the DAWN dataset was conducted to assess accuracy, and they highlighted a mAP of 81% [30]. Object detection-based performance evaluation was performed on the RTTS dataset using YOLO-V5 in foggy weather. They reported a mAP of 73.4% [31]. An optimized YOLO-V5 model was proposed and evaluated on the DAWN and COCO datasets in adverse weather conditions [32]. The vehicle detection performance in adverse weather conditions is evaluated by utilizing the Google Colab platform on ACDC, DAWN, and merged datasets using an improved YOLO-V8 algorithm. They achieved mAP of 67.2% on DAWN, 74.2% on ACDC, and 91% on merged datasets [33]. The vehicle detection performance is evaluated on Canadian vehicle datasets dataset using YOLO-V8 algorithm. The YOLO-V8 achieved mAP of 73.47% on CVD dataset [34]. Based on the current literature and related work review, YOLO-V5 and YOLO-V8 algorithms are not well studied for vehicle detection based on the DAWN and FD datasets in foggy weather. IoT enabled closed circuit television smart cameras based vehicle detection performance of HOG, Viola-Jones, SSD, YOLO-V8, and R-CNN were evaluated and concluded that YOLO-V8 is outperformed for cost-efficient [35]. Realtime video analytics through YOLO-V5/YOLO-V8 and IoT are the promising area of research in Intelligent Transportation Systems [36].
This research aims to evaluate the vehicle detection performance of state-of-the-art YOLO-V5 and YOLO-V8 algorithms [25,26] and YOLO-V5s variants in foggy weather conditions. The overall research methodology is illustrated in Fig. 2.
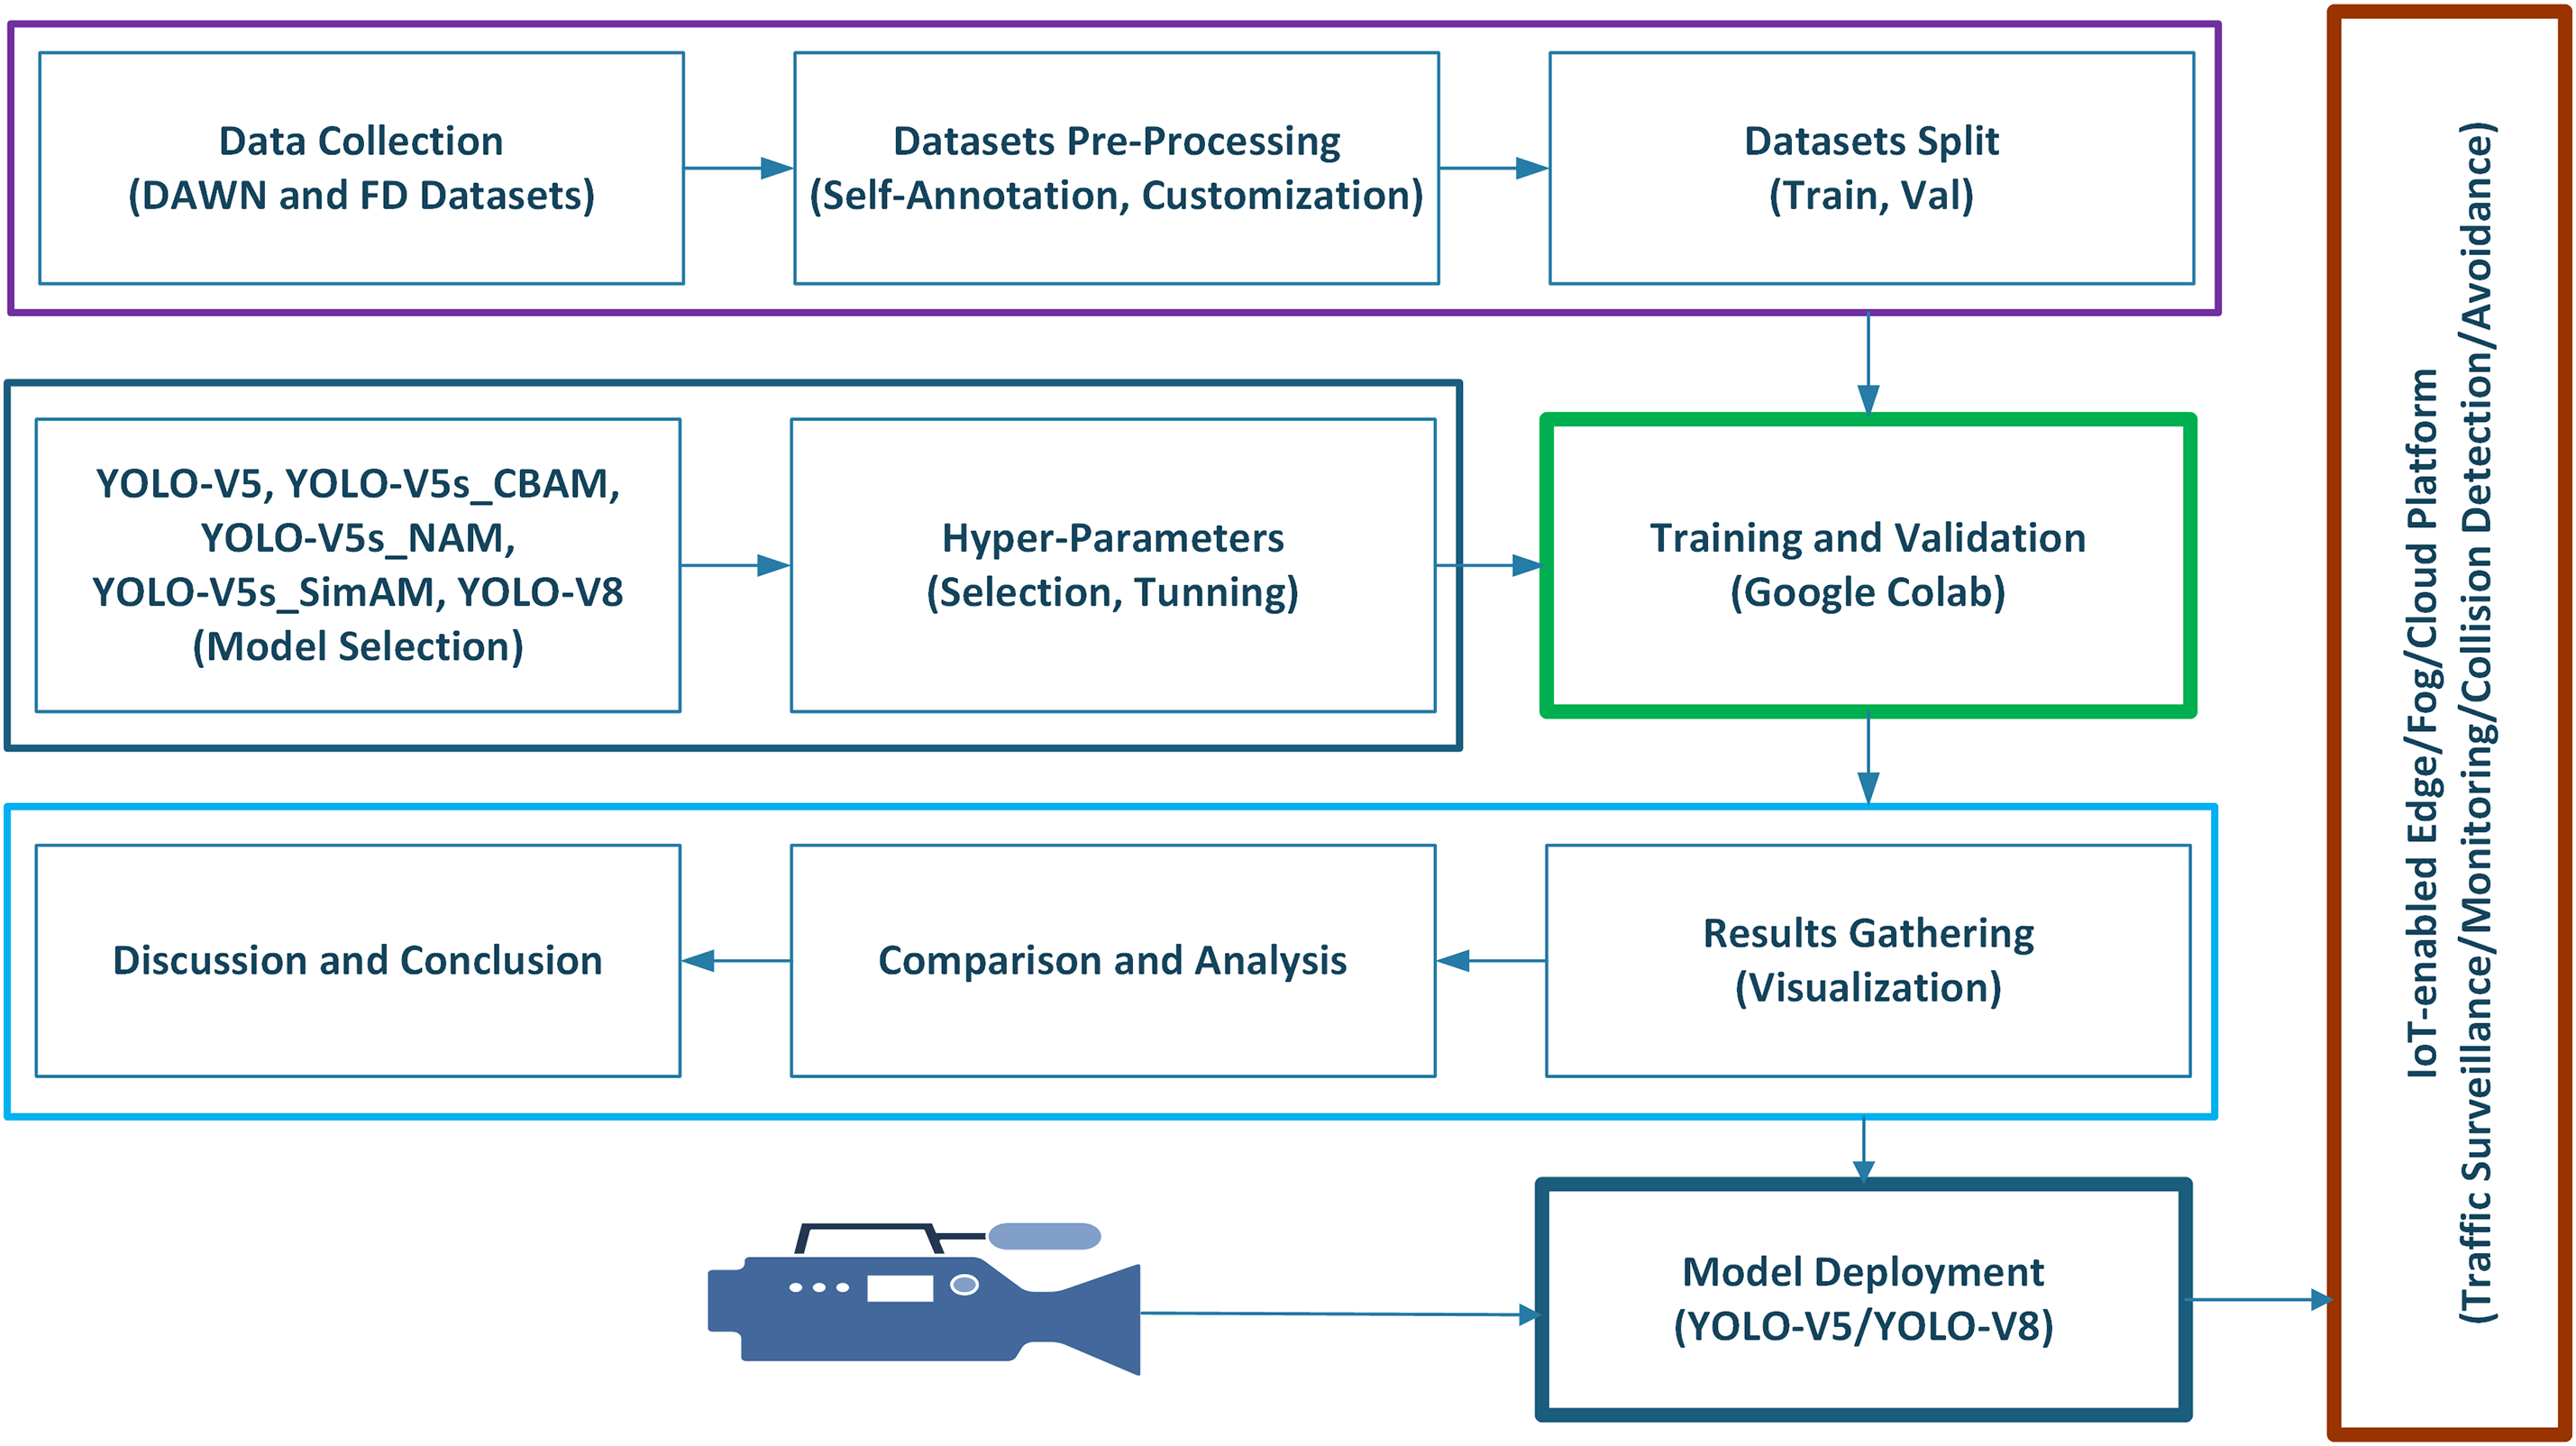
Figure 2: Research methodology
State-of-the-art foggy weather datasets DAWN and FD are utilized for the performance evaluation of vehicle detection in foggy weather conditions. The DAWN and FD datasets are self-annotated using the YOLO LABEL tool and customized to four vehicle detection classes: cars, buses, motorcycles, and trucks. A single-stage DL algorithms, YOLO-V5 and YOLO-V8 are utilized for the performance evaluation of vehicle detection. The four YOLO-V5 models, YOLO-V5n, YOLO-V5s, YOLO-V5m, and YOLO-V5l; YOLO-V5s variant, and similarly, four YOLO-V8 models, YOLO-V8n, YOLO-V8s, YOLO-V8m, and YOLO-V8l are custom-trained and evaluated regarding vehicle detection accuracy and speed. In general, state-of-the-art YOLO-V5 and YOLO-V8 algorithms have three main stages: the backbone, neck, and detection head. The backbone layer of YOLO-V5 is based on convolutional layers, C3-Bottleneck layers, and the SPPF layer. Similarly, the backbone layer of YOLO-V8 is based on convolutional layers, C2F-Bottleneck layers, and the SPPF layer. The SPPF uses a convolutional layer followed by batch normalization and SiLU activation function, collectively called the CBS module. The intermediate neck layer of YOLO-V5 and YOLO-V8 performs feature fusion and aggregation with the help of bottom-up and top-down layers and paths. The final detection layer performs object detections by utilizing bounding boxes, IOU, and CIOU thresholds, and NMS techniques. The complete architectural diagram of the YOLO-V5 and YOLO-V8 algorithms are shown in Fig. 3a,b. In this research work, YOLO-V5s variants YOLO-V5s_CBAM, YOLO-V5s_NAM, YOLO-V5s_SimAM based on attention mechanism modules after the SPPF module in the backbone network as well as YOLO-V5l_BiFPN are proposed. The SiLU activation function is used in all YOLO-V5s variants including YOLO-V5s and CBAM, NAM, and SimAM attention mechanisms instead of ReLU activation function. For vehicle detection, the choice between ReLU and SiLU depends on the specific context. SiLU, particularly when used with advanced YOLO models, has been shown to perform better in challenging environments such as sandy weather, offering higher mean average precision (mAP). While ReLU is still favored for its simplicity and efficiency in standard conditions, SiLU ability to handle complex patterns makes it a better option for scenarios requiring more precise and robust detection, especially in dynamic environments [29].
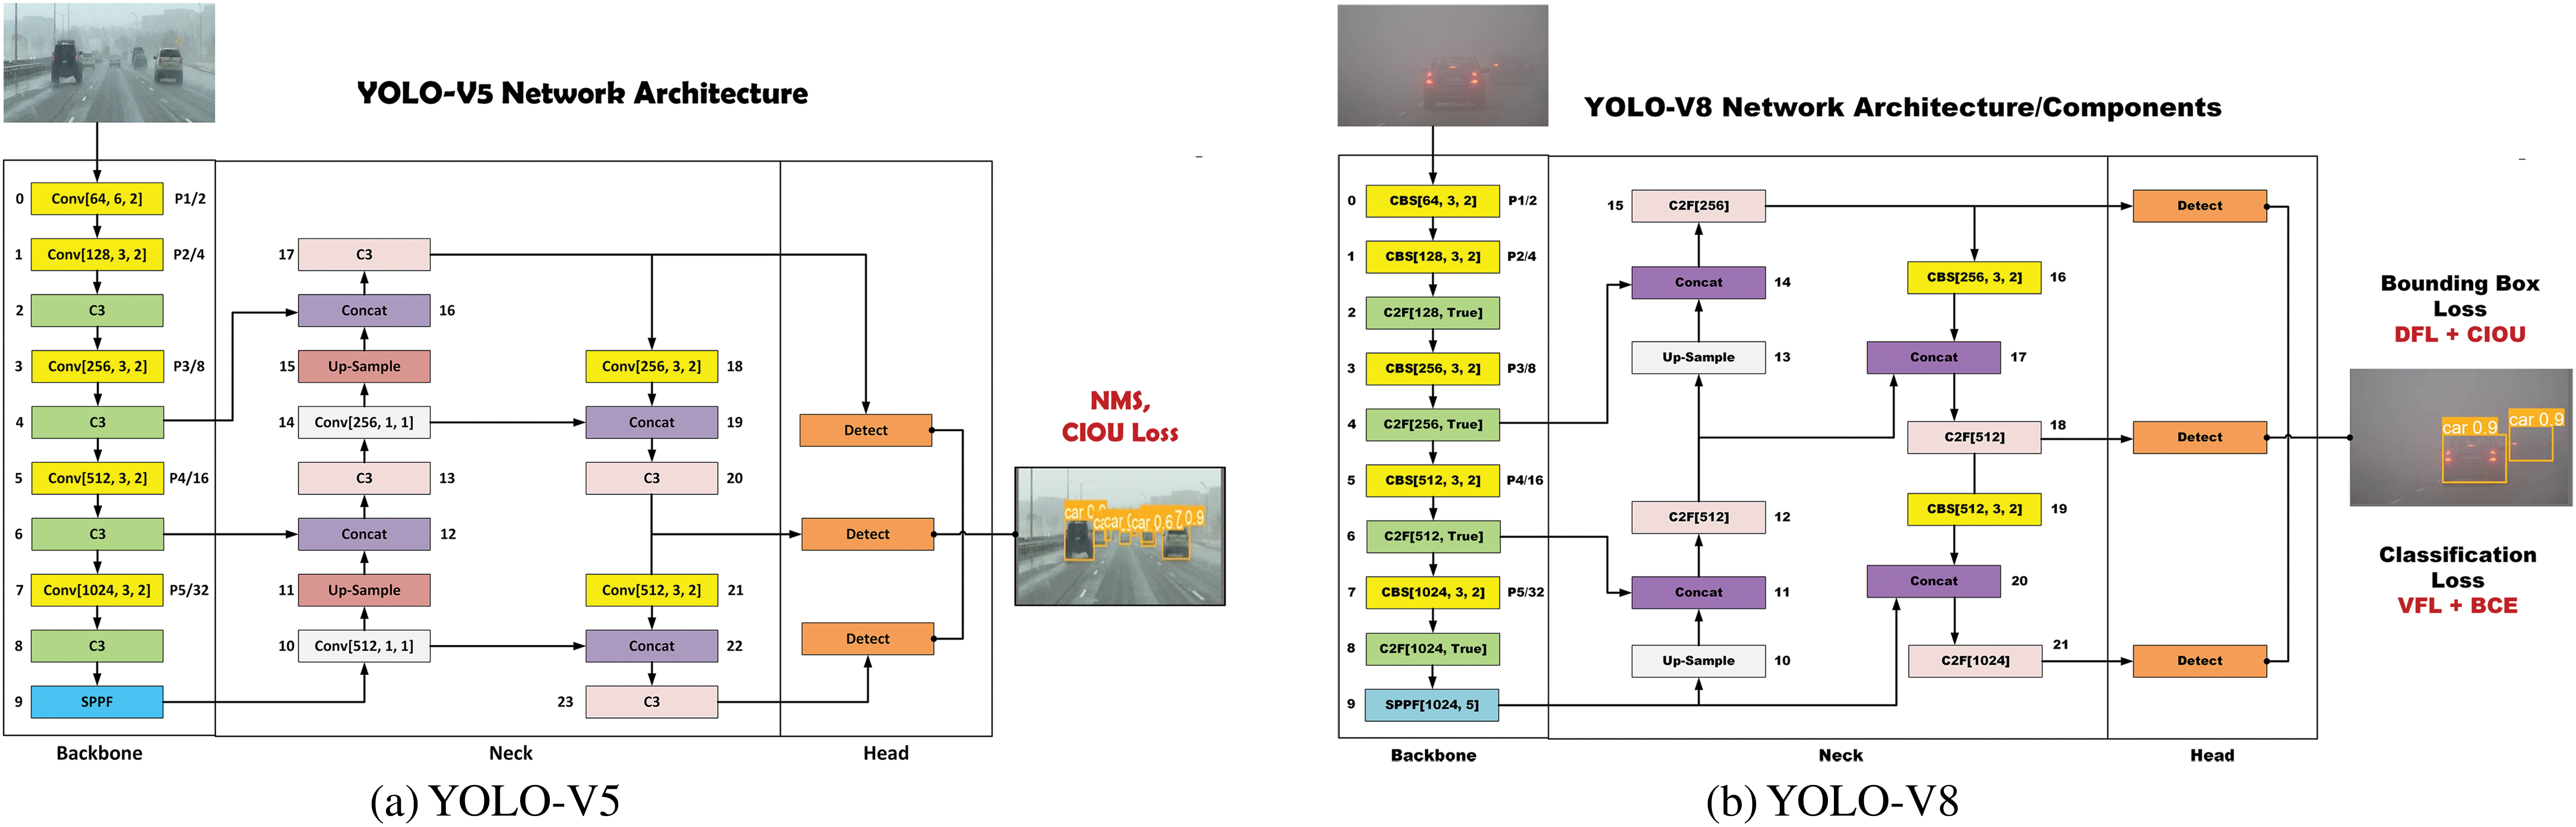
Figure 3: Architectural diagrams of (a) YOLO-V5 Network Architecture, (b) YOLO-V8 Network Architecture
3.1 Distance Metrics and Loss Functions
The CNN object detection algorithm’s localization and classification entirely depend on the characteristics of the loss function. The loss function supports object detection algorithms to reach optimal performance regarding bounding box regression and classification accuracy. The loss function attempts to minimize the difference between the predicted and ground truth bounding boxes [37]. IOU [38,39], commonly known as the Jaccard Index, is the most popular metric for evaluating the impact of bounding box regression on object detection. IOU distance is defined and expressed in Eq. (1):
where
Similarly,
The IOU loss function is defined to improve the performance of IOU metric. It works well when bounding boxes have some or completely overlapped area. It means that when
The IOU loss is defined as Eq. (4):
To improve object detection performance in complex cases, the CIOU loss function is proposed [40]. The CIOU distance metric and loss function incorporate geometric factors such as overlapping area S, distance D, and aspect ratio V of the predicted and ground truth bounding boxes. The CIOU distance metric is defined and expressed in Eq. (5):
where the equation of
Now the CIOU loss function is defined as Eq. (8):
3.2 Data Collection and Pre-Processing
Two state-of-the-art foggy image datasets, DAWN and FD, are collected to evaluate the vehicle detection performance in foggy weather conditions. The dataset balancing process is achieved by removing the negative/background as well as corrupt images and labels. Unreliable models that lead to poor decisions can arise from incomplete, erroneous, or inappropriate training data. To ensure trustworthy AI applications, it is crucial to have high-quality training and testing data characterized by accuracy, completeness, and consistency [41].
3.2.1 Driving in Adverse Weather Nature (DAWN) Dataset
The DAWN dataset consists of on-road captured images in the real world under adverse weather circumstances [42,43]. The DAWN dataset focuses on various traffic environments (urban, highway, and motorway) and traffic flows. The DAWN dataset comprised 1000 images from real-traffic situations, categorized into four weather conditions: fog, snow, rain, and sandstorms. The DAWN dataset contains 300 images for fog, haze, and mist, 200 images for rain, 204 images for snow, and 323 images for the sand to evaluate the performance of vehicle detection and classifications algorithms in adverse weather conditions. The DAWN dataset contains 7845 Ground Truth (GT) bounding boxes with 98.48% GT bounding boxes available for vehicles, 7.07% for pedestrians, and 1.36% for bicycles and motorcycles. DAWN foggy images are used to train and validate the vehicle detection performance using YOLO-V5 and YOLO-V8. These foggy images include foggy, hazy, and misty weather images. The foggy images in the DAWN dataset are split into 80% for training and 20% for validation using the holdout method. Furthermore, the DAWN dataset is customized to four vehicle detection classes: cars, buses, trucks, and motorcycles.
3.2.2 Foggy Driving (FD) Dataset
The FD [44,45] dataset consists of 101 color images depicting real-world FD scenes. Fifty-one images were captured with a cell phone camera in foggy conditions in various areas of Zurich, and the rest of the 50 images were collected from the web. The maximum image resolution in the dataset is 960 × 1280 pixels. The FD dataset originally comprised images and corresponding bounding box labels with non-normalization for eight object classes, such as cars, pedestrians, riders, buses, trucks, trains, motorcycles, and bicycles. To perform vehicle detection tasks using the YOLO-V5 and YOLO-V8 algorithms, FD dataset images are self-annotated using the YOLO label [46] tool into four vehicle detection classes, such as car, bus, truck, and motorcycle, in YOLO format with normalized values. The whole process of FD dataset customization is depicted in Fig. 4. FD dataset images are split into 80% images for training images and 20% images as validation images using the holdout method.
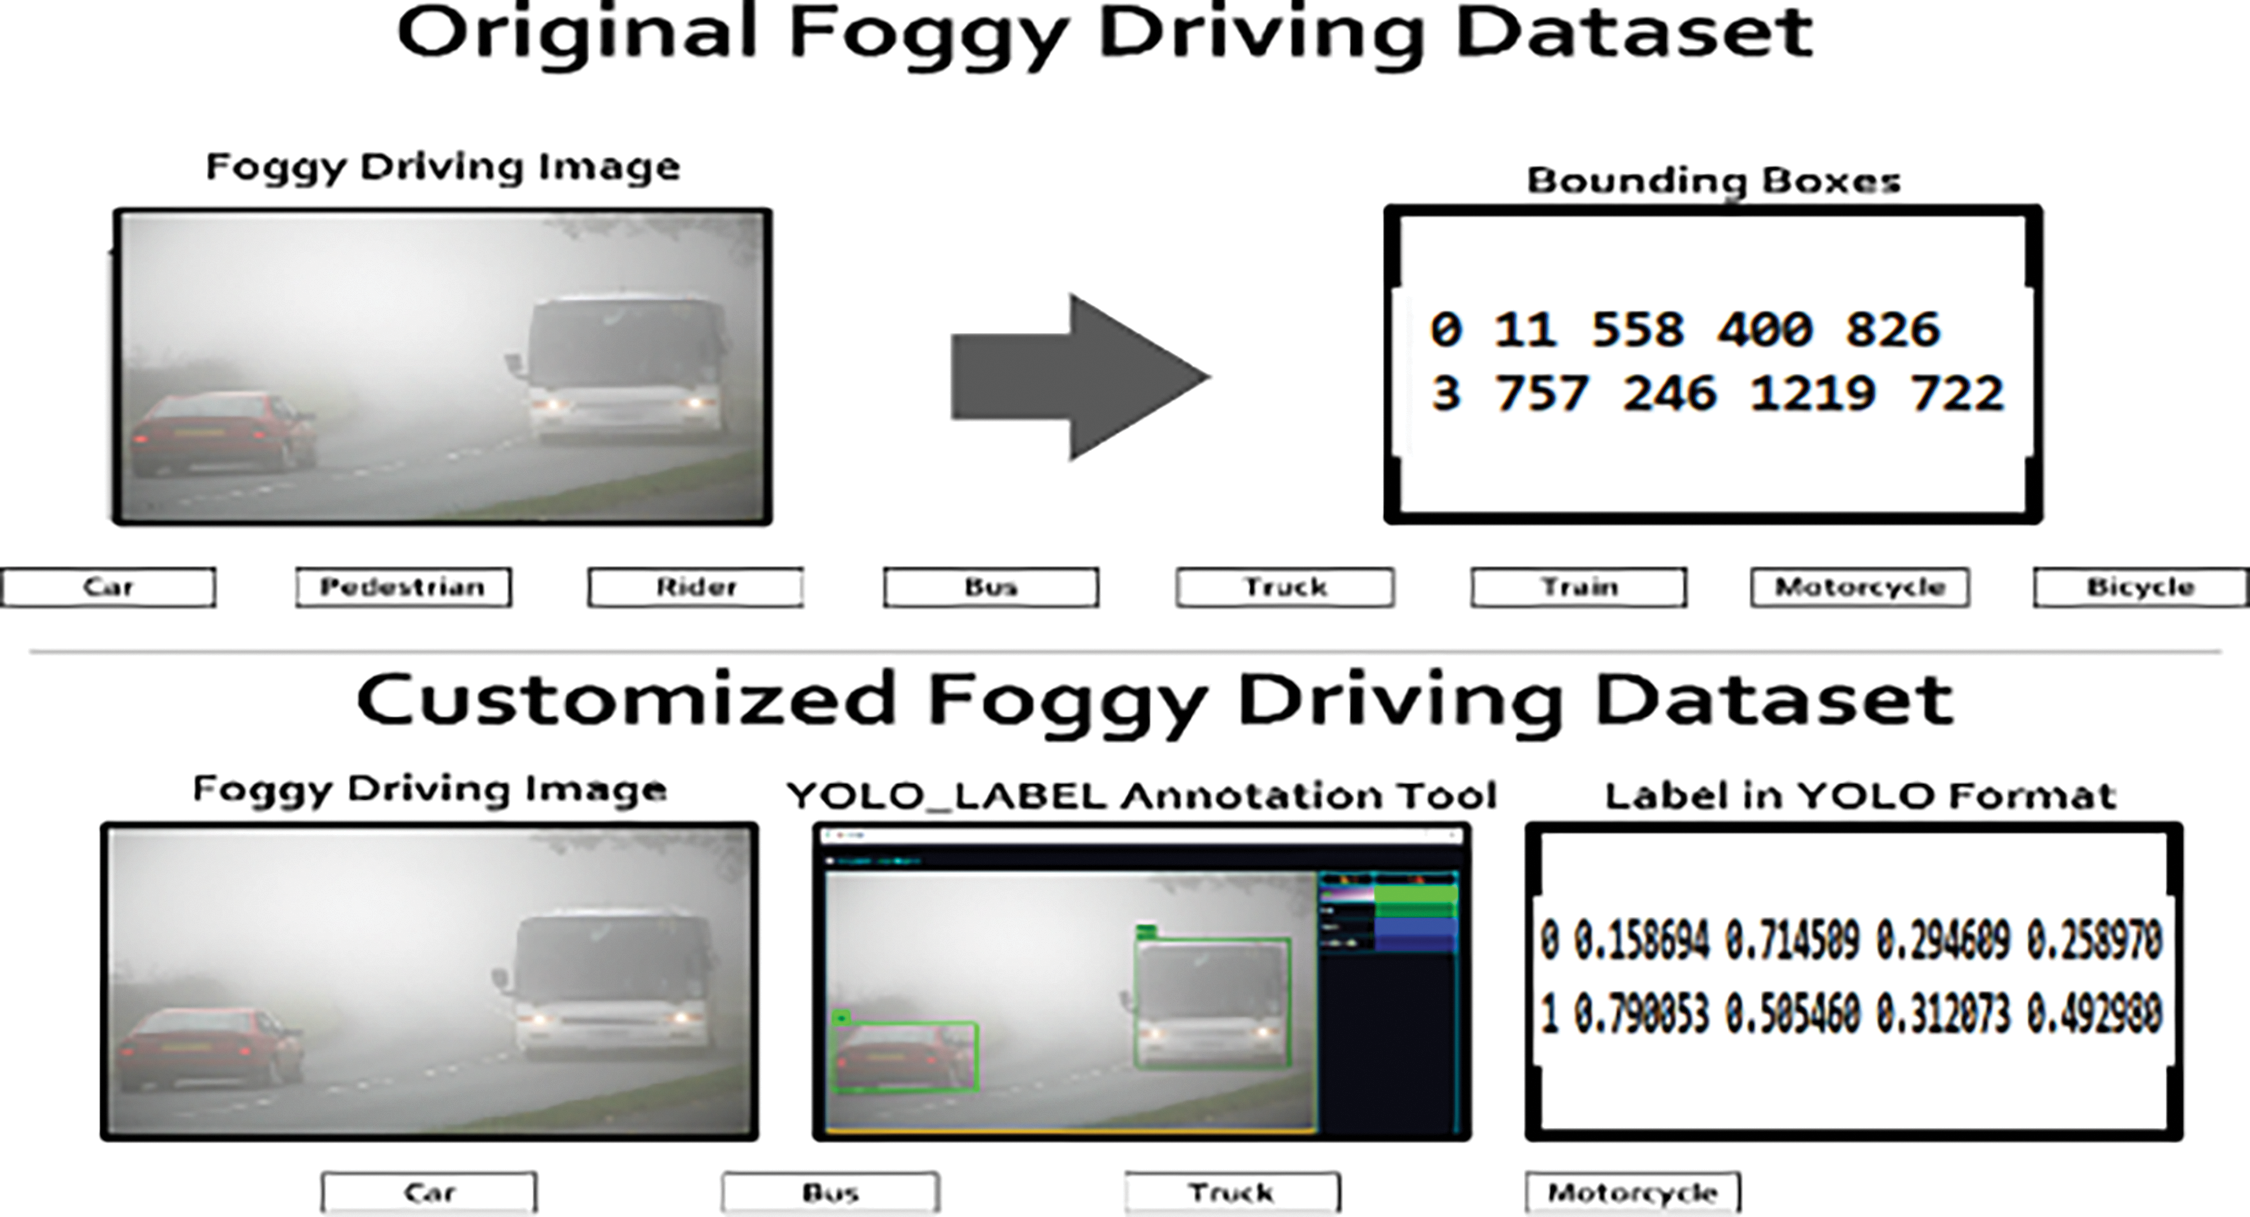
Figure 4: Foggy Driving (FD) dataset self-annotation and customization
The experimental setup is based on cloud (Google Colab) and edge (local) systems enabled with GPU resources. The Google Colab cloud environment provides Invidia Tesla T4 GPU with 15 GB RAM, system RAM of 12.7 GB, and disk storage of 78.2 GB with Google drive integration. The local system resources are acer workstation with 64-bit Windows 11 operating system, 2.30 GHz Intel Core i5 8th generation (8300H) CPU, 24 GB RAM, and Invidia GeForce GTX 1050 Ti GPU. These systems are CUDA enabled with the integration of python, PyTorch, and Ultralytics along with essential libraries and packages. The basic training and validation parameters for YOLO-V5 and YOLO-V8 are tabulated in Table 1. Cloud GPUs offer significant computational power for training complex models with large datasets, enhancing detection accuracy and scalability. They support diverse datasets, improving model generalization, but may introduce latency data transmission and incur high operational costs. In contrast, edge GPUs facilitate real-time processing by handling data locally, which reduces latency and allows for quick decision-making. They decrease data transmission needs and save bandwidth. However, edge GPUs typically have lower computational power, which can limit model complexity and accuracy, though they provide flexible deployment options across various environments [47].

3.4 Performance Evaluation Metrics
The state-of-the-art precision, recall, Mean Average Precision (mAP), F1 score, and Frame Per Seconds (FPS) [48] performance evaluation metrics are employed in this research work. The details of these evaluation metrics are described below. YOLO emphasizes both accuracy and speed, and the mAP metric reflects this by evaluating both aspects. mAP considers the model’s precision (the accuracy of detections) and recall (the completeness of detections), providing a well-rounded assessment of its performance. In YOLO versions, the F1 score is not used as a primary metric because, in object detection tasks where some classes are much more common than others, the F1 score can be heavily biased towards the majority class. This makes it less reliable for evaluating performance on minority classes [12].
1. Precision: It is the percentage accuracy of the object detection model to detect the right objects correctly. It shows the positive predictive score of the model. It is the ratio between True Positive (TP) predictions and True Positive (TP) plus True Negative (TN) predictions (overall positive object classes predictions). The precision is expressed mathematically in Eq. (9).
2. Recall: It is the percentage sensitivity or the probability of the object detection model for detecting the ground truth objects. It is the ratio between True Positive (TP) predictions and True Positive (TP) plus False Negative (FN) predictions (overall positive object instances predictions). The recall is expressed mathematically in Eq. (10).
Precision-Recall Curve: This curve is used to map the relationship between the precision and recall scores of the object detector. The mapping of precision scores is on the Y-axis, and recall is on the X-axis. Ideally, the ideal point lies near to (1.0, 1.0).
F1 Score: The Harmonic mean of precision and recall. A higher value means better classification accuracy of the model. The ability of an object detection algorithm to balance the precision and recall scores. The F1 score is mathematically expressed in Eq. (11).
Average Precision (AP): It is the measure of the average precision for a set of 11 equally spaced recall points (0, 0.1, 0.2, …, 1). The relevant recall value of r corresponds to the precision value and is interpolated for the maximum recall value of r greater than r. The AP is mathematically expressed in Eq. (12).
Mean Average Precision (mAP): It is the average of all the AP values for all N classes of objects in a dataset. The higher the value, the better will be the object detection performance for all object classes. The mAP is mathematically expressed in Eq. (13).
Frame Per Second (FPS): The number of frames processed by an object detection and tracking algorithm per second [49]. FPS rate depends on pre-processing time, inference time, and post-processing time.
4 Results Gathering and Visualization
4.1 Performance Evaluation of Vehicle Detection Using YOLO-V5 and YOLO-V8 on the DAWN Dataset
The YOLO-V5 and YOLO-V8 (nano, small, medium, large) models are custom-trained on DAWN dataset for four vehicle detection classes (car, bus, truck, and motorcycle) with the selected model and training parameters, as highlighted in Table 1. The vehicle detection accuracy of YOLO-V5n in terms of mAP@50 of car detection is 83.80 %, bus detection is 35.40%, truck detection is 71.80%, and motorcycle detection is 99.50%. The overall mAP@50 is 72.60% for all vehicle detection classes. The F1 score is 71%, with a confidence score of 50.70%. The vehicle detection accuracy of YOLO-v8n in terms of mAP@50 of car detection is 85.60%, bus detection is 34.10%, truck detection is 70.80%, and motorcycle detection is 50.10%. The overall mAP@50 is 60.20% for all vehicle detection classes. The F1 score is 62%, with a confidence score of 24.60%. The vehicle detection accuracy of YOLO-V5s in terms of mAP@50 of car detection is 88.10%, bus detection is 35.70%, truck detection is 77.40%, and motorcycle detection is 99.50%. The overall mAP@50 is 75.20% for all vehicle detection classes. The F1 score is 72%, with a confidence score of 24.60%. The vehicle detection accuracy of YOLO-V8s in terms of mAP@50 of car detection is 89.40%, bus detection is 32.40%, truck detection is 72.90%, and motorcycle detection is 99.50%. The overall mAP@50 is 73.50% for all vehicle detection classes. The F1 score is 70%, with a confidence score of 12.30%. The vehicle detection accuracy of YOLO-V5m in terms of mAP@50 of car detection is 89%, bus detection is 35.40%, truck detection is 69.80%, and motorcycle detection is 99.50%. The overall mAP@50 is 73.40% for all vehicle detection classes. The F1 score is 70% with a confidence score of 51.60%. The vehicle detection accuracy of YOLO-V8m in terms of mAP@50 of car detection is 87.50%, bus detection is 34.20%, truck detection is 73.90%, and motorcycle detection is 99.50%. The overall mAP@50 is 73.80% for all vehicle detection classes. The F1 score is 70% with a confidence score of 18.50%. The vehicle detection accuracy of YOLO-V5l in terms of mAP@50 of car detection is 91.80%, bus detection is 41.40%, truck detection is 76.40%, and motorcycle detection is 99.50%. The overall mAP@50 is 77.30% for all vehicle detection classes. The F1 score is 71%, with a confidence score of 51.90%. The vehicle detection accuracy of YOLO-V8l in terms of mAP@50 of car detection is 89.20%, bus detection is 36.50%, truck detection is 65.10%, and motorcycle detection is 99.50%. The overall mAP@50 is 72.60% for all vehicle detection classes. The F1 score is 70%, with a confidence score of 14.90%. The vehicle detection results of YOLO-V5 and YOLO-V8 on DAWN dataset are shown in Fig. 5.
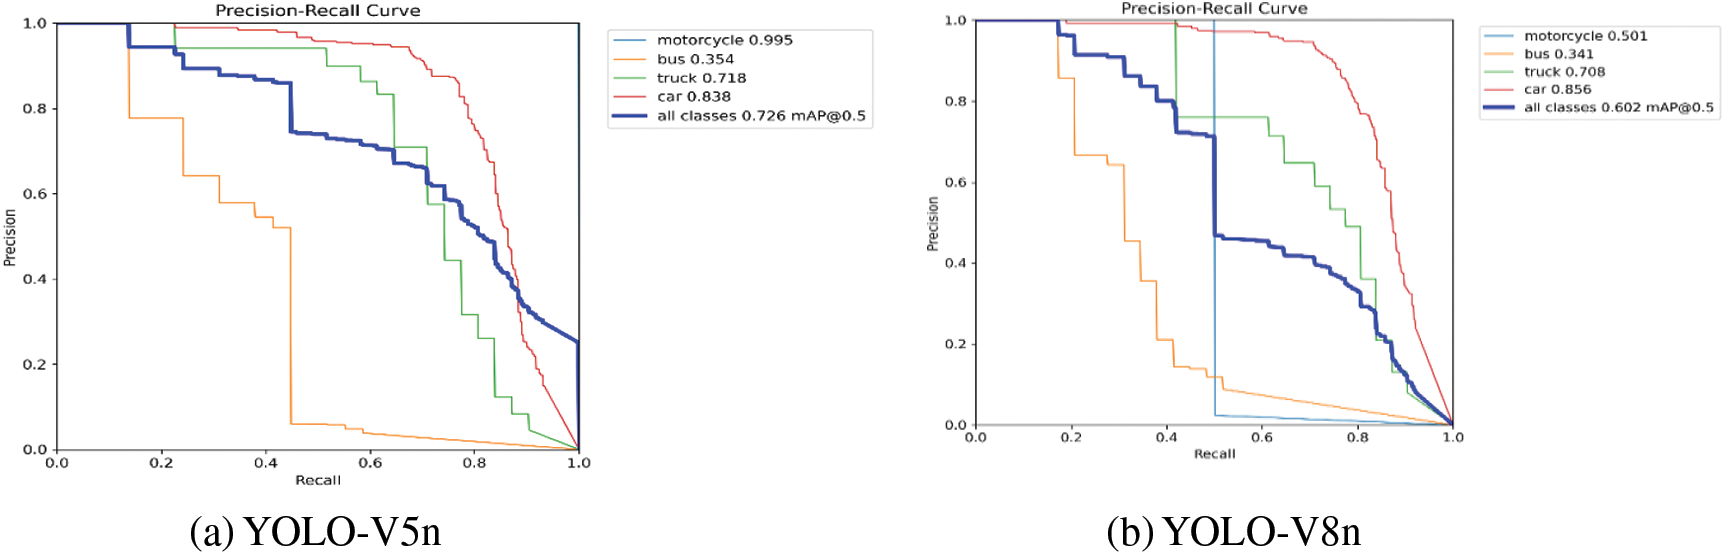
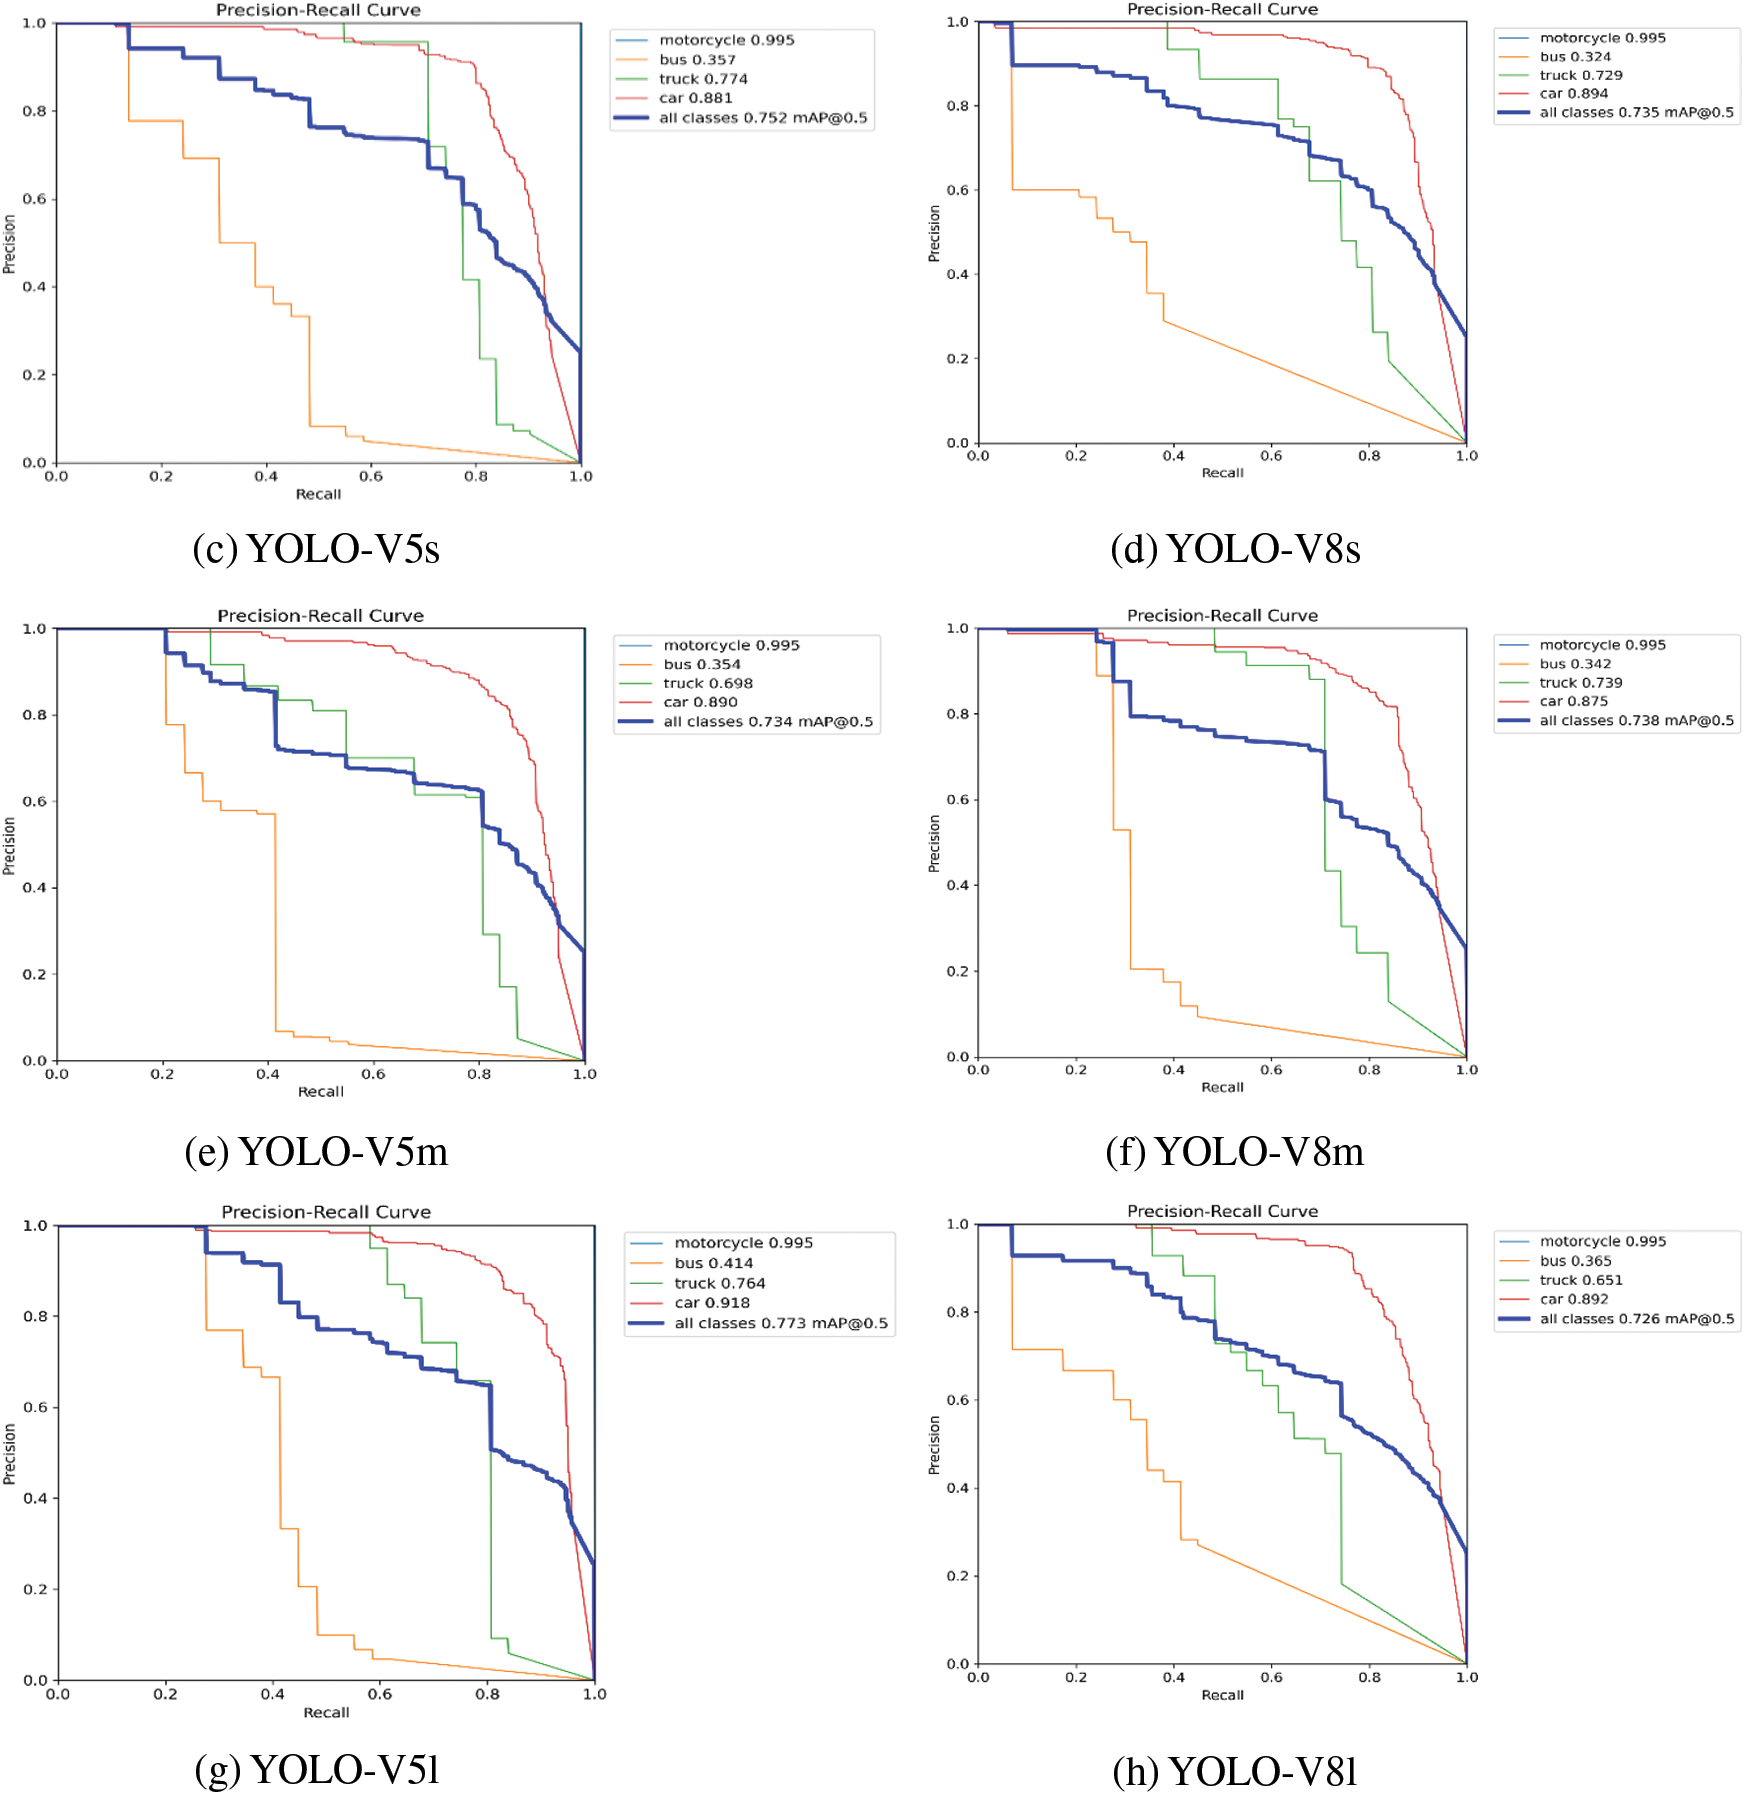
Figure 5: Vehicle detection results YOLO-V5 and YOLO-V8 on DAWN dataset
4.2 Performance Evaluation of Vehicle Detection Using YOLO-V5 and YOLO-V8 on the FD Dataset
The YOLO-V5 and YOLO-V8 (nano, small, medium, large) models are custom-trained on FD dataset for four vehicle detection classes (car, bus, truck, and motorcycle) with the selected model and training parameters, as highlighted in Table 1. The vehicle detection performance of YOLO-V5 and YOLO-V8 on FD dataset is discussed in the following subsections. The vehicle detection accuracy of YOLO-V5n in terms of mAP@50 of car detection is 62.90%, bus detection is 36.50%, truck detection is 32.30%, and no instance of motorcycle present in the validation set leads to no detection results. The overall mAP@50 is 43.90% for all vehicle detection classes. The F1 score is 38%, with a confidence score of 14.70%. The vehicle detection accuracy of YOLO-V8n in terms of mAP@50 of car detection is 68.70%, bus detection is 31.10%, truck detection is 24.90%, and no instance of motorcycle present in the validation set leads to no detection results. The overall mAP@50 is 41.60% for all vehicle detection classes. The F1 score is 44%, with a confidence score of 26.60%. The vehicle detection accuracy of YOLO-V5s in terms of mAP@50 of car detection is 71.60%, bus detection is 29.80%, truck detection is 18.80%, and no instance of motorcycle present in the validation set leads to no detection results. The overall mAP@50 is 40.10% for all vehicle detection classes. The F1 score is 38%, with a confidence score of 13.40%. The vehicle detection accuracy of YOLO-V8s in terms of mAP@50 of car detection is 72.50 %, bus detection is 45.20%, truck detection is 25.10%, and no instance of motorcycle present in the validation set leads to no detection results. The overall mAP@50 is 47.60% for all vehicle detection classes. The F1 score is 44%, with a confidence score of 40.40%. The vehicle detection accuracy of YOLO-V5m in terms of mAP@50 of car detection is 70.80%, bus detection is 39.90%, truck detection is 38.20%, and no instance of a motorcycle in the validation set leads to no detection results. The overall mAP@50 is 49.70% for all vehicle detection classes. The F1 score is 48%, with a confidence score of 42%. The vehicle detection accuracy of YOLO-V8m in terms of mAP@50 of car detection is 67.70%, bus detection is 35.40%, truck detection is 25.70%, and no instance of a motorcycle in the validation set leads to no detection results. The overall mAP@50 is 42.90% for all vehicle detection classes. The F1 score is 48%, with a confidence score of 27.30%. The vehicle detection accuracy of YOLO-V5l in terms of mAP@50 of car detection is 72.60%, bus detection is 30.90%, truck detection is 68.40%, and no instance of a motorcycle in the validation set leads to no detection results. The overall mAP@50 is 57.30% for all vehicle detection classes. The F1 score is 53%, with a confidence score of 22.20%. The vehicle detection accuracy of YOLO-V8l in terms of mAP@50 of car detection is 69.70%, bus detection is 37.90%, truck detection is 26.90%, and no instance of a motorcycle in the validation set leads to no detection results. The overall mAP@50 is 44.80% for all vehicle detection classes. The F1 score is 46%, with a confidence score of 57.10%. The vehicle detection results of all YOLO-V5 and YOLO-V8 models on FD dataset are shown in Fig. 6.
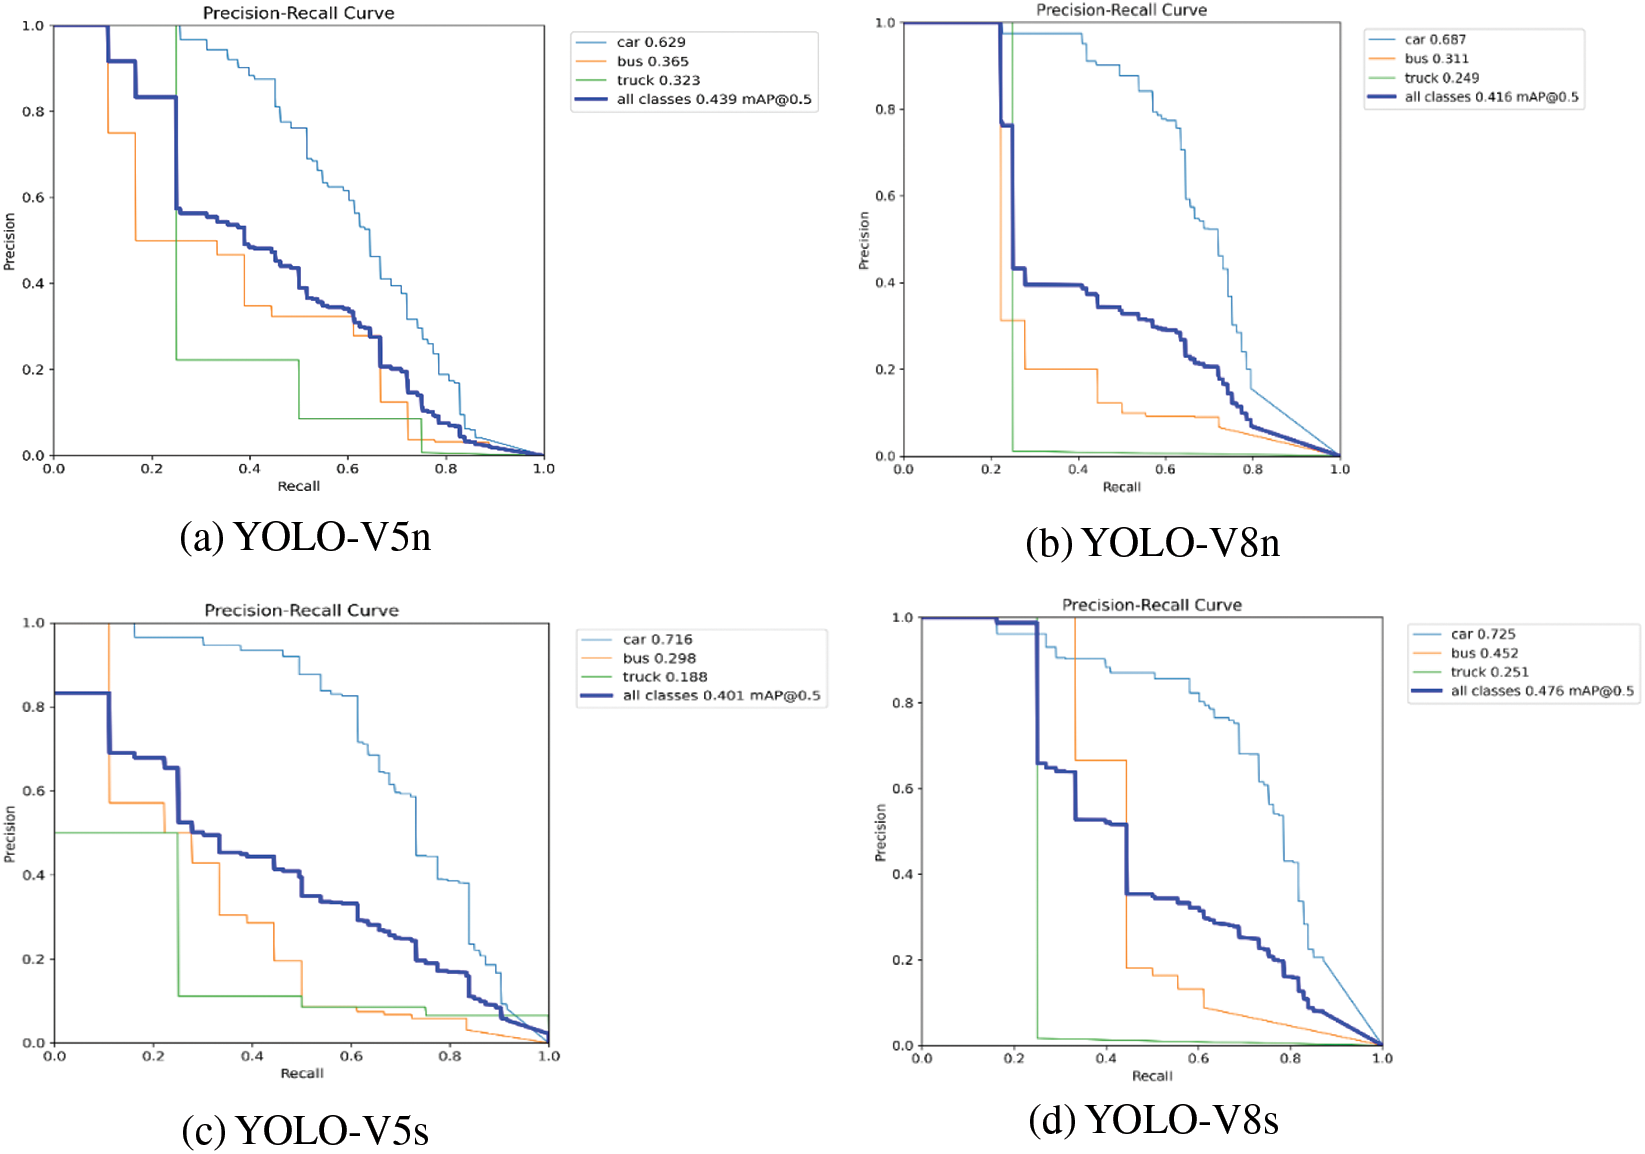
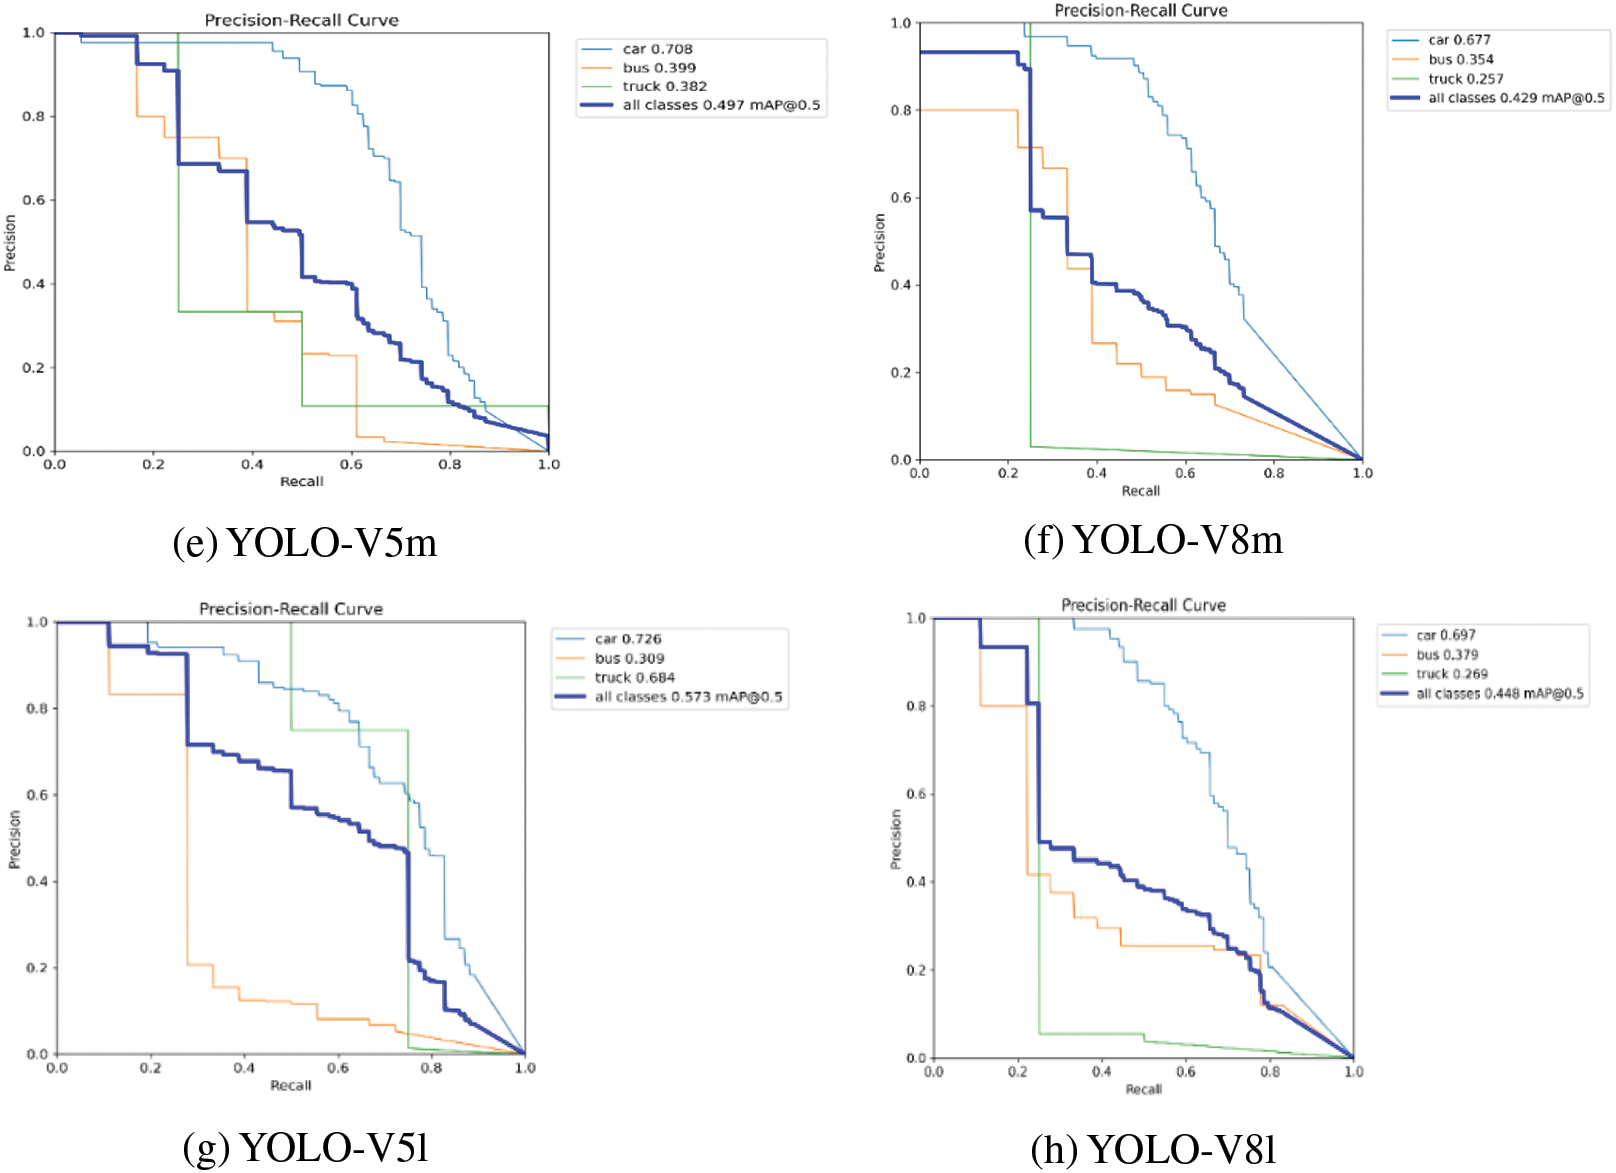
Figure 6: Vehicle detection results YOLO-V5 and YOLO-V8 on FD dataset
5 Comparative Analysis and Discussion
Efficient and cost-effective Vehicle detection in foggy weather is extensively assessed on state-of-the-art DAWN and FD datasets. The state-of-the-art YOLO-V5 and YOLO-V8 models with default settings as well as proposed YOLO-V5s variants are custom trained and validated on cloud (Google Colab) and edge (local) systems enabled with GPU resources. In cloud environment, the comparative analysis of YOLO-V5 and YOLO-V8 models is summarized as follows. The YOLO-V5l outperformed on DAWN dataset with precision score of 90.1%, recall score of 68.8%, mAP50 of 77.3%, mAP50-95 of 42.6%, and F1 score of 74% as compared to other YOLO-V5 and YOLO-V8 models. However, YOLO-V5l underperform in FPS rate which is lower 30 FPS as compared to other YOLO-V5 and YOLO-V8 models and only YOLO-V8n is dominated with 185 FPS. The YOLO-V5l outperformed on FD dataset with recall score of 50%, mAP50 of 57.3%, mAP50-95 of 36.9%, and F1 score of 53% as compared to other YOLO-V5 and YOLO-V8 models. However, YOLO-V5l underperform in FPS rate which is lower 17 FPS as compared to other YOLO-V5 and YOLO-V8 models and only YOLO-V8n is dominated with 313 FPS. The results show that YOLO-V5 models are more efficient in vehicle detection accuracy and YOLO-V8 models are more cost-effective in vehicle detection speed. The experimental results of YOLO-V5 and YOLO-V8 vehicle detection performance on cloud (Google Colab) for DAWN and FD datasets are tabulated in Tables 2 and 3, respectively.


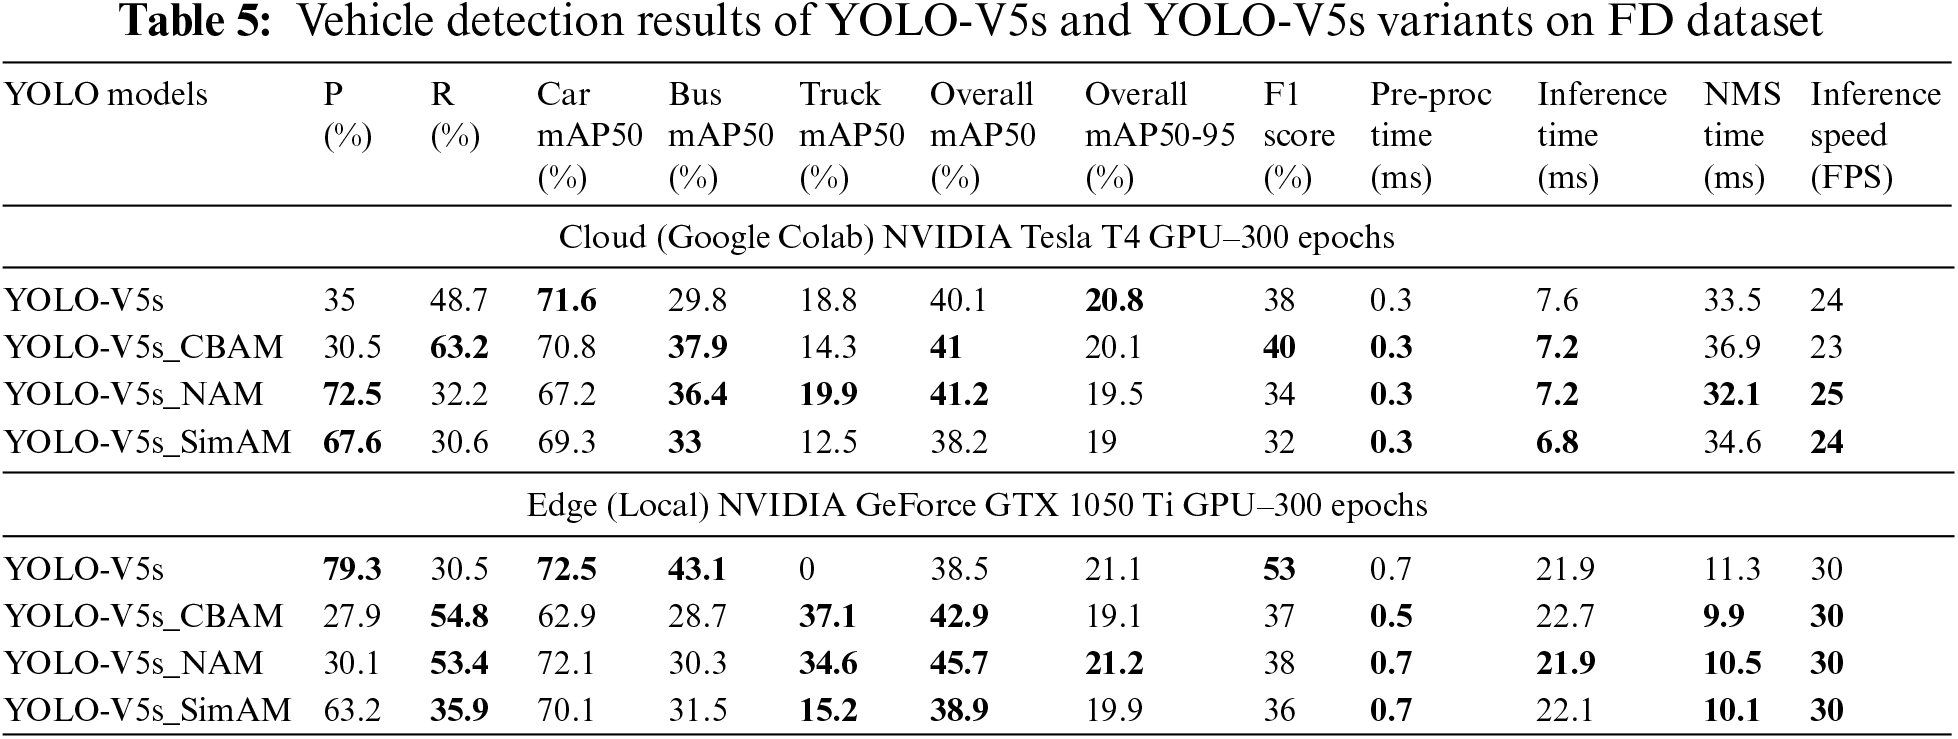
The cloud and edge (local) GPUs experimental results of YOLO-V5s and YOLO-V5s variants on the DAWN dataset are presented in Table 4. On cloud GPU, state-of-the-art YOLO-V5s outperforms and offer 82.5% precision, 75.2% of mAP50, 41.1% of mAP50-95, and 72% F1 score as compared to proposed YOLO-V5s variants. The YOLO-V5s_CBAM offer higher recall score of 73.8% in comparison to all other models. However, proposed YOLO-V5s variants outperforms in pre-processing, inference, and NMS time as well as offer higher FPS inference speed as compared to state-of-the-art YOLO-V5s. On local GPU, proposed YOLO-V5s variants outperforms with competitive results of precision, class level and overall mAP50 scores and underperforms in recall and F1 scores as compared to state-of-the-art YOLO-V5s. However, YOLO-V5s variants outperforms in pre-processing, inference, and NMS time as well as offer higher FPS inference speed as compared to state-of-the-art YOLO-V5s. The cloud and edge (local) GPUs experimental results of YOLO-V5s and YOLO-V5s variants on the FD dataset are presented in Table 5. On cloud GPU, proposed YOLO-V5s variants outperforms in precision and recall scores; buses, trucks, and overall mAP50 scores as compared to the state-of-the-art YOLO-V5s. The YOLO-V5s in detecting cars; mAP50-95 and F1 scores as comparison to YOLO-V5s variants. However, proposed YOLO-V5s variants outperforms in pre-processing, inference, and NMS time as well as offer higher FPS inference speed as compared to state-of-the-art YOLO-V5s.

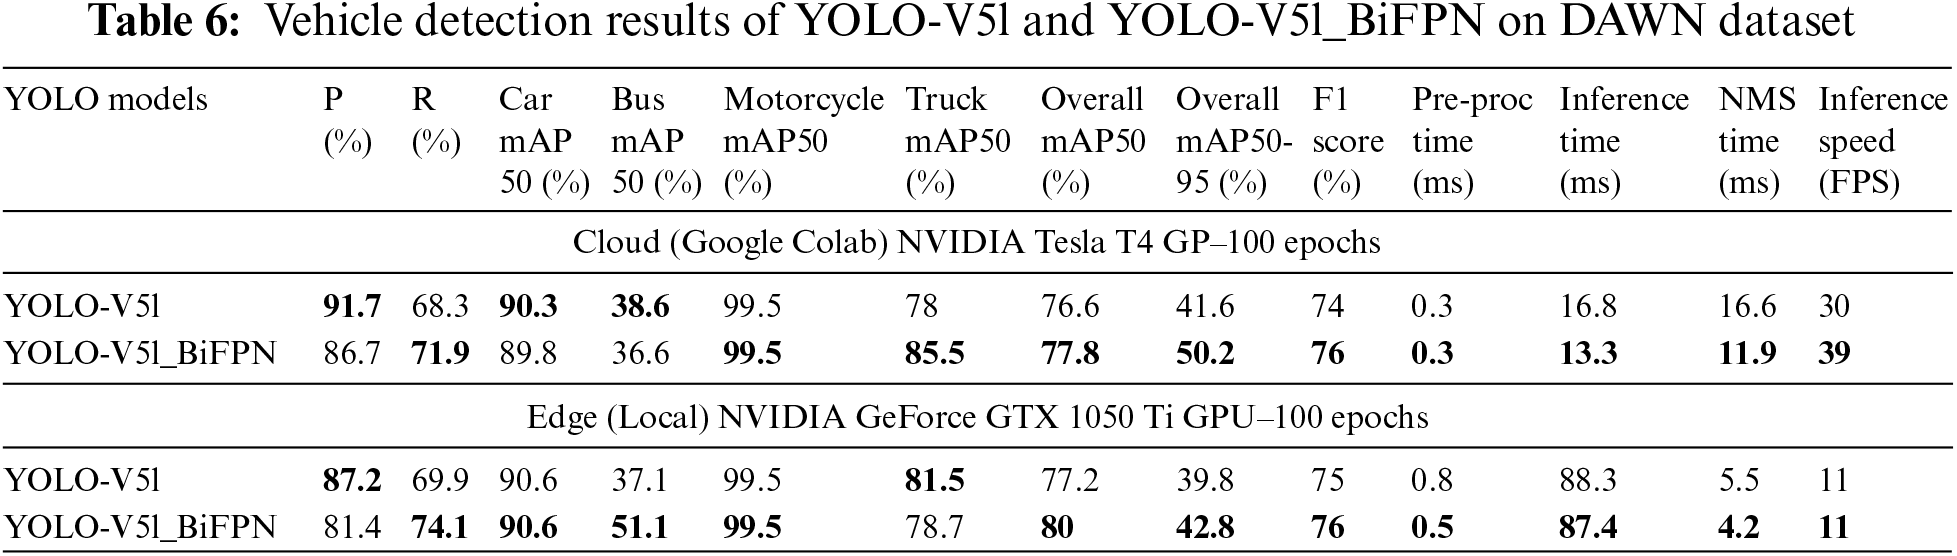
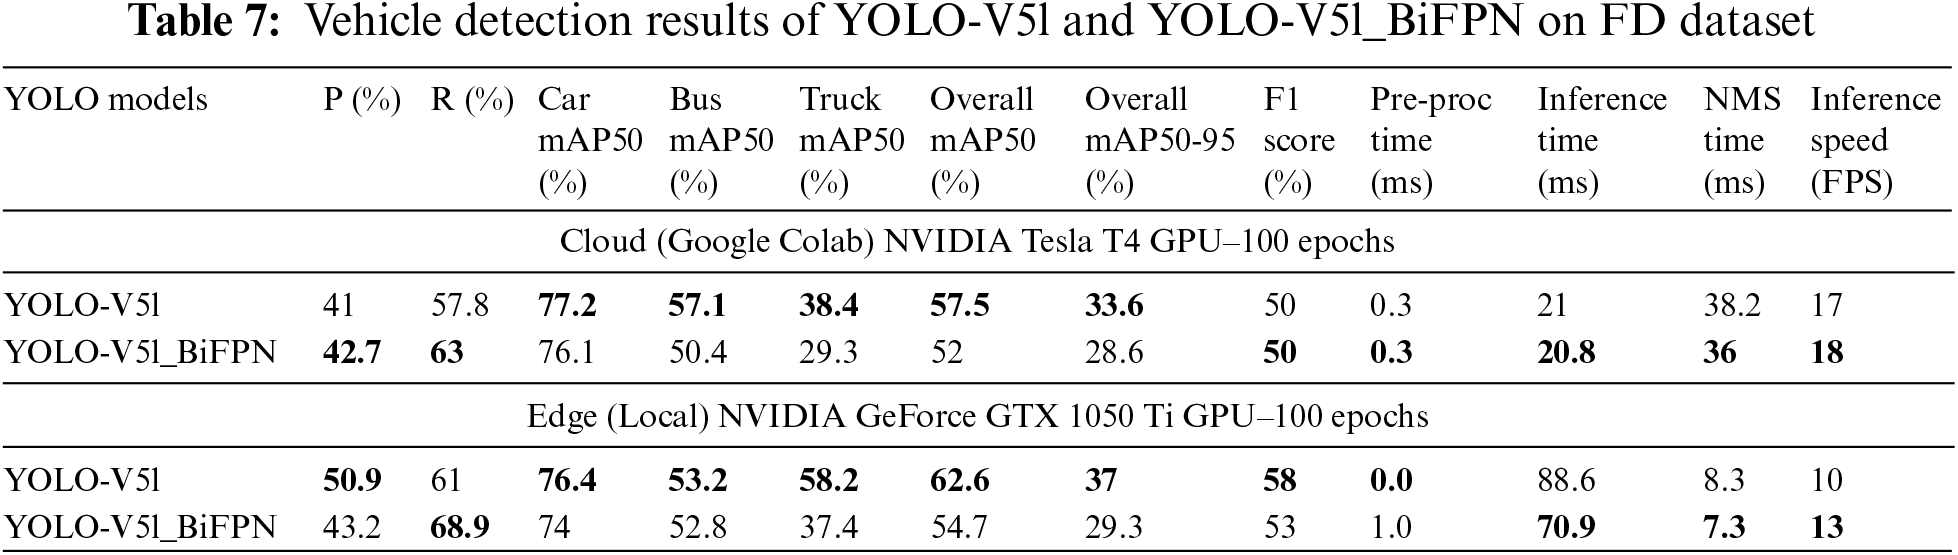
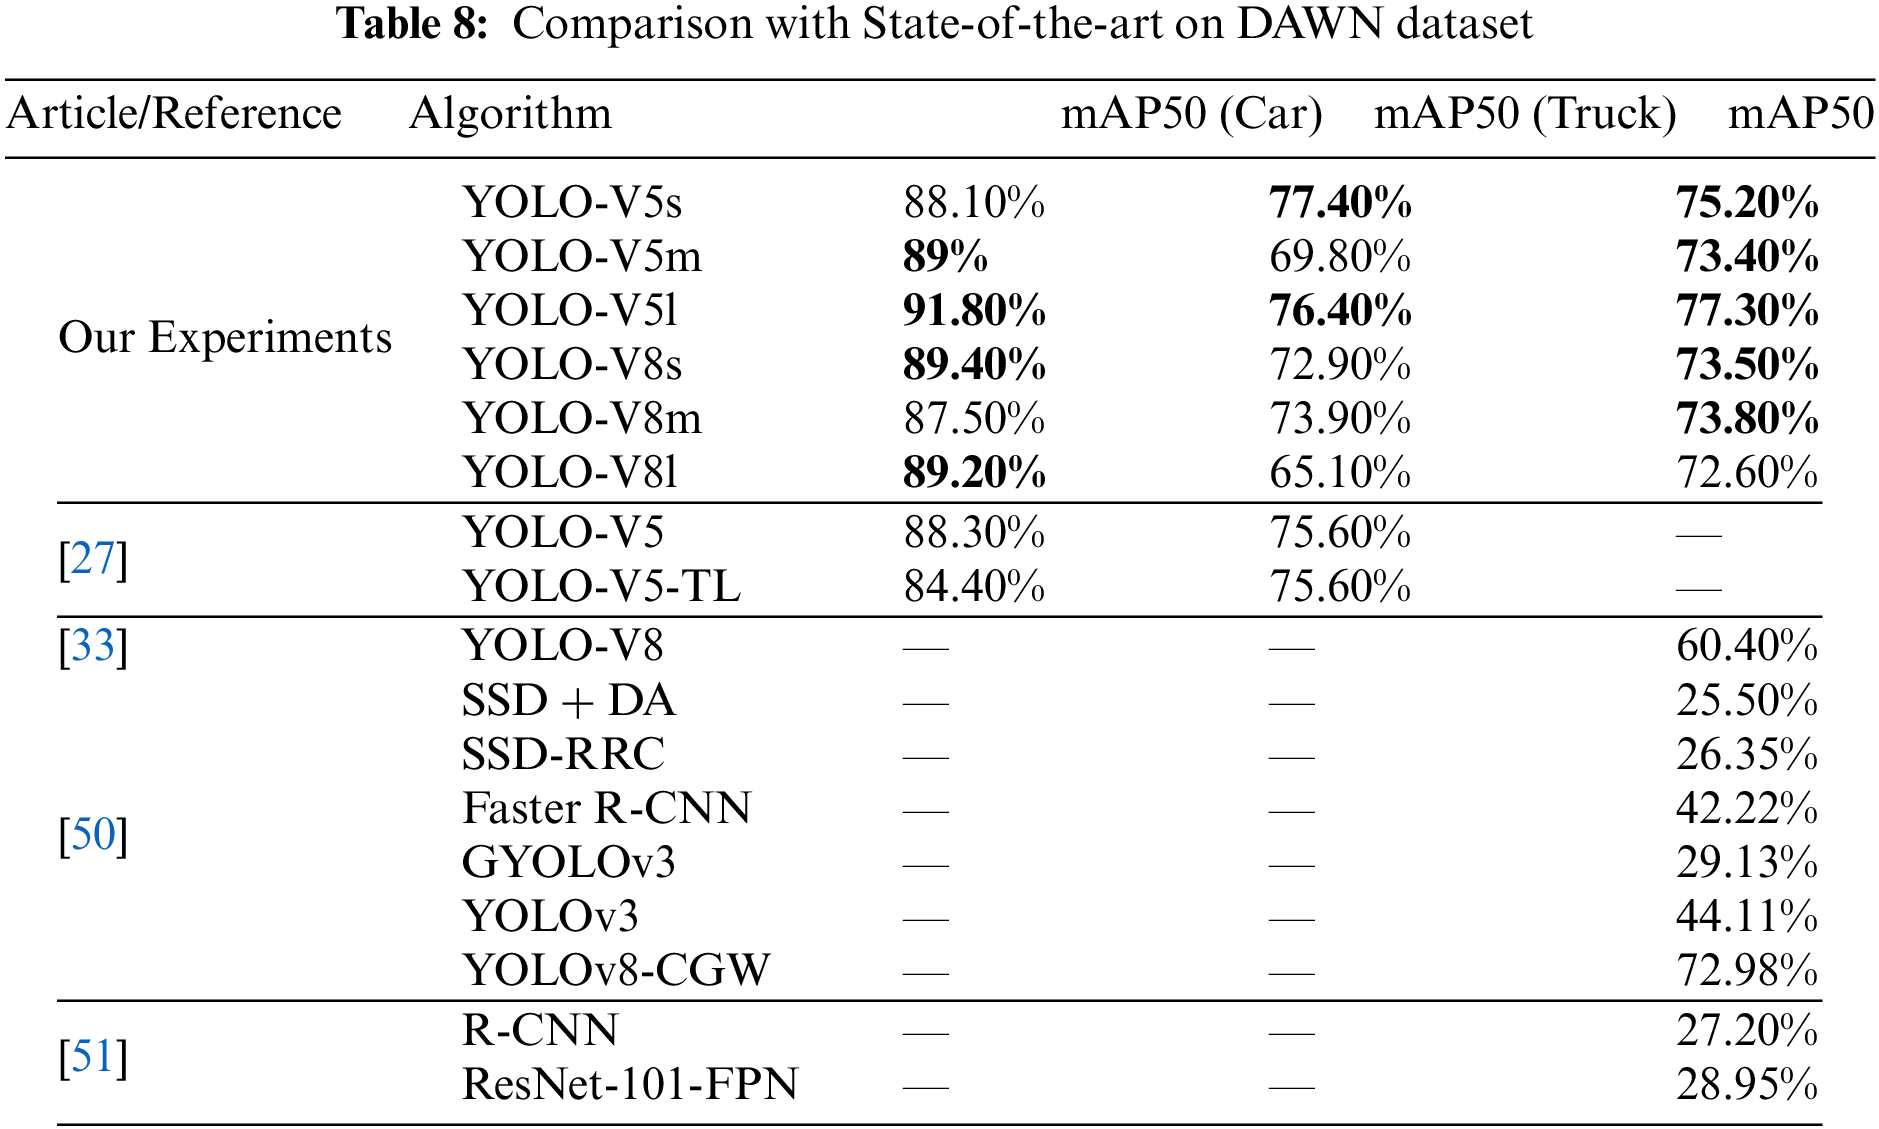
On local GPU, proposed YOLO-V5s variants outperforms with competitive results of recall, mAP50 and mAP50-95 scores as compared to state-of-the-art YOLO-V5s. The YOLO-V5s in detecting cars and buses; and F1 scores as comparison to YOLO-V5s variants. However, YOLO-V5s variants outperforms in pre-processing, inference, and NMS time as well as offer higher FPS inference speed as compared to state-of-the-art YOLO-V5s. The cloud and edge (local) GPUs experimental results of YOLO-V5l and YOLO-V5l_BiFPN on the DAWN dataset is presented in Table 6. On cloud and local GPUs, YOLO-V5l mainly outperforms in precision score whereas, the YOLO-V5l_BiFPN outperforms in recall, individual class level mAP50 scores, overall mAP50 score, mAP50-95 score as well as F1 score. The YOLO-V5l_BiFPS is also outperforms in pre-processing, inference, and NMS time as well as FPS inference speed as compared to YOLO-V5l. The cloud and edge (local) GPUs experimental results of YOLO-V5l and YOLO-V5l_BiFPN on the FD dataset are presented in Table 7. On cloud and local GPUs, YOLO-V5l outperforms in detecting all vehicle categories as compared to YOLO-V5l_BiFPN. YOLO-V5l_BiFPN outperforms in recall scores. The YOLO-V5l_BiFPS outperforms in inference, and NMS time as well as FPS inference speed as compared to YOLO-V5l. The comparison of YOLO-V5, YOLO-V5s variants, and YOLO-V8 with state-of-the-art research on DAWN dataset is presented in Table 8.
The challenge of vision-based vehicle detection in adverse weather conditions, particularly fog, remains a critical concern for autonomous vehicles, collision avoidance systems, and IoT-enabled traffic surveillance. This study evaluated the efficiency and cost-effectiveness of state-of-the-art YOLO-V5 and YOLO-V8 models, leveraging customized and self-annotated DAWN and FD datasets for vehicle detection in foggy conditions. The introduction of YOLO-V5s variants—YOLO-V5s_CBAM, YOLO-V5s_NAM, and YOLO-V5s_SimAM—along with the enhancement of YOLO-V5l using BiFPN, demonstrated significant improvements in detection accuracy and speed, particularly in cloud-based and edge environments. YOLO-V5l achieved superior performance in precision, recall, and mAP50 on the DAWN dataset, although it was outpaced by YOLO-V8 models in terms of FPS. This trade-off between detection accuracy and processing speed highlights the need for careful selection of models based on specific application requirements. Despite its strengths, YOLO-V5l’s lower FPS indicates a need for further optimization, particularly in real-time applications. Future work will focus on refining the backbone, neck, and head components of both YOLO-V5 and YOLO-V8 models. The goal is to enhance vehicle detection accuracy while maintaining real-time processing capabilities. Additionally, further research will explore more complex modifications to these models to achieve a better balance between efficiency and cost-effectiveness, particularly for nano and small versions of the YOLO models. This continued development will be crucial for advancing the practical deployment of vehicle detection systems in challenging weather conditions.
Acknowledgement: This work was supported and funded by the Deanship of Scientific Research at Imam Mohammad Ibn Saud Islamic University (IMSIU) (grant number IMSIU-RG23129).
Funding Statement: This work was supported and funded by the Deanship of Scientific Research at Imam Mohammad Ibn Saud Islamic University (IMSIU) (grant number IMSIU-RG23129).
Author Contributions: The authors confirm contribution to the paper as follows: study conception and design: Naeem Raza, Mudassar Ahmad, Muhammad Ahsan Latif, Muhammad Asif Habib, Qaisar Abbas; data collection, analysis and interpretation of results: Naeem Raza, Mudassar Ahmad, Muhammad Asif Habib, Muhammad Ahsan Latif, Qaisar Abbas, Mutlaq B. Aldajani; draft manuscript preparation: Naeem Raza, Qaisar Abbas, Muhammad Ahsan Latif, Mudassar Ahmad, Muhammad Asif Habib. All authors reviewed the results and approved the final version of the manuscript.
Availability of Data and Materials: Data openly available in a public repository. The data that support the findings of this study are openly available in DAWN at https://data.mendeley.com/datasets/766ygrbt8y/3 and Foggy Driving at https://people.ee.ethz.ch/~csakarid/SFSU_synthetic/ (accessed on 03 January 2024). Furthermore, annotation files of DAWN and FD datasets are available with the corresponding author and will be provided upon a reasonable request.
Ethics Approval: Not applicable.
Conflicts of Interest: The authors declare that they have no conflicts of interest to report regarding the present study.
References
1. WHO, “Road traffic injuries,” Jun. 10, 2024. Accessed: Jun. 10, 2024. [Online]. Available: https://www.who.int/news-room/fact-sheets/detail/road-traffic-injuries [Google Scholar]
2. PBS, “Road Accidents Annual Report (Pakistan),” Jun. 10, 2023. Accessed: Jun. 10, 2024. [Online]. Available: https://www.pbs.gov.pk/node/1107 [Google Scholar]
3. FWA, “How do weather events impact roads?,” Jun. 10, 2024. Accessed: Jan. 10, 2024. [Online]. Available: https://ops.fhwa.dot.gov/weather/q1_roadimpact.htm [Google Scholar]
4. X. Chang, H. Li, L. Qin, J. Rong, Y. Lu and X. Chen, “Evaluation of cooperative systems on driver behavior in heavy fog condition based on a driving simulator,” Accid. Anal. Prev., vol. 128, no. 3, pp. 197–205, 2019. doi: 10.1016/j.aap.2019.04.019. [Google Scholar] [PubMed] [CrossRef]
5. X. Dong, S. Yan, and C. Duan, “A lightweight vehicles detection network model based on YOLOv5,” Eng. Appl. Artif. Intell., vol. 113, 2022, Art. no. 104914. doi: 10.1016/j.engappai.2022.104914. [Google Scholar] [CrossRef]
6. A. A. Minhas, S. Jabbar, M. Farhan, and M. Najam ul Islam, “A smart analysis of driver fatigue and drowsiness detection using convolutional neural networks,” Multimed. Tools Appl., vol. 81, no. 19, pp. 26969–26986, 2022. doi: 10.1007/s11042-022-13193-4. [Google Scholar] [CrossRef]
7. Y. Cai et al., “YOLOv4-5D: An effective and efficient object detector for autonomous driving,” IEEE Trans. Instrum. Meas., vol. 70, pp. 1–13, 2021. doi: 10.1109/TIM.2021.3065438. [Google Scholar] [CrossRef]
8. Y. Xiao et al., “A review of object detection based on deep learning,” Multimed. Tools Appl., vol. 79, pp. 23729–23791, 2020. doi: 10.1007/s11042-020-08976-6. [Google Scholar] [CrossRef]
9. F. Zeng, C. Pang, and H. Tang, “Sensors on internet of things systems for the sustainable development of smart cities: A systematic literature review,” Sensors, vol. 24, no. 7, 2024, Art. no. 2074. doi: 10.3390/s24072074. [Google Scholar] [PubMed] [CrossRef]
10. A. Ullah et al., “Smart cities: The role of Internet of Things and machine learning in realizing a data-centric smart environment,” Complex Intell Syst, vol. 10, no. 1, pp. 1607–1637, 2024. doi: 10.1007/s40747-023-01175-4. [Google Scholar] [CrossRef]
11. G. Chen et al., “A survey of the four pillars for small object detection: Multiscale representation, contextual information, super-resolution, and region proposal,” IEEE Trans Syst, Man, Cybern.: Syst., vol. 52, no. 2, pp. 936–953, 2020. doi: 10.1109/TSMC.2020.3005231. [Google Scholar] [CrossRef]
12. A. Vijayakumar and S. Vairavasundaram, “Yolo-based object detection models: A review and its applications,” Multimed. Tools Appl., pp. 1–40, 2024. doi: 10.1007/s11042-024-18872-y. [Google Scholar] [CrossRef]
13. N. U. A. Tahir, Z. Zhang, M. Asim, J. Chen, and M. ELAffendi, “Object detection in autonomous vehicles under adverse weather: A review of traditional and deep learning approaches,” Algorithms, vol. 17, no. 3, 2024, Art. no. 103. doi: 10.3390/a17030103. [Google Scholar] [CrossRef]
14. J. Kaur and W. Singh, “A systematic review of object detection from images using deep learning,” Multimed. Tools Appl., vol. 83, no. 4, pp. 12253–12338, 2024. doi: 10.1007/s11042-023-15981-y. [Google Scholar] [CrossRef]
15. M. -H. Guo et al., “Attention mechanisms in computer vision: A survey,” Comput. Vis. Media, vol. 8, no. 3, pp. 331–368, 2022. doi: 10.1007/s41095-022-0271-y. [Google Scholar] [CrossRef]
16. M. -H. Guo, C. -Z. Lu, Z. -N. Liu, M. -M. Cheng, and S. -M. Hu, “Visual attention network,” Comput. Vis. Media, vol. 9, no. 4, pp. 733–752, 2023. doi: 10.1007/s41095-023-0364-2. [Google Scholar] [CrossRef]
17. U. Sirisha, S. P. Praveen, P. N. Srinivasu, P. Barsocchi, and A. K. Bhoi, “Statistical analysis of design aspects of various YOLO-based deep learning models for object detection,” Int. J. Comput. Intell. Syst., vol. 16, no. 1, 2023, Art. no. 126. doi: 10.1007/s44196-023-00302-w. [Google Scholar] [CrossRef]
18. S. Woo, J. Park, J. -Y. Lee, and I. S. Kweon, “CBAM: Convolutional block attention module,” in Proc. Eur. Conf. Comput. Vis. (ECCV), 2018, pp. 3–19. [Google Scholar]
19. Y. Liu, Z. Shao, Y. Teng, and N. Hoffmann, “NAM: Normalization-based attention module,” 2021, arXiv:2111.12419. [Google Scholar]
20. L. Yang, R. -Y. Zhang, L. Li, and X. Xie, “SimAM: A simple, parameter-free attention module for convolutional neural networks,” in Proc. 38th Int. Conf. Mach. Learn., 2021, pp. 11863–11874. [Google Scholar]
21. M. Tan, R. Pang, and Q. Le, “EfficientDet: Scalable and efficient object detection,” in 2020 IEEE/CVF Conf. Comput. Vis. Pattern Recogn. (CVPR), Seattle, WA, USA, 2020, pp. 10778–10787. [Google Scholar]
22. K. Aminiyeganeh, R. W. Coutinho, and A. Boukerche, “IoT video analytics for surveillance-based systems in smart cities,” Comput. Commun., vol. 224, no. 4, pp. 95–105, 2024. doi: 10.1016/j.comcom.2024.05.021. [Google Scholar] [CrossRef]
23. Z. Wang, J. Zhan, C. Duan, X. Guan, P. Lu and K. Yang, “A review of vehicle detection techniques for intelligent vehicles,” IEEE Trans. Neural Netw. Learn. Syst., vol. 34, no. 8, pp. 3811–3831, 2022. [Google Scholar]
24. J. Redmon, S. Divvala, R. Girshick, and A. Farhadi, “You Only Look Once: Unified, real-time object detection,” in 2016 IEEE Conf. Comput. Vis. Pattern Recogn. (CVPR), Las Vegas, NV, USA, 2016, pp. 779–788. [Google Scholar]
25. “Ultralytics: Simpler. Smarter. Further,” Accessed: Jan. 10, 2024. [Online]. Available: https://github.com/ultralytics/ultralytics [Google Scholar]
26. “Ultralytics YOLO Docs,” Accessed: Jun. 10, 2024. [Online]. Available: https://www.ultralytics.com/ [Google Scholar]
27. F. Ozdemir, Y. S. Bostanci, and M. Soyturk, “Performance evaluation of YOLOv5 in adverse weather conditions,” in 2023 31st Signal Process. Commun. Appl. Conf. (SIU), Istanbul, Turkiye, 2023, pp. 1–4. [Google Scholar]
28. T. Sharma, B. Debaque, N. Duclos, A. Chehri, B. Kinder and P. Fortier, “Deep learning-based object detection and scene perception under bad weather conditions,” Electronics, vol. 11, no. 4, 2022, Art. no. 563. doi: 10.3390/electronics11040563. [Google Scholar] [CrossRef]
29. N. Aloufi, A. Alnori, V. Thayananthan, and A. Basuhail, “Object detection performance evaluation for autonomous vehicles in sandy weather environments,” Appl. Sci., vol. 13, no. 18, 2023, Art. no. 10249. doi: 10.3390/app131810249. [Google Scholar] [CrossRef]
30. M. Humayun, F. Ashfaq, N. Z. Jhanjhi, and M. K. Alsadun, “Traffic management: Multi-scale vehicle detection in varying weather conditions using YOLOv4 and spatial pyramid pooling network,” Electronics, vol. 11, no. 17, 2022, Art. no. 2748. doi: 10.3390/electronics11172748. [Google Scholar] [CrossRef]
31. X. Meng, Y. Liu, L. Fan, and J. Fan, “YOLOv5s-Fog: An improved model based on YOLOv5s for object detection in foggy weather scenarios,” Sensors, vol. 23, no. 11, 2023, Art. no. 5321. doi: 10.3390/s23115321. [Google Scholar] [PubMed] [CrossRef]
32. A. Vellaidurai and M. Rathinam, “A novel OYOLOV5 model for vehicle detection and classification in adverse weather conditions,” Multimed. Tools Appl., pp. 1–18, 2023. doi: 10.1007/s11042-023-16450-2. [Google Scholar] [CrossRef]
33. D. Kumar and N. Muhammad, “Object detection in adverse weather for autonomous driving through data merging and YOLOv8,” Sensors, vol. 23, no. 20, 2023, Art. no. 8471. doi: 10.3390/s23208471. [Google Scholar] [PubMed] [CrossRef]
34. T. Sharma et al., “Deep learning-based object detection and classification for autonomous vehicles in different weather scenarios of Quebec, Canada” IEEE Access, 2024. doi: 10.1109/ACCESS.2024.3354076. [Google Scholar] [CrossRef]
35. M. Hasan, K. A. Alavee, S. Z. Bin Bashar, M. T. Rahman, M. I. Hossain and M. G. Raibul Alam, “Comparative study of object detection models for safety in autonomous vehicles, homes, and roads using IoT devices,” in 2023 IEEE Asia-Pacific Conf. Comput. Sci. Data Eng. (CSDE), Nadi, Fiji, 2023, pp. 1–6. [Google Scholar]
36. I. Lashkov, R. Yuan, and G. Zhang, “Edge-computing-facilitated nighttime vehicle detection investigations with CLAHE-enhanced images,” IEEE Trans. Intell. Transp. Syst., vol. 24, no. 11, pp. 13370–13383, 2023. doi: 10.1109/TITS.2023.3255202. [Google Scholar] [CrossRef]
37. X. Wang and J. Song, “ICIoU: Improved loss based on complete intersection over union for bounding box regression,” IEEE Access, vol. 9, pp. 105686–105695, 2021. doi: 10.1109/ACCESS.2021.3100414. [Google Scholar] [CrossRef]
38. Z. Zheng, P. Wang, W. Liu, J. Li, R. Ye and D. Ren, “Distance-IoU loss: Faster and better learning for bounding box regression,” in Proc. AAAI Conf. Artif. Intell., vol. 34, no. 7, pp. 12993–13000, 2020. doi: 10.1609/aaai.v34i07.6999. [Google Scholar] [CrossRef]
39. J. Yu, Y. Jiang, Z. Wang, Z. Cao, and T. Huang, “Unitbox: An advanced object detection network,” in Proc. 24th ACM Int. Conf. Multimed., 2016, pp. 516–520. [Google Scholar]
40. Z. Zheng et al., “Enhancing geometric factors in model learning and inference for object detection and instance segmentation,” IEEE Trans. Cybern., vol. 52, no. 8, pp. 8574–8586, 2021. doi: 10.1109/TCYB.2021.3095305. [Google Scholar] [PubMed] [CrossRef]
41. L. Budach et al., “The effects of data quality on machine learning performance,” arXiv preprint arXiv:2207.14529, 2022. [Google Scholar]
42. M. Kenk, “DAWN,” Accessed: Jan. 10, 2024. [Online]. Available: https://data.mendeley.com/datasets/766ygrbt8y/3 [Google Scholar]
43. M. A. Kenk and M. Hassaballah, “DAWN: Vehicle detection in adverse weather nature dataset,” 2020, arXiv:2008.05402. [Google Scholar]
44. “Semantic foggy scene understanding with synthetic data,” Accessed: Jan. 10, 2024. [Online]. Available: https://people.ee.ethz.ch/~csakarid/SFSU_synthetic/ [Google Scholar]
45. M. Cordts et al., “The cityscapes dataset for semantic urban scene understanding,” in 2016 IEEE Conf. Comput. Vis. Pattern Recogn. (CVPR), Las Vegas, NV, USA, 2016, pp. 3213–3223. [Google Scholar]
46. “YOLO-Label,” Accessed: Jan. 10, 2024. [Online]. Available: https://github.com/developer0hye/Yolo_Label [Google Scholar]
47. M. J. Khan, M. A. Khan, S. Turaev, S. Malik, H. El-Sayed and F. Ullah, “A vehicle-edge-cloud framework for computational analysis of a fine-tuned deep learning model,” Sensors, vol. 24, no. 7, 2024, Art. no. 2080. doi: 10.3390/s24072080. [Google Scholar] [PubMed] [CrossRef]
48. J. Kaur and W. Singh, “Tools, techniques, datasets and application areas for object detection in an image: A review,” Multimed. Tools Appl., vol. 81, no. 27, pp. 38297–38351, 2022. doi: 10.1007/s11042-022-13153-y. [Google Scholar] [PubMed] [CrossRef]
49. S. K. Pal, A. Pramanik, J. Maiti, and P. Mitra, “Deep learning in multi-object detection and tracking: State of the art,” Appl. Intell., vol. 51, no. 9, pp. 6400–6429, 2021. doi: 10.1007/s10489-021-02293-7. [Google Scholar] [CrossRef]
50. M. A. Berwo, Y. Fang, N. Sarwar, J. Mahmood, M. Aljohani and M. Elhosseini, “YOLOv8n-CGW: A novel approach to multi-oriented vehicle detection in intelligent transportation systems,” Multimed. Tools Appl., pp. 1–32, 2024. doi: 10.1007/s11042-024-19145-4. [Google Scholar] [CrossRef]
51. A. Farid, F. Hussain, K. Khan, M. Shahzad, U. Khan and Z. Mahmood, “A Fast and accurate real-time vehicle detection method using deep learning for unconstrained environments,” Appl. Sci., vol. 13, no. 5, 2023, Art. no. 3059. doi: 10.3390/app13053059. [Google Scholar] [CrossRef]
Cite This Article
 Copyright © 2024 The Author(s). Published by Tech Science Press.
This work is licensed under a Creative Commons Attribution 4.0 International License , which permits unrestricted use, distribution, and reproduction in any medium, provided the original work is properly cited.
 Downloads
 Citation Tools