
 Submit a Paper
 Propose a Special lssue
 Open Access
ARTICLE

APSO-CNN-SE: An Adaptive Convolutional Neural Network Approach for IoT Intrusion Detection
College of Big Data and Information Engineering, Guizhou University, Guizhou, 550025, China
* Corresponding Author: Damin Zhang. Email:
Computers, Materials & Continua 2024, 81(1), 567-601. https://doi.org/10.32604/cmc.2024.055007
Received 13 June 2024; Accepted 22 August 2024; Issue published 15 October 2024
 View Full Text
 Download PDF
Abstract
The surge in connected devices and massive data aggregation has expanded the scale of the Internet of Things (IoT) networks. The proliferation of unknown attacks and related risks, such as zero-day attacks and Distributed Denial of Service (DDoS) attacks triggered by botnets, have resulted in information leakage and property damage. Therefore, developing an efficient and realistic intrusion detection system (IDS) is critical for ensuring IoT network security. In recent years, traditional machine learning techniques have struggled to learn the complex associations between multidimensional features in network traffic, and the excellent performance of deep learning techniques, as an advanced version of machine learning, has led to their widespread application in intrusion detection. In this paper, we propose an Adaptive Particle Swarm Optimization Convolutional Neural Network Squeeze-and-Excitation (APSO-CNN-SE) model for implementing IoT network intrusion detection. A 2D CNN backbone is initially constructed to extract spatial features from network traffic. Subsequently, a squeeze-and-excitation channel attention mechanism is introduced and embedded into the CNN to focus on critical feature channels. Lastly, the weights and biases in the CNN-SE are extracted to initialize the population individuals of the APSO. As the number of iterations increases, the population’s position vector is continuously updated, and the cross-entropy loss function value is minimized to produce the ideal network architecture. We evaluated the models experimentally using binary and multiclassification on the UNSW-NB15 and NSL-KDD datasets, comparing and analyzing the evaluation metrics derived from each model. Compared to the base CNN model, the results demonstrate that APSO-CNN-SE enhances the binary classification detection accuracy by 1.84% and 3.53% and the multiclassification detection accuracy by 1.56% and 2.73% on the two datasets, respectively. Additionally, the model outperforms the existing models like DT, KNN, LR, SVM, LSTM, etc., in terms of accuracy and fitting performance. This means that the model can identify potential attacks or anomalies more precisely, improving the overall security and stability of the IoT environment.Keywords
As the Internet of Things age has emerged, people, things, and people have become more interconnected and share data, fostering the growth of social intelligence and improving people’s quality of life and productivity. Millions of embedded sensors and objects were integrated into the Internet of Things (IoT) [1], primarily composed of three logical layers: perception, network, and application [2]. The perception layer collects and converts information, the network layer performs access and transmission functions, and the application layer processes pertinent data from the network layer and enables human-computer interaction through the devices. IoT devices may be more vulnerable to different types of theft due to discrete operations occurring at different levels [3]. Furthermore, a great deal of network interconnectivity—encompassing cloud infrastructure, services, industrial networks, smart devices, and other intelligent entities—is present in the typical Internet of Things architecture [4]. The vast IoT system and the network’s pervasive interconnected nature expose end users to complex security challenges such as malware attacks, data leakage, and unauthorized access. According to the International Data Corporation (IDC) report, the number of IoT devices on the Internet will exceed 41 billion in 2025 [5]. With the surge in the number of devices, massive amounts of data are constantly pouring in, and edge nodes have insufficient memory, low processing power, and energy constraints, leading to various types of attacks. Among them, IoT is typically vulnerable to unknown attacks like DDoS, denial of service (DoS), and data theft [6]. For this reason, it is especially crucial to guarantee data integrity, confidentiality, authentication, and authorization [7] and to prevent user data leakage and property damage.
A widespread intrusion detection system and an efficient defence mechanism must be developed since IoT network security vulnerabilities have led to several incursions and attacks. The essence of network intrusion and attack is to access network resources and control operations. Destroying all resources and operations will damage network data, which will have a negative impact. An intrusion detection system is the first line of defence for computer network security, which is achieved by gathering network data and creating effective processing algorithms for the detected attacks. The two main categories of intrusion detection systems [8] are misuse detection and anomaly detection. Misuse detection builds a rule base using available data, effectively identifying known attacks but not unknown ones, and requires frequent maintenance. Anomaly detection trains abnormal traffic features to identify known and unknown attacks. Both approaches have drawbacks, including high false alarm rates and low detection rates. In addition, depending on the detection object, the intrusion detection system can be separated into host-based and network-based techniques [9]. This study focuses on the more widely used network intrusion detection system (NIDS), as opposed to host-based intrusion detection systems (HIDS), which monitor and analyze the activities of a single host to defend it from network attack behaviours. NIDS can detect traffic throughout the network more accurately and in real-time.
Attackers employ sophisticated techniques to conceal their malicious intentions, making traditional IDSs slightly inadequate in dealing with evolving and complex cyber threats [10]. To address the shortcomings of traditional IDSs, machine learning (ML) techniques and their developed variants have been widely employed to accomplish relevant classification tasks in NIDS [11]. By enabling more effective and accurate attack identification, lowering false alarm rates, and adapting to the constantly changing threat landscape, machine learning improves the performance of intrusion detection systems by enabling security systems to effectively protect networks and data from malicious activities and unauthorized access. The principle behind this technique is to learn network attack categories in advance by using feature extraction and feature separation. Implementing an effective feature engineering process in NIDS helps in lowering the model’s complexity and parameter count. On the other hand, when the data volume is large and high dimensionality, it is straightforward to cause long training times, poor training effects, and the need to select the data artificially [12]. Reducing the data volume or downgrading the dimensionality may destroy the implied correlation between the data and the omission of important information. When evaluated on a specific dataset, the hyperparameters of ML usually have room for improvement, which can potentially result in human resource depletion [13]. Popular NIDS designs rely more on ML to achieve high-quality performance. In contrast, traditional ML-based NIDSs require extensive feature engineering and fine-tuning to ensure superior detection accuracy and consistent maintenance with the latest training dataset to recognize constantly updated cyber-attacks [14].
Machine learning techniques have shown significant advantages in IDS, but their limitations are equally obvious. Deep learning, an advanced machine learning, produces a sophisticated multilevel structure that can efficiently handle large-scale and high-dimensional data streams by drawing inspiration from the human brain’s neural network. Scientists have created several ubiquitous deep-learning models in real-world requirements in the past few years. These models are then integrated into a variety of platforms and underlying applications to enable the realization of complex applications like target detection, image processing, pattern recognition, and natural language processing. Deep learning technology is currently being successfully used in NIDS [15], which offers novel ideas and avenues for future study to address IoT security issues and achieve certain results. Current deep learning models, including Deep Neural Networks (DNN), CNN, Recurrent Neural Networks (RNN), Long Short-Term Memory (LSTM), and composite models, have been developed in response to the variety and unpredictability of malicious assaults in the Internet of Things [16]. Each of these models has certain benefits and drawbacks. A model combining DNN and federated learning (FL) for IoT intrusion detection was proposed [17]. FL is utilized to address the drawbacks of traditional ML/DL, maintaining and upholding the security of local data that is no longer shared between entities and reducing storage and power consumption. However, the model complexity is high, and it is more difficult to verify its scalability using only a single dataset. The CNN-BiLSTM intrusion detection model was created to address the minority class imbalance issue in the dataset [18]. It uses a focal loss function to achieve good detection accuracy, but its long runtime causes problems for resource-constrained nodes. Graph convolution neural networks (GCNs) were utilized to create attribute maps, integrated CNN for classification, and feature engineering processing for intrusion detection datasets [19]. The new model’s performance is improved compared to the baseline model, but the time cost of the data preprocessing phase is high.
Demand determines development. Researchers have developed many model architectures based on deep learning techniques. CNNs have been widely used in various deep-learning tasks due to their parameter-sharing, local awareness, and robust feature extraction capabilities [20]. CNNs’ ability to accurately capture local features in pictures for detail extraction and sophisticated target classification makes them the most effective in image processing tasks [21]. To fully realize feature extraction and better capture traffic features’ spatial characteristics and temporal dynamics, we convert each one-dimensional abnormal traffic data into two-dimensional grayscale image data. Meanwhile, it is crucial to consider both the timeliness of the model detection and the detection performance of anomalous assaults when detecting intrusions in IoT networks [22]. This research develops a lightweight two-dimensional convolutional neural network model to achieve spatial feature extraction and network traffic categorization identification.
Metaheuristic algorithms are widely used in NIDS due to their adaptability and robust search capabilities. Furthermore, it has been demonstrated that swarm-based algorithms work well to solve various optimization issues [23]. Researchers have recently applied population intelligence algorithms to network intrusion detection, feature selection, imbalance detection, and hyperparameter optimization. These operations have decreased the false alarm and false positive rates and significantly enhanced the performance of identifying anomalous traffic. Numerous universal swarm intelligence algorithms have been developed, among which the particle swarm algorithm is more mature. It has low time complexity, good optimization performance, strong robustness, and stability. We are considering employing the particle swarm algorithm to optimize the built-in convolutional neural network, accomplish model pre-training, enhance model detection performance, and minimize time loss. In this study, we propose a novel hybrid model for network intrusion detection called APSO-CNN-SE. It primarily leverages CNN as its backbone and optimizes it using the channel attention mechanism and the swarm intelligence algorithm for intrusion detection in the Internet of Things. Among them, APSO is an adaptive particle swarm algorithm proposed in this paper to enhance the adaptive updating performance of the algorithm on the typical PSO. The introduced channel attention mechanism is used to learn the feature channels that are relatively important in the model and improve the performance of detecting anomalous threats. The following are this study’s primary goals and contributions:
• In the data preprocessing stage, character-based data is numerical, numerical data is maximum-minimum normalized, and a data-filled image transformation method transforms sequence-based traffic data into 2D image data.
• A novel CNN architecture is proposed to fully utilize the advantages of convolutional neural networks in image processing. Additionally, a SE channel attention mechanism is introduced to improve the learning and memory of significant features.
• Adaptively adjust the particle swarm algorithm’s weights and acceleration factors to improve the algorithm’s ability to search for the space’s global optimal solution. The APSO-CNN-SE model is created, which updates the network model’s weights and biases using APSO to provide the best model and increase the accuracy of anomalous attack detection.
• The proposed model uses the UNSW-NB15 and NSL-KDD datasets as benchmark test data to perform binary and multi-classification detection. Appropriate evaluation metrics have been used for experimental evaluations and comparative analyses. The ML, constructed DL models, and advanced research findings from recent years are compared and analyzed with the performance metrics derived from the APSO-CNN-SE. Meanwhile, parameter sensitivity tests are included to enhance the selection criteria of certain hyperparameters.
The rest of the paper is organized as follows. Section 2 reviews the related work on network intrusion detection based on machine learning and deep learning techniques in the last few years; Section 3 describes the proposed model architecture in detail; Section 4 describes the experimental environment and related evaluation metrics and analyzes the experimental results explicitly; and Section 5 summarizes the work of this paper as well as describes the future research directions.
This section summarizes the network intrusion detection implemented using machine learning and deep learning approaches and the research results obtained and analyzes the excellence of these models.
The realization of network intrusion detection based on machine learning techniques can effectively improve the timeliness and detection rate. The Euclidean paradigm in K-Nearest Neighbor (KNN) was enhanced by the Shannon-Entropy algorithm in literature [24], which preserved the contribution of low-importance features to data classification while emphasizing the influence of high-importance features. According to the experimental results, the algorithm also increased the accuracy of DoS detection. The authors used a decision tree classifier for dependable intrusion detection and the entropy decision technique for feature selection to improve the data quality [25]. The classifier achieved an accuracy of 98.80% on CICIDS 2017 and 99.42% on NSL-KDD. A genetic algorithm was employed to pick features for data dimensionality reduction [26]. Three classifiers, namely SVM, KNN, and XGBoost, were utilized to identify anomalous behaviors. Evaluation metrics were used to examine the benefits of each classifier objectively. A classification and regression tree (CART) based feature selection approach has been suggested, generating 5 out of 41 features in the KDDCUP99 dataset, with lower computing cost and better intrusion detection performance for most classifiers [27]. Combining a support vector machine technique and a simple Bayesian classifier, the authors created a DLHA model that successfully classified anomalous assaults in the NSL-KDD dataset and produced good detection performance [28]. Considering the imbalance of the dataset and the model maintenance problem, the Random Forest (RF) classifier and XGBoost classifier are integrated into the literature [29] to classify the normal anomalies for the network traffic, which achieves an accuracy of 99.7% and 99.66% on two datasets, UNSW-NB15 and BoT-IoT, respectively. A lightweight, integrated model was built using decision trees (DT), logistic regression (LR), and plain Bayes as base classifiers and stochastic gradient descent as meta-classifiers. Feature selection from a chi-square test was added to achieve dimensionality reduction, and binary and multi-classification were used to assess the model’s performance. The findings showed that the model could increase intrusion detection accuracy and lower the false positive rate (FPR) [30]. The authors used the Synthetic Minority Oversampling Technique (SMOTE) oversampling method to solve the problem of unbalanced data category distribution and proposed automatic machine learning to achieve automatic hyper-parameter tuning with timeliness, obtaining 99.7% accuracy on multiclassification detection in KDDCUP99 [31].
Deep learning algorithms outperform machine learning methods in network intrusion detection because they handle massive amounts of high-dimensional data. A novel technique that selects features via fusion of statistical importance using Standard Deviation and Difference of Mean and Median was proposed, which facilitates the search for features with solid correlation and classifies and identifies the processed traffic data using DNN. The experimental findings demonstrated that the suggested model performs well across the three benchmark datasets [32]. On the BoT-IoT dataset, anomaly-based network intrusion detection using CNNs yielded 92% accuracy [33]. A three-layer intrusion detection model combining Weighted Deep Neural Network (WDNN), CNN, and LSTM was built to achieve supervised learning of anomalous traffic data, and an Adaptive Synthetic Sampling (ADASYN) oversampling technique was added to solve the data imbalance problem. Lastly, the NSL-KDD, CICIDS-2017, and CIDDS 001 datasets were used to test the model’s efficacy. The results showed that the model can recognize classifications with more than 97% accuracy [34]. The CNN-BiLSTM model was constructed by fusing spatiotemporal techniques [35]. The data was resampled using the NCR-SMOTE method, and feature selection was achieved through a recursive feature elimination method based on extreme random numbers. The results indicated that while the model’s temporal complexity may be insufficient, the individual detection indexes were comparatively more optimal. A graph neural network (GNN) was examined in [36] for network intrusion detection. The model exhibited good training results and strong generalization ability by utilizing edge features and a graph topological structure in a self-supervised manner. The authors employed DNN as a classifier and stacked autoencoder to reconstruct the relevant features. According to experimental analysis, the model was better at identifying unknown attacks and can be modified to accommodate evolving networks [37]. An anomaly detection model of FlowGANAnomaly was proposed for detecting anomaly attacks in NIDS, drawing inspiration from the application area of Generative Adversarial Networks (GAN) in computer vision and imaging anomaly detection. The low recall problem of anomaly detection is effectively improved by using feature mapping to a uniform feature space and introducing a novel anomaly scoring method; validation results on four datasets demonstrate that the proposed model can significantly improve anomaly detection performance [38]. Improved versions of four RNNs—Bidirectional Long Short Term Memory (Bi-LSTM), LSTM, Bidirectional Gated Recurrent Unit (Bi-GRU), and Gated Recurrent Unit (GRU)—were fused to produce the SPIDER model. PCA is used to reduce the data’s dimensionality, and the results of the experiments demonstrate the model’s strong robustness in intrusion detection [39].
In recent years, the manual parameter tuning approach to model optimization for ML and DL techniques has increasingly relied on experts’ experience and deep comprehension of algorithms and datasets. This approach is time-consuming and requires a significant investment of human resources. Thus, to advance the technology’s automated innovation and intelligent development, researchers are considering combining swarm intelligence algorithms with ML/DL techniques and applying them to NIDS to achieve feature selection, parameter training, and hyper-parameter optimization. The dimensionality of intrusion detection data was reduced using the Ant Colony Optimization (ACO) algorithm, which enhanced data quality and reduced energy usage. After being preprocessed, the data was trained in a DNN and tested to see whether it could outperform some of the current techniques [40]. A Whale Optimization Algorithm (WOA) and Artificial Bee Colony Optimization Algorithm (ABC) algorithms were fused to implement feature selection, and a CNN model was proposed to detect classification. The proposed mechanism reduced the execution time by 76.54% on NSL-KDD [41]. A hybrid Hunger Games Search and Remora Optimization Algorithm (HGSA) has been proposed to implement feature extraction and binary classification identification of network traffic using an SVM algorithm with an accuracy of over 99% [42]. The authors created a novel intrusion detection model by combining LSTM with the improved golden jackal optimization algorithm to select the best feature subset from the IDS dataset. This model could achieve accurate classification on both datasets, but the increased number of iterations somewhat increases the time loss [43]. A voting gray wolf optimizer (GWO) ensemble model was proposed to implement traffic analysis and data processing through voting techniques, feature selection, and feature extraction techniques, as well as optimize the parameters of the ensemble model using GWO. The experimental results show that the model has better detection performance when processing actual traffic data in IoT [44]. African Vulture Optimization Algorithm (AVOA), presented in [45], organizes feature selection. In the data preprocessing phase, the Deep Belief Network-Long Short Term Memory (DBN-LSTM) model was built to distinguish between normal and abnormal packets. The outcomes demonstrated that this model performs better than conventional techniques for network intrusion detection classification. The Grasshopper Optimization Algorithm (GOA) was implemented in an artificial neural network (ANN) to obtain the optimal ANN in a continuous training process. The ANN’s weights and biases were utilized as the GOA’s position vector, and the fitness function was selected as the training error. The experimental results demonstrated that the model correctly classified abnormal and normal messages on the KDD and UNSW-NB15 datasets [46]. The cross-entropy loss function value of the validation set was used as the fitness function when the adaptive inertia weighting strategy improved particle swarm optimization was first introduced in [47]. The results demonstrated that the model was reliable and effective in IoT network intrusion detection. A model framework for a one-dimensional convolutional neural network (1D-CNN) was created. The model’s nine hyperparameters were then optimized using two evolutionary techniques, PSO and Genetic Algorithm (GA), to detect binary classification on three datasets: UNSW-NB15, CIC-IDS2017, and NSL-KDD. The authors were successful in getting accurate detection outcomes. The development of this model not only advances network security research but also dramatically increases its ability for generalization and adaptation [48].
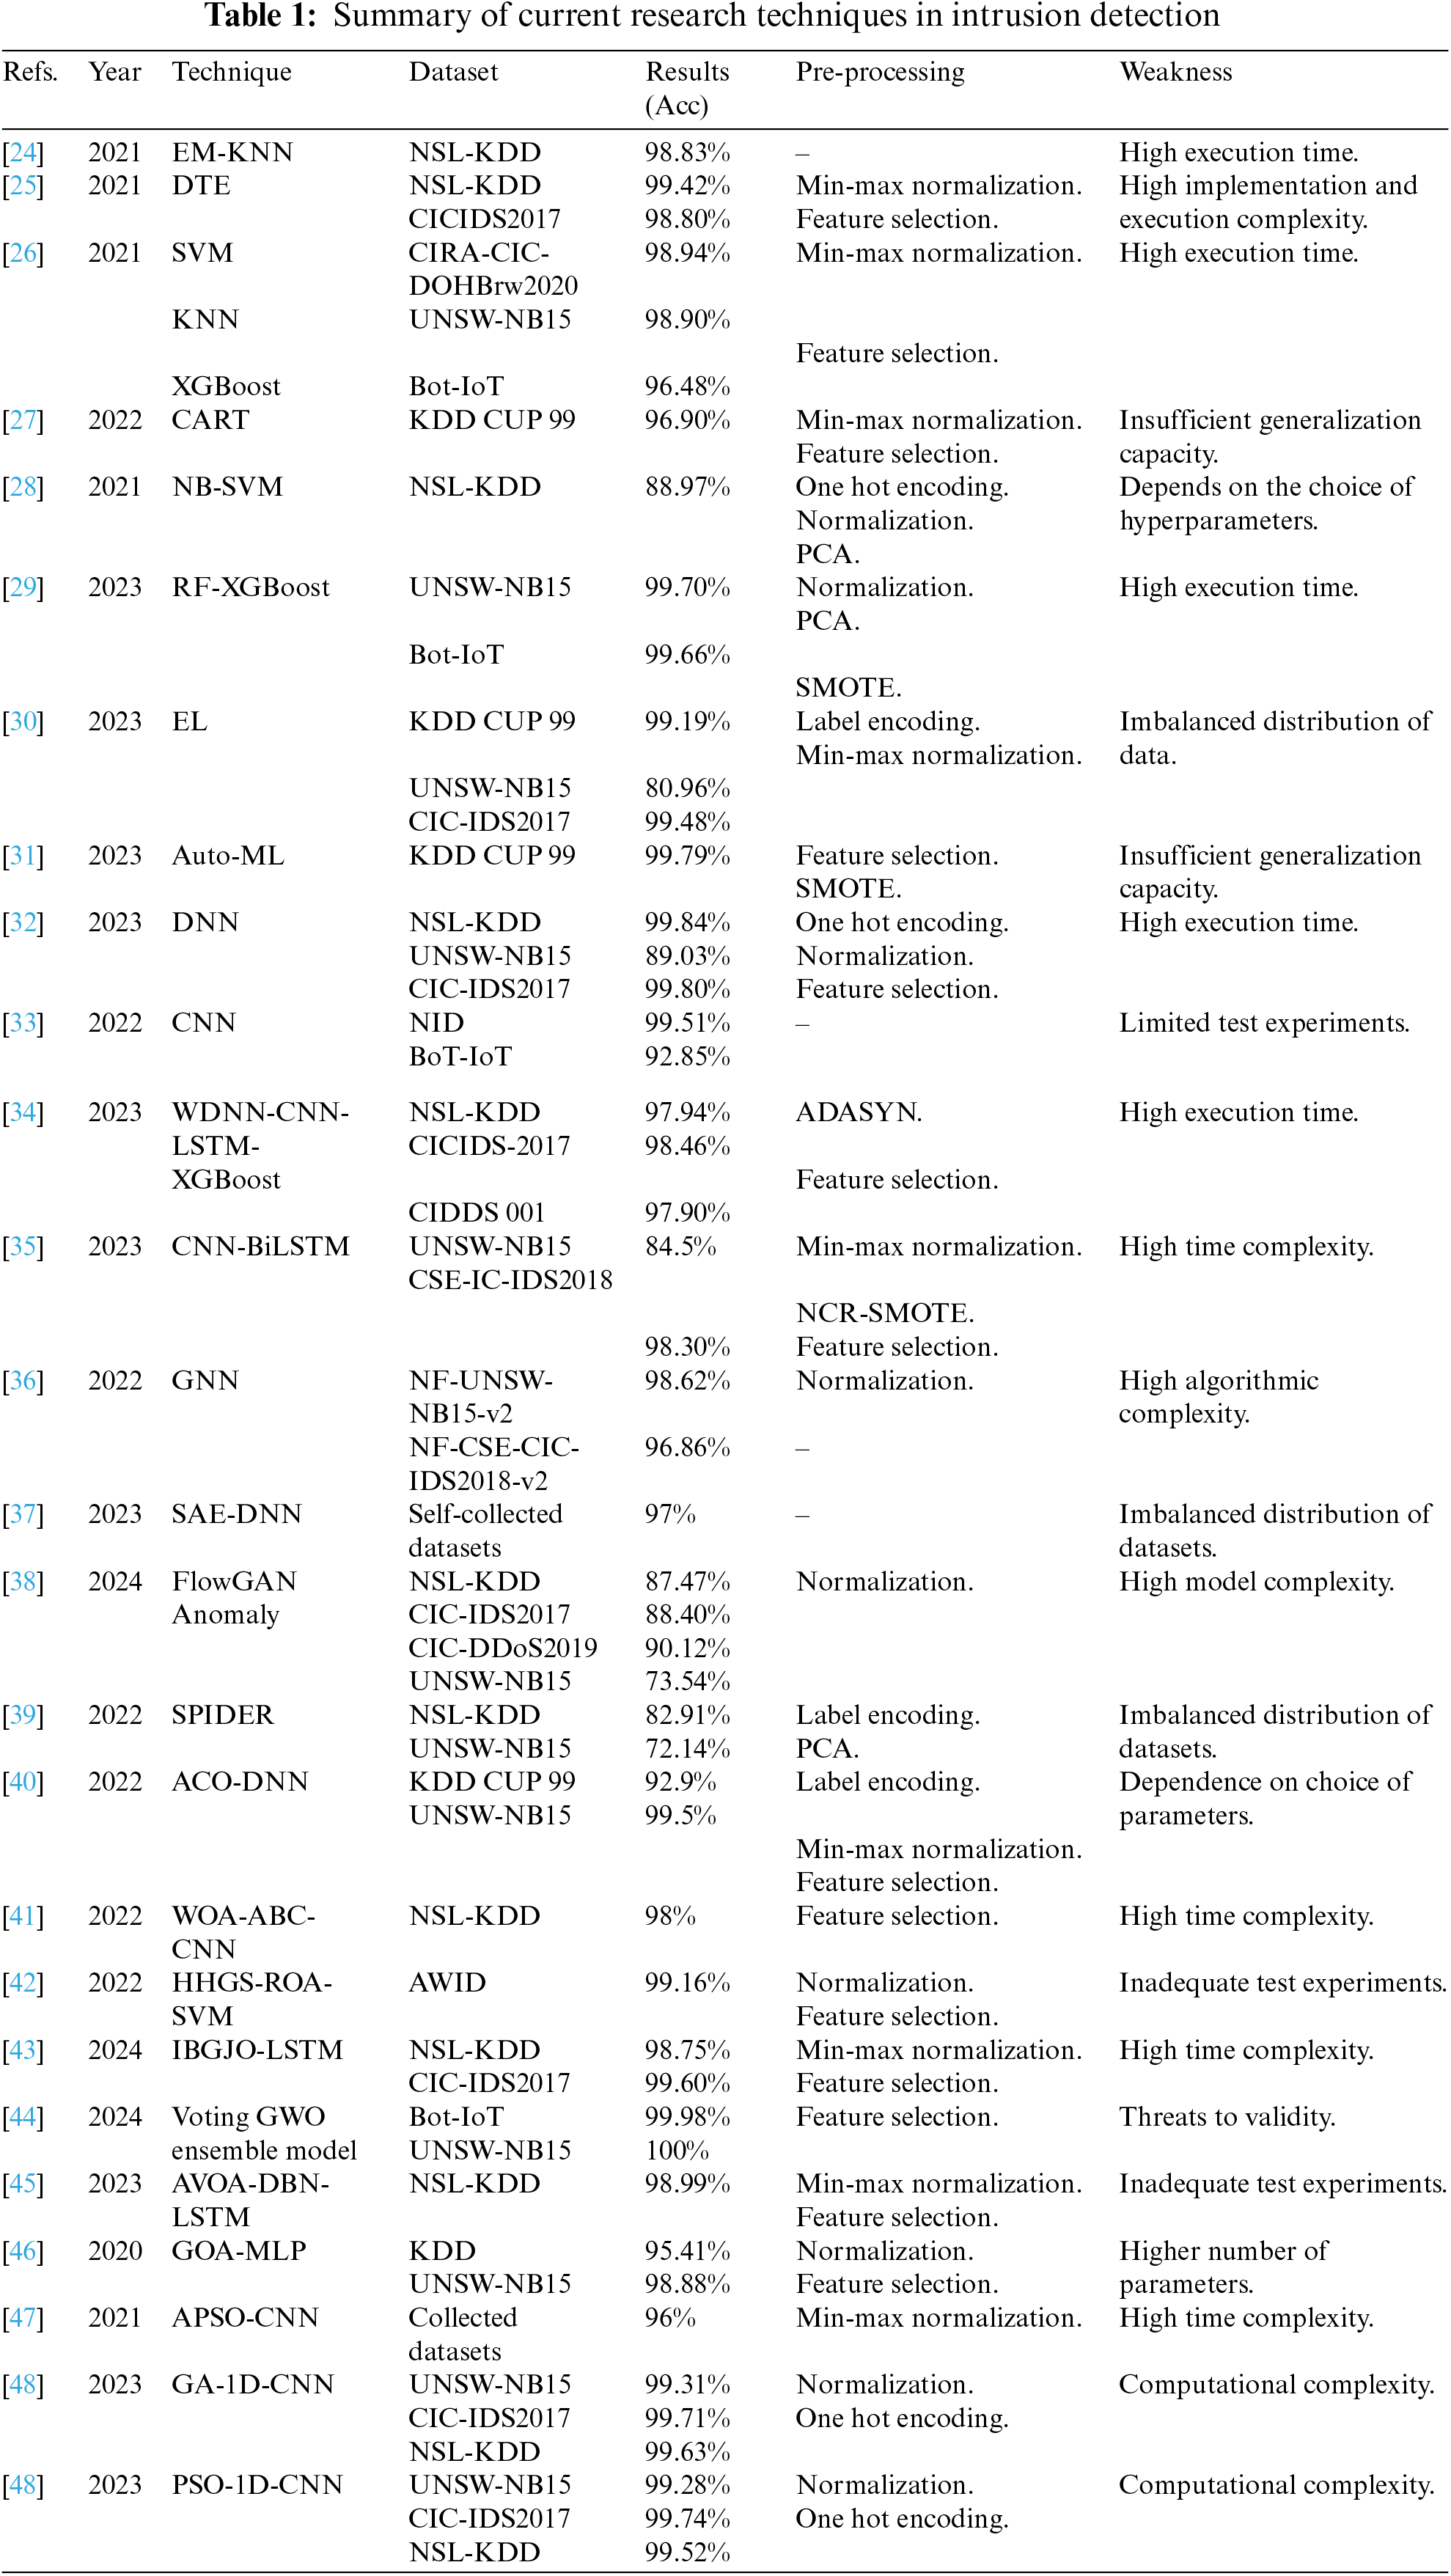
Table 1 shows the research results achieved using ML and DL algorithms to realize network intrusion detection for better comparative analysis. While most developed models exhibit better detection performance, the system’s detection efficiency is significantly reduced by the longer execution times and more complex algorithms. Additionally, some models are only tested on a single dataset, making it challenging to represent the model’s capacity for generalization accurately. Further, more literature fuses swarm intelligence algorithms with ML/DL models and applies them to IDS feature selection or parameter optimization. Although the models’ detection results are more significant, they have high computational complexity and parameter dependency. Considering the optimization ability and adaptivity of intelligent algorithms, this paper fuses swarm intelligence algorithms and DL models to overcome the limitations of individual models and enhance the classification effect. In addition, the DL model’s primary construction feature is lightweight, which shortens the algorithm’s execution time and lowers the system’s power consumption. The network environment’s scalability and adaptability are more thoroughly validated using multiple intrusion detection data datasets from practical IoT scenarios.
This section proposes a novel deep learning model with a convolutional neural network as the backbone network. Fig. 1 illustrates this specific network intrusion detection framework. To explain the internal workings of the model better, we break this section into three subsections: data description, data preprocessing, and specific model.
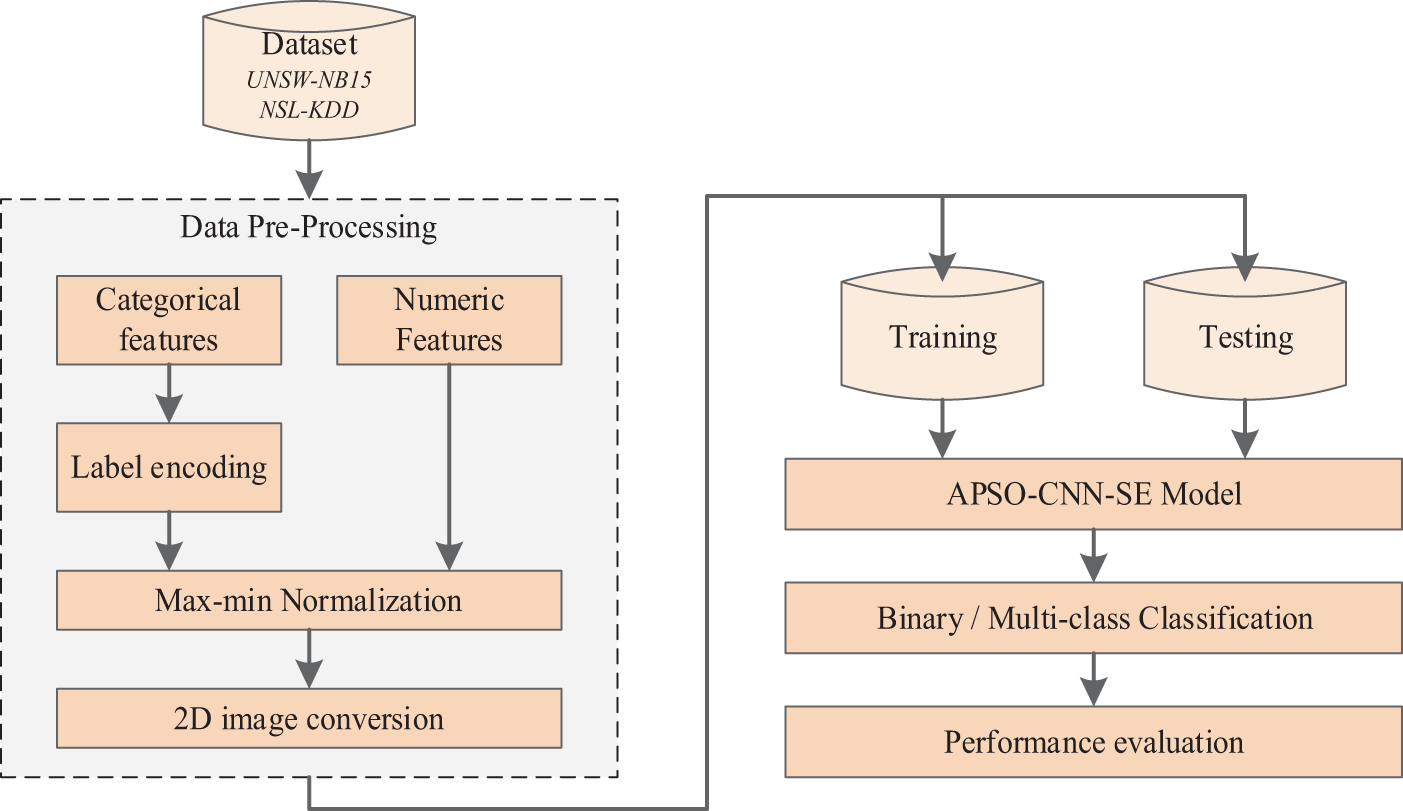
Figure 1: Flowchart for classification IDS model
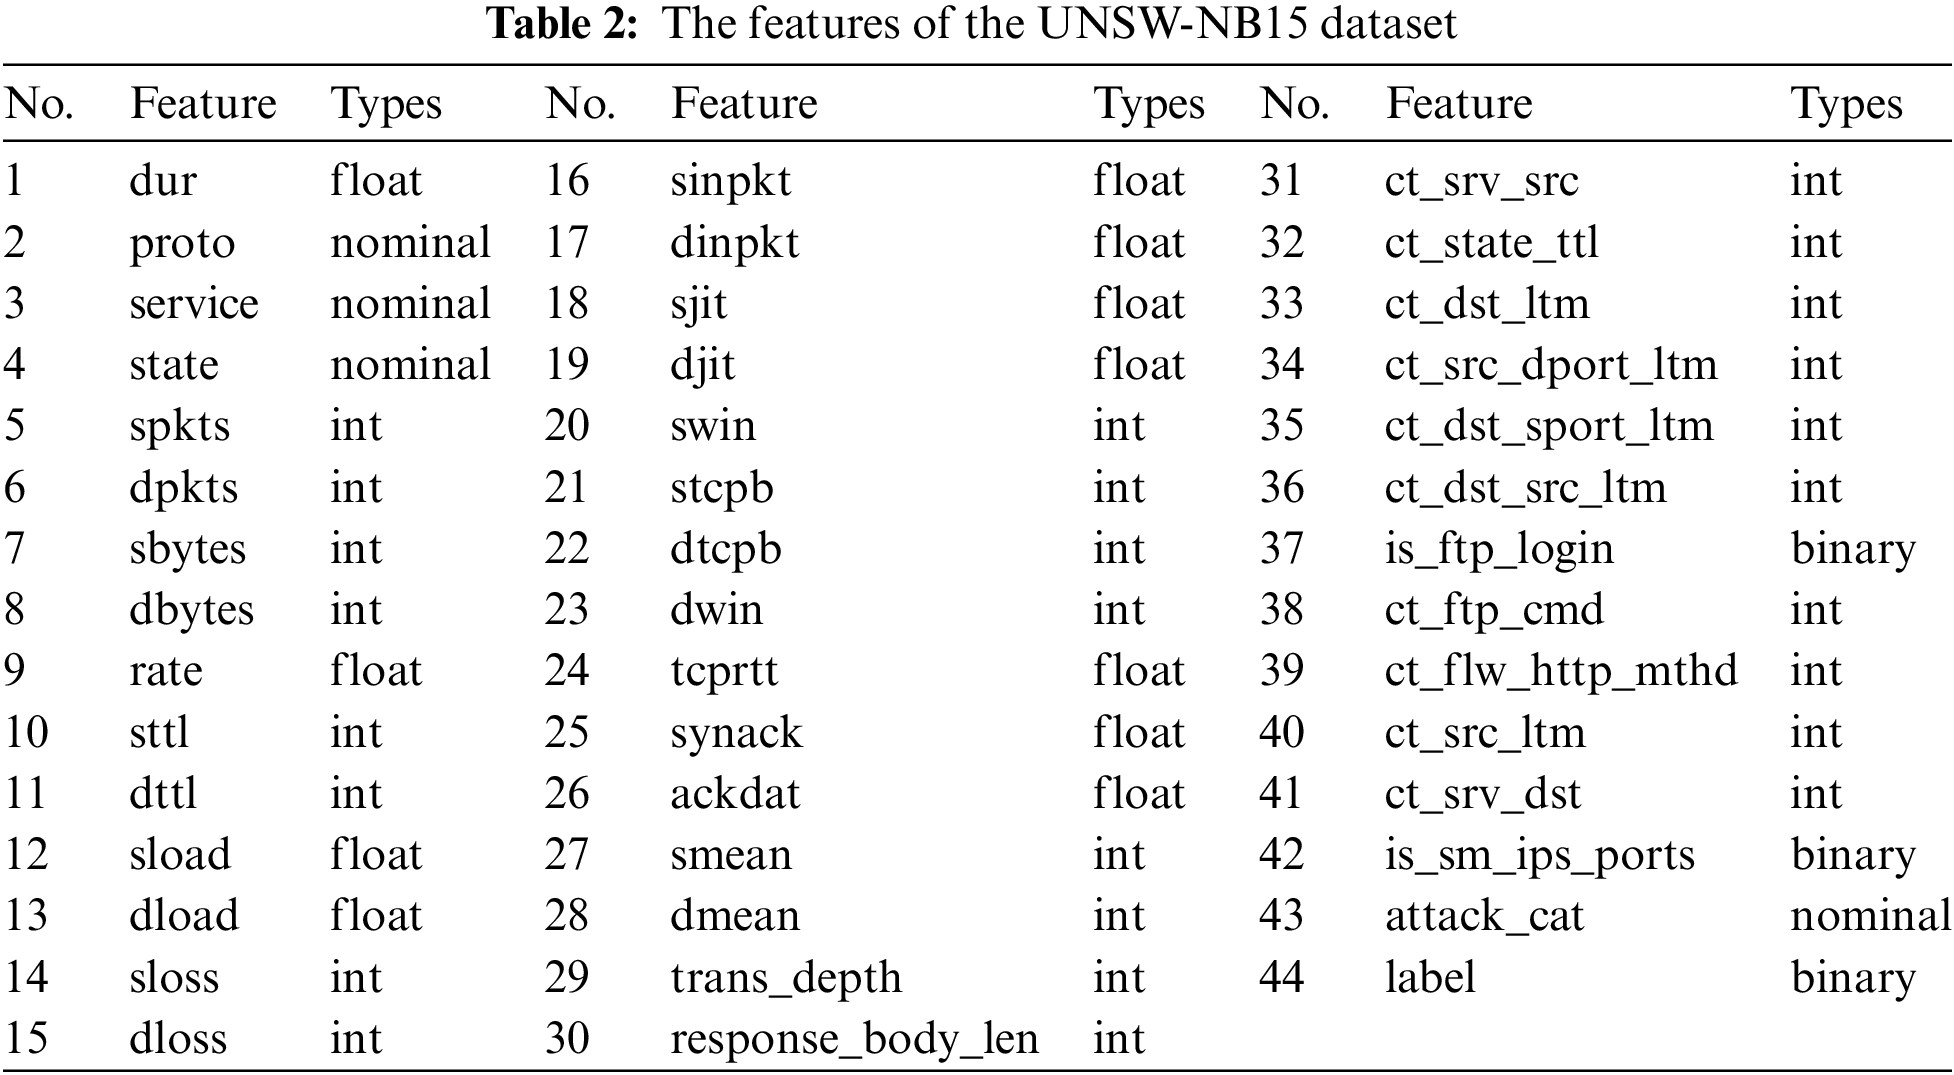
The UNSW-NB15 dataset was produced and generated by the Australian Center for Cyber Security (ACCS) Cybersecurity Research Team [49] in 2015 using the IXIA Perfect Storm tool, covering common cyber attacks and normal traffic. The dataset is collected in a real network environment and is widely used in network intrusion detection with high credibility. Its creation process is as follows: first, the TCPdump tool captures traffic data generated by artificially initiated transient attacks and real-world normal network activities. The captured traffic data is then processed using the Bro-IDS tool and algorithms to generate a CSV file containing 48 features. Furthermore, 44 features are extracted, and the training and test sets are divided. As shown in Table 2, UNSW-NB15 contains 42 traffic features, with 43 and 44 denoting the multiclassification and biclassification labels, respectively. Among the 42 features, ‘proto,’ ‘service,’ and ‘state’ belong to non-numeric features, and the remaining 39 are numeric. These features can also be categorized as Flow Features, Base Features, Content Features, Time Features, etc.
Like other datasets, UNSW-NB15 has been divided into a training set and a test set, which contain 175,341 and 82,332 flow data, respectively. The dataset includes nine attack categories: Generic, Exploits, Fuzzers, DoS, Reconnaissance, Analysis, Backdoors, Shellcode, Worms, and one normal category. We exhibit the matching pie charts in Fig. 2 to help visualize the data distribution of the UNSW-NB15 training set and test set.
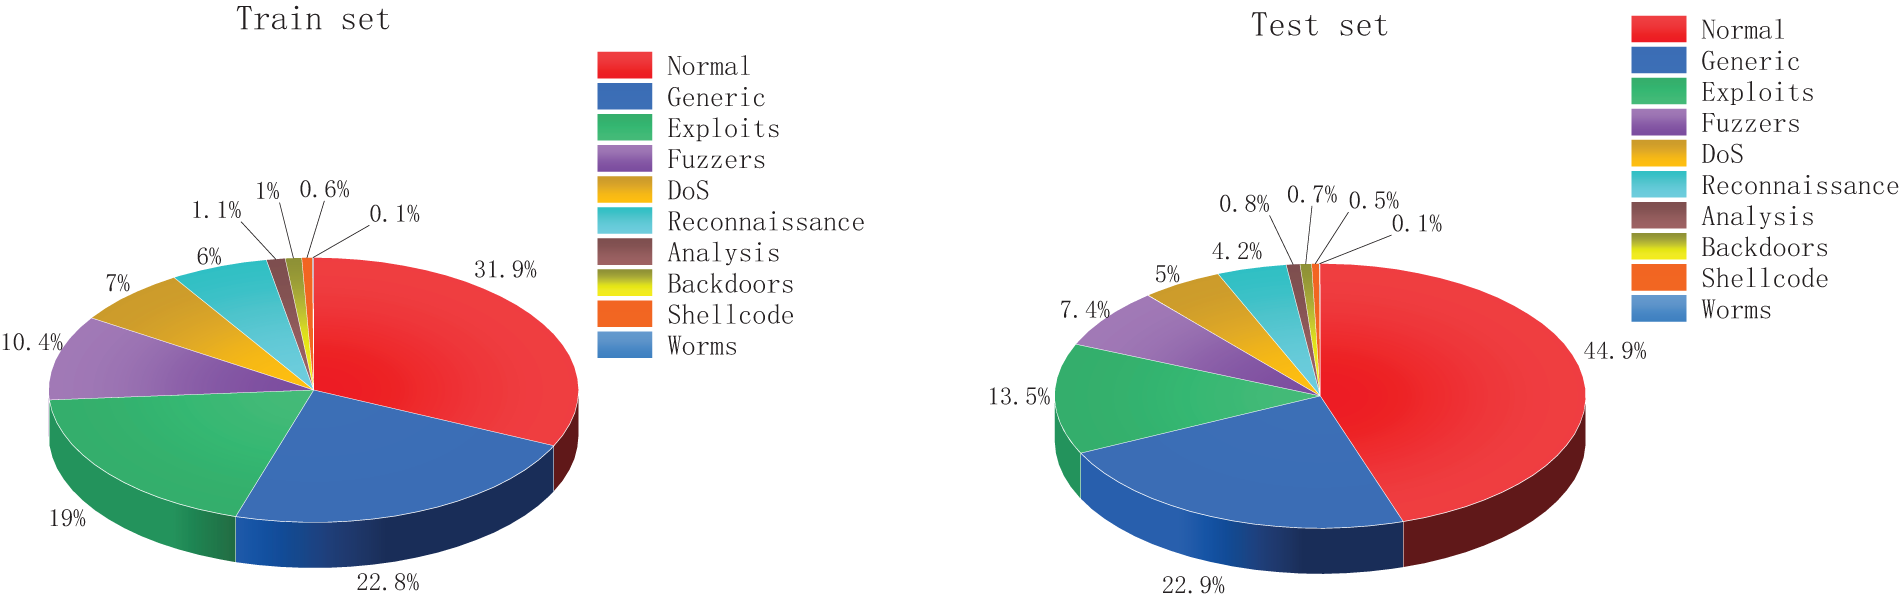
Figure 2: Distribution of UNSW-NB15 training and test sets
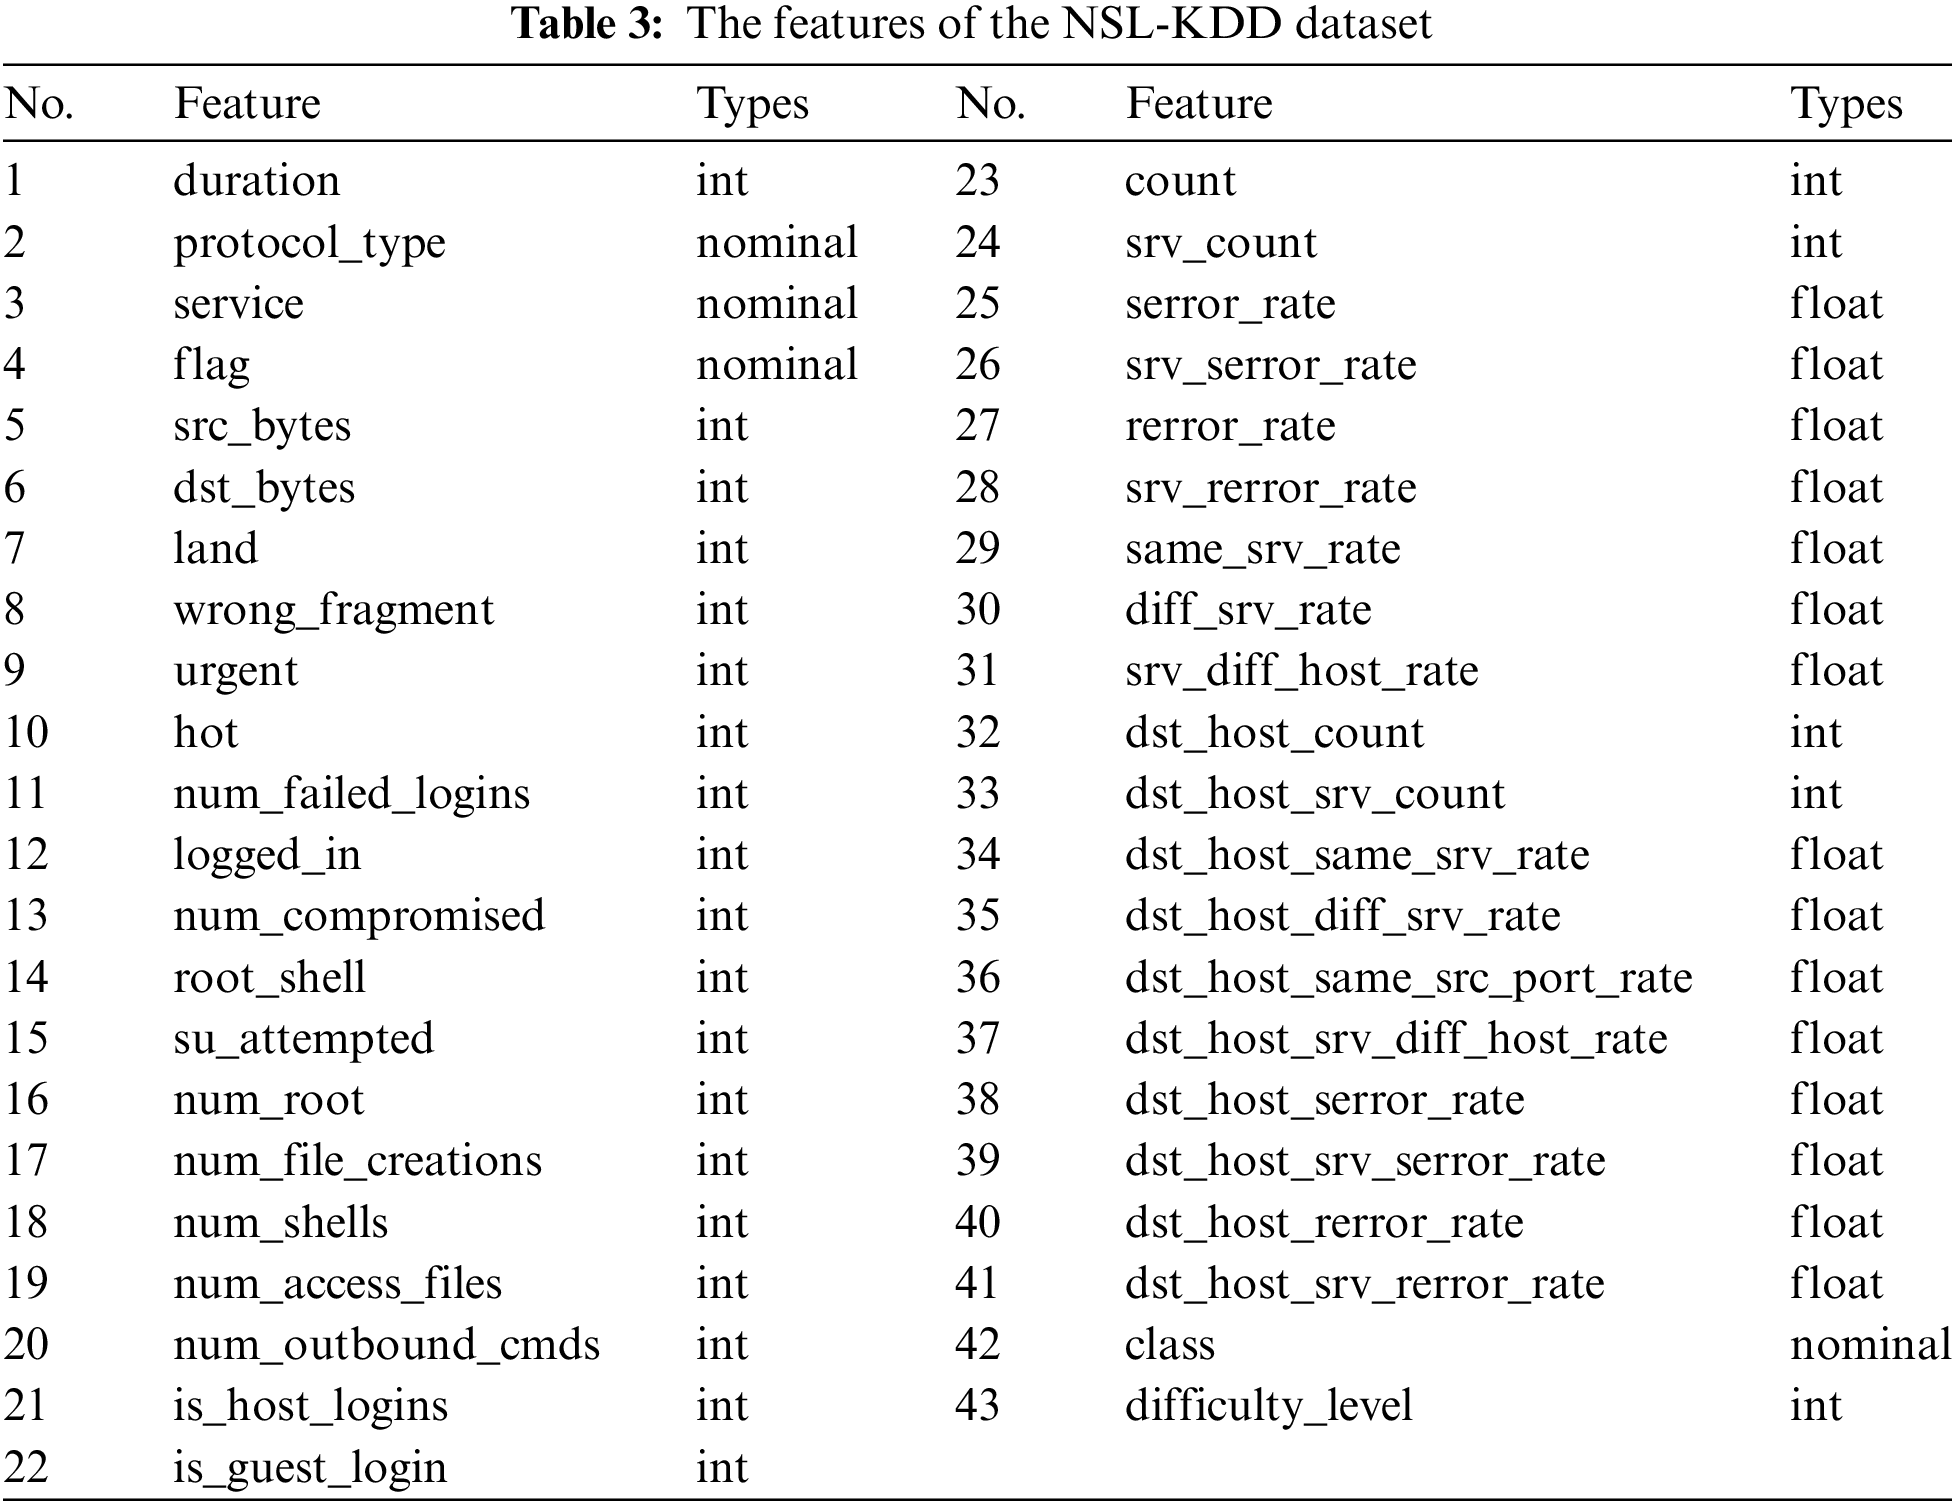
The NSL-KDD dataset is a publicly available intrusion detection dataset created by Tavallaee et al. [50] in 2009 by the National Science Laboratory, which belongs to the improved version of KDDCUP99 and is characterized by low redundancy and balanced data volume. This dataset is generated by simulating network traffic and contains normal traffic and various intrusion activities, so it is closer to the actual network environment. Meanwhile, NSL-KDD is one of the most widely used datasets in intrusion detection, which promotes the research and development of intrusion detection algorithms. As shown in Table 3, NSL-KDD contains 43 feature attributes; the class attribute numbered 42 is the subclasses corresponding to each traffic data, and we categorize all subclasses into ‘Normal,’ ‘Dos,’ ‘Probe,’ ‘U2R’, and ‘R2L’ to facilitate the implementation of multi-classification detection. ‘protocol_type,’ ‘service,’ and ‘flag’ attributes are tag type features. The attribute numbered 43 indicates the severity of the traffic input itself, which is not helpful for categorization. It does not play a role. Hence, it needs to be removed, and the remaining 38 attributes are numeric features.
Similarly, NSL-KDD is divided into training and test sets, where the training set contains 125,973 data, and the test set includes 22,544 data. As shown in Fig. 3, the distribution of the five categories of the NSL-KDD dataset on the training set and test set is visualized, and it can be found that the amount of data for ‘U2R’ and ‘R2L’ is relatively small, and there is an imbalance in the distribution of data.
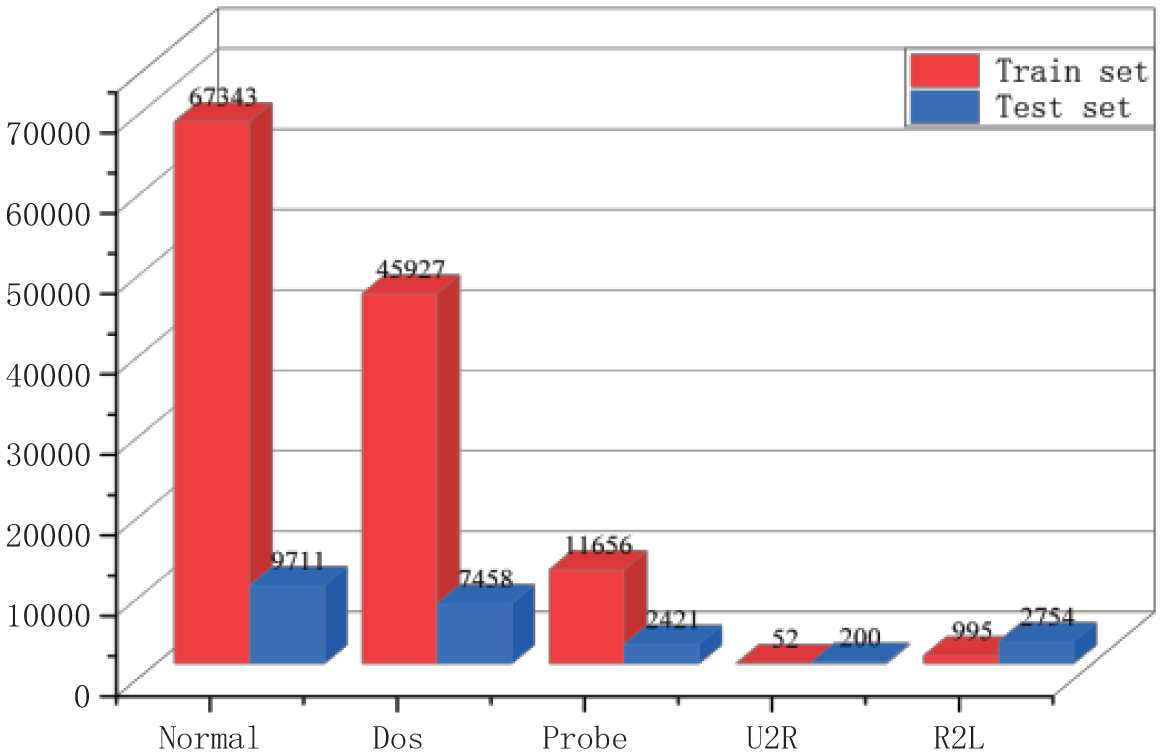
Figure 3: Distribution of NSL-KDD training and test sets
Neural networks require transforming non-numeric data into numeric data because they cannot handle non-numeric data. Currently, labelled encoding and one-hot encoding are popular solutions. In one-hot encoding, a non-numeric feature’s category variables are converted into binary vectors, with each category variable corresponding to a binary vector with one element of 1 and all other elements of 0. The number of category variables determines the dimension of the transformed feature. To put it briefly, the transformation involving one-hot encoding raises the energy needed to process the data and increases the dimensionality of the feature.
Thus, this paper applies the label encoding method for encoding conversion. It is based on the idea that every variable in a character category feature should have a distinct integer label. This way, the dimensions of the feature remain unchanged after encoding, and the category variable of a non-numeric feature is transformed into the corresponding numeric value. For instance, in the UNSW-NB15 dataset, the character-based attribute ‘state’ takes values containing ‘CON,’ ‘ECO,’ ‘FIN,’ ‘INT,’ ‘PAR,’ ‘REQ,’ ‘RST,’ ‘URN,’ and ‘no’ 9 types, based on the label encoding’s alphabetical order, encoded in the range of 0–8, the feature dimensions have not been expanded. The process of encoding the three character-based category labels in the NSL-KDD dataset is similar.
Variations in the features’ magnitudes during training will affect the model’s performance. For example, suppose a feature has a considerable value. In that case, the model may incorrectly assign a higher weight because it believes it to be crucial, whereas if a feature has a small value, it may mistakenly assign it a lower weight. After all, it believes it to be unimportant. Therefore, after label encoding, feature scaling needs to be introduced to ensure that all features in the dataset are at almost the same scale.
In this paper, 42 feature attributes of UNSW-NB15 and 41 feature attributes of NSL-KDD are linearly mapped to the range of [0, 1], respectively, based on the maximum-minimum normalized feature scaling, which results in a uniform range of values and a more homogeneous distribution among different features. After the feature values are scaled, the gradient amplification effect in the backpropagation process is reduced, and the model converges better. Meanwhile, when the feature values are scaled to a smaller range, the network weights can be updated faster, effectively improving the convergence speed of the model. The scaling law is shown in Eq. (1).
After label encoding and max-min normalization of one-dimensional traffic data, this paper uses a data padding-based image transformation method. That is, the original 42 dimensions are expanded to 49 dimensions by using 0 as the padding value for UNSW-NB15, and the original 41 dimensions are expanded to 49 dimensions by using 0 as the padding value for NSL-KDD, all while maintaining all feature information in the original data samples. The built two-dimensional neural network architecture is considered pervasive for intrusion detection datasets. Therefore, both datasets are expanded to 49 dimensions and then evolved into a two-dimensional matrix, so each traffic data is transformed into image data of 7 * 7 size. The principle of data padding is to use the pad built-in function in the numpy library to pad zero values on the end of the column dimension, hoping that the length of each one-dimensional array is 7. If the length of the current one-dimensional array is not 7, then we need to pad enough zeros to reach the length of 7. Next, the reshape function reshapes each training sample into a 7 * 7 2D image shape. After reshaping, the fill values are arranged in the image’s edge region. The filled zeros are then used as input for the convolution or pooling operation, allowing the convolution kernel or pooling window to cover the edge region of the image rather than simply ignoring the edge pixels. Thus, this method saves more spatial information and somewhat lessens the loss of edge information. The process of visualizing traffic data conversion into 2D image data is shown in Fig. 4. This paper converts one-dimensional traffic data into two-dimensional image data to fully utilize the benefits of convolutional neural networks in image feature extraction. This improves the accuracy of intrusion detection by learning critical feature information more precisely.
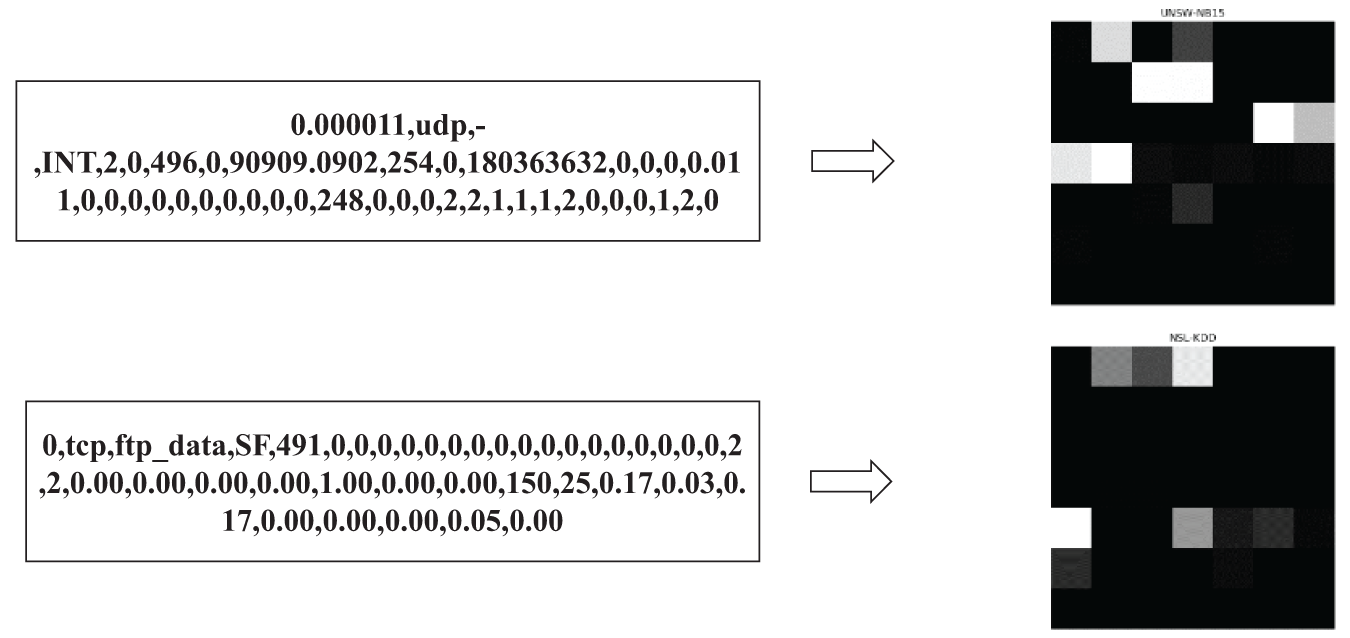
Figure 4: 2D image conversion for two datasets
3.3.1 Backbone Network Architecture
Fig. 5 shows the CNN-SE backbone network that is suggested in this paper. A neural network model is created by combining multiple modules. The model’s input is a 2D image that has undergone data preprocessing. The model is then trained iteratively to produce results for both binary and multiclassification detection.
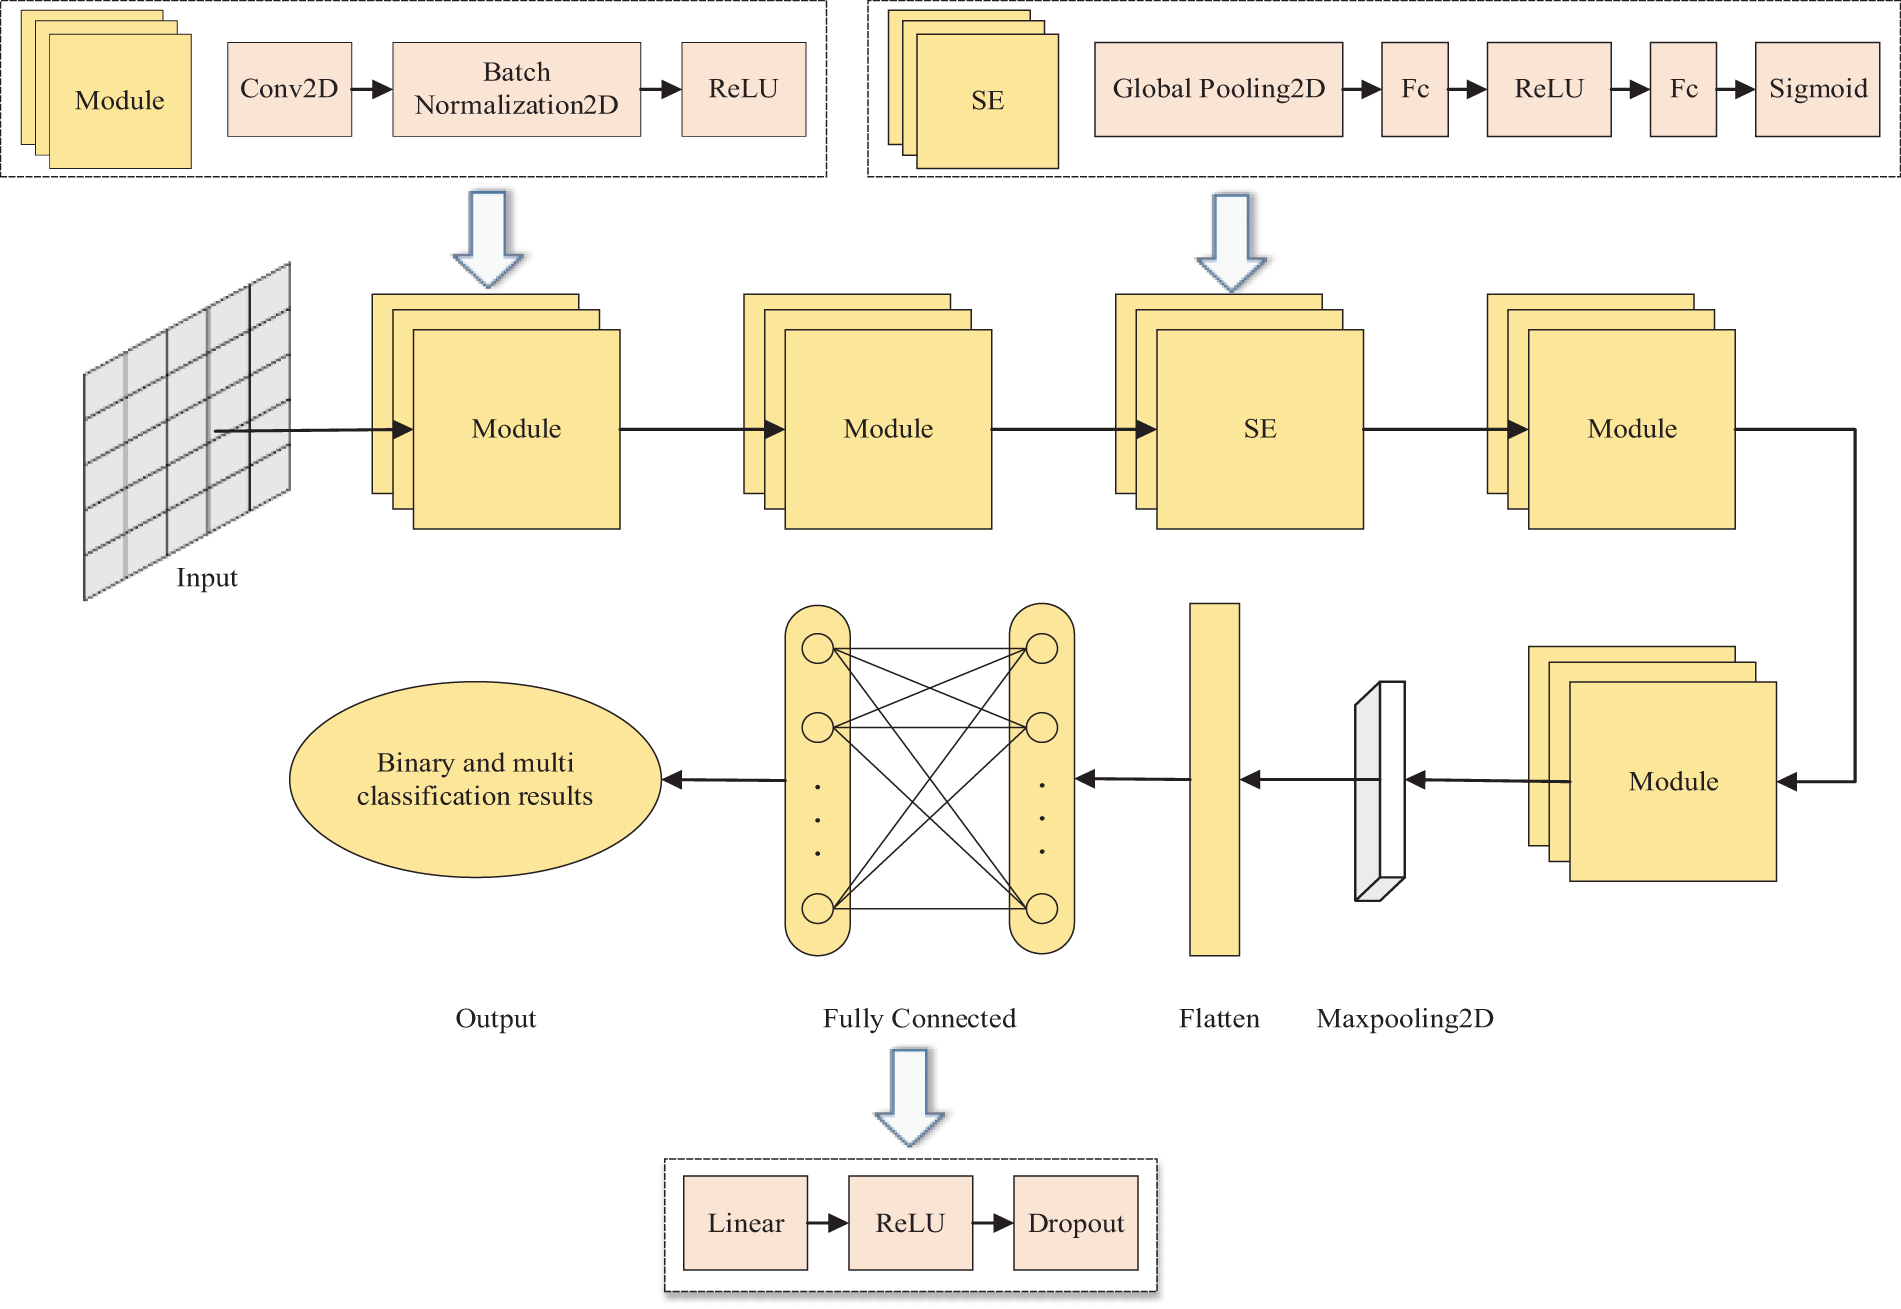
Figure 5: CNN-SE network architecture
The CNN-SE’s central module, the Module, has three layers: an activation layer, a batch normalization layer, and a 2D convolutional layer. To extract the global features of the data, it is helpful to gradually increase the number of filters in the 2D convolutional layer, which is a type of spatial feature extractor. Following convolution, the size of the resulting feature map is less than that of the input image, and the number of output feature maps is equal to the number of convolution kernels set. The purpose of the batch normalization layer is to decrease the sensitivity to hyperparameters, enhance the model’s capacity for generalization, and speed up the neural network’s training phase. For the neural network to better fit nonlinear functions, nonlinear factors are introduced by the activation function layer.
A channel attention mechanism called the Squeeze-and-Excitation (SE) module is introduced. Squeeze uses global average pooling to obtain the global information of each channel, Excitation introduces two fully connected layers to learn the inter-channel weights, and finally, the channel attention weights are multiplied with the original feature map to adjust the importance of each channel. The system consists of two two-dimensional global average pooling layers, two fully connected layers, and two distinct activation layers. The input image goes through two Module before entering the SE module, which causes the network to focus more on the high-priority feature channels, enhancing the model’s performance.
The maximum pooling layer is used to shrink the feature maps, which shrinks the number of features and, to some extent, the computational complexity of the model. For the feature maps in each channel to enter the fully connected layer, the flattened layer flattens them into a one-dimensional vector. The primary purpose of the dropout layer, which is added to the 2D image after the fully connected layer has passed through the activation layer, is to randomly remove some neurons from the fully connected layer during training to keep the model from overfitting.
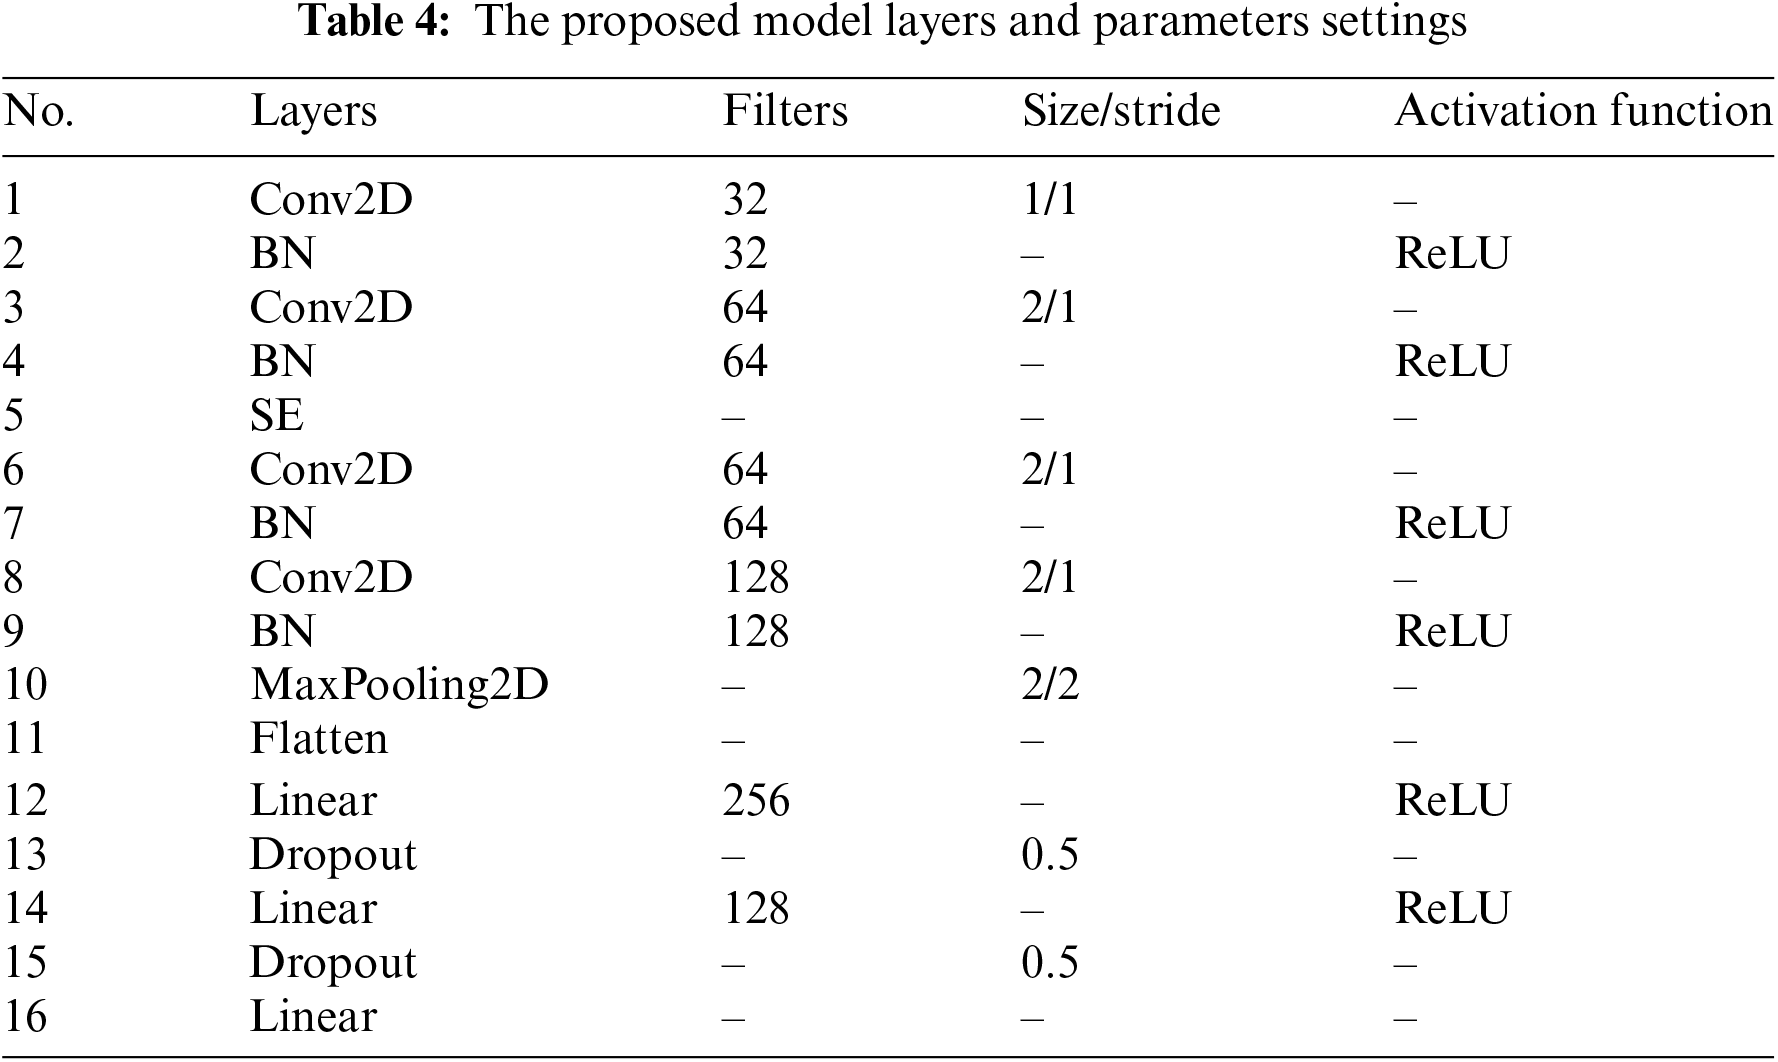
The specific settings of the internal hyperparameters of the CNN-SE model are shown in Table 4. The parameters are empirically formed based on many experiments and references. They are tested and adjusted through several iterations to ensure that the model achieves optimal performance. Among them, the number of neurons is set to gradually increase to enable the model to capture more complex global features and adapt to diversified feature extraction tasks; the selected step size and convolution kernel size are small, mainly due to the small size of the input image, if the value is too large, it will lead to a reduction in the number of feature mappings that the convolution kernel can produce, and the critical information will be lost. The number of channels of the input image is 1, and the size is 7 * 7. After entering the first Module, the number of channels is increased to 32, and the size of the image remains unchanged; then, after entering the second Module, the number of channels is increased to 64, and the size of the image is reduced to 6 * 6; after entering the SE module, the number of channels and the size of the image remain unchanged, but the importance of the channels will be changed; after entering the third Module. After entering the third Module, the number of channels is still 64, and the image size is changed to 5 * 5; after entering the fourth Module, the number of channels is increased to 128, and the image size is changed to 4 * 4. After the feature map enters the maximum pooling layer, the number of channels is 128, and the image size is reduced to 2 * 2; the Flatten layer flattens the 128 2 * 2 feature maps into a one-dimensional vector with vector dimensions 128 * 2 * 2. Finally, the data passes through the two fully connected layers before realizing the binary classification and multi-classification.
3.3.2 Adaptive Particle Swarm Optimization
The particle swarm optimization is a bionic intelligent optimization algorithm that simulates how members of a flock of birds cooperate and exchange information to find the best solution in the given space. As the number of iterations increases, each particle continuously converges toward the global optimal solution in the search space. The speed and position attributes of the PSO indicate the direction and speed of the particles, respectively.
Each particle carries out velocity update and position update according to Eqs. (2) and (3), respectively. Where:
To enhance the convergence speed and accuracy of PSO, we introduce adaptive decreasing nonlinear inertia weights. Simultaneously, the two acceleration factors undergo adaptive changes. This results in an enhanced particle swarm algorithm, known as the adaptive particle swarm algorithm, further enhanced as demonstrated by Eqs. (4)–(6).
where
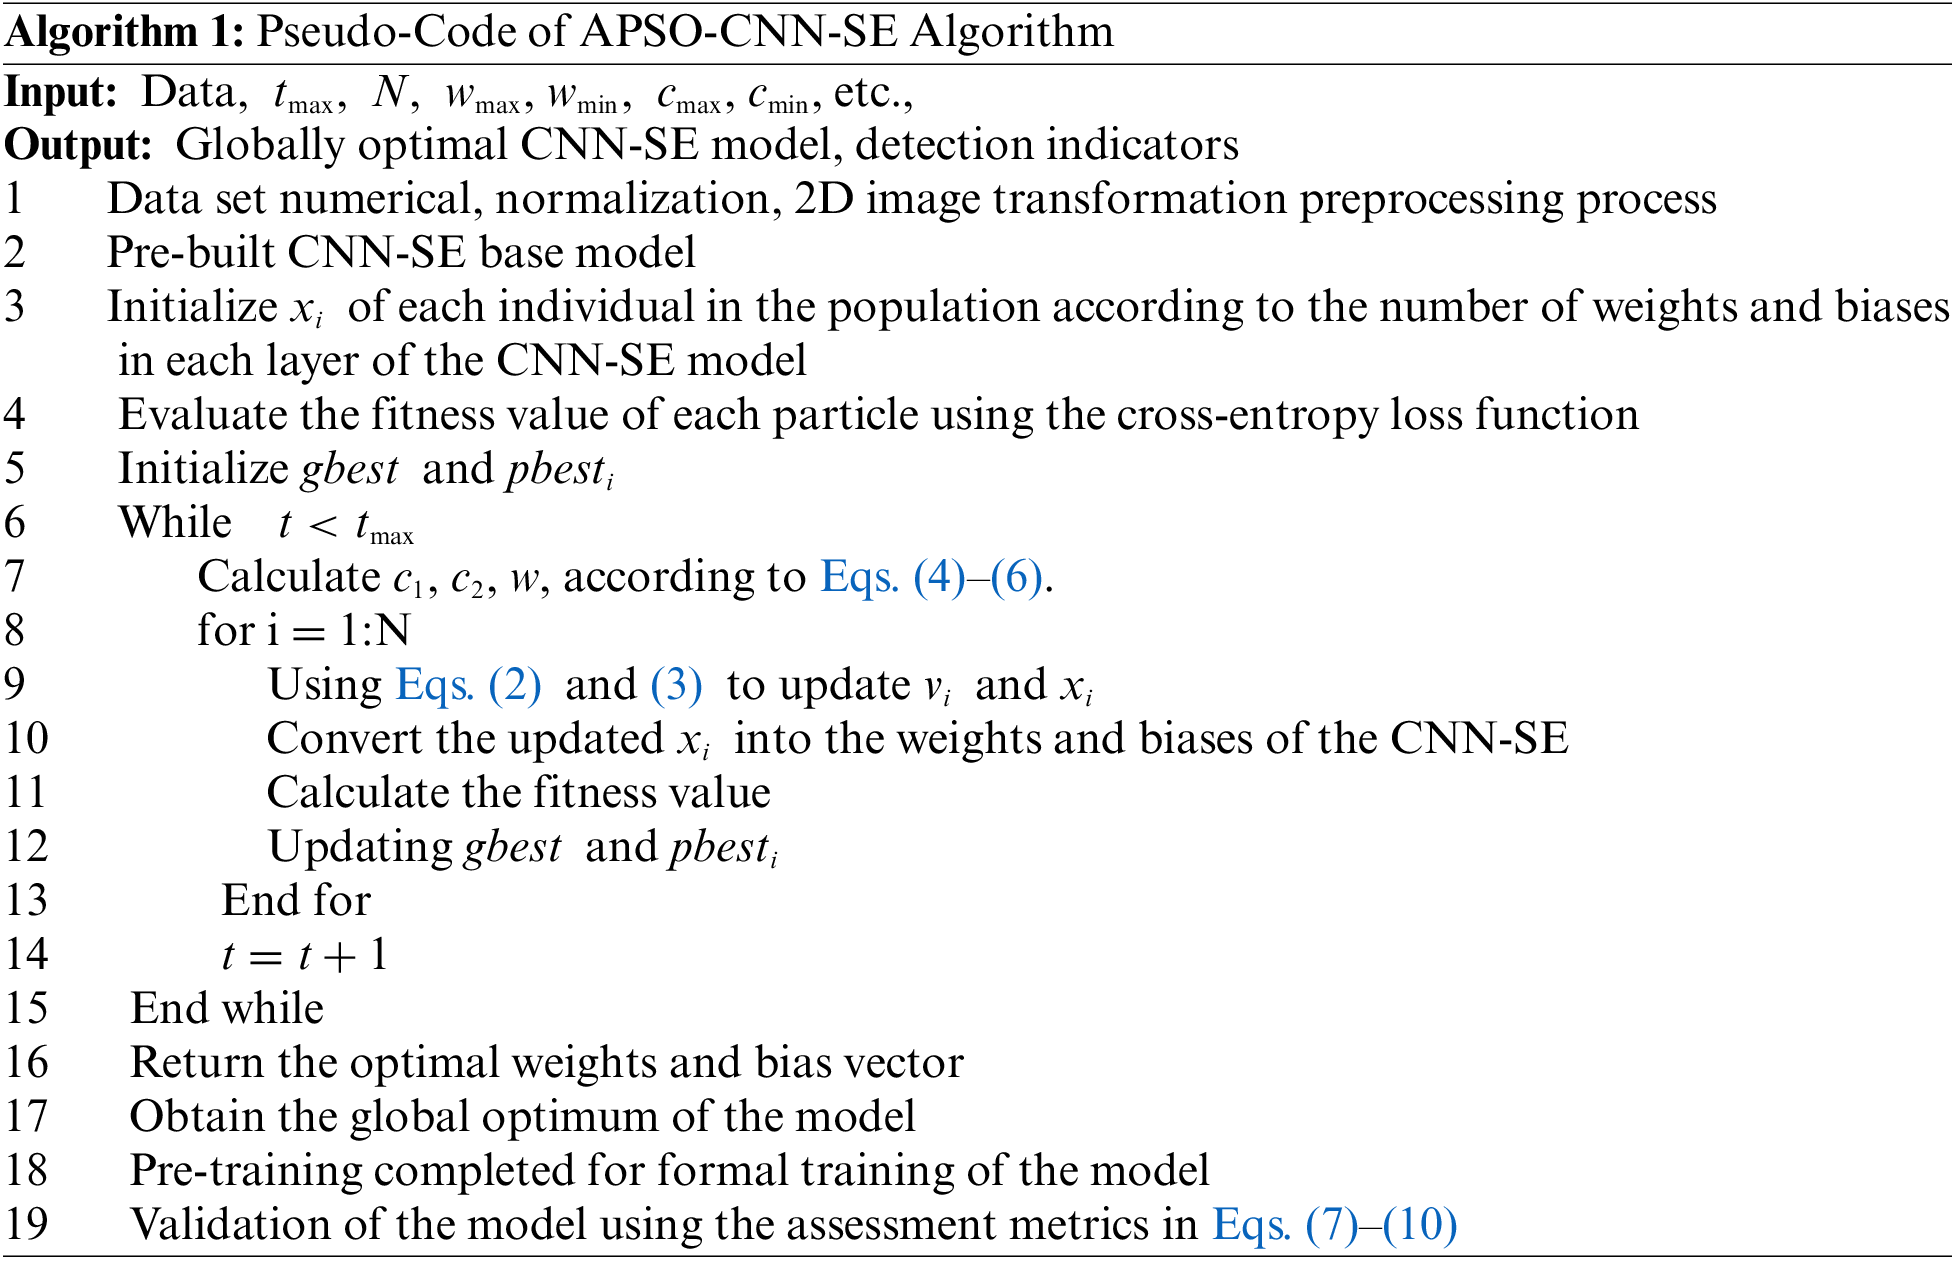
The CNN-SE model is prepared by pre-training its weights and biases using an adaptive particle swarm optimization. The basic idea is to go through every network level, set the cross-entropy loss function as the objective function, and initialize the population for each particle’s position and velocity based on the number of weights and bias parameters. The global and individual historical optimum is determined by comparing the estimated fitness values. Using Eqs. (2), (3), the velocity and position of each particle in APSO are updated constantly as the number of iterations grows in the hopes of attaining progressively decreasing loss values. To explain the suggested APSO-CNN-SE model better, Algorithm 1 displays the model’s pseudo-code.
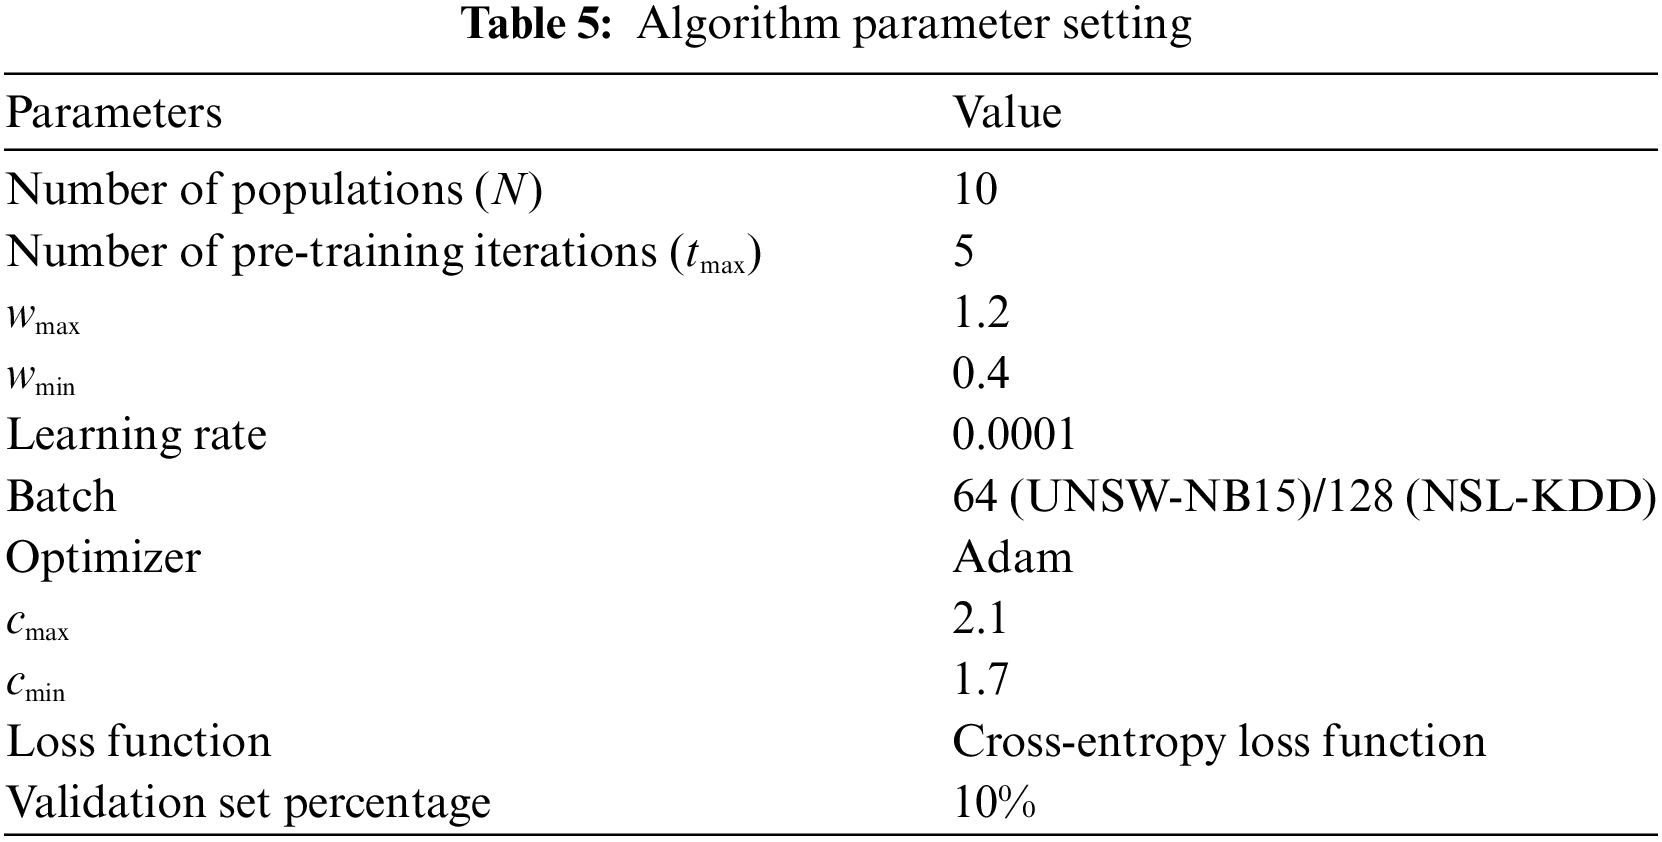
The process of updating the particle’s position and evaluating its adaptation ends when the number of iterations reaches the maximum value. At that point, the model’s pre-training is finished, and the globally optimal particles—the optimal weights and bias parameters—are acquired. For the UNSW-NB15 dataset, the model is trained 50 times more using the training and validation sets’ data, and the NSL-KDD is trained 30 times, taking into account time loss and computational complexity. Lastly, the test sets of the two data sets are used to realize binary classification and multi-classification detection, respectively, to assess the performance advantage of the proposed model and to count the relevant indexes statistically. Table 5 displays the APSO-CNN-SE model’s parameter settings following extensive testing and tuning.
4 Experiment and Result Analysis
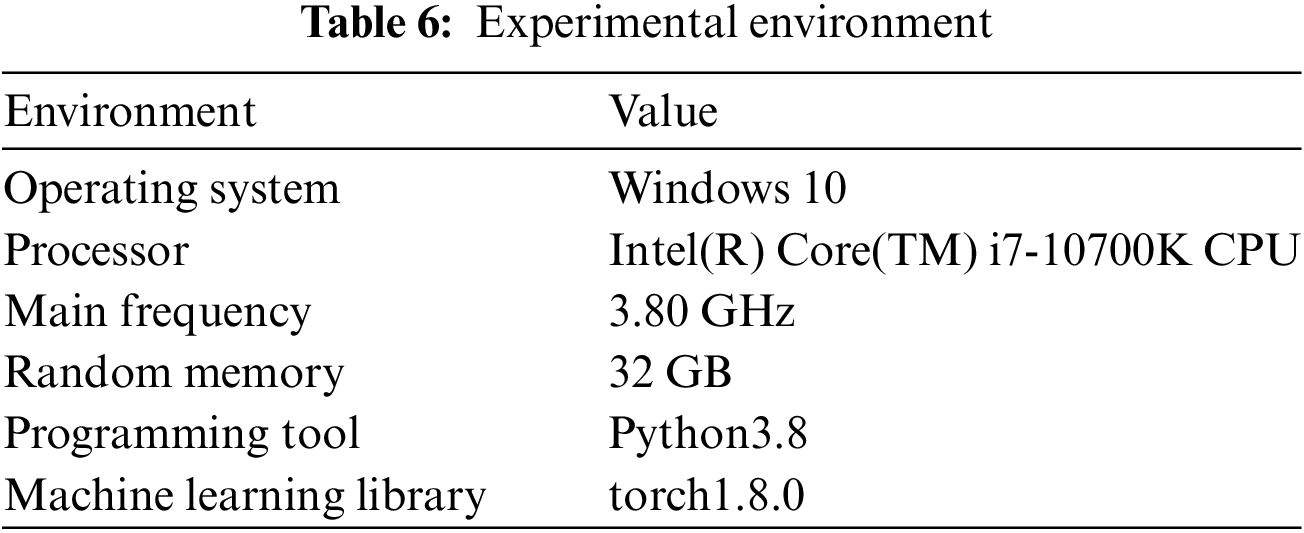
All operational tasks in this paper are realized using Python; the specific experimental environment is shown in Table 6.
The model’s performance in recognition and classification is assessed using a confusion matrix. The relationship between the actual values and the model’s prediction results on the test set is evident, as Table 7 illustrates.
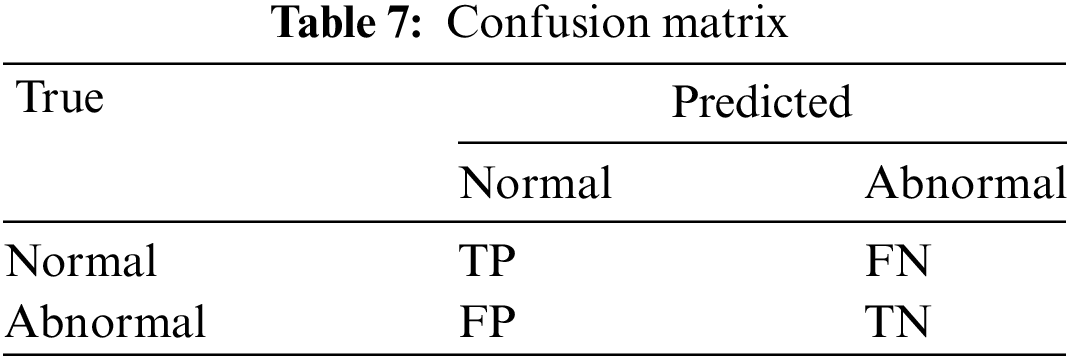
True positive (TP): the number of normal categories correctly predicted as normal by the model.
True negative (TN): the number of anomaly categories correctly predicted as anomalies by the model.
False positive (FP): the number of abnormal categories that the model incorrectly predicts as normal categories.
False negative (FN): the number of normal categories the model incorrectly predicts as abnormal.
This work employs four parametric metrics—accuracy, precision, recall, and F1-score—to assess the proposed model and determine its feasibility and efficacy, as demonstrated by Eqs. (7)–(10).
Accuracy: indicates the ratio of the number of samples correctly predicted by the model to the total number of samples.
Precision: indicates the ratio of the number of samples correctly predicted as positive cases by the model to the number of all samples predicted as positive cases.
Recall: indicates the ratio of the number of samples correctly predicted as positive cases by the model to the number of all samples that are actually positive cases.
F1-score: denotes the reconciled average of precision and recall, which is used to evaluate or measure the comprehensive performance of the model.
All experiments are run on the same device and the same Python environment. We utilize two datasets, UNSW-NB15 and NSL-KDD, to validate and evaluate the performance of APSO-CNN-SE. The experimental process is divided into four phases: the first phase is to perform binary classification experiments to test the effectiveness of the model in recognizing normal activities and anomalous attacks; the second phase is to perform multiclassification experiments to evaluate the model’s performance in detecting the normal categories and different attack categories; the third phase is a parameter sensitivity analysis aimed at validating some of the set parameters; and the fourth phase is to compare the model with the existing advanced models to demonstrate the effectiveness and feasibility of the model. Performance parameters such as accuracy, precision, recall, and F1-score are counted, compared, and analyzed with other models.
4.3.1 Stage 1: Binary Classification Experiment
To test whether the proposed intrusion detection model APSO-CNN-SE is practical and feasible, four metrics, namely Accuracy, Precision, Recall, and F1-score, are utilized for the metrics, respectively. Regarding network security, an intrusion detection system’s ability to accurately identify attacks while lowering the false alarm rate is essential. Based on the UNSW-NB15 and NSL-KDD datasets, we anticipate that the higher the four metrics, the better, and the lower the obtained loss value, the better.
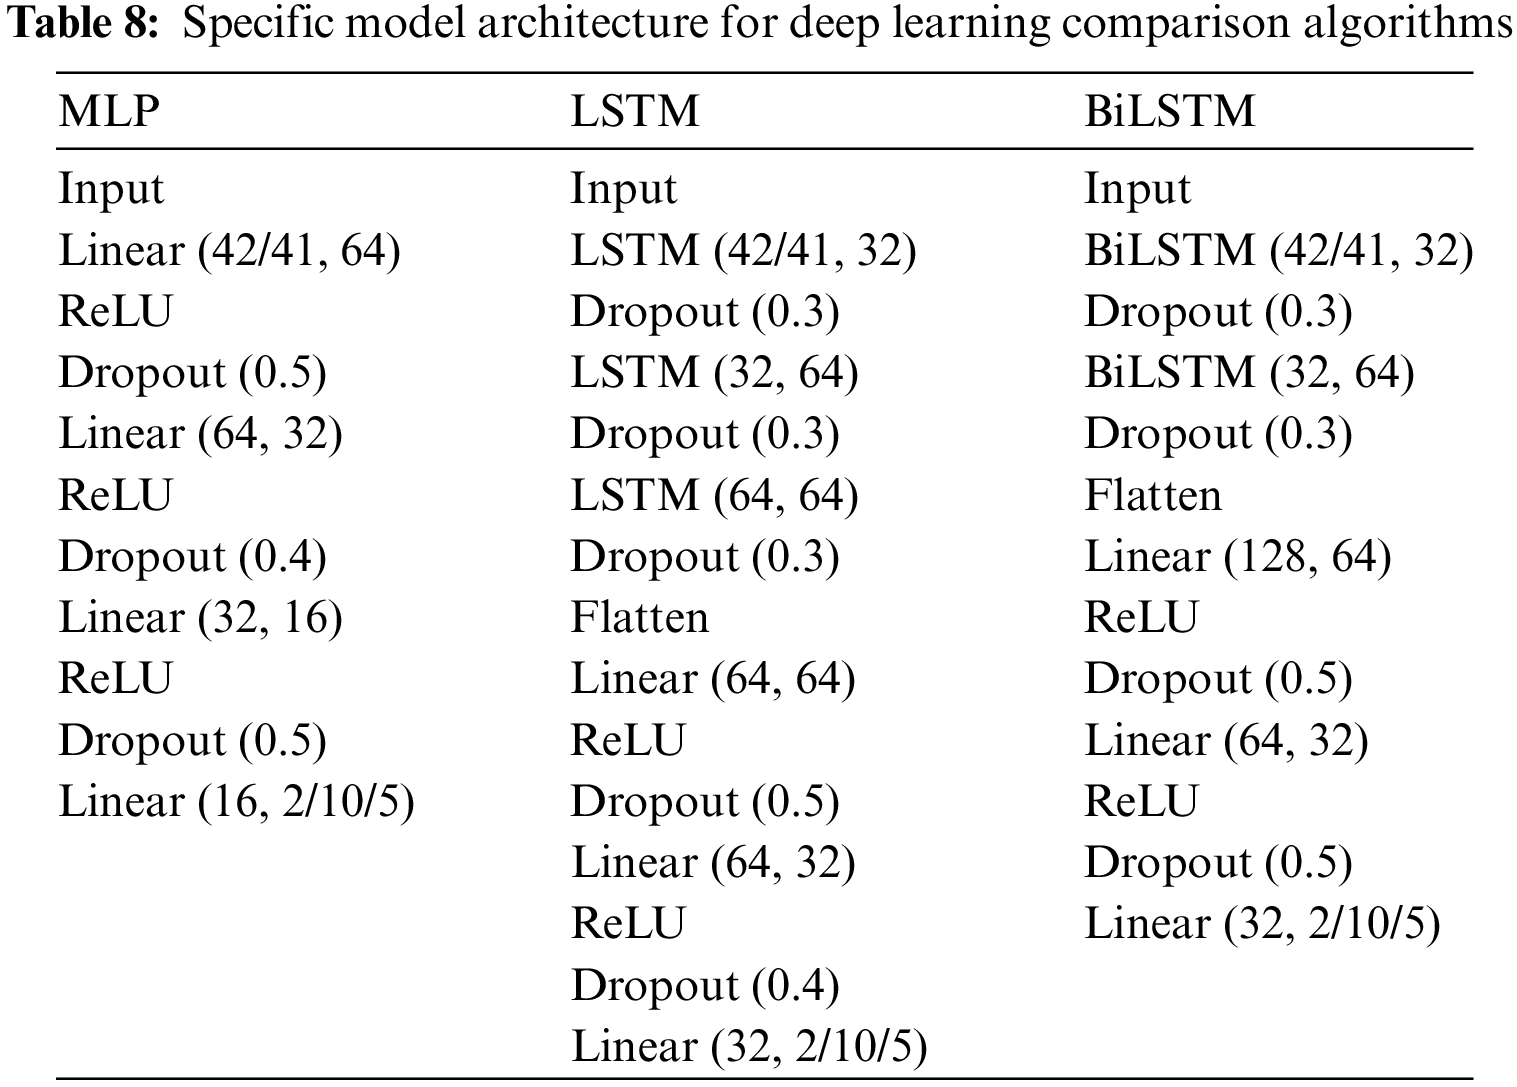
The study employs DT, KNN, LR, SVM, and AdaBoost as machine-learning comparison methods. The three deep learning comparison algorithms developed are MLP, LSTM, and BiLSTM, in that order, as indicated in Table 8. All three of these methods are built with lightweight hidden layers, and to keep the model from overfitting, a Dropout layer has been introduced to make some of the hidden layer neurons inactive. The ablation algorithms of APSO-CNN-SE are denoted by CNN, CNN-SE, and APSO-CNN, respectively. Based on the CNN model, CNN-SE and APSO-CNN signify adding the channel attention mechanism and adaptive particle swarm algorithm boards, respectively. Each model is trained on the training set and evaluated on the test set in UNSW-NB15 and NSL-KDD since they both have well-divided training and test sets.
We count the binary confusion matrixes of the UNSW-NB15 and NSL-KDD datasets in the APSO-CNN-SE model, as shown in Fig. 6. The heat map’s colour depth allows us to assess the model’s effectiveness in classification and recognition; the darker the colour, the more data is counted under the corresponding conditions. The UNSW-NB15 dataset can accurately identify 44,469 out of 45,332 abnormal flows, which indicates that the model is more sensitive to identifying abnormal flows and has a better TN value. On the NSL-KDD dataset, the model correctly identifies 9241 out of 9711 normal flows with better identification performance, while the classification performance for abnormal flows needs to be improved.
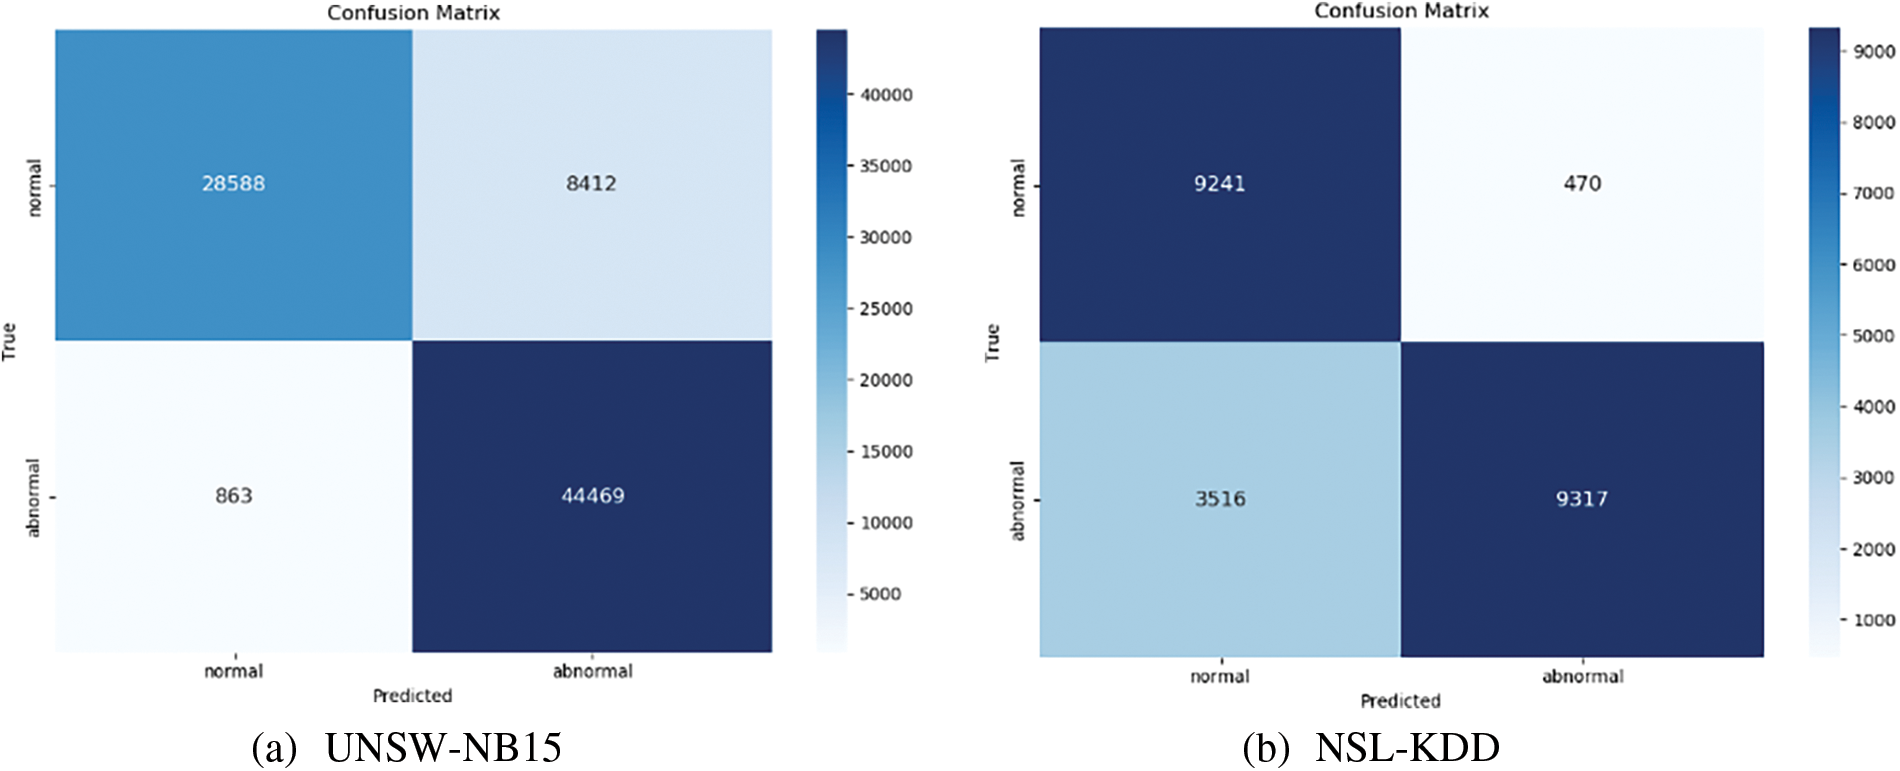
Figure 6: Confusion matrix of the binary classification model. (a) UNSW-NB15; (b) NSL-KDD
In this paper, the cross-entropy loss function is used to calculate the loss value between the actual and predicted values and to optimize the classification ability of the model by minimizing the loss function. The test loss values obtained by seven deep learning algorithms on two datasets are shown in Fig. 7, with the expectation that the smaller the loss value, the better. The smallest loss value tested on APSO-CNN-SE for the UNSW-NB15 dataset is approximately 0.24. This indicates that the model fits the training data better, with a slight deviation from the actual value and reasonably good classification ability. Comparing the NSL-KDD dataset to the CNN, CNN-SE, and APSO-CNN ablation models—which fit better—it ranks fourth in terms of loss value among the several comparative algorithms, with a loss value of roughly 1.2.
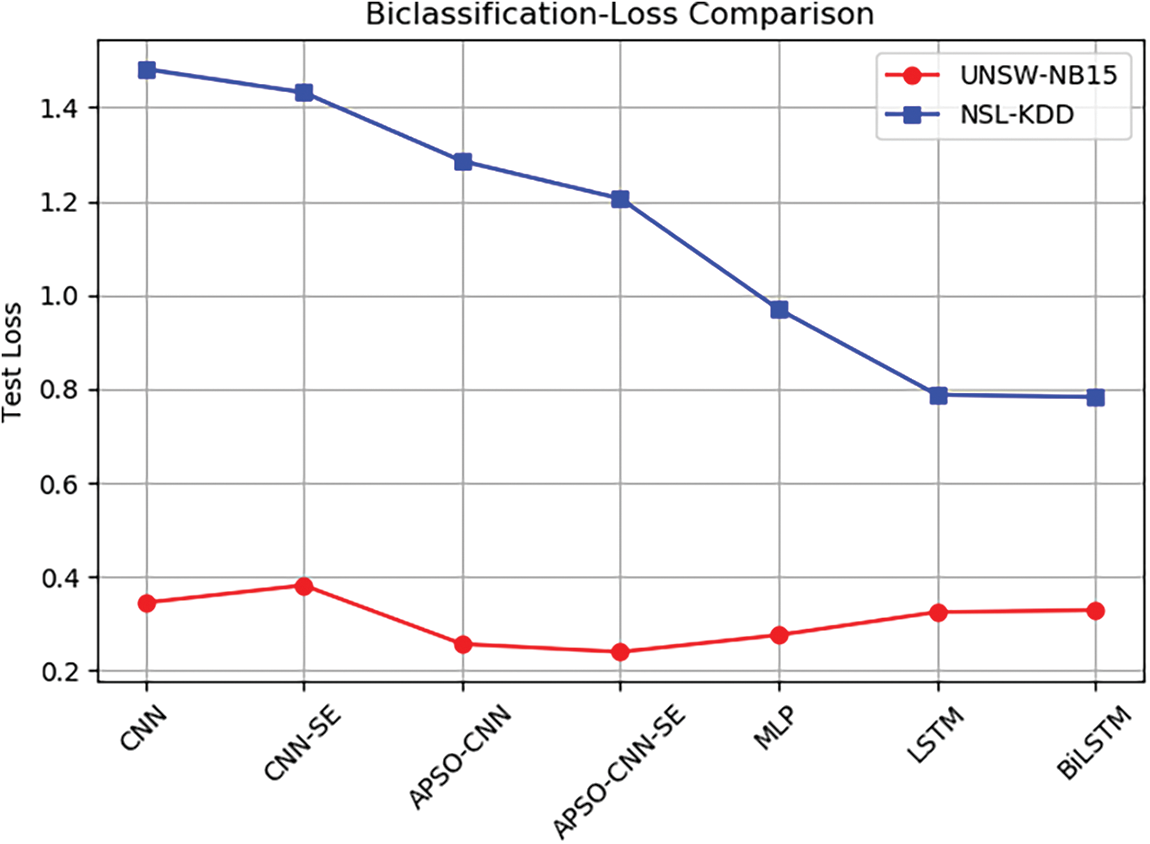
Figure 7: Test loss of the binary classification model
Table 9 displays the statistical results of the binary classification performance evaluation using deep learning and machine learning models for network intrusion detection. With 86.43% accuracy, 87.26% precision, 86.34% recall, and 86.10% F1-score for UNSW-NB15, decision trees have the highest classification impact out of the five machine learning algorithms; nonetheless, these results are all less than those of APSO-CNN-SE. As the hidden layers in the setup have fewer neurons than the total number of neurons, the created MLP, LSTM, and BiLSTM models cannot learn the essential features of the traffic data adequately. Therefore, compared to the proposed model for binary classification detection, there is still a numerical difference in the accuracy produced by the three, ranging from 3.96% to 6.54%. Compared to the CNN base model, the accuracy can be increased by 0.92% and 1.38%, respectively, with the independent addition of the APSO algorithm and the SE module. According to statistics, APSO-CNN-SE’s classification accuracy, precision, recall, and F1-score are 88.73%, 89.92%, 88.73%, and 88.53%, respectively. The model outperforms the list of other compared algorithms in all four measures. Meanwhile, this paper also counts the total time required for training and testing the four models, CNN, CNN-SE, APSO-CNN, and APSO-CNN-SE, which are 1567, 1652, 1560, and 1631 s, respectively. It can be learned that the model can obtain a better detection performance by spending only about 64 s more time based on CNN.
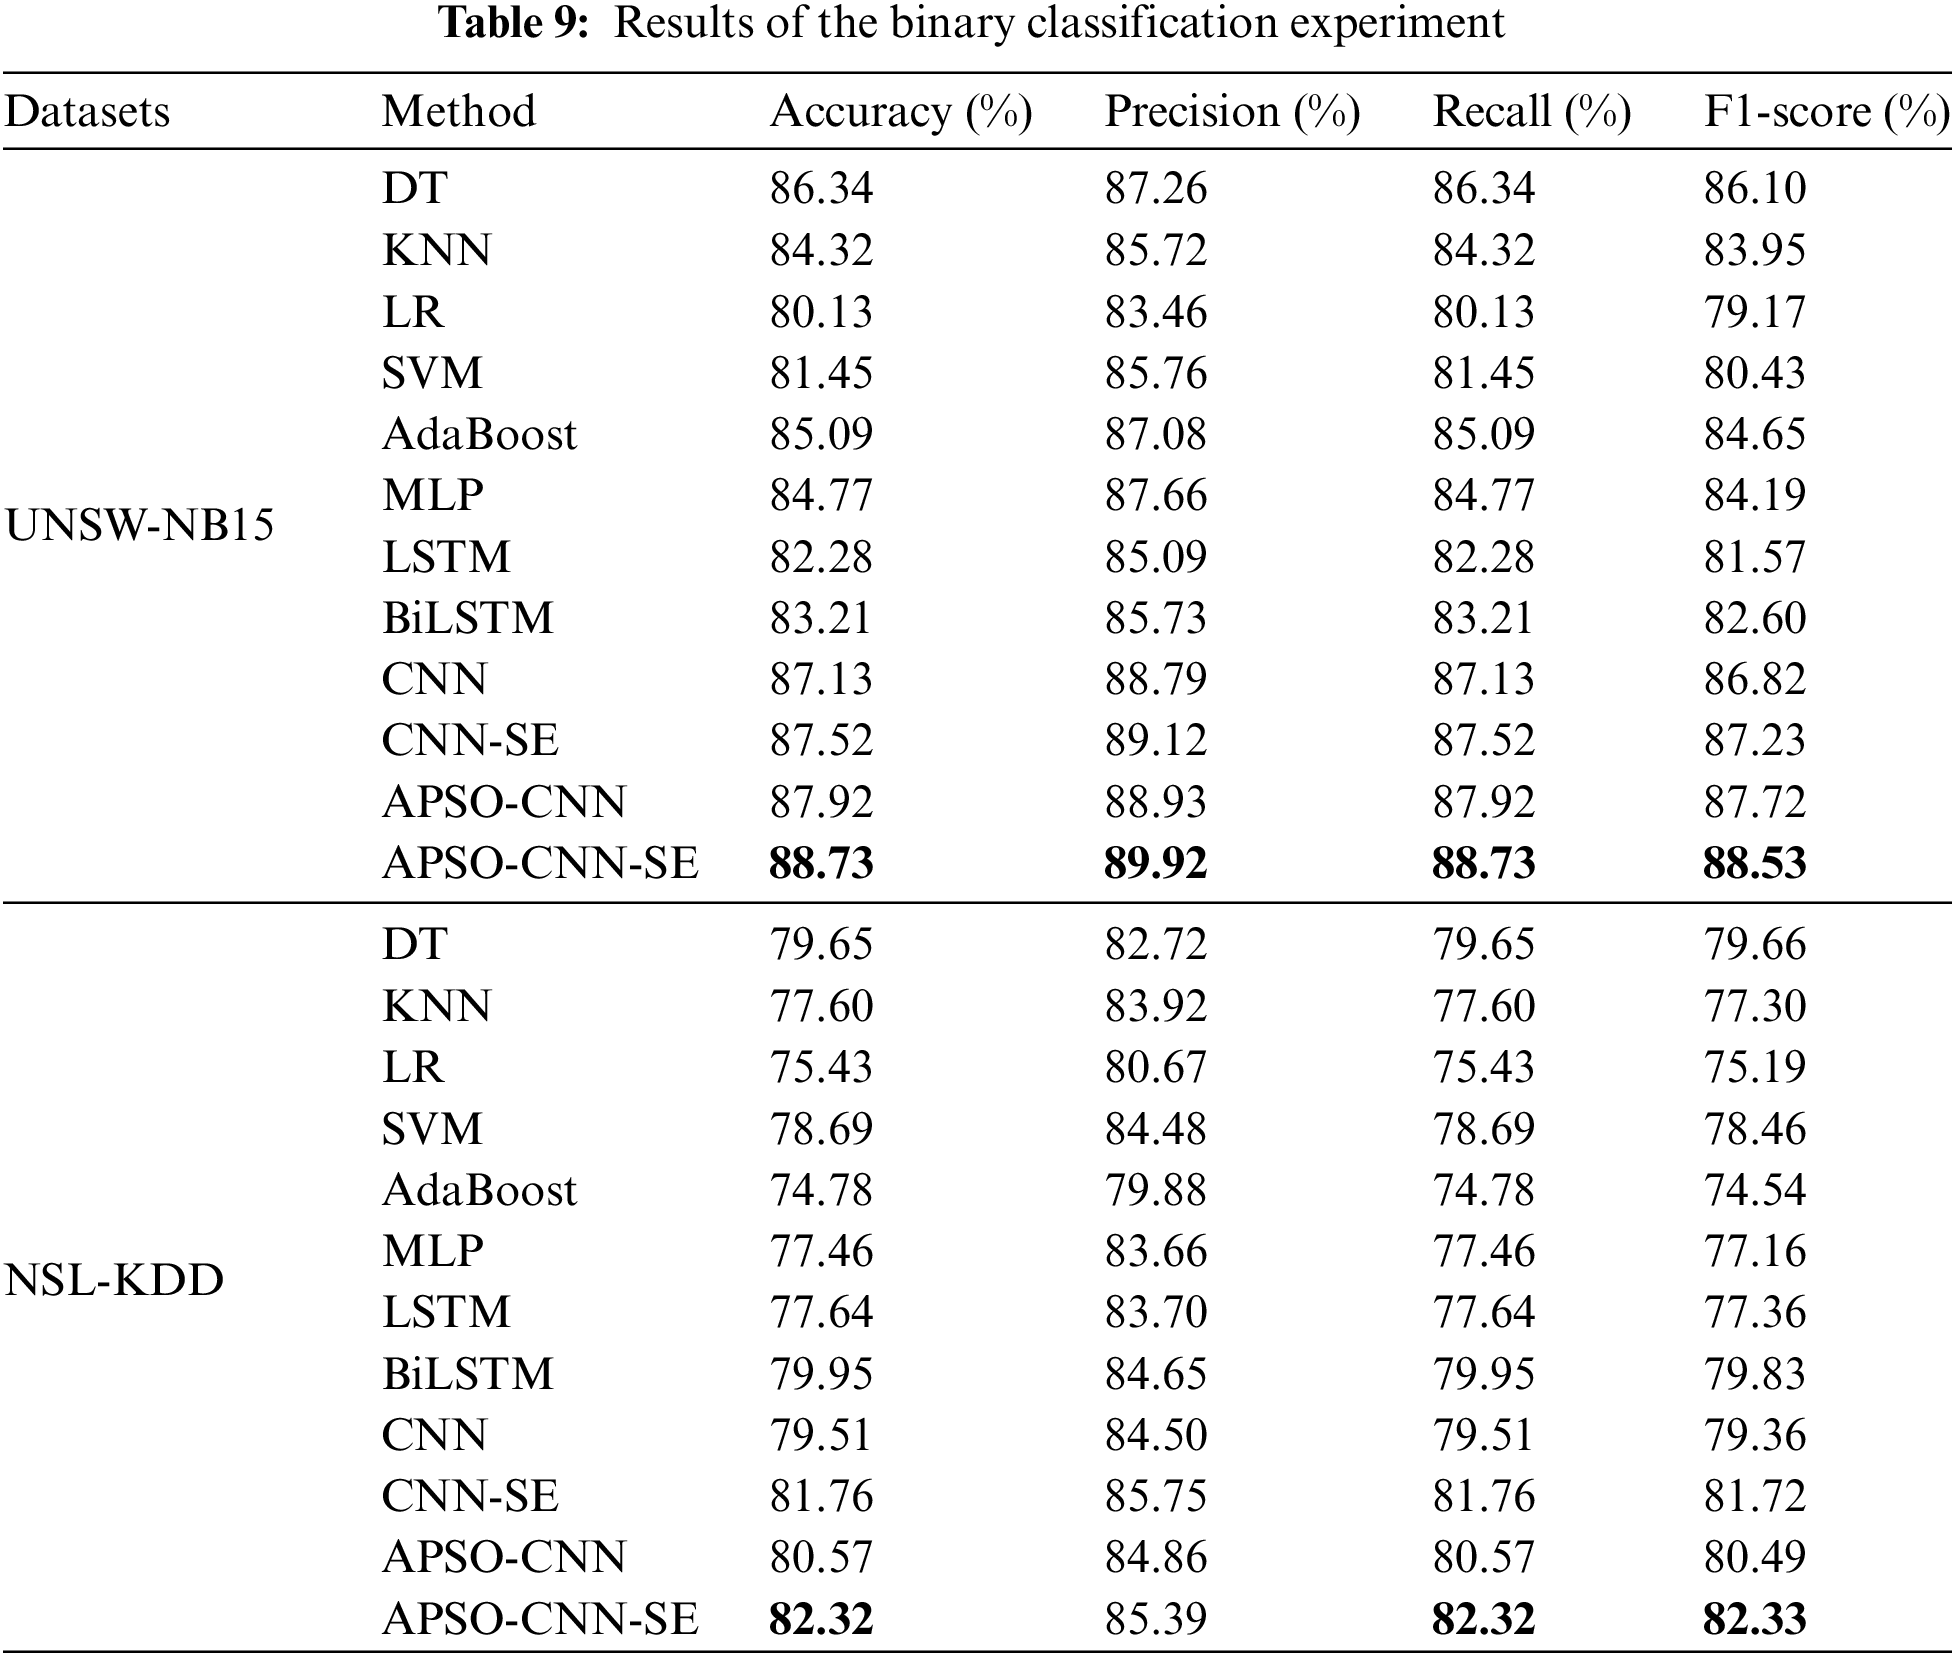
For NSL-KDD, although DT slightly outperforms other machine learning algorithms with an accuracy of 79.65% and an F1-score of 79.66%, its competitiveness is not strong compared to the APSO-CNN-SE model. BiLSTM obtains a higher detection rate on the deep learning model than MLP and LSTM, but there is still a gap of 2.37% compared to the proposed model. Except for the accuracy, which is slightly lower than CNN-SE, compared to CNN, CNN-SE, and APSO-CNN, the accuracy rate of this model is improved by 3.53%, 0.68%, and 2.17%, respectively. The total time required to count the four models is 990, 701, 831, and 814 s, respectively, indicating that the overall time loss is low while APSO-CNN-SE obtains optimization. In summary, in binary classification, APSO-CNN-SE has better detection performance and consumes less time cost than other compared algorithms. Figs. 8 and 9 are visualizations of the results of the binary classification experiments on the two datasets.
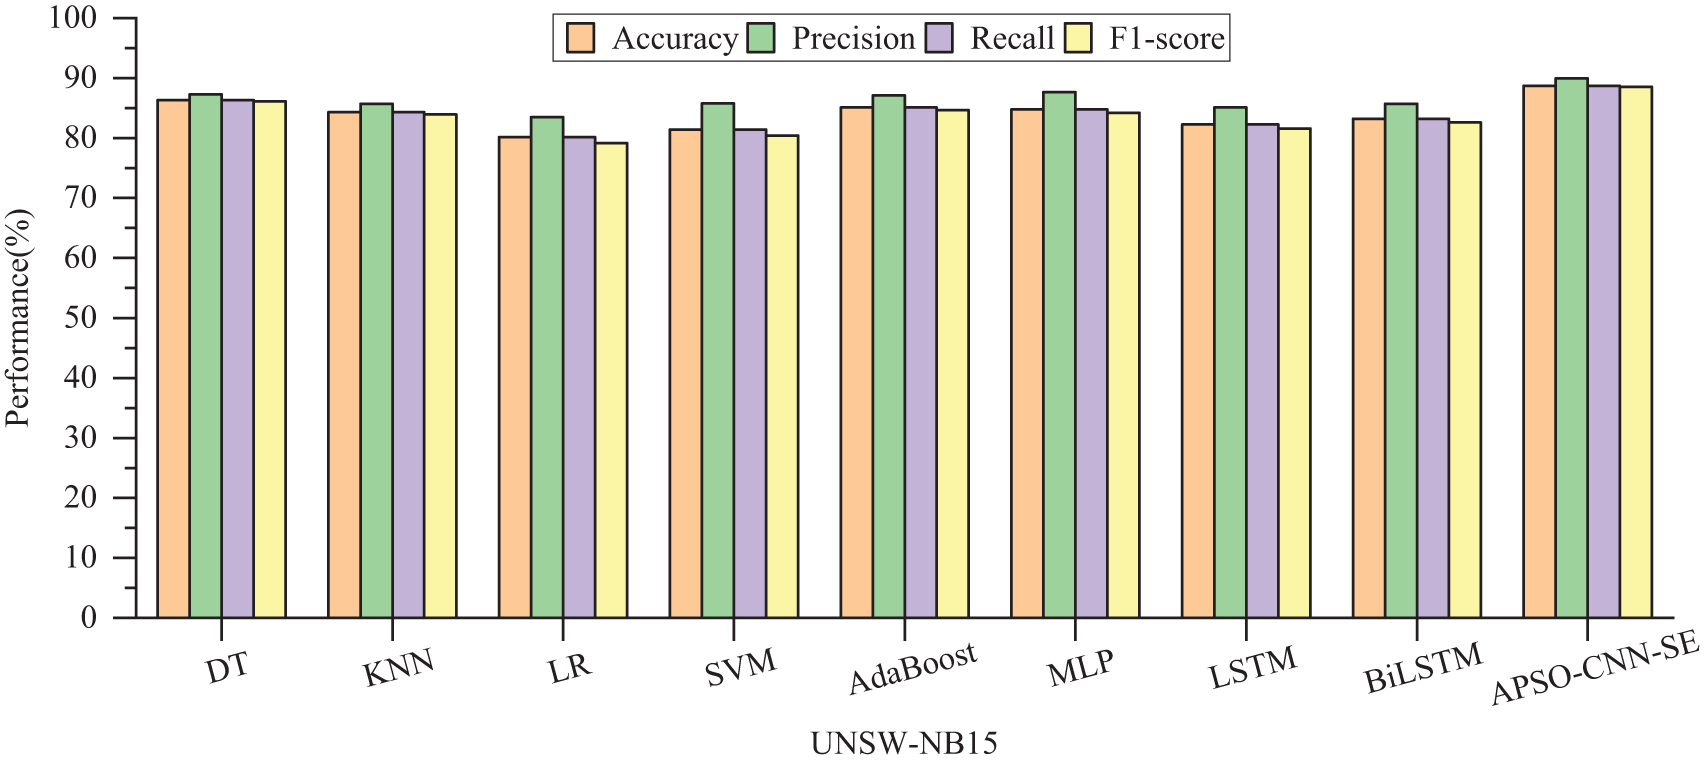
Figure 8: Comparison of binary classification performance of different models on UNSW-NB15
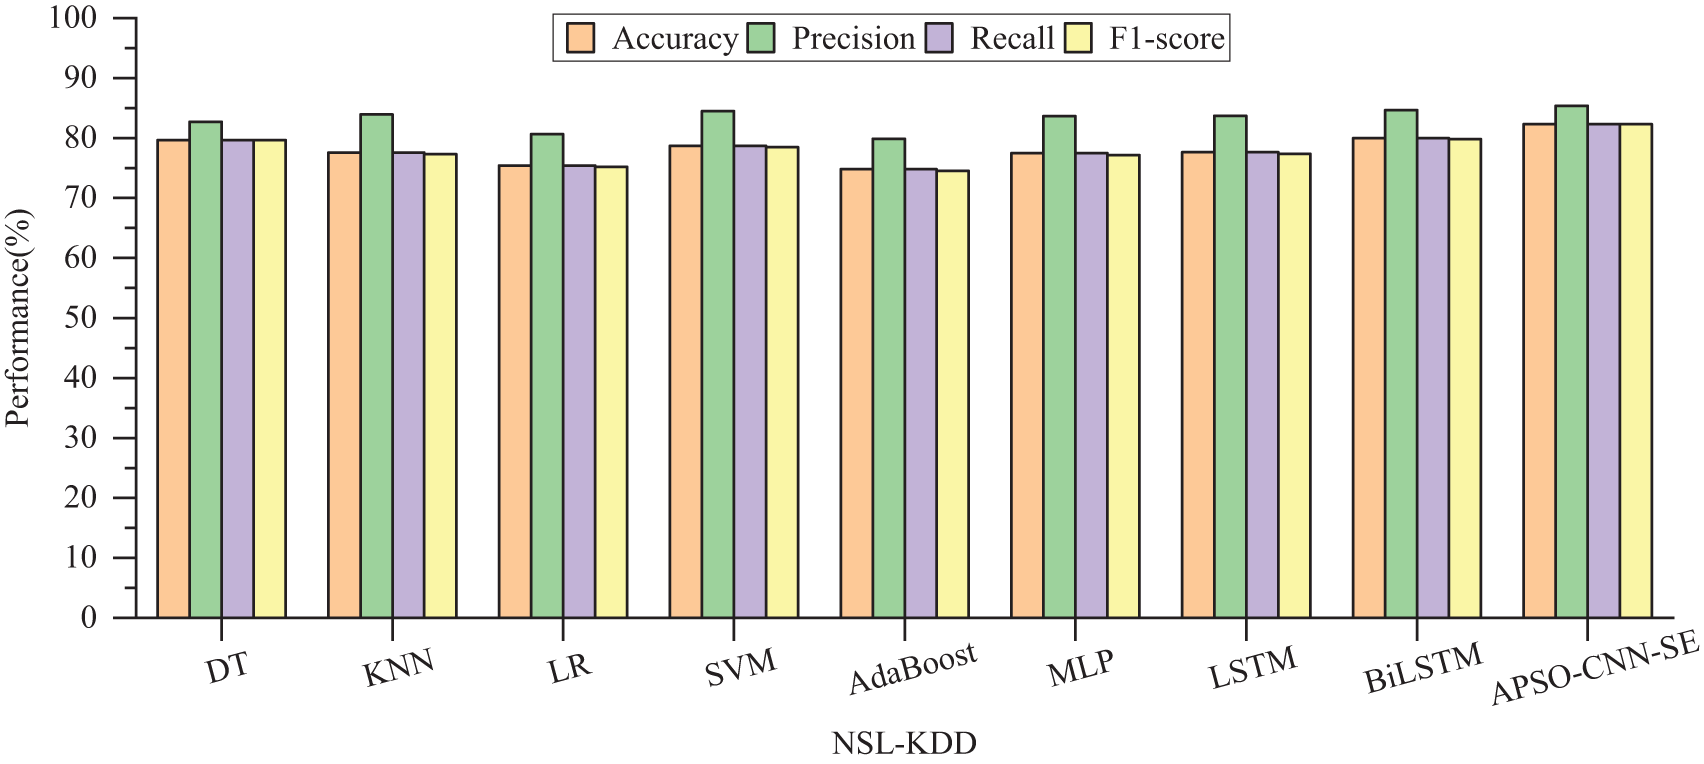
Figure 9: Comparison of binary classification performance of different models on NSL-KDD
4.3.2 Stage 2: Multi-Classification Experiment
The plotted confusion matrix for multiclassification detection is shown in Fig. 10; for UNSW-NB15, 0–9 denote ‘ Analysis,’ ‘Backdoor,’ ‘DoS, ‘‘Exploits,’ ‘Fuzzers,’ ‘Generic,’ ‘ Normal,’ ‘Reconnaissance,’ ‘Shellcode,’ ‘Worms.’ For NSL-KDD, 0–4 denote ‘DoS,’ ‘Normal,’ ‘Probe,’ ‘R2L ‘, and ‘U2R’.
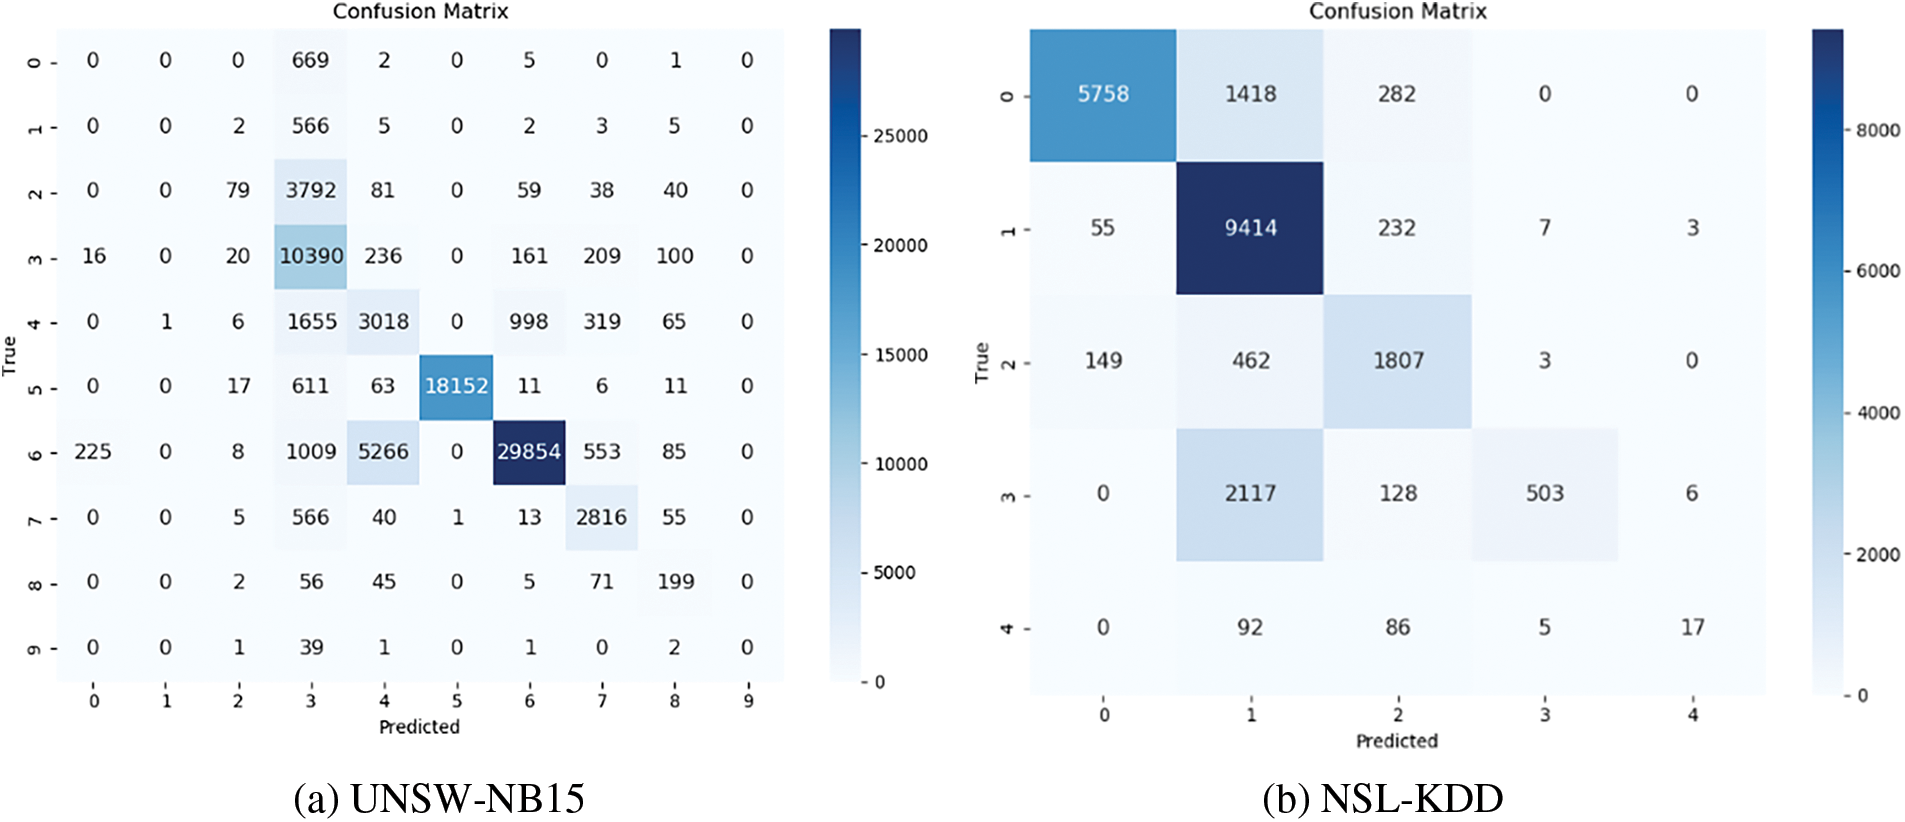
Figure 10: Confusion matrix of the multi-classification model. (a) UNSW-NB15; (b) NSL-KDD
Fig. 11 displays the test loss values produced by different multiclassification detection models. When the UNSW-NB15 dataset is used to evaluate the deep learning comparative models, APSO-CNN-SE produces the lowest test loss value, around 0.53. The model’s test loss value for the NSL-KDD dataset was about 1.83, indicating that there is still room for improvement in the model’s ability to match the data.
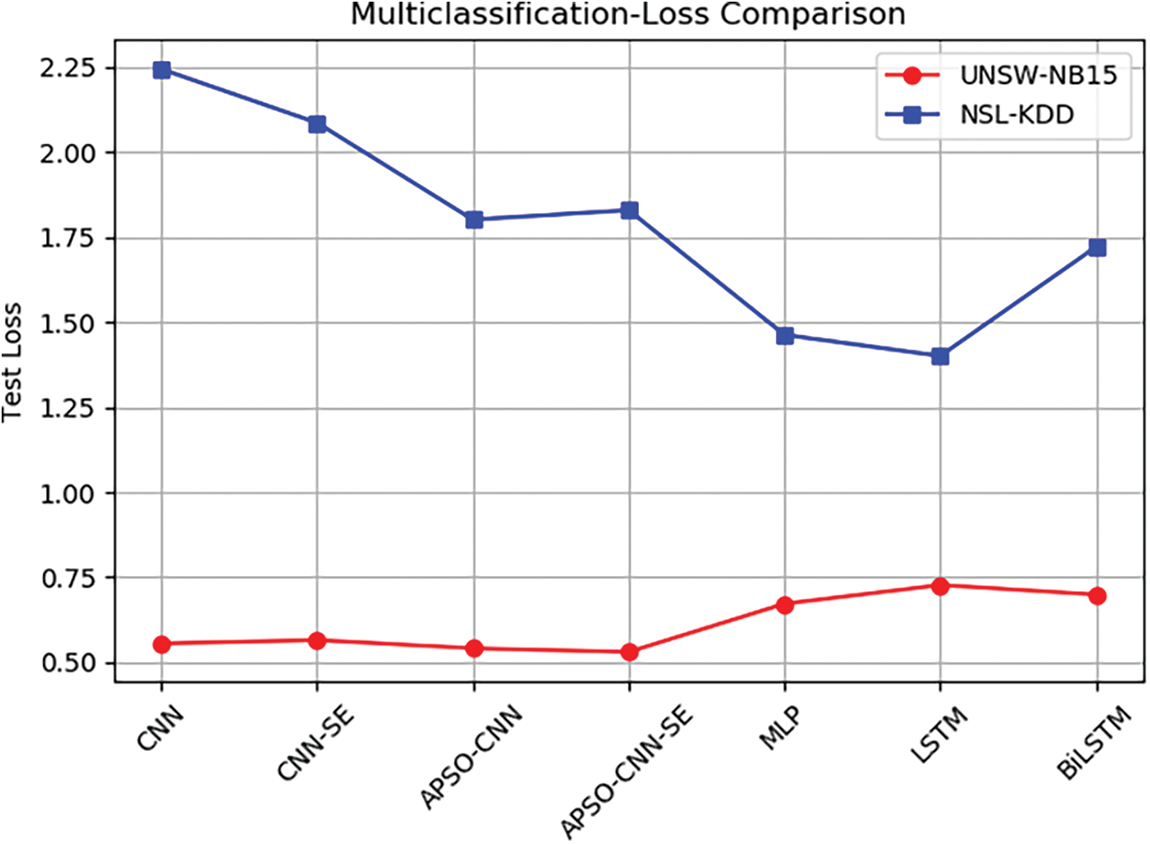
Figure 11: Test loss of the multi-classification model
Table 10 presents the evaluation of parameters, fully statistically, that are acquired by using different models to achieve multi-classification detection. For the UNSW-NB15 dataset, the APSO-CNN-SE model’s overall assessment performs better than the machine learning model, increasing the values corresponding to each result. Among the ablation models, the proposed model outperforms the other three metrics, except for the CNN and CNN-SE accuracy rates, which are slightly higher. The time cost of the four models to complete the multi-classification detection is 1512, 1627, 1463, and 1604 s, respectively, which shows that the addition of the APSO pre-trained model can effectively reduce the time loss of the model. At the same time, the attention mechanism brings good performance along with the elevated time complexity.
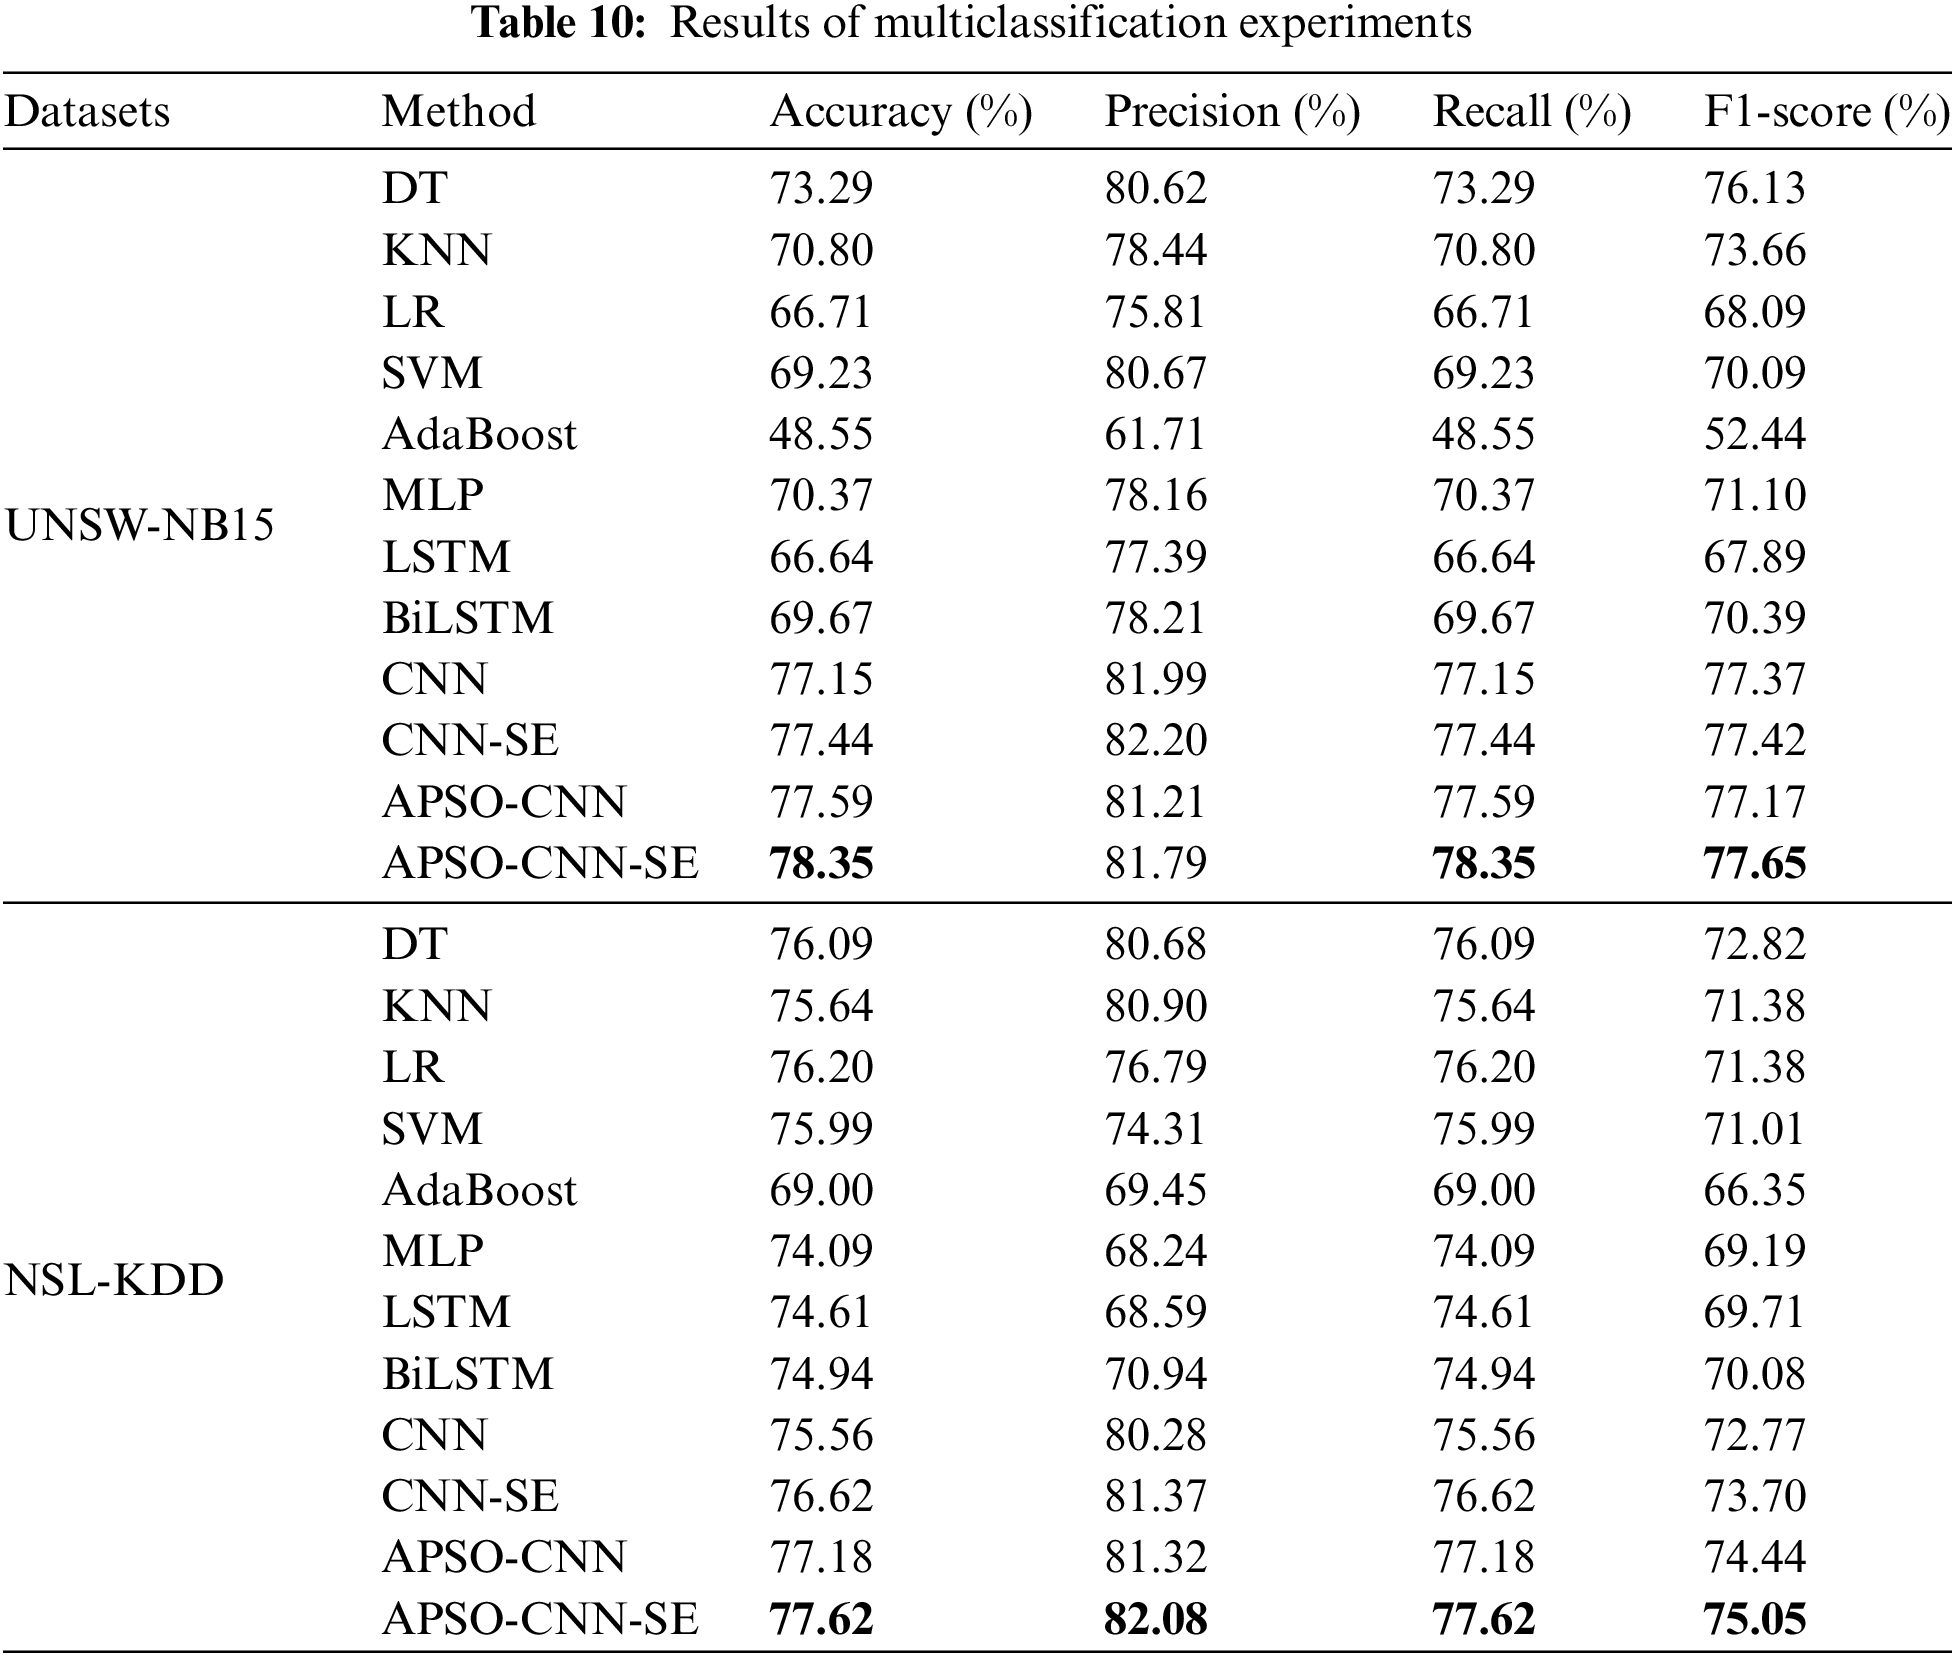
For the NSL-KDD dataset, the evaluation metrics on APSO-CNN-SE are all improved, especially in the accuracy rate, which is nearly 10% higher than MLP, LSTM, and BiLSTM, and the accuracy and F1-score are enhanced by 2.73% and 3.13%, respectively, compared to the base CNN model. The time consumed by the CNN, CNN-SE, APSO-CNN, and APSO-CNN-SE models consume 598, 648, 620, and 777 s, respectively, to complete the multiclassification detection, indicating that only about 3 min of additional time is needed to obtain better detection performance. In summary, on multi-classification detection, when using UNSW-NB15 to verify the performance of the APSO-CNN-SE model, the detection rate performance is higher than that of other algorithms, which reflects the better fitting effect of the model from the test-loss comparison results; on the NSL-KDD dataset, the model still achieves a good detection effect, which indicates that the model’s generalization ability is strong. Figs. 12 and 13 are visualizations of the results of the multi-classification experiments on both datasets.
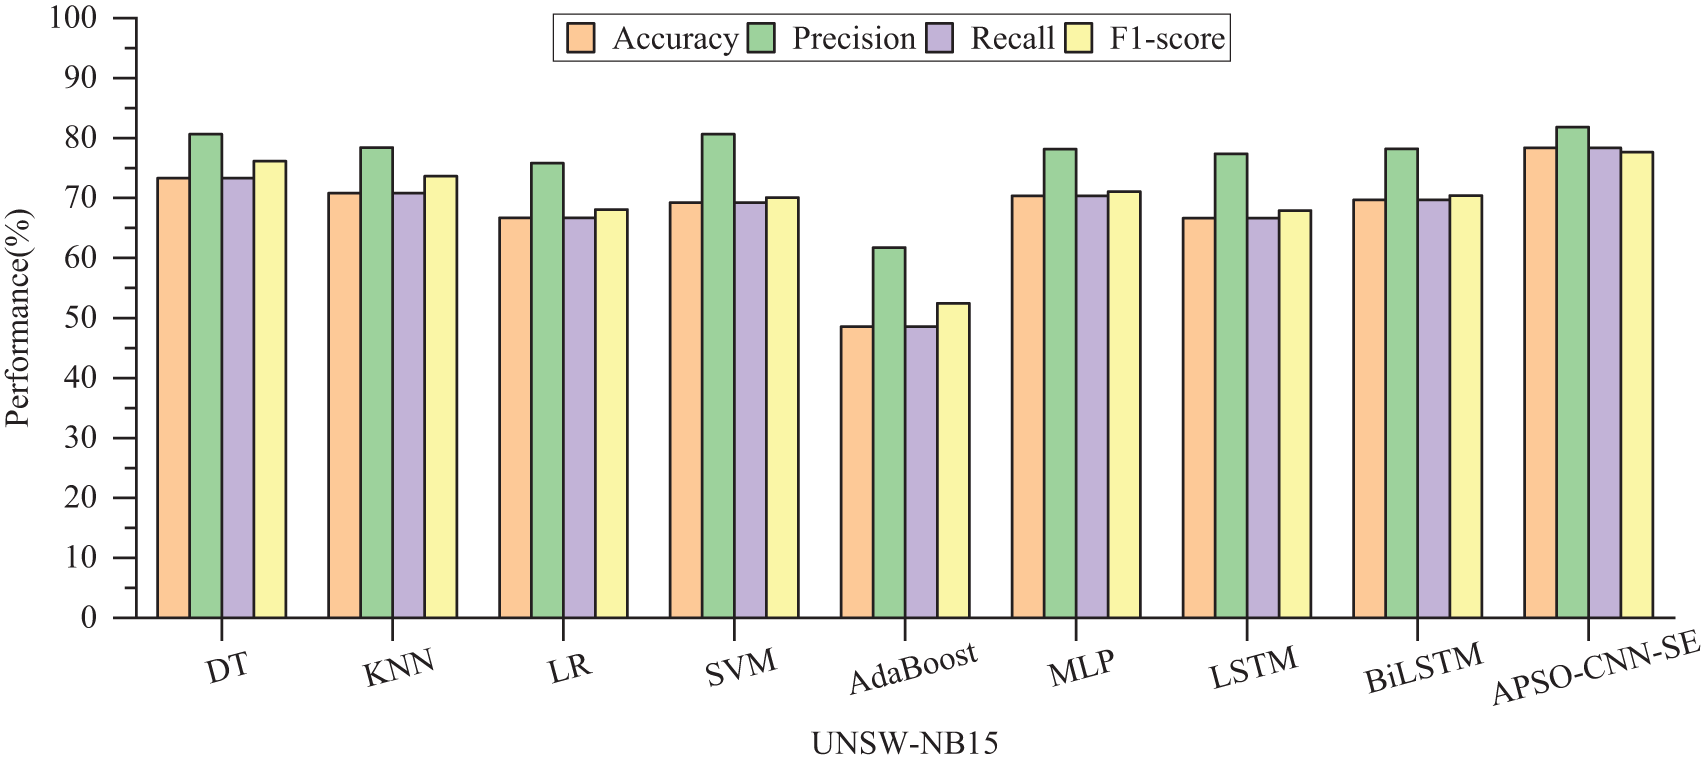
Figure 12: Comparison of multi-classification performance of different models on UNSW-NB15
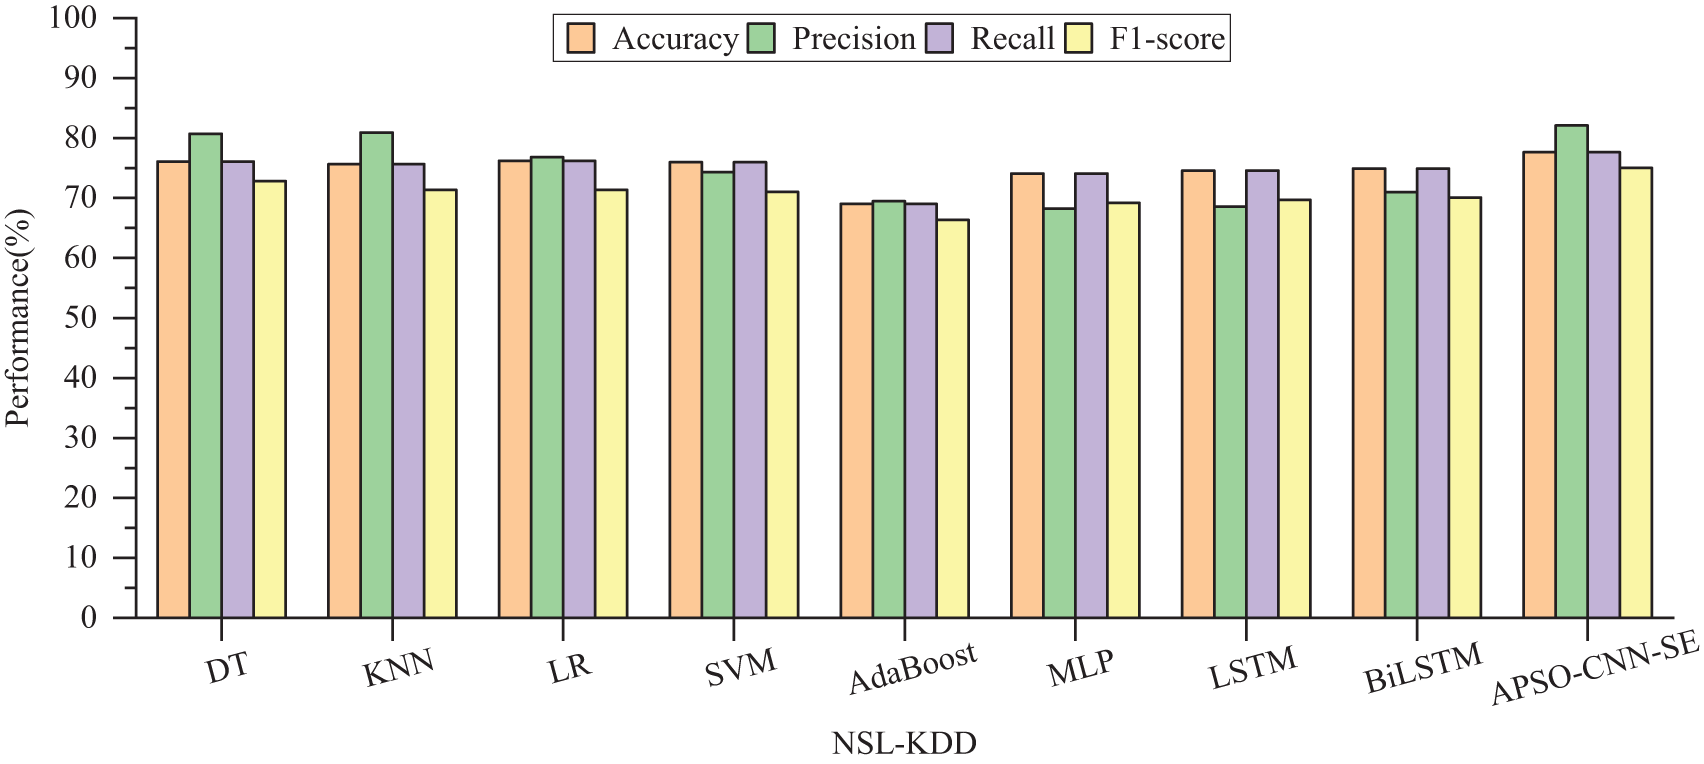
Figure 13: Comparison of multi-classification performance of different models on NSL-KDD
4.3.3 Stage 3: Parameter Sensitivity Experiment
(1) Selection of weights, acceleration factors
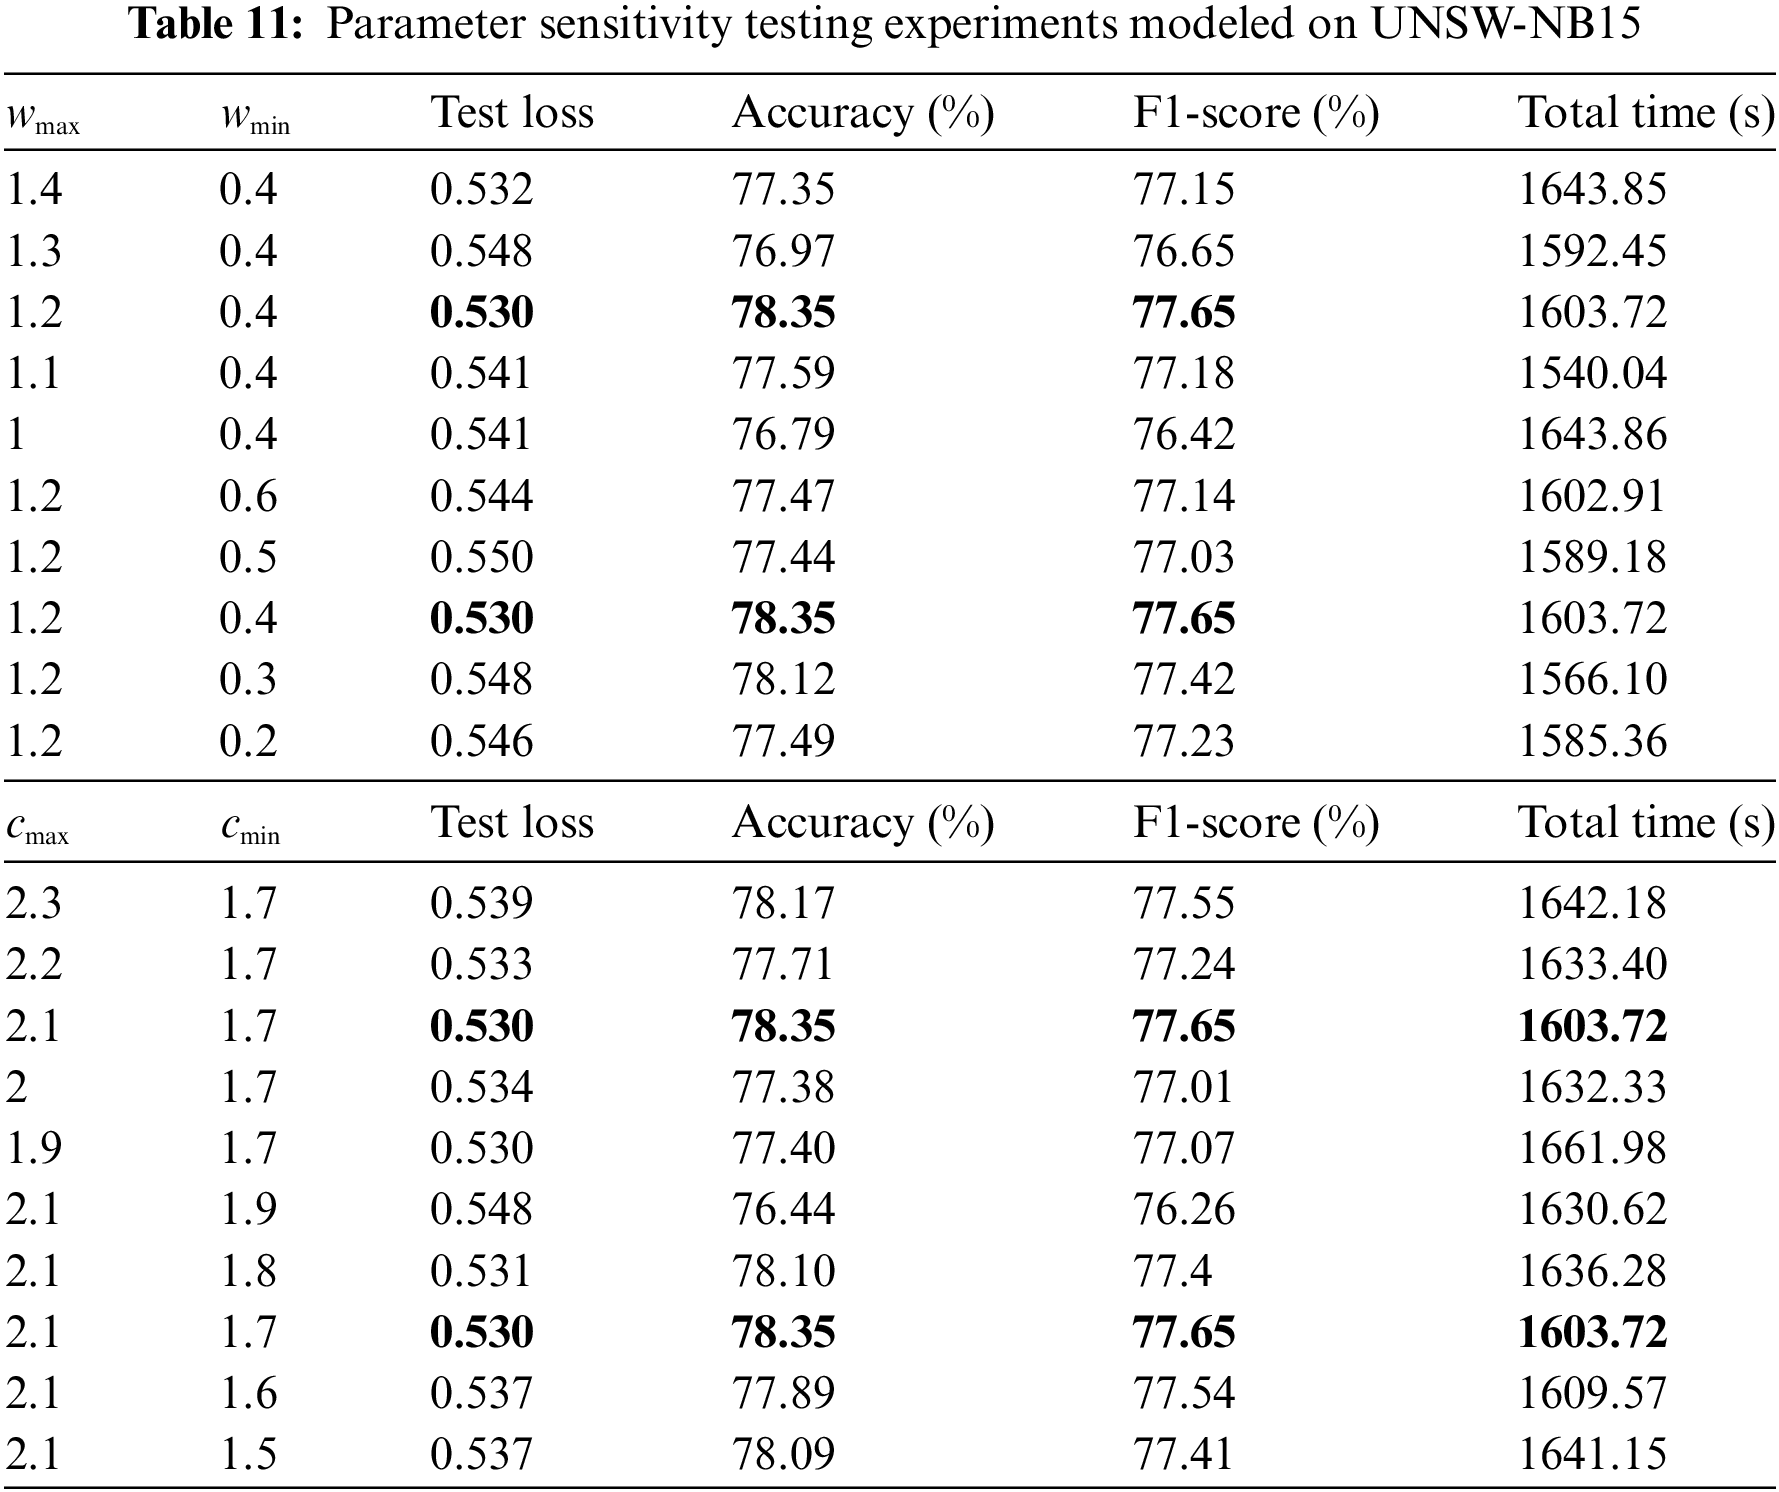
We use UNSW-NB15 and NSL-KDD to test the APSO-CNN-SE model multi-classification performance with different selections of weights and acceleration factors and statistically test the loss, accuracy, F1-score, and runtime to further elaborate on the selection factors of some parameters.
As shown in Table 11, for UNSW-NB15, under the condition that the maximum value of the acceleration factor
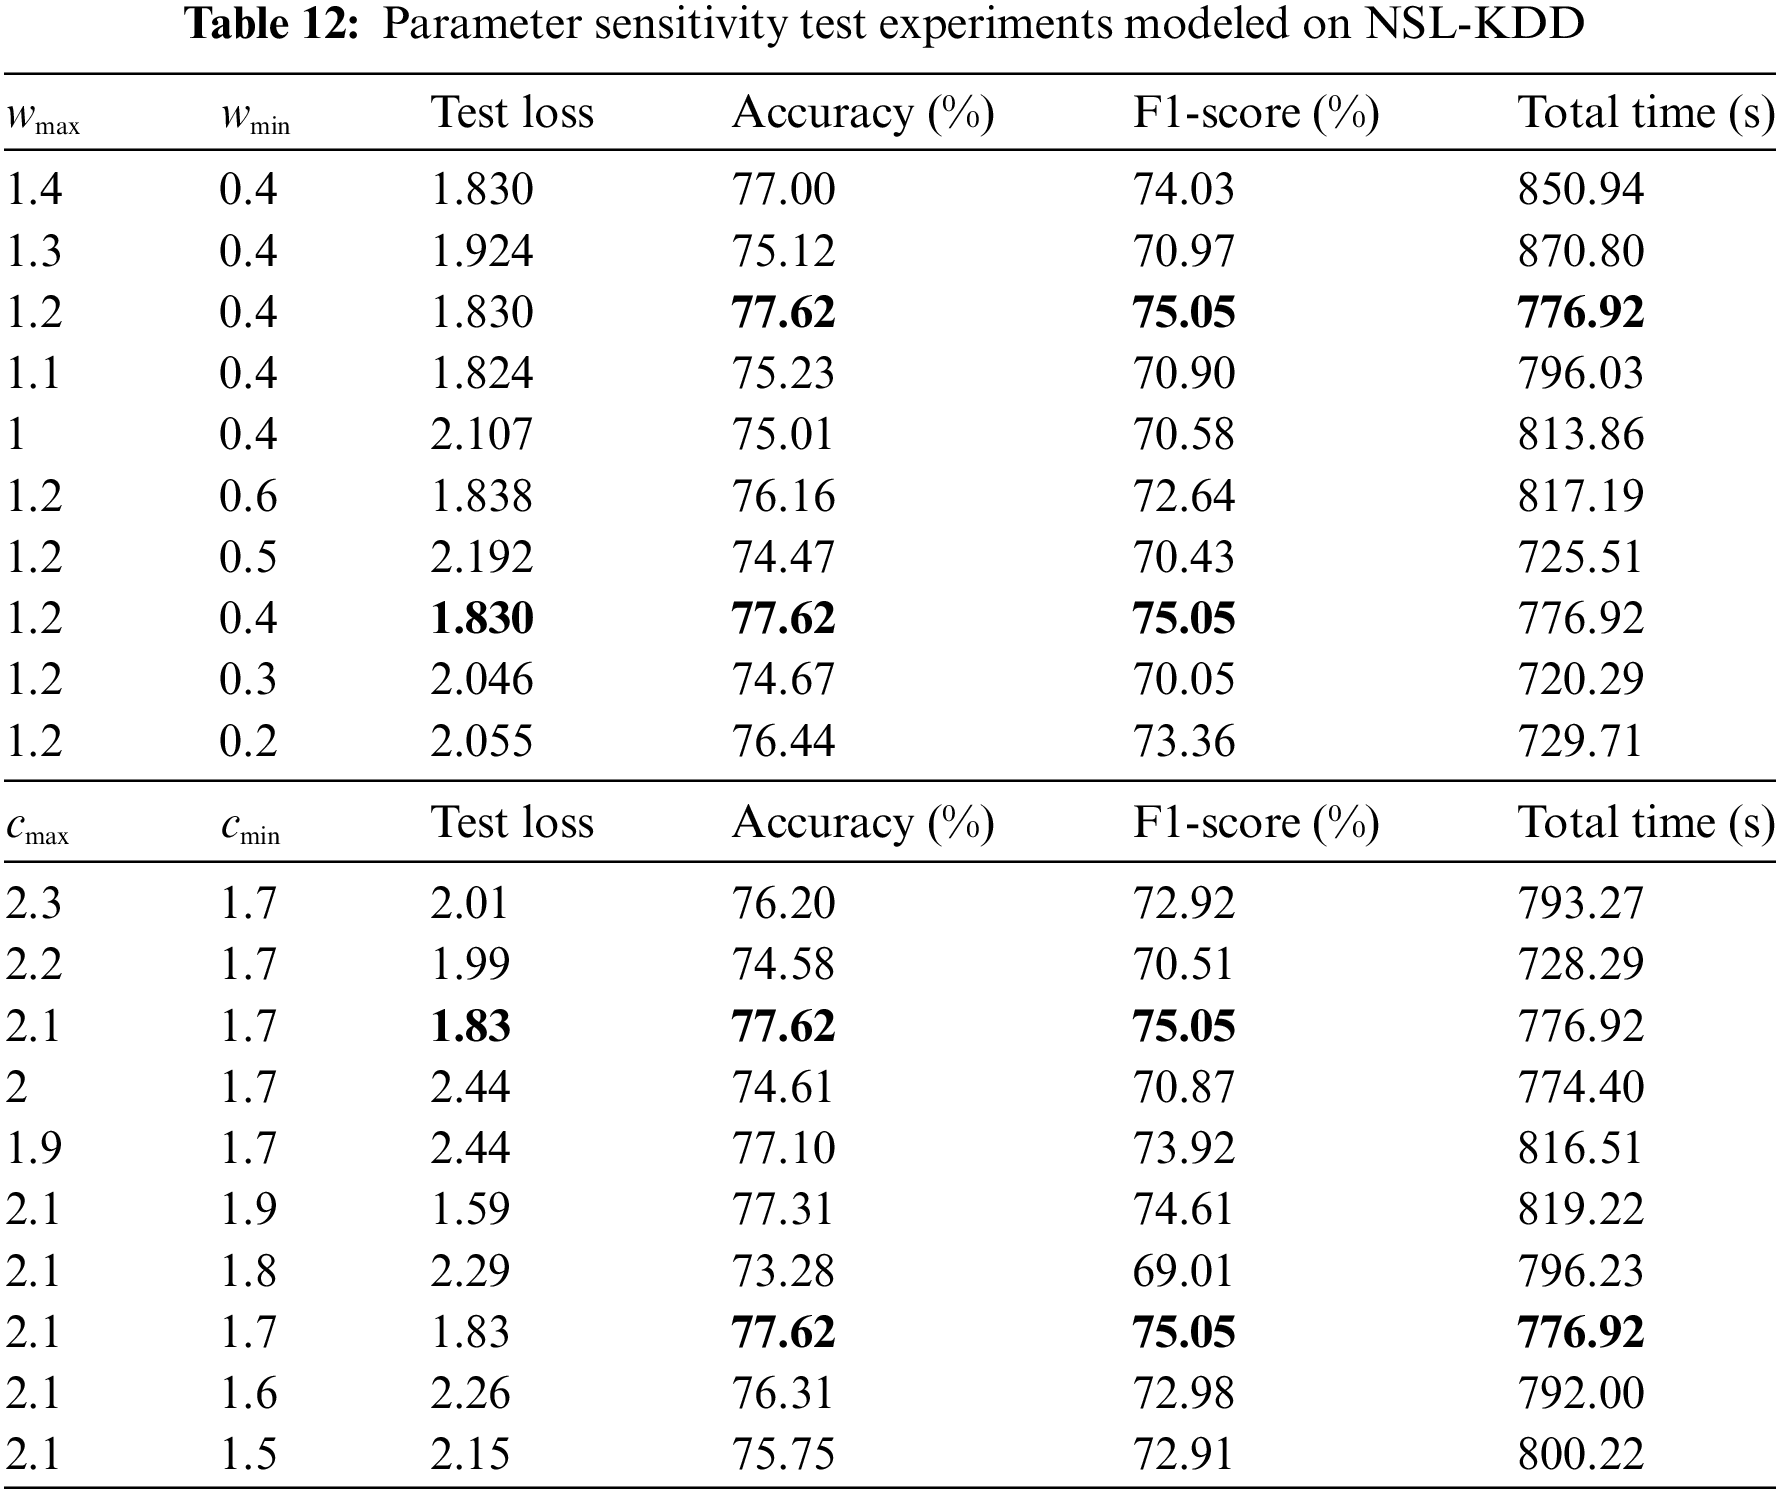
As shown in Table 12, for NSL-KDD, similar to the analysis of the above dataset, the same control variables method was used to validate the selection factors of the model hyperparameters to make further additions and clarifications. Although two other sets of parameters exhibit lower test loss values, the overall experimental results show that the proposed model has some advantages in terms of detection performance and time loss with
(2) Batch selection
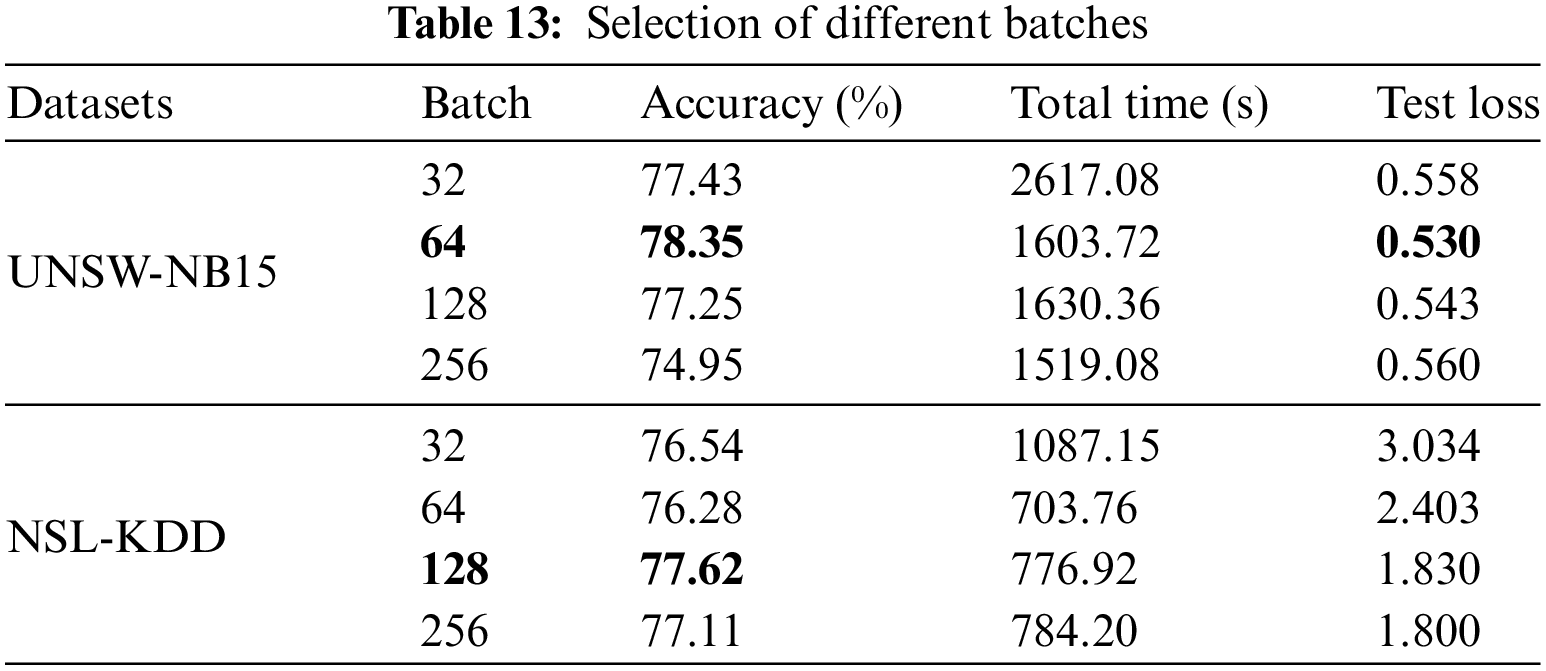
The APSO-CNN-SE model is evaluated under the UNSW-NB15 and NSL-KDD datasets to compare the impact of different batch selections on the model performance. As shown in Table 13, for UNSW-NB15, compared with the case where the batch is 64, the accuracy is relatively lower by 3.4%, although the runtime is shortest when the batch is selected as 256; the runtime and loss values are relatively higher for batches 32 and 128, so the batch chosen in this paper for this data is 64. For NSL-KDD, compared with other batch selections, when the batch is 32, the time loss is higher by about 300 s; the time loss is lowest when the batch is 64, but the accuracy is relatively low. The difference in the time loss between the batch of 128 and 256 is not significant, but the accuracy of the latter is relatively low, and thus, the batch size selected for this data is 128.
4.3.4 Stage 4: Comparison with Other Literature
As shown in Table 14, when comparing the previously studied models with APSO-CNN-SE, the detection accuracies of binary and multiclassification are utilized to measure the performance advantages of the models. From the statistical data, for the UNSW-NB15 dataset, the detection performance of APSO-CNN-SE is comparable to the performance of the FFDNN model from the literature [51] in addition to the detection effectiveness comparison of its algorithm in the first place.
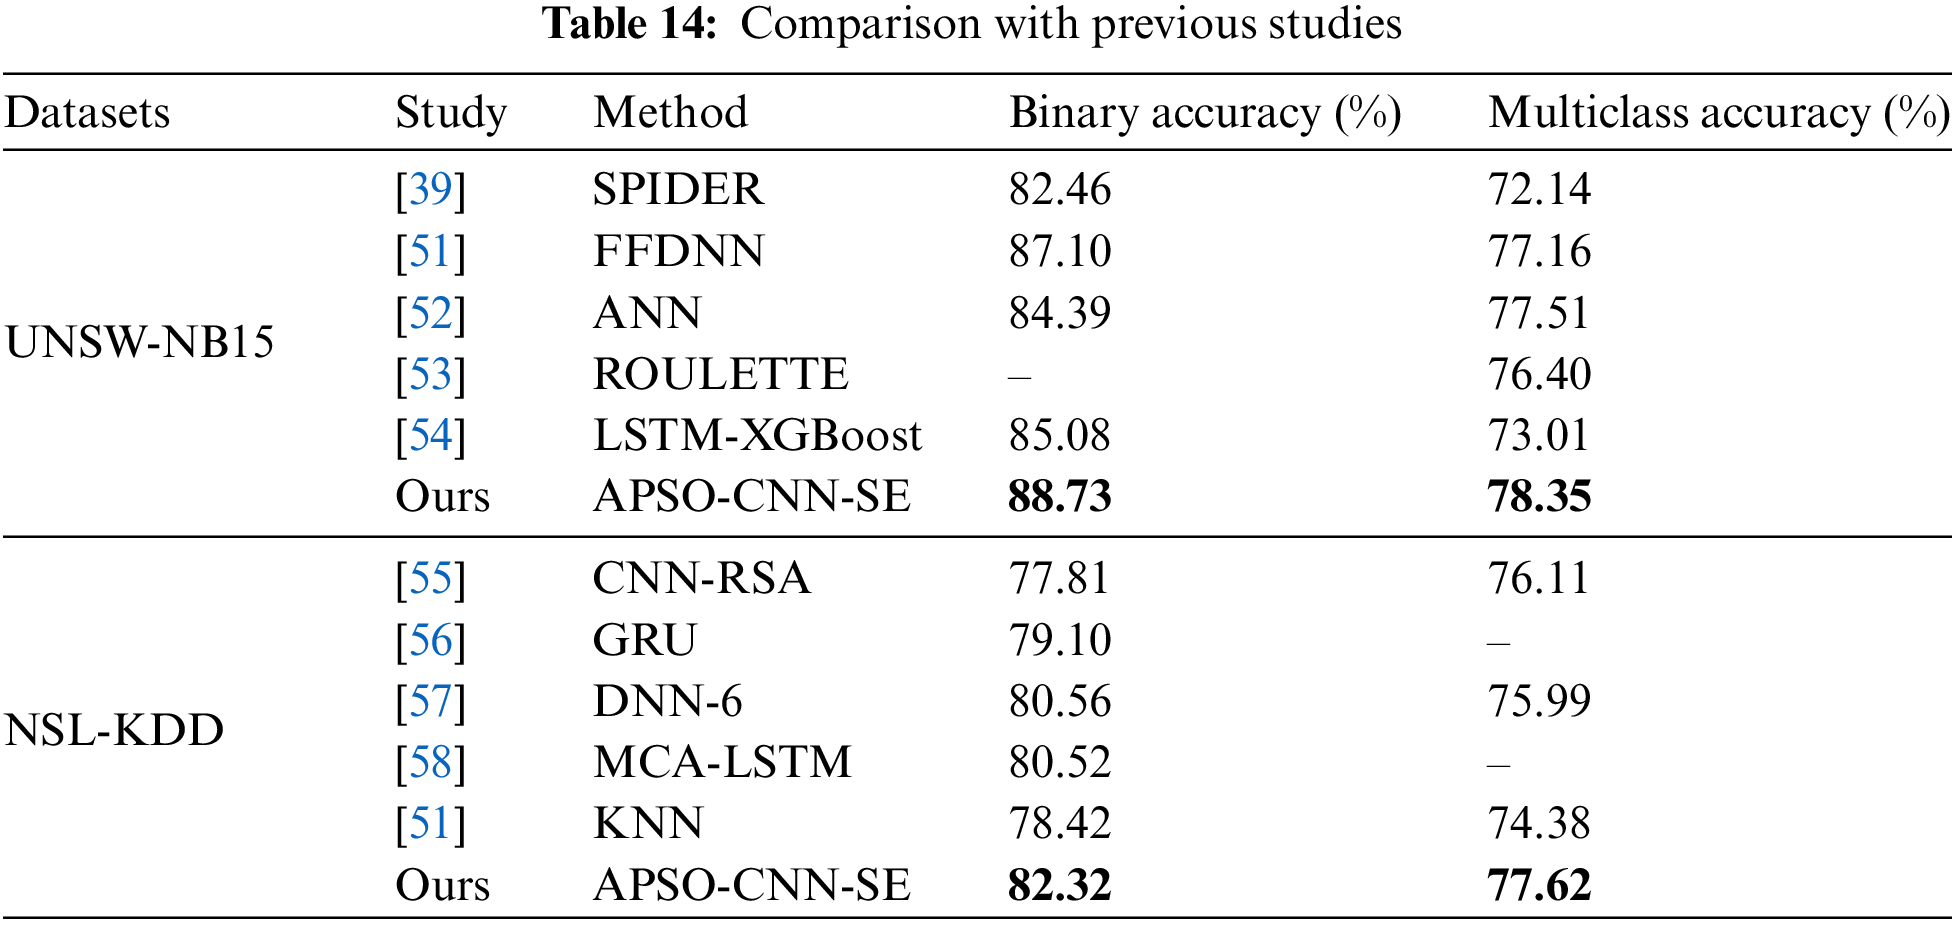
For the NSL-KDD dataset, compared with other algorithms, the model’s binary classification detection accuracy is higher by about 1.76%–4.51%, and the multi-classification accuracy is higher by more than 1.52%. Overall, the proposed model has relatively better binary classification and multi-classification results, further illustrating that the model can detect whether an attack exists in intrusion detection scenarios. At the same time, it can also more accurately determine which category of attack exists, which improves the overall performance of the intrusion detection system.
In IoT network intrusion detection, the APSO-CNN-SE model presented in this paper has produced significant results, primarily in the following areas. First, from the standpoint of two-dimensional image processing, one-dimensional traffic data is converted into two-dimensional image data to better capture the spatial characteristics of traffic features. A lightweight APSO-CNN-SE model is constructed by combining the Squeeze-and-Excitation channel attention mechanism with the adaptive particle swarm algorithm, and the detection performance received on both the UNSW-NB15 and NSL-KDD datasets is superior to that of conventional machine models and other deep learning models. As demonstrated by the experimental results, the built model is feasible and effective, offering a critical security guarantee for the secure operation of IoT networks. Second, the created APSO-CNN-SE is lightweight due to the particle swarm algorithm’s lower temporal complexity and CNN’s comparatively smaller convolutional kernels and fewer layers. Meanwhile, the number of training iterations set by the model on the two datasets are 50 and 30, respectively, corresponding to a runtime of 1603.72 and 776.92 s, which means that the model can process and detect the traffic data in the network in the shortest possible time. Ultimately, the CNN-SE backbone and the APSO pre-training idea work together to quickly find the optimal model weights and bias parameters, raising detection accuracy and efficiency. Adding two datasets for training further demonstrates the model’s strong generalization ability, and the slight loss values found also point to the model’s generally good fitting performance.
In which the model is scalable. Suppose the intrusion detection dataset’s feature dimension is near 49. In that case, preprocessing the traffic data into 7 * 7 two-dimensional image data is required before entering it into the model for testing and training. The model must then be further adjusted based on the evaluation results. On the one hand, we can choose to use the feature selection technique to realize the dimensionality reduction processing if the preprocessed or source datasets have large feature dimensions; on the other hand, we can pre-adjust some hyperparameters in the model framework and then fine-tune the model based on the feedback evaluation information. Due to the study’s limitation to two datasets may require particular studies to validate the detection results on additional datasets.
Despite its accomplishments, the APSO-CNN-SE model has some limitations. While it has a higher detection accuracy than some conventional machine learning models and basic deep learning models, there is still much room for improvement. On the other hand, UNSW-NB15 and NSL-KDD encounter an imbalance in data distribution. While achieving a higher overall accuracy rate, their performance in identifying certain anomalous attack categories with smaller sample sizes is lower. This is primarily because the model may use attack types with more data to optimize its parameters during training. In contrast, attack types with less data may not provide the model with enough training signals, making it harder for the model to identify these attack types and subsequently affecting the detection performance of the model.
In the following work, we will take two steps to address the drawbacks of the above model. First, we will look into using the swarm intelligence-based feature selection algorithm in the data preprocessing stage to select more relevant features and remove some redundant features to save the model running time. Additionally, we will consider adjusting the model structure and parameter settings in the model optimization phase, such as by adding LSTM, GRU, and other time-series processing techniques, which can capture the temporal features of network traffic. Meanwhile, to improve the performance of identifying anomalous traffic with a low number of samples, we will consider using the SMOTE oversampling approach to equalize the number of samples to address the imbalance problem of the intrusion detection dataset. The validity and feasibility of the model may be shown because the dataset utilized in this work can represent real-world IoT scenarios. We will then integrate the aforementioned ideas for improvement to create an intrusion detection model that performs better and test it in actual IoT scenarios, enabling accurate monitoring of anomalous attacks. In short, our goal is to develop a solid and trustworthy model that will enhance the performance of abnormal traffic and reduce the time cost, thus guaranteeing the safe operation of IoT.
This paper proposes an enhanced deep-learning model for IoT environment intrusion detection. Convolutional neural networks are used as the backbone network in the constructed model, which also incorporates a Squeeze-and-Excitation channel attention mechanism and an adaptive particle swarm algorithm for pre-training the model’s weights and biases, resulting in the overall APSO-CNN-SE architecture. We use the openly feasible UNSW-NB15 and NSL-KDD datasets and perform label encoding, max-min normalization, and 2D image transformation preprocessing steps on them, respectively. These two datasets are commonly employed in network intrusion detection and can accurately depict real-time attacks within the IoT. The experimental design is based on two different perspectives: binary classification and multi-classification, and four metrics, namely, accuracy, precision, recall, and F1-score, are used to show the performance of the model objectively. The experimental results demonstrate the proposed model’s excellent classification and recognition performance, with lower loss values obtained and higher binary and multiclassification detection accuracies than several other more sophisticated classes of models in the field and several traditional classifiers. Generally, the suggested model provides an innovative approach to advancing IoT security, with superior detection capabilities, comparatively minimal time spending, and strong generalizability. However, there is still room for improvement in the detection accuracy, and the issue of data distribution imbalance still needs to be solved. At the same time, further experimental investigation is required to determine the model’s portability.
Acknowledgement: The authors would like to thank Prof. Zhang and Prof. He for their guidance on this study, as well as all reviewers and the editorial team for their valuable suggestions.
Funding Statement: This research is funded by the National Natural Science Foundation of China “Research on the Evidence Chain Construction from the Analysis of the Investigation Documents (62166006)”; the Natural Science Foundation of Guizhou Province under Grant [2020]1Y254.
Author Contributions: Yunfei Ban constructed the model, completed the experiments, and wrote the paper; Damin Zhang, Qing He, and Qianwen Shen provided the ideas and assisted in completing the manuscript. All authors reviewed the results and approved the final version of the manuscript.
Availability of Data and Materials: Both UNSW-NB15 and NSL-KDD are openly accessible datasets. The two datasets supporting this study’s findings are publicly available at https://research.unsw.edu.au/projects/unsw-nb15-dataset (accessed on 18 August 2024) and https://www.kaggle.com (accessed on 18 August 2024).
Ethics Approval: Not applicable.
Conflicts of Interest: The authors declare that they have no conflicts of interest to report regarding the present study.
References
1. M. Mohy-Eddine, A. Guezzaz, S. Benkirane, and M. Azrour, “An efficient network intrusion detection model for IoT security using K-NN classifier and feature selection,” Multimed. Tools Appl., vol. 82, no. 15, pp. 23615–23633, 2023. doi: 10.1007/s11042-023-14795-2. [Google Scholar] [CrossRef]
2. H. C. Altunay and Z. Albayrak, “A hybrid CNN+LSTM-based intrusion detection system for industrial IoT networks,” Eng. Sci. Tech., Int. J., vol. 38, 2023, Art. no. 101322. doi: 10.1016/j.jestch.2022.101322. [Google Scholar] [CrossRef]
3. F. S. Gharehchopogh, B. Abdollahzadeh, S. Barshandeh, and B. Arasteh, “A multi-objective mutation-based dynamic Harris Hawks optimization for botnet detection in IoT,” Internet of Things, vol. 24, no. 7, 2023, Art. no. 100952. doi: 10.1016/j.iot.2023.100952. [Google Scholar] [CrossRef]
4. M. Abd Elaziz, M. A. A. Al-qaness, A. Dahou, R. A. Ibrahim, and A. A. A. El-Latif, “Intrusion detection approach for cloud and IoT environments using deep learning and Capuchin Search Algorithm,” Adv. Eng. Softw., vol. 176, 2023, Art. no. 103402. doi: 10.1016/j.advengsoft.2022.103402. [Google Scholar] [CrossRef]
5. S. Fraihat, S. Makhadmeh, M. Awad, M. A. Al-Betar, and A. Al-Redhaei, “Intrusion detection system for large-scale IoT NetFlow networks using machine learning with modified arithmetic optimization algorithm,” Internet of Things, vol. 22, 2023, Art. no. 100819. doi: 10.1016/j.iot.2023.100819. [Google Scholar] [CrossRef]
6. Y. Ali, H. U. Khan, and M. Khalid, “Engineering the advances of the artificial neural networks (ANNs) for the security requirements of Internet of Things: A systematic review,” J. Big Data, vol. 10, no. 1, 2023, Art. no. 128. doi: 10.1186/s40537-023-00805-5. [Google Scholar] [CrossRef]
7. H. Taherdoost, “Security and Internet of Things: Benefits, challenges, and future perspectives,” Electronics, vol. 12, no. 8, 2023, Art. no. 1901. doi: 10.3390/electronics12081901. [Google Scholar] [CrossRef]
8. I. Obeidat, N. Hamadneh, M. Alkasassbeh, and M. Almseidin, “Intensive preprocessing of KDD Cup 99 for network intrusion classification using machine learning techniques,” 2018. Accessed: Jul. 11, 2024. [Online]. Available: http://arxiv.org/abs/1805.10458 [Google Scholar]
9. F. Ullah, S. Ullah, G. Srivastava, and J. C. -W. Lin, “IDS-INT: Intrusion detection system using transformer-based transfer learning for imbalanced network traffic,” Digit. Commun. Netw., vol. 10, no. 1, pp. 190–204, 2024. doi: 10.1016/j.dcan.2023.03.008. [Google Scholar] [CrossRef]
10. M. A. Talukder et al., “Machine learning-based network intrusion detection for big and imbalanced data using oversampling, stacking feature embedding and feature extraction,” J. Big Data, vol. 11, no. 1, 2024, Art. no. 33. doi: 10.1186/s40537-024-00886-w. [Google Scholar] [CrossRef]
11. M. S. Habeeb and T. R. Babu, “Network intrusion detection system: A survey on artificial intelligence-based techniques,” Expert Syst., vol. 39, no. 9, 2022, Art. no. e13066. doi: 10.1111/exsy.13066. [Google Scholar] [CrossRef]
12. H. Nguyen and R. Kashef, “TS-IDS: Traffic-aware self-supervised learning for IoT network intrusion detection,” Knowl.-Based Syst., vol. 279, 2023, Art. no. 110966. doi: 10.1016/j.knosys.2023.110966. [Google Scholar] [CrossRef]
13. M. Sarhan, S. Layeghy, N. Moustafa, M. Gallagher, and M. Portmann, “Feature extraction for machine learning-based intrusion detection in IoT networks,” Digit. Commun. Netw., vol. 10, no. 1, pp. 205–216, 2024. doi: 10.1016/j.dcan.2022.08.012. [Google Scholar] [CrossRef]
14. J. Wang, H. Xu, Y. G. Achamyeleh, S. Huang, and M. A. A. Faruque, “HyperDetect: A real-time hyperdimensional solution for intrusion detection in IoT networks,” IEEE Internet Things J., vol. 11, no. 8, pp. 14844–14856, 2024. doi: 10.1109/JIOT.2023.3345279. [Google Scholar] [CrossRef]
15. B. Lampe and W. Meng, “A survey of deep learning-based intrusion detection in automotive applications,” Expert Syst. Appl., vol. 221, 2023, Art. no. 119771. doi: 10.1016/j.eswa.2023.119771. [Google Scholar] [CrossRef]
16. Y. -C. Wang, Y. -C. Houng, H. -X. Chen, and S. -M. Tseng, “Network anomaly intrusion detection based on deep learning approach,” Sensors, vol. 23, no. 4, 2023, Art. no. 2171. doi: 10.3390/s23042171. [Google Scholar] [PubMed] [CrossRef]
17. X. Wang, Y. Wang, Z. Javaheri, L. Almutairi, N. Moghadamnejad and O. S. Younes, “Federated deep learning for anomaly detection in the internet of things,” Comput. Electr. Eng., vol. 108, 2023, Art. no. 108651. doi: 10.1016/j.compeleceng.2023.108651. [Google Scholar] [CrossRef]
18. H. Peng, C. Wu, and Y. Xiao, “CBF-IDS: Addressing class imbalance using CNN-BiLSTM with focal loss in network intrusion detection system,” Appl. Sci., vol. 13, no. 21, 2023, Art. no. 1629. doi: 10.3390/app132111629. [Google Scholar] [CrossRef]
19. K. Mittal and P. K. Batra, “Graph-ensemble fusion for enhanced IoT intrusion detection: Leveraging GCN and deep learning,” Cluster Comput., vol. 4, no. 1, 2024, Art. no. 22. doi: 10.1007/s10586-024-04404-8. [Google Scholar] [CrossRef]
20. J. Gu et al., “Recent advances in convolutional neural networks,” Pattern Recognit., vol. 77, no. 11, pp. 354–377, 2018. doi: 10.1016/j.patcog.2017.10.013. [Google Scholar] [CrossRef]
21. A. Binbusayyis, “Hybrid VGG19 and 2D-CNN for intrusion detection in the FOG-cloud environment,” Expert Syst. Appl., vol. 238, 2024, Art. no. 121758. doi: 10.1016/j.eswa.2023.121758. [Google Scholar] [CrossRef]
22. C. Wei, G. Xie, and Z. Diao, “A lightweight deep learning framework for botnet detecting at the IoT edge,” Comput. Secur., vol. 129, 2023, Art. no. 103195. doi: 10.1016/j.cose.2023.103195. [Google Scholar] [CrossRef]
23. M. Alazab, R. A. Khurma, P. A. Castillo, B. Abu-Salih, A. Martín and D. Camacho, “An effective networks intrusion detection approach based on hybrid Harris Hawks and multi-layer perceptron,” Egypt. Inform. J., vol. 25, 2024, Art. no. 100423. doi: 10.1016/j.eij.2023.100423. [Google Scholar] [CrossRef]
24. N. G. Bach, L. H. Hoang, and T. H. Hai, “Improvement of K-nearest neighbors (KNN) algorithm for network intrusion detection using shannon-entropy,” J. Commun., vol. 16, pp. 347–354, 2021. doi: 10.12720/jcm.16.8.347-354. [Google Scholar] [CrossRef]
25. A. Guezzaz, S. Benkirane, M. Azrour, and S. Khurram, “A reliable network intrusion detection approach using decision tree with enhanced data quality,” Secur. Commun. Netw., vol. 2021, 2021, Art. no.1230593. doi: 10.1155/2021/1230593. [Google Scholar] [CrossRef]
26. Z. Halim et al., “An effective genetic algorithm-based feature selection method for intrusion detection systems,” Comput. Secur., vol. 110, 2021, Art. no. 102448. doi: 10.1016/j.cose.2021.102448. [Google Scholar] [CrossRef]
27. N. Kumar and U. Kumar, “Artificial intelligence for classification and regression tree based feature selection method for network intrusion detection system in various telecommunication technologies,” Comput. Intell., vol. 40, no. 1, 2024, Art. no. e12500. doi: 10.1111/coin.12500. [Google Scholar] [CrossRef]
28. T. Wisanwanichthan and M. Thammawichai, “A double-layered hybrid approach for network intrusion detection system using combined Naive Bayes and SVM,” IEEE Access, vol. 9, no. 4, pp. 138432–138450, 2021. doi: 10.1109/ACCESS.2021.3118573. [Google Scholar] [CrossRef]
29. D. Srivastav and P. Srivastava, “A two-tier hybrid ensemble learning pipeline for intrusion detection systems in IoT networks,” J. Ambient Intell. Humaniz. Comput., vol. 14, no. 4, pp. 3913–3927, 2023. doi: 10.1007/s12652-022-04461-0. [Google Scholar] [CrossRef]
30. N. Thockchom, M. M. Singh, and U. Nandi, “A novel ensemble learning-based model for network intrusion detection,” Complex Intell. Syst., vol. 9, no. 5, pp. 5693–5714, 2023. doi: 10.1007/s40747-023-01013-7. [Google Scholar] [CrossRef]
31. H. Xu, Z. Sun, Y. Cao, and H. Bilal, “A data-driven approach for intrusion and anomaly detection using automated machine learning for the Internet of Things,” Soft Comput., vol. 27, no. 19, pp. 14469–14481, 2023. doi: 10.1007/s00500-023-09037-4. [Google Scholar] [CrossRef]
32. A. Thakkar and R. Lohiya, “Fusion of statistical importance for feature selection in Deep Neural Network-based intrusion detection system,” Inf. Fusion, vol. 90, no. 1, pp. 353–363, 2023. doi: 10.1016/j.inffus.2022.09.026. [Google Scholar] [CrossRef]
33. T. Saba, A. Rehman, T. Sadad, H. Kolivand, and S. A. Bahaj, “Anomaly-based intrusion detection system for IoT networks through deep learning model,” Comput. Electr. Eng., vol. 99, 2022, Art. no. 107810. doi: 10.1016/j.compeleceng.2022.107810. [Google Scholar] [CrossRef]
34. R. Harini, N. Maheswari, S. Ganapathy, and M. Sivagami, “An effective technique for detecting minority attacks in NIDS using deep learning and sampling approach,” Alex. Eng. J., vol. 78, no. 1, pp. 469–482, 2023. doi: 10.1016/j.aej.2023.07.063. [Google Scholar] [CrossRef]
35. D. Shou et al., “An intrusion detection method based on attention mechanism to improve CNN-BiLSTM model,” Comput. J., vol. 67, no. 5, pp. 1851–1865, May 2024. doi: 10.1093/comjnl/bxad105. [Google Scholar] [CrossRef]
36. E. Caville, W. W. Lo, S. Layeghy, and M. Portmann, “Anomal-E: A self-supervised network intrusion detection system based on graph neural networks,” Knowl.-Based Syst., vol. 258, 2022, Art. no. 110030. doi: 10.1016/j.knosys.2022.110030. [Google Scholar] [CrossRef]
37. R. Meddeb, F. Jemili, B. Triki, and O. Korbaa, “A deep learning-based intrusion detection approach for mobile Ad-hoc network,” Soft Comput., vol. 27, no. 14, pp. 9425–9439, 2023. doi: 10.1007/s00500-023-08324-4. [Google Scholar] [CrossRef]
38. Z. Li, P. Wang, and Z. Wang, “FlowGANAnomaly: Flow-based anomaly network intrusion detection with adversarial learning,” Chin. J. Electron., vol. 33, no. 1, pp. 58–71, 2024. doi: 10.23919/cje.2022.00.173. [Google Scholar] [CrossRef]
39. P. B. Udas, M. E. Karim, and K. S. Roy, “SPIDER: A shallow PCA based network intrusion detection system with enhanced recurrent neural networks,” J. King Saud Univ.-Comput. Inf. Sci., vol. 34, no. 10, pp. 10246–10272, 2022. doi: 10.1016/j.jksuci.2022.10.019. [Google Scholar] [CrossRef]
40. J. K. Samriya, R. Tiwari, X. Cheng, R. K. Singh, A. Shankar and M. Kumar, “Network intrusion detection using ACO-DNN model with DVFS based energy optimization in cloud framework,” Sustain. Comput.: Inf. Syst., vol. 35, 2022, Art. no. 100746. doi: 10.1016/j.suscom.2022.100746. [Google Scholar] [CrossRef]
41. K. Hussain, Y. Xia, A. N. Onaizah, T. Manzoor, and K. Jalil, “Hybrid of WOA-ABC and proposed CNN for intrusion detection system in wireless sensor networks,” Optik, vol. 271, 2022, Art. no. 170145. doi: 10.1016/j.ijleo.2022.170145. [Google Scholar] [CrossRef]
42. R. Kumar, A. Malik, and V. Ranga, “An intellectual intrusion detection system using hybrid hunger games search and remora optimization algorithm for IoT wireless networks,” Knowl.-Based Syst., vol. 256, 2022, Art. no. 109762. doi: 10.1016/j.knosys.2022.109762. [Google Scholar] [CrossRef]
43. A. V. Hanafi, A. Ghaffari, H. Rezaei, A. Valipour, and B. arasteh, “Intrusion detection in internet of things using improved binary golden jackal optimization algorithm and LSTM,” Cluster Comput., vol. 27, no. 3, pp. 2673–2690, 2024. doi: 10.1007/s10586-023-04102-x. [Google Scholar] [CrossRef]
44. Y. K. Saheed and S. Misra, “A voting gray wolf optimizer-based ensemble learning models for intrusion detection in the Internet of Things,” Int. J. Inf. Secur., vol. 23, no. 3, pp. 1557–1581, 2024. doi: 10.1007/s10207-023-00803-x. [Google Scholar] [CrossRef]
45. A. Alsirhani, M. M. Alshahrani, A. M. Hassan, A. I. Taloba, R. M. A. El-Aziz and A. H. Samak, “Implementation of African vulture optimization algorithm based on deep learning for cybersecurity intrusion detection,” Alex. Eng. J., vol. 79, no. 6, pp. 105–115, 2023. doi: 10.1016/j.aej.2023.07.077. [Google Scholar] [CrossRef]
46. S. Moghanian, F. B. Saravi, G. Javidi, and E. O. Sheybani, “GOAMLP: Network intrusion detection with multilayer perceptron and grasshopper optimization algorithm,” IEEE Access, vol. 8, pp. 215202–215213, 2020. doi: 10.1109/ACCESS.2020.3040740. [Google Scholar] [CrossRef]
47. X. Kan et al., “A novel IoT network intrusion detection approach based on adaptive particle swarm optimization convolutional neural network,” Inf. Sci., vol. 568, no. 5, pp. 147–162, 2021. doi: 10.1016/j.ins.2021.03.060. [Google Scholar] [CrossRef]
48. D. Kilichev and W. Kim, “Hyperparameter optimization for 1D-CNN-based network intrusion detection using GA and PSO,” Mathematics, vol. 11, no. 17, 2023, Art. no. 3724. doi: 10.3390/math11173724. [Google Scholar] [CrossRef]
49. N. Moustafa and J. Slay, “The evaluation of network anomaly detection systems: Statistical analysis of the UNSW-NB15 data set and the comparison with the KDD99 data set,” Inf. Secur. J.: A Global Perspect., vol. 25, no. 1–3, pp. 18–31, 2016. doi: 10.1080/19393555.2015.1125974. [Google Scholar] [CrossRef]
50. M. Tavallaee, E. Bagheri, W. Lu, and A. A. Ghorbani, “A detailed analysis of the KDD CUP 99 data set,” in 2009 IEEE Symp. Computat. Intell. Secur. Def. App., Ottawa, ON, Canada, 2009, pp. 1–6. doi: 10.1109/CISDA.2009.5356528. [Google Scholar] [CrossRef]
51. S. M. Kasongo and Y. Sun, “A deep learning method with wrapper based feature extraction for wireless intrusion detection system,” Comput. Secur., vol. 92, 2020, Art. no. 101752. doi: 10.1016/j.cose.2020.101752. [Google Scholar] [CrossRef]
52. S. M. Kasongo and Y. Sun, “Performance analysis of intrusion detection systems using a feature selection method on the UNSW-NB15 dataset,” J. Big Data, vol. 7, no. 1, 2020, Art. no. 105. doi: 10.1186/s40537-020-00379-6. [Google Scholar] [CrossRef]
53. G. Andresini, A. Appice, F. P. Caforio, D. Malerba, and G. Vessio, “ROULETTE: A neural attention multi-output model for explainable Network Intrusion Detection,” Expert Syst. Appl., vol. 201, 2022, Art. no. 117144. doi: 10.1016/j.eswa.2022.117144. [Google Scholar] [CrossRef]
54. S. M. Kasongo, “A deep learning technique for intrusion detection system using a Recurrent Neural Networks based framework,” Comput. Commun., vol. 199, no. 1, pp. 113–125, 2023. doi: 10.1016/j.comcom.2022.12.010. [Google Scholar] [CrossRef]
55. A. Dahou et al., “Intrusion detection system for IoT based on deep learning and modified reptile search algorithm,” Comput. Intell. Neurosci., vol. 2022, 2022, Art. no. 6473507. doi: 10.1155/2022/6473507. [Google Scholar] [PubMed] [CrossRef]
56. A. Meliboev, J. Alikhanov, and W. Kim, “Performance evaluation of deep learning based network intrusion detection system across multiple balanced and imbalanced datasets,” Electronics, vol. 11, no. 4, 2022, Art. no. 0515. doi: 10.3390/electronics11040515. [Google Scholar] [CrossRef]
57. M. Gao, L. Ma, H. Liu, Z. Zhang, Z. Ning and J. Xu, “Malicious network traffic detection based on deep neural networks and association analysis,” Sensors, vol. 20, no. 5, 2020, Art. no. 1452. doi: 10.3390/s20051452. [Google Scholar] [PubMed] [CrossRef]
58. R. -H. Dong, X. -Y. Li, Q. -Y. Zhang, and H. Yuan, “Network intrusion detection model based on multivariate correlation analysis–long short-time memory network,” IET Inf. Secur., vol. 14, no. 2, pp. 166–174, 2020. doi: 10.1049/iet-ifs.2019.0294. [Google Scholar] [CrossRef]
Cite This Article
 Copyright © 2024 The Author(s). Published by Tech Science Press.
This work is licensed under a Creative Commons Attribution 4.0 International License , which permits unrestricted use, distribution, and reproduction in any medium, provided the original work is properly cited.
 Downloads
 Citation Tools