
 Submit a Paper
 Propose a Special lssue
 Open Access
ARTICLE

Advancing Autoencoder Architectures for Enhanced Anomaly Detection in Multivariate Industrial Time Series
1 Department of Security Convergence, Chung-Ang University, Seoul, 06974, Republic of Korea
2 Department of Computer Science, COMSATS University Islamabad, Attock Campus, Attock, 43600, Pakistan
3 Department of AI and Big Data, Soonchunhyang University, Asan, 31538, Republic of Korea
4 Department of Industrial Security, Chung-Ang University, Seoul, 06974, Republic of Korea
* Corresponding Authors: Jihoon Moon. Email: ; Seungmin Rho. Email:
(This article belongs to the Special Issue: AI and Data Security for the Industrial Internet)
Computers, Materials & Continua 2024, 81(1), 1275-1300. https://doi.org/10.32604/cmc.2024.054826
Received 08 June 2024; Accepted 10 September 2024; Issue published 15 October 2024
 View Full Text
 Download PDF
Abstract
In the context of rapid digitization in industrial environments, how effective are advanced unsupervised learning models, particularly hybrid autoencoder models, at detecting anomalies in industrial control system (ICS) datasets? This study is crucial because it addresses the challenge of identifying rare and complex anomalous patterns in the vast amounts of time series data generated by Internet of Things (IoT) devices, which can significantly improve the reliability and safety of these systems. In this paper, we propose a hybrid autoencoder model, called ConvBiLSTM-AE, which combines convolutional neural network (CNN) and bidirectional long short-term memory (BiLSTM) to more effectively train complex temporal data patterns in anomaly detection. On the hardware-in-the-loop-based extended industrial control system dataset, the ConvBiLSTM-AE model demonstrated remarkable anomaly detection performance, achieving F1 scores of 0.78 and 0.41 for the first and second datasets, respectively. The results suggest that hybrid autoencoder models are not only viable, but potentially superior alternatives for unsupervised anomaly detection in complex industrial systems, offering a promising approach to improving their reliability and safety.Keywords
The modern industrial environment is driven by the active integration of Internet of Things (IoT) devices that significantly enhance system pipelines [1]. Such technological advancements have increased productivity and efficiency, driving innovative changes across industrial sectors [2]. However, these advances are accompanied by cybersecurity challenges [3]. The use of industrial control systems (ICS) provides increased connectivity and automation but also exposes vulnerabilities to cyberattacks [2]. Due to the critical nature of control systems, cyberattacks on ICS can have severe impacts on the industrial environment, human life, the environment, and the economy due to their scale and severity [4–6].
Therefore, given the sophisticated and ever-evolving nature of cyberattacks on ICSs, it is imperative to adopt innovative perspectives and technologies to enhance cybersecurity measures and protect these critical systems [7]. Research using machine learning models to detect attack data with anomalous patterns is critical [8]. In particular, anomalies are rare in the ICS environment; therefore, anomaly detection is critical in industrial environments. Detection often relies on unsupervised anomaly detection studies that train machine learning technology models based on normal datasets to identify anomalous data [9].
To apply machine learning algorithms for decision-making in industrial processes, a large number of data points are required. In this context, the implementation of new technological paradigms, such as cyber-physical systems (CPS) and IoT, in industrial environments enables the creation of diverse data structure types, as observed in studies focused on big data analytics [10]. Accordingly, efforts to strengthen the security of ICS have intensively used supervised machine learning to innovate traditional approaches.
Mokhtari et al. [11] proposed a new solution, called measurement intrusion detection system, based on the measurement data from supervisory control and data acquisition systems. In addition, the hardware-in-the-loop (HIL)-based augmented ICS (HAI) dataset, including actual data from power systems, was used to evaluate the system performance. The results confirmed that the random forest algorithm exhibited successful classification performance in the fault detection process with an accuracy of 99.76%.
Ahmed et al. [12] investigated three approaches to detect anomalies in solar power plants in India (near Gandikota, Andhra Pradesh). The first model was based on a physical model, the second on a support vector machine (SVM) regression model, and the third on an SVM classification model. Gray-wolf optimization algorithms were used for hyperparameter tuning for all models. The classification model demonstrated superior predictive capabilities with an accuracy of 97.3%, a precision of 85.71%, and a recall of 99.21%, outperforming the reference long short-term memory (LSTM) autoencoder model.
In addition to anomaly detection using supervised machine learning algorithms, some studies have applied unsupervised machine learning algorithms to identify and classify clusters of anomalous data. Yu et al. [13] proposed a cluster-based data analysis framework using recursive principal component analysis to address anomaly detection of changes in IoT system data and redundant sensor data aggregation. Sensor nodes were grouped into clusters, and all sensor data were transmitted to the cluster head using this algorithm to diagnose and aggregate the data. This framework can recursively update the parameters of the principal component analysis model in real time to adapt to changes in the IoT system. The proposed framework aggregated sensor data with high recovery accuracy and improved anomaly detection accuracy compared to existing algorithms.
However, these machine learning models are sometimes limited in their ability to adequately understand complex patterns or data structures. In high-dimensional or non-linear data, machine learning models can struggle to learn appropriate patterns. In addition, model performance can be degraded due to data imbalance or missing labels. Deep learning can handle more complex data structures than machine learning and has the ability to detect and interpret different types of anomalies. In addition, deep learning works effectively with large datasets, improving model performance. As these deep learning-based models have overcome the limitations of machine learning to promote the development of more accurate and reliable anomaly detection systems, recent focus has shifted to deep learning-based models and expanded research for more sophisticated anomaly detection and pattern recognition.
Perales Gómez et al. [14] proposed a methodology to generate reliable anomaly detection datasets in ICS in four stages: attack selection, attack deployment, traffic capture, and feature computation. This approach generated the Electra dataset for evaluating cybersecurity techniques in electrical traction substations in the railway industry. Fu et al. [15] introduced masked anomaly detection, a self-supervised masking task for anomaly detection in multivariate time series. This model can be trained using only unlabeled data, overcoming the limitations of traditional unsupervised anomaly detection methods. Seong et al. [16] established intrusion detection systems for multivariate time series data. They evaluated the anomaly detection performance of the stacked gated recurrent unit (GRU) model on the UNSW-NB15 and HAI 2.0 datasets.
Hao et al. [17] proposed a hybrid statistical-machine learning-based online model for anomaly detection in ICS to detect and quantify the cybersecurity risks of abnormal events. The model demonstrated a detection accuracy of 95% for nine anomalous events. Memarzadeh et al. [18] developed an unsupervised machine learning approach based on convolutional variational autoencoders. The approach improved and automated the identification of unknown vulnerabilities in flight operations and detected operationally critical anomalies in high-dimensional heterogeneous aeronautical time series. Tang et al. [19] proposed an interpretable multivariate time series anomaly detection method based on GRUs for ICS. This method used a graph neural network to learn relationships between sensors and used GRUs to identify anomalies. Experimental results on the Secure Water Treatment (SWaT) and Water Distribution (WADI) datasets showed that their proposed model achieved higher precision, recall, and area under the curve (AUC) compared to nine state-of-the-art models. In particular, their model improved detection precision by up to 15% and recall by up to 20%.
Among deep learning models, autoencoders, which consist of encoders and decoders, have demonstrated superior performance in anomaly detection problems. For example, Xie et al. [20] investigated the application of autoencoders and neural networks to detect malicious activities in ICS and evaluated the effects of a series of model structure modifications. A combination of one-dimensional (1D) convolutional neural network (CNN) and GRU was used to learn the spatio-temporal correlations and other dependencies between sensor and actuator parameters at each instant in order to more accurately predict the parameter values of sensors and actuators.
Su et al. [21] proposed OmniAnomaly, a novel stochastic recurrent neural network (RNN) for anomaly detection in multivariate time series. OmniAnomaly could provide an intuitive and effective method to interpret the detected entity anomalies based on the reconstruction probability. Zavrak et al. [22] analyzed the detection capabilities of autoencoder and variational autoencoder deep learning methods alongside the one-class SVM using a semi-supervised strategy. The results, calculated in terms of receiver operating characteristic curves and AUC metrics, indicated that the detection rate of the variational autoencoder was superior to that of the autoencoder and the one-class SVM. Liu et al. [23] proposed an adversarial sample attack and defense method using LSTM encoder-decoder (LSTM-ED) for ICS. This method generated adversarial samples according to the protocol specifications and introduced an LSTM-ED feature weight defense method (LSTM-FWED) to improve the robustness. Experimental results showed that the attack reduced the accuracy of the LSTM-ED model by an average of 66.26%, with a maximum generation time of 18 s. The LSTM-FWED method improved the AUC by 21.83% compared to the state-of-the-art methods.
Yang et al. [24] proposed an unsupervised learning-based traffic anomaly detection method for industrial cyber-physical systems. This method included a data preprocessing model, an LSTM-based unsupervised word segmentation model, and a 1D CNN and bi-directional encoder representations from transformers (BERT)-based autoencoder classification model. Experimental results on the Cyber-Physical Attack Dataset (CPAD) showed improvements in precision of 18.83%, recall of 22.3%, and F1 score of 20.60%. Audibert et al. [25] introduced USAD, an unsupervised anomaly detection model that combines variational autoencoders (VAEs) and GANs. The model uses the reconstruction error as the anomaly score. On the SWaT and WADI datasets, USAD outperformed other methods, achieving an F1 score of 0.79 and an average precision of 0.84. The performance of the model was robust to different parameter settings, such as downsampling rates and window sizes. In addition, USAD showed a significant reduction in training time compared to OmniAnomaly, with speed-up factors ranging from 216 to 1331 times.
Li et al. [26] proposed an unsupervised anomaly detection method, MAD-GAN, using generative adversarial networks (GANs) with LSTM networks as generators and discriminators. The method handles multivariate time series data by capturing temporal correlations. Experimental results on SWaT and WADI datasets showed that MAD-GAN achieved an F1 score of 0.23 for the SWaT dataset and outperformed other methods in terms of recall with values above 90% across different principal component resolutions. Specifically, the recall for the WADI dataset reached 95.34% using the second principal component. Tuli et al. [27] developed TranAD, which focuses on learning transactional patterns for anomaly detection using a deep learning architecture. The model uses a combination of transformers and meta-learning to capture complex patterns. Experimental results showed that TranAD achieved an average F1 score of 0.8802 on various datasets. It outperformed the baseline models, especially on the SMD and MSDS datasets, with F1 scores of 0.9605 and 0.9262, respectively. TranAD also showed significant improvements in terms of AUC, with increases of up to 11.69% over state-of-the-art methods.
Table 1 illustrates the comparative analysis of anomaly detection methods in industrial environments, showing both previous and current research studies. The relentless evolution of ICS integrated with IoT technologies has increased their vulnerability to sophisticated cyber threats. Given the inherent complexity and multivariate nature of ICS data, traditional anomaly detection methods often prove inadequate [28,29]. This reality necessitates the pursuit of novel solutions that leverage the capabilities of hybrid autoencoder models. To delineate the advances our research brings and to justify the necessity of our approaches, we present the following key research questions:

1. How do hybrid autoencoder models incorporating CNN, LSTM architectures improve anomaly detection in multivariate ICS data?
2. What advances do hybrid models offer in learning efficiency and anomaly detection accuracy for high-dimensional operational ICS data?
3. How do advanced unsupervised methods challenge and improve anomaly detection strategies in nonlinear ICS data visualization?
In this paper, we propose ConvBiLSTM-AE, which combines CNN and BiLSTM, as a solution to the ICS anomaly detection problem. Our approach focuses on leveraging the strengths of convolutional neural networks (CNNs) for spatial feature extraction and bidirectional long short-term memory networks (BiLSTMs) for capturing temporal dependencies in multivariate ICS data. This integration aims to address the challenges of traditional anomaly detection methods in handling the complex, nonlinear, and high-dimensional nature of ICS datasets. By employing an unsupervised training approach, ConvBiLSTM-AE can effectively learn representations without the need for labeled data, making it adaptable to different ICS environments. We highlight the potential of this model to improve anomaly detection accuracy and learning efficiency compared to existing technologies. The use of principal component analysis (PCA) to extract and visualize key features further aids in interpreting model behavior and validating its effectiveness. The HAI dataset, which simulates thermal and pumped storage power systems, serves as a benchmark to compare the proposed model with other state-of-the-art anomaly detection techniques.
The main contributions of this research are summarized as follows:
• Model performance is evaluated using the latest ICS datasets, and the unsupervised anomaly detection performance of deep learning models on the ICS dataset is analyzed to identify effective anomaly detection models.
• By evaluating the anomaly detection performance of hybrid autoencoder models, this study demonstrates that this hybrid modeling approach provides superior performance to other autoencoder models.
• To interpret the proposed model and analyze the data distribution, we apply PCA to the embedding features extracted from our encoder network and visualize the principal components.
This paper is organized as follows: Section 2 explains the datasets for the experiment and describes the autoencoder-based models for evaluation. Next, Section 3 presents the experimental procedure and results. Section 4 discusses the evaluated performance of the autoencoder-based models. Finally, Section 5 concludes the paper.
This section presents the publicly available datasets for the experiments and the autoencoder-based models used to compare the anomaly detection performance. The details of the autoencoder-based models are also provided. Fig. 1 provides a visual summary of the overall experimental process. The experiment performs a series of steps, from preprocessing the HAI dataset to training the autoencoder models, followed by evaluating and comparing the model performance.

Figure 1: Flow chart of the experiment process
This research uses the publicly available HAI dataset [30], developed from an ICS testbed using a HIL simulator with devices, including sensors, to simulate thermal and pumped storage power generation. To date, five versions of the HAI dataset have been released: 20.07, 21.03, 22.04, 23.05, and HAIEnd23.05. This study uses the HAI 23.05 dataset, excluding the endpoint of the latest HAI 23.05 version, which includes four types of processes: boiler process, turbine process, water treatment process, and HIL simulation. It consists of 87 variables, including the data measurement time (eventually corresponding to the variables in version 22.04). This dataset includes a normal scenario (consisting only of normal system data) and an attack scenario (containing attack signals at specific times).
The HAI dataset is particularly appropriate for this study because it represents the diversity and complexity of ICS. In addition, a substantial body of research has used the HAI dataset as a reference point, resulting in significant and insightful findings [31–33]. The ICS environment is characterized by the integration of various components, including sensors, actuators, and controllers, that work together to manage industrial processes. The HAI dataset reflects this complexity by simulating real industrial processes, such as thermal and hydroelectric power generation, that involve multiple interdependent systems and control strategies. By including different types of processes in the HAI dataset (e.g., boilers, turbines, and water treatment), it provides a comprehensive range of operational scenarios and potential anomalies, making it a robust benchmark for evaluating anomaly detection models.
As shown in Table 2, the experimental data, consisting of 87 variables, are normal scenario data that contain only normal signals for training and validation. These data are used to facilitate the learning of normal patterns by the model. Attack scenario data, which includes attack signals, is used to evaluate the performance of the trained model. Two separate evaluation datasets, measured at different times, are used for this purpose.

Fig. 2 visualizes the correlation coefficient heatmap of the HAI dataset in this study. The correlation heatmap analysis shows that some variables were excluded from the heatmap. These variables consist of only a single value across all observations and do not provide variability compared to other variables in the dataset; therefore, they cannot be considered in statistical analyses. In reconstruction-based models, such as autoencoders, these static variables do not help reduce reconstruction error. Autoencoders aim to learn an efficient representation of the input data, compress the data into lower-dimensional representations, and reconstruct data close to the original. However, variables that do not vary in this reconstruction process are unnecessary elements for learning significant features. Therefore, these static variables were excluded from the analysis to optimize training and reconstruction, reduce computational complexity, and reduce the risk of overfitting. This decision allows the autoencoder model to more effectively learn and reconstruct the essential structure of complex data, improving its generalizability and resulting in more accurate and reliable data representations.

Figure 2: Correlation heatmap of the training dataset
Temporal context learning plays a critical role in modeling and understanding the temporal relationships within data. To achieve this, variations of RNNs have been developed that can capture and maintain long-term dependencies. Among them, LSTM is the most widely used.
The LSTM network [34–36] is a successful algorithm for addressing vanishing or exploding gradient problems in RNNs. The LSTM is characterized by the following features:
• A vector called the internal cell state is maintained by each LSTM recurrent unit.
• The LSTM uses a forget gate to control the number of previous data retained and employs input and output gates to regulate the internal state.
• The LSTM controls the gates using sigmoid activation functions and hyperbolic tangent activation functions.
Fig. 3 represents the LSTM architecture, expressed as follows:

Figure 3: Understanding the architecture of the long short-term memory (LSTM) cell
The activation of the input gate
2.2.2 Bidirectional Long Short-Term Memory
Bidirectional LSTM [37] processes the input sequence in both directions to consider more context, enhancing performance by capturing information forward and backward in sequence data. This method employs two independent LSTM networks: one processes the input sequence in its original order and the other in reverse order. The formulation is expressed as follows:
The forward LSTM hidden state
2.3 One-Dimensional Convolutional Neural Network
The CNN in deep learning models is primarily used for image classification and computer vision tasks. However, it has recently been effectively applied to time series data processing. One-dimensional CNN [38,39] are extensively applied for pattern recognition and prediction in time series data and are designed to process data with a temporal order, where the input is arranged along the time axis. The relationship between previous and subsequent time steps is crucial. Thus, 1D CNN consider this temporal structure to process data and are helpful in recognizing temporal patterns, as demonstrated by the pseudo-code shown in Algorithm 1.

This study exclusively applied 1D CNN to process time series data to build a model specialized for time series. The 1D CNN can detect patterns at each time step and use this information to predict values for the next step. In this manner, 1D CNN can be employed in various time series data fields, such as stock price prediction, speech recognition, and signal processing [40]. Therefore, 1D CNN are acknowledged as potent tools for time series data analysis and prediction and are used in this study to design and implement the model architecture.
The deep autoencoder [41] is an unsupervised learning method used to encode and decode input data for reconstruction. An autoencoder learns a low-dimensional representation of input data to reconstruct the input through a neural network structure. A deep autoencoder consists of a neural network with multiple hidden layers, mapping input data to a low-dimensional feature space and decoding it to the original dimension to reconstruct the input data. The primary goal of an autoencoder is to learn a low-dimensional representation that best represents the input data. This process allows for extracting the main data features, removing noise or irrelevant information, and compressing the data.
Through these processes, the autoencoder learns an efficient representation of data and performs data reconstruction. Deep autoencoders apply multiple hidden layers to learn the complex structures of input data, extracting more complex features and more accurate reconstructions of the input data. Therefore, deep autoencoders are used to learn high-dimensional representations of input data for effective representation and reconstruction. This study employs a deep autoencoder to extract features and reduce the dimensions of time series data for anomaly detection. Deep autoencoders learn the complex structures of input data for data representation in anomaly detection, as demonstrated by the pseudo-code shown in Algorithm 2 [42].

During the experimental phase, autoencoder models are used for unsupervised anomaly detection. Reconstruction metrics are applied to each model of predictions to set a threshold, with values exceeding this threshold considered anomalies. Models include convolutional autoencoder (CAE), LSTM autoencoder (LSTM-AE), bidirectional LSTM autoencoder (BiLSTM-AE), and hybrid autoencoders combining RNN-based cells and CNN, such as convolutional BiLSTM-AE (ConvBiLSTM-AE). The detailed implementation of these methods can be found in Algorithm 3.

The BiLSTM-AE consists of BiLSTM cells. These models learn by considering the temporal characteristics of time series data, allowing the bidirectional structure to apply information from the past and future [43–45]. The ConvBiLSTM-AE is configured by adding a 1D CNN layer to the first layer of the encoder and the last layer of the decoder in BiLSTM-AE. This structure better learns complex patterns in time series data and improves the accuracy of anomaly detection. The combination of CNN and RNN layers makes hybrid models more robust to noise and outliers in the data. The CNN layers help extract features from vectors and reduce their dimension, while the RNN layers ensure that the temporal sequence is modeled accurately, leading to more reliable anomaly detection [46,47].
In this section, we present the results of the ablation study for the hybrid model. We analyze the two-dimensional embedding of the test data by extracting the encoder features and performing PCA for dimensionality reduction. We also present the results of applying a state-of-the-art unsupervised anomaly detection model and compare its performance with the hybrid model.
The autoencoder model experiments were conducted in the Google Collaboratory Pro environment on an NVIDIA T4 Tensor Core GPU, using the TensorFlow deep learning framework for model training. The performance of each model was evaluated using functions from the scikit-learn library.
The training data consisted entirely of normal data, and the experiment was performed using unsupervised learning, which restricts the choice of variables; thus, only the timestamp variable, representing the time of measurement, was excluded from the input values. In addition, min-max normalization is performed to ensure that when the model reconstructs the anomaly data within the evaluation dataset, the reconstructed anomaly data are clearly highlighted:
This section describes the performance metrics and model hyperparameters employed to assess the anomaly detection capabilities of each model.
Fig. 4 visualizes the overall process of calculating the reconstruction error through the autoencoder model. The experiment focuses on determining the timing of an anomaly based on the reconstruction error. Accordingly, Eq. (11) is applied to calculate the reconstruction error between the model input

Figure 4: Process of calculating the reconstruction error of a deep autoencoder model
Following this process, a sequence of reconstruction error points (
The threshold (
The confusion matrix evaluates the model performance and is a visual matrix that represents the relationship between the model predictions and actual labels, comprising the following four key elements:
• True positives (TP): Cases where the model accurately identifies anomaly data, representing the count of actual anomalies correctly predicted.
• False positives (FP): Cases where the model incorrectly identifies normal data as anomalies, indicating the count of normal data predicted as anomalies.
• True negatives (TN): Cases where the model accurately identifies normal data, representing the count of correctly predicted normal data.
• False negatives (FN): Cases where the model incorrectly identifies anomaly data as normal, indicating the count of anomalies mistakenly predicted as normal.
Precision is calculated as the ratio of TPs to the sum of TPs and FPs, indicating how accurately the model identifies anomaly data:
Recall is calculated as the ratio of TPs to the sum of TPs and FNs, representing the proportion of identified anomalies out of all the anomalies that the model should detect:
The F1 score is calculated as the harmonic mean of precision and recall and is used as a comprehensive performance metric for imbalanced class problems:
Therefore, the confusion matrix allows for a comprehensive performance evaluation. Combining precision, recall, and the F1 score quantifies the performance of the anomaly detection model, assessing how effectively the model detects anomalies.
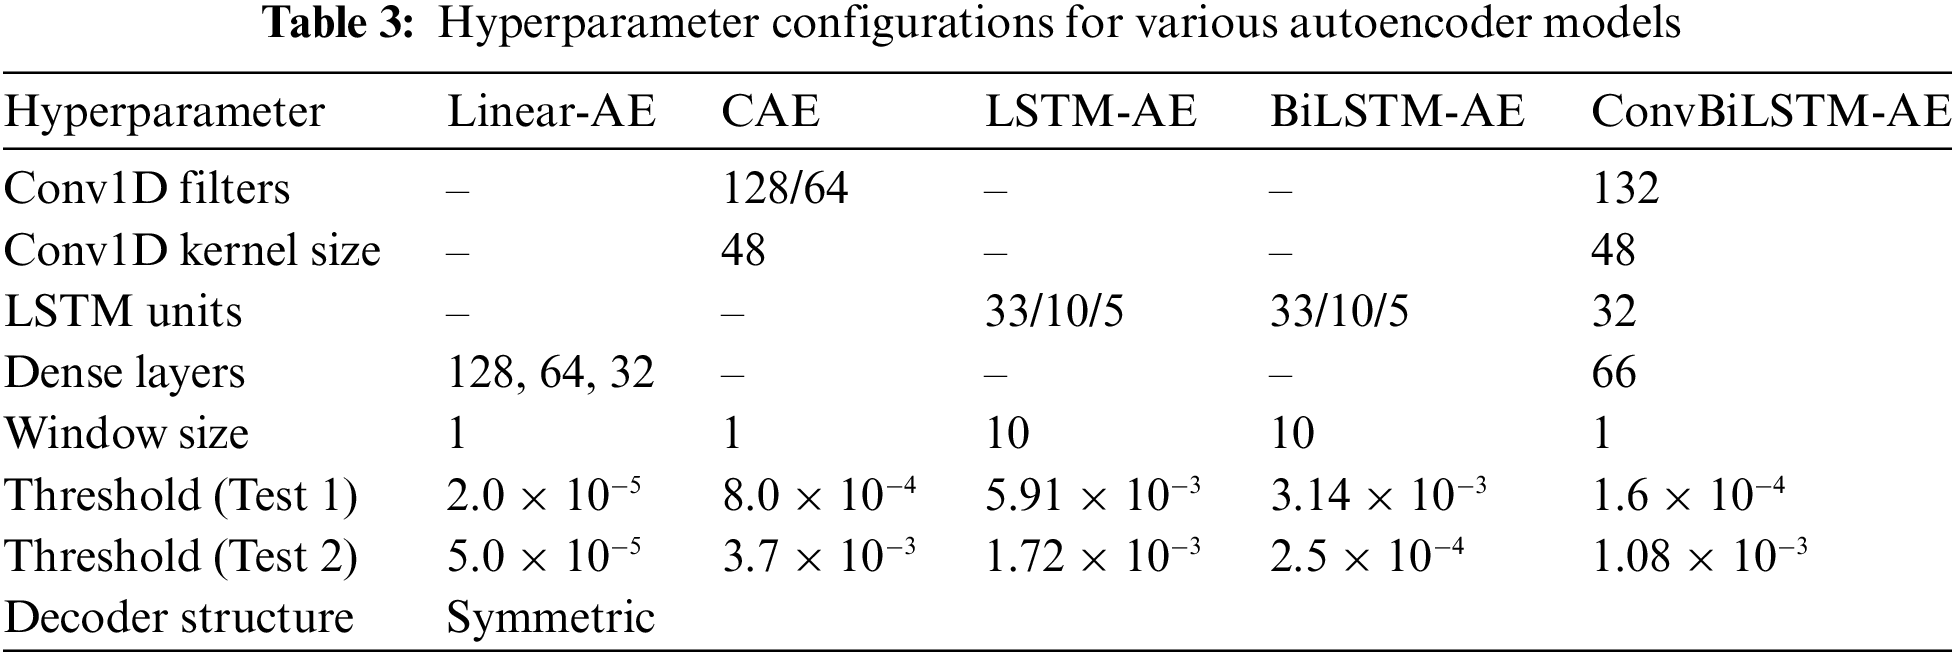
In this section, we presented the results of our ablation study, focusing on the impact of removing components from the hybrid model structure, such as linear layers, CNN layers, LSTM layers, and BiLSTM layers. We evaluated five variants: linear encoder, convolutional encoder, LSTM encoder, bi-directional LSTM encoder, and convolutional bi-directional LSTM encoder. The linear autoencoder (Linear-AE) served as a basic model and used simple linear layers to reconstruct the input data. This model helped establish a basic performance metric against which more complex architectures were evaluated. The Convolutional Autoencoder (CAE) used Conv1D layers to extract latent features from the input data and reconstruct it based on these features. Key hyperparameters for this model included window size, number of filters, kernel size, and strides. The Conv1D layers allowed the model to capture spatial dependencies within the data, improving the quality of the reconstruction.
The LSTM autoencoder (LSTM-AE) used LSTM layers to capture temporal dependencies in the data. The critical hyperparameters for this model were the number of LSTM layers and the number of units per LSTM layer. The LSTM layers were adept at learning long-term dependencies and patterns within time series data, making them suitable for sequential data reconstruction. The Bidirectional LSTM autoencoder (BiLSTM-AE) extended the capabilities of the LSTM-AE by using bidirectional LSTM layers. These layers processed the input data in both forward and backward directions, thereby capturing temporal dependencies more comprehensively. The hyperparameters for this model were similar to those of the LSTM-AE, focusing on the number of layers and units per layer. The bidirectional nature of the LSTM layers allowed the model to understand the context of both past and future data points, improving anomaly detection performance.
The convolutional bidirectional LSTM autoencoder (ConvBiLSTM-AE) integrated Conv1D layers with BiLSTM layers to extract spatial and temporal features simultaneously. This hybrid approach exploited the strengths of both convolutional and recurrent layers. Critical hyperparameters included the number of Conv1D layers, number of filters, kernel size, strides, and number of BiLSTM layers and units. The Conv1D layers initially captured spatial features, which were then processed by the BiLSTM layers to extract temporal patterns, resulting in a robust feature representation for anomaly detection. Training hyperparameters for all autoencoder models included a batch size of 512, the Adam optimizer, a mean squared error (MSE) loss function, and 60 epochs. These consistent training settings ensured a fair comparison between different model architectures. Table 3 summarizes the hyperparameter details of each model. We used precision, recall, F1 score, accuracy, and area under the curve (AUC-ROC) as evaluation metrics. The results are summarized in Tables 4 and 5 for two different test scenarios.


The results of Test 1, shown in Table 4, demonstrated that the ConvBiLSTM-AE model achieved the highest performance across all metrics with an F1 score of 0.783, indicating its superior ability to detect anomalies compared to the other models. The CAE model also performed well with an F1 score of 0.721, followed by the BiLSTM-AE model with an F1 score of 0.648. The Linear-AE and LSTM-AE models showed comparatively lower performance with F1 scores of 0.444 and 0.543, respectively.
In Test 2, as shown in Table 5, the ConvBiLSTM-AE model again outperformed the other models with an F1 score of 0.414. The CAE model followed with an F1 score of 0.405. The Linear-AE model had an F1 score of 0.388, showing a decrease in performance compared to Test 1. The LSTM-AE and BiLSTM-AE models showed significantly lower performance in Test 2, with F1 scores of 0.065 and 0.064, respectively. The ablation study highlighted the effectiveness of hybrid models, particularly the ConvBiLSTM-AE, in anomaly detection tasks.
These results demonstrate the potential benefits of incorporating both convolutional and recurrent layers into autoencoder architectures to improve their performance in detecting anomalies in complex datasets. To further illustrate the performance of the models, several visualizations are provided, including ROC curves, precision-recall curves, model validation loss over epochs, and confusion matrices.
Fig. 5 shows the ROC curves for Test 1 and Test 2. These curves plot the true positive rate (TPR) against the false positive rate (FPR) for different threshold settings. In both tests, the ConvBiLSTM-AE model has the highest AUC-ROC, demonstrating the superior performance of the hybrid model. Fig. 6 shows the precision-recall curves for Test 1 and Test 2, providing insight into the precision-recall trade-off for each model.

Figure 5: Receiver operating characteristic (ROC) curves. (a) Test 1; (b) Test 2. The x-axis (false positive rate) and y-axis (true positive rate) are dimensionless ratios used to evaluate model performance, both of which are standard metrics in ROC analysis

Figure 6: Precision-recall curves. (a) Test 1; (b) Test 2. The x-axis (recall) and y-axis (precision) are dimensionless ratios used to evaluate model performance, both of which are standard metrics in precision-recall analysis
In Fig. 5a, the ConvBiLSTM-AE model has the highest AUC-ROC of 0.929, indicating its superior performance. It is followed by the CAE model with an AUC-ROC of 0.911, BiLSTM-AE with an AUC-ROC of 0.891, LSTM-AE with an AUC-ROC of 0.882, and Linear-AE with an AUC-ROC of 0.874. In Fig. 5b, the BiLSTM-AE model has the highest AUC-ROC of 0.700, followed by CAE with an AUC-ROC of 0.683, Linear-AE with an AUC-ROC of 0.678, ConvBiLSTM-AE with an AUC-ROC of 0.670, and LSTM-AE with a significantly lower AUC-ROC of 0.504.
In Fig. 6a, the ConvBiLSTM-AE model has the highest area under the curve (AUC-PRC) of 0.806, followed by CAE with an AUC-PRC of 0.724, BiLSTM-AE with an AUC-PRC of 0.620, Linear-AE with an AUC-PRC of 0.491, and LSTM-AE with an AUC-PRC of 0.472. In Fig. 6b, the CAE model has the highest AUC-PRC of 0.351, closely followed by BiLSTM-AE with an AUC-PRC of 0.340. The ConvBiLSTM-AE model has an AUC-PRC of 0.324, Linear-AE has an AUC-PRC of 0.318, and LSTM-AE has the lowest AUC-PRC of 0.038.
Fig. 7 shows the validation loss over epochs for each model, which is plotted to show the training progress and convergence of the models. The validation loss is measured by the MSE. The ConvBiLSTM-AE model achieves the lowest validation loss, indicating better generalization compared to the other models. The CAE and BiLSTM-AE models also show good performance with relatively low validation loss. However, the LSTM-AE model has a higher validation loss, indicating overfitting or suboptimal training.

Figure 7: Validation loss over epochs for each model
Fig. 8 shows the confusion matrices for the ConvBiLSTM-AE model in both Test 1 and Test 2, providing detailed insight into the classification performance. These results further illustrate the robustness of the ConvBiLSTM-AE model in detecting anomalies.

Figure 8: Confusion matrix results for ConvBiLSTM-AE
3.4 Comparative Analysis with State-of-the-Art Models
In this section, we compared the performance of the ConvBiLSTM-AE model with other state-of-the-art unsupervised anomaly detection models. The models compared were USAD [25], MAD-GAN [26], and TranAD [27]. The performance metrics used for the evaluation were accuracy, precision, recall, F1 score, and AUC-ROC. The anomaly detection thresholds for each model were also considered: for Test 1, the thresholds were 0.212 for USAD, 0.2 for MAD-GAN, and 3.63 × 10⁻³ for TranAD; for Test 2, the thresholds were 0.087 for USAD, 0.4 for MAD-GAN, and 7.97 × 10⁻³ for TranAD. The results are summarized in Tables 6 and 7 for two different test scenarios.


The comparison results in Table 6 for Test 1 show that the ConvBiLSTM-AE model significantly outperformed the other models in terms of F1 score, reaching 0.783. This indicates its superior ability to balance precision and recall. The TranAD model also performed well with an F1 score of 0.695, which was higher than the performance of USAD and MAD-GAN. The MAD-GAN model had the highest recall with 0.601, but its precision was very low, resulting in a much lower F1 score of 0.121.
In Table 7 for Test 2, the ConvBiLSTM-AE model shows high performance with a precision of 0.842 and an F1 score of 0.670. TranAD has a comparable precision of 0.829 but a lower F1 score of 0.390 due to its lower recall. The USAD and MAD-GAN models perform poorly in Test 2, with significantly lower F1 scores of 0.093 and 0.102, respectively.
The performance of ConvBiLSTM-AE in both test scenarios highlights its robustness and effectiveness in detecting anomalies compared to other models. The inclusion of convolutional and recurrent layers in its architecture likely contributes to its superior performance by effectively capturing both spatial and temporal features in the data. These results further validate the effectiveness of hybrid models in anomaly detection tasks, particularly in complex datasets where both spatial and temporal dynamics are critical. The ConvBiLSTM-AE model, with its balanced precision, recall, and F1 score, demonstrates a strong capability for robust anomaly detection in various scenarios.
3.5 PCA Analysis of Autoencoder Embeddings
This study evaluated the effectiveness of an autoencoder model encoder in embedding data based on the model performance. The embeddings extracted from the encoder were analyzed using the PCA dimension reduction algorithm to evaluate the quality of the model embeddings. During the inference process on test data using the trained model, the embeddings were extracted from the encoder just before they were input to the decoder. These embeddings, obtained from the low-dimensional latent space, effectively captured the main features of the original data.
PCA was applied to the extracted embedded data for dimensionality reduction and analysis. PCA converts high-dimensional data into two dimensions, allowing for visual interpretation. This visualization illustrates the main structures and patterns of the data embedded by the encoder.
Figs. 9 and 10 visualize the PCA dimensionality reduction results of the feature extracted from the encoder of the ConvBiLSTM model into two-dimensional components using the Test 1 and Test 2 inputs.

Figure 9: PCA visualization with labels for ConvBiLSTM encoder output on Test 1

Figure 10: PCA visualization with labels for ConvBiLSTM encoder output on Test 2
Fig. 9 shows that the embedding of the Test 1 anomaly data overlaps the distribution of the anomaly data with the normal data, but a significant portion of the anomaly data is located on the left side. In contrast, the embedding of the Test 2 anomaly data was less effective. The embedding of the Test 2 anomaly data shows that some anomaly data are located in the upper right corner, but because the distributions of most of the anomaly data and normal data overlap significantly, the detection performance of the model on the Test 2 dataset decreases. This result suggests that the performance of the hybrid model may vary depending on the characteristics of the dataset.
The ConvBiLSTM-AE model demonstrated superior anomaly detection performance compared to other autoencoder-based models. In Test 1, the ConvBiLSTM-AE model achieved a precision of 0.87 and an F1 score of 0.783. Despite a drop in performance for Test 2, the ConvBiLSTM-AE model continued to outperform other models with an F1 score of 0.414. These results suggest that the hybrid architecture combining CNN and BiLSTM layers improves the performance of the model by capturing complex temporal patterns and dependencies in the data.
The inclusion of convolutional layers facilitated the extraction of robust features from time series data, which is critical for effective anomaly detection. The differences in performance between Test 1 and Test 2 can be attributed to several factors, including the complexity and diversity of the anomaly patterns in Test 2, changes in the data distributions, and the choice of reconstruction error thresholds. In particular, the more complex and varied anomaly patterns in Test 2 likely posed a greater challenge to the models’ detection capabilities than those in Test 1.
The innovative aspect of the ConvBiLSTM-AE model lies in its hybrid architecture, which integrates CNN with BiLSTM networks. This integration not only facilitates the simultaneous acquisition of spatial and temporal features but also represents a significant advance in the refinement of anomaly detection, surpassing the capabilities of traditional autoencoder models.
The ConvBiLSTM-AE model shows remarkable improvements in handling high-dimensional multivariate time series data compared to existing techniques. While traditional autoencoders have proven effective in many scenarios, they often fail to capture the complex temporal dynamics present in industrial datasets. The ConvBiLSTM-AE model addresses these shortcomings by leveraging the strengths of both CNNs and RNNs.
For example, CNN layers reduce the dimensionality of the input data and highlight essential features before passing them to the bidirectional LSTM layers. This process allows the temporal layers to operate on a more refined and representative subset of the data, improving anomaly detection performance.
Detailed comparisons with traditional methods such as simple autoencoders, as well as recent unsupervised anomaly detection methods, show that the hybrid model not only achieves higher accuracy and recall rates but also demonstrates superior robustness across various test scenarios. This robustness can be attributed to the improved ability to learn and generalize from complex and noisy data environments commonly found in industrial control systems.
The performance comparison with the latest models demonstrates the high detection capability of the ConvBiLSTM-AE model. In Test 1, the ConvBiLSTM-AE model achieved an F1 score of 0.783, outperforming other models such as USAD and MAD-GAN, which had F1 scores of 0.370 and 0.121, respectively. Although all models showed reduced performance in Test 2, the ConvBiLSTM-AE still showed relatively high performance with an F1 score of 0.414. In contrast, other models such as TranAD, USAD, and MAD-GAN had lower F1 scores compared to the ConvBiLSTM-AE.
Building on our findings with the ConvBiLSTM-AE model, future research should explore additional areas not addressed in our current study to increase the impact and applicability of anomaly detection technologies in industrial systems. The following areas are important directions for future research:
• Building upon our findings with ConvBiLSTM-AE model, future research should investigate additional areas not addressed in our current study to enhance the impact and applicability of anomaly detection technologies in industrial systems. The following areas represent key directions for future research:
• Real-time anomaly detection: Integrating on-line fault detection for dynamic industrial systems could significantly improve the responsiveness to evolving anomaly patterns, as suggested by the results of [48].
• Advanced dataset development: Creating more comprehensive and realistic datasets, as emphasized in [49], will improve model training and validation, equipping systems to handle a wider range of anomaly scenarios.
• Feature reduction techniques: Implementing advanced techniques such as singular value decomposition (SVD), as highlighted in [50], could refine feature selection processes and improve model efficiency in high-dimensional industrial IoT environments.
• Distributed learning approaches: Federated learning, as discussed in [51], offers promising advances for decentralized model training that can improve privacy and model scalability in distributed systems.
• Hybrid intrusion detection systems (IDS): The development of hybrid IDSs that combine multiple detection methods could provide more nuanced threat detection capabilities in cyber-physical systems, consistent with the innovations in [52] and [53].
These focused research avenues promise to significantly advance the scope and effectiveness of anomaly detection models, ensuring that industrial security technologies evolve in tandem with emerging industrial challenges and technological capabilities.
In this study, we conducted an ablation study on ConvBiLSTM-AE, an unsupervised learning-based hybrid autoencoder model for anomaly detection, using the HAI 23.05 dataset, which mimics industrial control systems (ICS). The results of the ablation study showed that the hybrid autoencoder model combining CNN and BiLSTM structures outperformed single CNN, LSTM, and BiLSTM autoencoder structures in anomaly detection performance. In addition, we extracted the autoencoder features of the hybrid model and performed a two-dimensional PCA to analyze the distribution of the anomaly data.
We also experimentally evaluated the detection capabilities of the ConvBiLSTM-AE model against the latest unsupervised anomaly detection models. As a result, the ConvBiLSTM-AE model achieved a high F1 score, demonstrating its effectiveness in learning and detecting complex temporal anomaly patterns. Compared to the latest anomaly detection models, the ConvBiLSTM-AE model showed superior performance. This indicates that autoencoders can more accurately learn the complex structure of ICS data and effectively detect various anomaly patterns.
These research results contribute to the body of research on anomaly detection in ICS environments using machine learning and deep learning technologies, and enhance our understanding of how unsupervised learning-based models can be effectively applied in environments where anomalies are rare. This study provides important technical insights for improving the stability and security of ICS.
Future research could focus on improving the generalizability of the model across different ICS environment datasets. Understanding the reasoning behind model predictions is critical to gaining confidence and facilitating real-world deployment of these models in industrial environments. Implementing dynamic thresholding techniques, such as moving average or exponentially weighted moving average, can further improve detection accuracy by adapting to data variability in real time.
Another promising direction for future research is to integrate these models into real-time monitoring systems to enable continuous anomaly detection and timely response to potential security threats. In conclusion, this study confirmed that unsupervised learning-based autoencoder models, especially the ConvBiLSTM-AE hybrid model, are effective approaches for anomaly detection in industrial systems. These findings are expected to advance machine learning and deep learning technologies and contribute to the safety and efficiency of ICS environments. Continued research in this area will further improve the accuracy, robustness, and interpretability of the models, thus promoting the development of safer and more reliable industrial systems.
Acknowledgement: We would like to sincerely thank the editors for expertly guiding the review process and the two anonymous reviewers for their valuable feedback and thoughtful suggestions. We would also like to express our deep gratitude to Dr. Hyeonwoo Kim for his invaluable help in writing the code for the benchmark models and for his cooperation in addressing the reviewers’ comments and suggestions.
Funding Statement: This research was supported by the Culture, Sports, and Tourism R&D Program through the Korea Creative Content Agency grant funded by the Ministry of Culture, Sports, and Tourism in 2024 (Project Name: Development of Distribution and Management Platform Technology and Human Resource Development for Blockchain-Based SW Copyright Protection, Project Number: RS-2023-00228867, Contribution Rate: 100%) and also supported by the Soonchunhyang University Research Fund.
Author Contributions: Conceptualization, Byeongcheon Lee and Sangmin Kim; methodology, Byeongcheon Lee; software, Byeongcheon Lee and Sangmin Kim; validation, Muazzam Maqsood and Jihoon Moon; formal analysis, Muazzam Maqsood; investigation, Sangmin Kim and Muazzam Maqsood; resources, Byeongcheon Lee and Sangmin Kim; data curation, Byeongcheon Lee; writing—original draft preparation, Byeongcheon Lee; writing—review and editing, Jihoon Moon and Seungmin Rho; visualization, Byeongcheon Lee and Jihoon Moon; supervision, Jihoon Moon and Seungmin Rho; project administration, Seungmin Rho; funding acquisition, Seungmin Rho. All authors reviewed the results and approved the final version of the manuscript.
Availability of Data and Materials: This research uses the HAI dataset, which is publicly available to facilitate ICS security studies. Specifically, we used the HAI 23.05 version, highlighting normal operation and targeted attack scenarios. The dataset, part of a series developed from a HIL simulation testbed, is available for further academic exploration at github.com/icsdataset/hai, supporting the advancement of security research.
Ethics Approval: Not applicable.
Conflicts of Interest: The authors declare that they have no conflicts of interest to report regarding the present study.
References
1. Y. Liu, S. Li, X. Wang, and L. Xu, “A review of hybrid cyber threats modelling and detection using artificial intelligence in IIoT,” Comput. Model. Eng. Sci., vol. 140, no. 2, pp. 1233–1261, May 2024. doi: 10.32604/cmes.2024.046473. [Google Scholar] [CrossRef]
2. S. McLaughlin et al., “The cybersecurity landscape in industrial control systems,” Proc. IEEE, vol. 104, no. 5, pp. 1039–1057, May 2016. doi: 10.1109/JPROC.2015.2512235. [Google Scholar] [CrossRef]
3. N. Alturki et al., “Efficient and secure IoT based smart home automation using multi-model learning and blockchain technology,” Comput. Model. Eng. Sci., vol. 139, no. 3, pp. 3387–3415, Mar. 2024. doi: 10.32604/cmes.2023.044700. [Google Scholar] [CrossRef]
4. M. Gupta, M. Abdelsalam, S. Khorsandroo, and S. Mittal, “Security and privacy in smart farming: Challenges and opportunities,” IEEE Access, vol. 8, pp. 34564–34584, Feb. 2020. doi: 10.1109/ACCESS.2020.2975142. [Google Scholar] [CrossRef]
5. A. Valdes and S. Cheung, “Intrusion monitoring in process control systems,” presented at the 42nd Hawaii Int. Conf. Syst. Sci., Waikoloa, HI, USA, Jan. 5–8, 2009, pp. 1–7. [Google Scholar]
6. B. Zhu, A. Joseph, and S. Sastry, “A taxonomy of cyber attacks on SCADA systems,” presented at the 2011 Int. Conf. Internet Things 4th Int. Conf. Cyber, Phys. Soc. Comput., Dalian, China, Oct. 19–22, 2011, pp. 380–388. [Google Scholar]
7. R. Wang, Y. Zhou, G. Luo, P. Chen, and D. Peng, “Cross-dimension attentive feature fusion network for unsupervised time-series anomaly detection,” Comput. Model. Eng. Sci., vol. 139, no. 3, pp. 3011–3027, Mar. 2024. doi: 10.32604/cmes.2023.047065. [Google Scholar] [CrossRef]
8. D. S. Terzi, R. Terzi, and S. Sagiroglu, “Big data analytics for network anomaly detection from NetFlow data,” presented at the 2017 Int. Conf. Comput. Sci. Eng. (UBMK), Antalya, Turkey, Oct. 5–8, 2017, pp. 592–597. [Google Scholar]
9. R. Primartha and B. A. Tama, “Anomaly detection using random forest: A performance revisited,” presented at the 2017 Int. Conf. Data Softw. Eng. (ICoDSE), Palembang, Indonesia, Nov. 1–2, 2017, pp. 1–6. [Google Scholar]
10. A. Angelopoulos et al., “Tackling faults in the Industry 4.0 era—A survey of machine-learning solutions and key aspects,” Sensors, vol. 20, no. 1, 2019, Art. no. 109. doi: 10.3390/s20010109. [Google Scholar] [PubMed] [CrossRef]
11. S. Mokhtari, A. Abbaspour, K. K. Yen, and A. Sargolzaei, “A machine learning approach for anomaly detection in industrial control systems based on measurement data,” Electronics, vol. 10, no. 4, Feb. 2021, Art. no. 407. doi: 10.3390/electronics10040407. [Google Scholar] [CrossRef]
12. Q. I. Ahmed, H. Attar, A. Amer, M. A. Deif, and A. A. Solyman, “Development of a hybrid support vector machine with grey wolf optimization algorithm for detection of the solar power plants anomalies,” Systems, vol. 11, no. 5, Apr. 2023, Art. no. 237. doi: 10.3390/systems11050237. [Google Scholar] [CrossRef]
13. T. Yu, X. Wang, and A. Shami, “Recursive principal component analysis-based data outlier detection and sensor data aggregation in IoT systems,” IEEE Internet Things J., vol. 4, no. 6, pp. 2207–2216, Dec. 2017. doi: 10.1109/JIOT.2017.2756025. [Google Scholar] [CrossRef]
14. A. L. Perales Gómez et al., “On the generation of anomaly detection datasets in industrial control systems,” IEEE Access, vol. 7, pp. 177460–177473, Dec. 2019. doi: 10.1109/ACCESS.2019.2958284. [Google Scholar] [CrossRef]
15. Y. Fu and F. Xue, “MAD: Self-supervised masked anomaly detection task for multivariate time series,” presented at the 2022 Int. Joint Conf. Neural Netw. (IJCNN), Padua, Italy, Jul. 18–23, 2022, pp. 1–8. [Google Scholar]
16. C. Seong, Y. Song, J. Hyun, and Y. G. Cheong, “Towards building intrusion detection systems for multivariate time-series data,” presented at the Silicon Val. Cybersecurity Conf., San Jose, CA, USA, Dec. 2–3, 2021, pp. 45–56. [Google Scholar]
17. W. Hao, T. Yang, and Q. Yang, “Hybrid statistical-machine learning for real-time anomaly detection in industrial cyber-physical systems,” IEEE Trans. Autom. Sci. Eng., vol. 20, no. 1, pp. 32–46, Jan. 2023. doi: 10.1109/TASE.2021.3073396. [Google Scholar] [CrossRef]
18. M. Memarzadeh, B. Matthews, and I. Avrekh, “Unsupervised anomaly detection in flight data using convolutional variational auto-encoder,” Aerospace, vol. 7, no. 8, Aug. 2020, Art. no. 115. doi: 10.3390/aerospace7080115. [Google Scholar] [CrossRef]
19. C. Tang, L. Xu, B. Yang, Y. Tang, and D. Zhao, “GRU-based interpretable multivariate time series anomaly detection in industrial control system,” Comput. Secur., vol. 127, Apr. 2023, Art. no. 103094. doi: 10.1016/j.cose.2023.103094. [Google Scholar] [CrossRef]
20. X. Xie, B. Wang, T. Wan, and W. Tang, “Multivariate abnormal detection for industrial control systems using 1D CNN and GRU,” IEEE Access, vol. 8, pp. 88348–88359, May 2020. doi: 10.1109/ACCESS.2020.2993335. [Google Scholar] [CrossRef]
21. Y. Su et al., “Robust anomaly detection for multivariate time series through stochastic recurrent neural network,” presented at the 25th ACM SIGKDD Int. Conf. Knowl. Discov. Data Min., Anchorage, AK, USA, Aug. 4–8, 2019, pp. 2828–2837. [Google Scholar]
22. S. Zavrak and M. Iskefiyeli, “Anomaly-based intrusion detection from network flow features using variational autoencoder,” IEEE Access, vol. 8, pp. 108346–108358, Jun. 2020. doi: 10.1109/ACCESS.2020.3001350. [Google Scholar] [CrossRef]
23. Y. Liu, L. Xu, S. Yang, D. Zhao, and X. Li, “Adversarial sample attacks and defenses based on LSTM-ED in industrial control systems,” Comput. Secur., vol. 140, May 2024, Art. no. 103750. doi: 10.1016/j.cose.2024.103750. [Google Scholar] [CrossRef]
24. T. Yang, Z. Jiang, P. Liu, Q. Yang, and W. Wang, “A traffic anomaly detection approach based on unsupervised learning for industrial cyber-physical system,” Know.-Based Syst., vol. 279, Nov. 2023, Art. no. 110949. doi: 10.1016/j.knosys.2023.110949. [Google Scholar] [CrossRef]
25. J. Audibert, P. Michiardi, F. Guyard, S. Marti, and M. A. Zuluaga, “USAD: Unsupervised anomaly detection on multivariate time series,” presented at the 26th ACM SIGKDD Int. Conf. Knowl. Discov. Data Min., CA, USA, Jul. 6–10, 2020, pp. 3395–3404. [Google Scholar]
26. D. Li et al., “MAD-GAN: Multivariate anomaly detection for time series data with generative adversarial networks,” presented at the Int. Conf. Artif. Neural Netw., Munich, Germany, Sep. 17–19, 2019, pp. 703–716. [Google Scholar]
27. S. Tuli, G. Casale, and N. R. Jennings, “TranAD: Deep transformer networks for anomaly detection in multivariate time series data,” in Proc. VLDB Endow., Sydney, Australia, Feb. 2022, vol. 15, no. 6, pp. 1201–1214. doi: 10.14778/3514061.3514067. [Google Scholar] [CrossRef]
28. M. A. Belay, S. S. Blakseth, A. Rasheed, and P. Salvo Rossi, “Unsupervised anomaly detection for IoT-based multivariate time series: Existing solutions, performance analysis and future directions,” Sensors, vol. 23, no. 5, Feb. 2023. Art. no. 2844. doi: 10.3390/s23052844. [Google Scholar] [PubMed] [CrossRef]
29. G. Pang, C. Shen, L. Cao, and A. V. den Hengel, “Deep learning for anomaly detection: A review,” ACM Comput. Surv., vol. 54, no. 2, pp. 1–38, Mar. 2021. doi: 10.1145/3439950. [Google Scholar] [CrossRef]
30. H. K. Shin, W. Lee, S. Choi, J. H. Yun, and B. G. Min, “HAI (HIL-based augmented ICS) security dataset,” GitHub, 2023. Accessed: Mar. 1, 2024. [Online]. Available: https://github.com/icsdataset/hai [Google Scholar]
31. W. -H. Choi and J. Kim, “Unsupervised learning approach for anomaly detection in industrial control systems,” Appl. Syst. Innov., vol. 7, no. 2, Feb. 2024, Art. no. 18. doi: 10.3390/asi7020018. [Google Scholar] [CrossRef]
32. G. -Y. Kim, S. -M. Lim, and I. -C. Euom, “A study on performance metrics for anomaly detection based on industrial control system operation data,” Electronics, vol. 11, no. 8, Apr. 2022, Art. no. 1213. doi: 10.3390/electronics11081213. [Google Scholar] [CrossRef]
33. X. Yang, E. Howley, and M. Schukat, “ADT: Time series anomaly detection for cyber-physical systems via deep reinforcement learning,” Comput. Secur., vol. 141, Jun. 2024, Art. no. 103825. doi: 10.1016/j.cose.2024.103825. [Google Scholar] [CrossRef]
34. B. Lindemann, B. Maschler, N. Sahlab, and M. Weyrich, “A survey on anomaly detection for technical systems using LSTM networks,” Comput. Ind., vol. 131, Oct. 2021, Art. no. 103498. doi: 10.1016/j.compind.2021.103498. [Google Scholar] [CrossRef]
35. X. Zhou, Y. Hu, W. Liang, J. Ma, and Q. Jin, “Variational LSTM enhanced anomaly detection for industrial big data,” IEEE Trans. Ind. Inform., vol. 17, no. 5, pp. 3469–3477, May 2021. doi: 10.1109/TII.2020.3022432. [Google Scholar] [CrossRef]
36. M Said Elsayed, N. A. Le-Khac, S. Dev, and A. D. Jurcut, “Network anomaly detection using LSTM based autoencoder,” presented at the 16th ACM Symp. QoS Sec. Wireless Mobile Netw, Alicante, Spain, Nov. 16–20, 2020, pp. 37–45. [Google Scholar]
37. A. Graves and J. Schmidhuber, “Framewise phoneme classification with bidirectional LSTM and other neural network architectures,” Neural Netw., vol. 18, no. 5–6, pp. 602–610, Aug. 2005. doi: 10.1016/j.neunet.2005.06.042. [Google Scholar] [PubMed] [CrossRef]
38. W. Tang, G. Long, L. Liu, T. Zhou, M. Blumenstein and J. Jiang, “Omni-scale CNNs: A simple and effective kernel size configuration for time series classification,” presented at the Int. Conf. Learn. Rep. (ICLR), Virtual, Apr. 25–29, 2022, pp. 1–17. [Google Scholar]
39. E. U. H. Qazi, A. Almorjan, and T. Zia, “A one-dimensional convolutional neural network (1D-CNN) based deep learning system for network intrusion detection,” Appl. Sci., vol. 12, no. 16, Aug. 2022, Art. no. 7986. doi: 10.3390/app12167986. [Google Scholar] [CrossRef]
40. X. Wang, D. Mao, and X. Li, “Bearing fault diagnosis based on vibro-acoustic data fusion and 1D-CNN network,” Measurement, vol. 173, Mar. 2021, Art. no. 108518. doi: 10.1016/j.measurement.2020.108518. [Google Scholar] [CrossRef]
41. C. Zhou and R. C. Paffenroth, “Anomaly detection with robust deep autoencoders,” presented at the 23rd ACM SIGKDD Int. Conf. Knowl. Discov. Data Min. (KDD), Halifax, NS, Canada, Aug. 13–17, 2017, pp. 655–674. [Google Scholar]
42. Z. Cheng, S. Wang, P. Zhang, S. Wang, X. Liu and E. Zhu, “Improved autoencoder for unsupervised anomaly detection,” Int. J. Intell. Syst., vol. 36, no. 12, pp. 7103–7125, Jul. 2021. doi: 10.1002/int.22582. [Google Scholar] [CrossRef]
43. Y. Imrana, Y. Xiang, L. Ali, and Z. Abdul-Rauf, “A bidirectional LSTM deep learning approach for intrusion detection,” Expert Syst. Appl., vol. 185, no. 8, Dec. 2021, Art. no. 115524. doi: 10.1016/j.eswa.2021.115524. [Google Scholar] [CrossRef]
44. A. Farzad and T. A. Gulliver, “Log message anomaly detection and classification using auto-B/LSTM and auto-GRU,” Nov. 2019. doi: 10.48550/arXiv.1911.08744. [Google Scholar] [CrossRef]
45. Z. Qu, L. Su, X. Wang, S. Zheng, X. Song and X. Song, “An unsupervised learning method of anomaly detection using GRU,” presented at the 2018 IEEE Int. Conf. Big Data Smart Comput. (BigComp), Shanghai, China, Jan. 15–17, 2018, pp. 685–688. [Google Scholar]
46. S. Tam, R. B. Said, and Ö. Ö. Tanriöver, “A ConvBiLSTM deep learning model-based approach for Twitter sentiment classification,” IEEE Access, vol. 9, pp. 41283–41293, Mar. 2021. doi: 10.1109/ACCESS.2021.3064830. [Google Scholar] [CrossRef]
47. K. H. Nam, Y. J. Song, and I. D. Yun, “SSS-AE: Anomaly detection using self-attention based sequence-to-sequence auto-encoder in SMD assembly machine sound,” IEEE Access, vol. 9, pp. 131191–131202, Sep. 2021. doi: 10.1109/ACCESS.2021.3112545. [Google Scholar] [CrossRef]
48. T. Wang, L. Zhang, and X. Wang, “Fault detection for motor drive control system of industrial robots using CNN-LSTM-based observers,” CES Trans. Electr. Mach. Syst., vol. 7, no. 2, pp. 144–152, Jun. 2023. doi: 10.30941/CESTEMS.2023.00014. [Google Scholar] [CrossRef]
49. A. Dehlaghi-Ghadim, M. H. Moghadam, A. Balador, and H. Hansson, “Anomaly detection dataset for industrial control systems,” IEEE Access, vol. 11, pp. 107982–107996, Sep. 2023. doi: 10.1109/ACCESS.2023.3320928. [Google Scholar] [CrossRef]
50. S. Soliman, W. Oudah, and A. Aljuhani, “Deep learning-based intrusion detection approach for securing industrial Internet of Things,” Alex Eng. J., vol. 81, pp. 371–383, Oct. 2023. doi: 10.1016/j.aej.2023.09.023. [Google Scholar] [CrossRef]
51. S. Bahadoripour, H. Karimipour, A. N. Jahromi, and A. Islam, “An explainable multi-modal model for advanced cyber-attack detection in industrial control systems,” Internet Things, vol. 25, Apr. 2024, Art. no. 101092. doi: 10.1016/j.iot.2024.101092. [Google Scholar] [CrossRef]
52. N. Jeffrey, Q. Tan, and J. R. Villar, “A hybrid methodology for anomaly detection in cyber-physical systems,” Neurocomputing, vol. 568, Feb. 2024, Art. no. 127068. doi: 10.1016/j.neucom.2023.127068. [Google Scholar] [CrossRef]
53. Y. Fang, Y. Yao, X. Lin, J. Wang, and H. Zhai, “A feature selection based on genetic algorithm for intrusion detection of industrial control systems,” Comput. Secur., vol. 139, Apr. 2024, Art. no. 103675. doi: 10.1016/j.cose.2023.103675. [Google Scholar] [CrossRef]
Cite This Article
 Copyright © 2024 The Author(s). Published by Tech Science Press.
This work is licensed under a Creative Commons Attribution 4.0 International License , which permits unrestricted use, distribution, and reproduction in any medium, provided the original work is properly cited.
 Downloads
 Citation Tools