
 Submit a Paper
 Propose a Special lssue
 Open Access
ARTICLE

Border Sensitive Knowledge Distillation for Rice Panicle Detection in UAV Images
School of Computer Science and Engineering, VIT (Vellore Institute of Technology) Vellore, Vellore, 632014, India
* Corresponding Author: Sendhil Kumar K.S.. Email:
(This article belongs to the Special Issue: Multimodal Learning in Image Processing)
Computers, Materials & Continua 2024, 81(1), 827-842. https://doi.org/10.32604/cmc.2024.054768
Received 06 June 2024; Accepted 11 August 2024; Issue published 15 October 2024
 View Full Text
 Download PDF
Abstract
Research on panicle detection is one of the most important aspects of paddy phenotypic analysis. A phenotyping method that uses unmanned aerial vehicles can be an excellent alternative to field-based methods. Nevertheless, it entails many other challenges, including different illuminations, panicle sizes, shape distortions, partial occlusions, and complex backgrounds. Object detection algorithms are directly affected by these factors. This work proposes a model for detecting panicles called Border Sensitive Knowledge Distillation (BSKD). It is designed to prioritize the preservation of knowledge in border areas through the use of feature distillation. Our feature-based knowledge distillation method allows us to compress the model without sacrificing its effectiveness. An imitation mask is used to distinguish panicle-related foreground features from irrelevant background features. A significant improvement in Unmanned Aerial Vehicle (UAV) images is achieved when students imitate the teacher’s features. On the UAV rice imagery dataset, the proposed BSKD model shows superior performance with 76.3% mAP, 88.3% precision, 90.1% recall and 92.6% F1 score.Keywords
The majority of the world’s population consumes rice as a staple food. Globally, it is grown in more than 100 countries, but Asia contributes 90% of the production. In addition to meeting caloric needs, rice constituents have potential health benefits. It is, however, important to consider any benefits in the context of the changing environment. Agricultural practices and environmental change affect rice quality and production in a significant way. As a staple in the global food system, rice must survive [1]. Precision agriculture and plant phenotyping tools have increased rice yield monitoring and prediction. Farmers can thus make better crop management decisions as a result of making educated decisions. Furthermore, it reduces resource use, which results in higher yields and profitability. During rice field phenotyping, structural traits, root traits, water-related traits, carbon-based traits, and photosynthesis-associated traits are measured [2]. Several factors influence grain yield, including plant density, the number of tillers per plant, the number of grains per panicle, the approximation of panicle heading date, and grain size. Rice plant shoot habits and panicles are directly related to yield potential. It is especially critical to grasp the importance of the panicle since its development directly impacts grain density [3]. Panicle distribution is essential for plant breeders and agronomists to understand paddy production. Therefore, panicle detection is key to paddy phenotyping. Paddy panicles are difficult to quantify in the field. In the field, manual sampling is often used for yield estimation, although it is inherently imprecise and requires a lot of effort. As a result, alternative automated methods are developed for estimating paddy density and yield. The advent of low-cost imaging devices opens up the potential of substituting manual inspection in the rice field with image-based panicle analysis [4]. A variety of remote sensing platforms are available for agricultural data collection, including ground-based sensors, Unmanned Aerial Vehicles (UAVs), and satellite sensors. UAVs offer several advantages over other remote sensing platforms. Less expensive, enhanced flight capabilities, and more effective operation are some of the benefits of this technology. Drones provide a reliable method of acquiring data about rice crops [5]. UAVs equipped with RGB, thermal, and multispectral cameras provide information on rice crop growth above agricultural fields, enabling large-scale breeding experiments to be conducted. It has been demonstrated that the combination of UAV RGB data and deep learning is more effective than the conventional regression model for multispectral imagery. The problem remains that extracting valuable information from images is still difficult, despite the ease and speed at which images can be acquired.
Recently, researchers have demonstrated significant interest in using machine learning methods to detect crop diseases [6,7], water stress, and crop yield prediction. Wu et al. [8] presented an image analysis method for counting grains in a panicle. Linear regression is used to count grains and has an accuracy of 96% for Japonica rice and 97% for Indica rice. Yang et al. [9] measured High throughput Leaf Scoring (HLS) through image analysis based on the Hue, Saturation and Illumination colour space method. Li et al. [10] attempted to detect rice seedlings in each hill. The implementation and analysis of several colour models is performed to differentiate rice seedlings from the rest of the field. Handcrafted features, on the other hand, require manual extraction of complicated features and are suited to a specific scene, limiting model generalization. Machine learning algorithms are not well suited to complicated field scenes with densely distributed paddy panicles and significant occlusion. Deep learning models automatically learn features from input images due to deep hidden layers. However, there are still several research challenges with automatic UAV-based panicle detection: (1) Complex field background including weeds, shades, and water reflection. (2) Rice panicles vary greatly in size, shape and colour depending on growth stages, lighting conditions and UAV camera angle. (3) Occlusion between panicles, stems and leaves. These considerations motivate the development of an efficient panicle detection algorithm based on UAV imagery. The main advantage of the proposed algorithm is that the panicles along the edge of the image border can be easily identified, regardless of the size of the panicle. Consequently, the performance of the system is enhanced as a result.
The main contributions are:
1. To improve panicle detection performance, Border Sensitive Mechanism-based Knowledge Distillation (BSKD) is proposed.
2. To distinguish between the foreground and background features, a mask is used. The student learns these aspects as an added benefit.
3. The border sensitive method is applied to ResNet50 to derive border features more effectively.
The structure of this paper is as follows: Section 1 introduces rice phenotypic research and discusses existing machine learning techniques. The Section 2 discusses prior research on rice panicle detection. The Section 3 describes the dataset and the proposed BSKD method. The proposed model results are depicted and explained in Section 4. The paper concludes with Section 5.
Previous crop phenotype researchers used machine learning to analyze phenotypic traits automatically. Guo et al. [11] analyzed time-series RGB images to study rice panicle flowering dynamics. These images were captured at 2 m altitude with a Canon DSLR camera. Their approach is a hybrid of algorithms including scale-invariant features, a support vector machine, and a bag of visual words. Yang et al. [12] developed a UAV-based dataset for rice seedling classification and d etection. The images were taken from 20 m altitude with the DJI Phantom4 Pro and the DJI Zenmuse. The image has a resolution of
Deep learning algorithms have recently been employed in agricultural phenotypic research to avoid the need for manual feature extraction. There are two types of deep learning-based object detection algorithms: one-stage approaches and two-stage approaches. Wang et al. [16] proposed a rice panicle detection and counting model for both offline and online. The input data is augmented and trained in the PanicleDetect model. This model employs the YOLO5X deep learning model. During the online stage, the input images are fed into the trained PanicleDetect model and the results are saved. This work was only evaluated at one planting density, which is a bit higher than the normal planting density utilized for rice production. Different one-stage and two-stage deep learning models for detecting faulty paddy seedlings are empirically examined by Anuar et al. [17]. The DJI Phantom 4 was used to capture images of paddy seedlings with a resolution of
In this research, the paddy rice imagery dataset created by Wang et al. [22] is used. The experimental location is situated within Hokkaido University in Japan. In August 2018, UAV images of paddy fields were acquired at 1.2 m altitude. The configuration leads to a ground sampling distance of 0.04 cm per pixel. The horizontal overlap ratio is 43% while the vertical overlap ratio is 70%. Kitaake and KoKusyokuto-2 are rice varieties. The observed cultivation densities ranged from 11.46 to 16.18 plants per square meter. A commercial UAV was used to gather aerial imagery of the rice field. The efficiency of the aforementioned technology surpasses that of a handheld data collection device. A larger UAV can accommodate and support heavier cameras and lenses, which facilitates the capture of images of enhanced quality. Nevertheless, rotor-induced downward wind exerts a significant force on rice stems, resulting in image quality degradation. Hence, considering the inherent trade-offs regarding flight altitude, image resolution, and user-friendliness, the Mavic Pro, by DJI Corporation, is used. It is a small, lightweight drone with an integrated 1/2.3-inch Complementary Metal Oxide Semiconductor (CMOS) sensor. From the acquired videos, frames are extracted without duplication, blurring, and overexposure. Each frame has
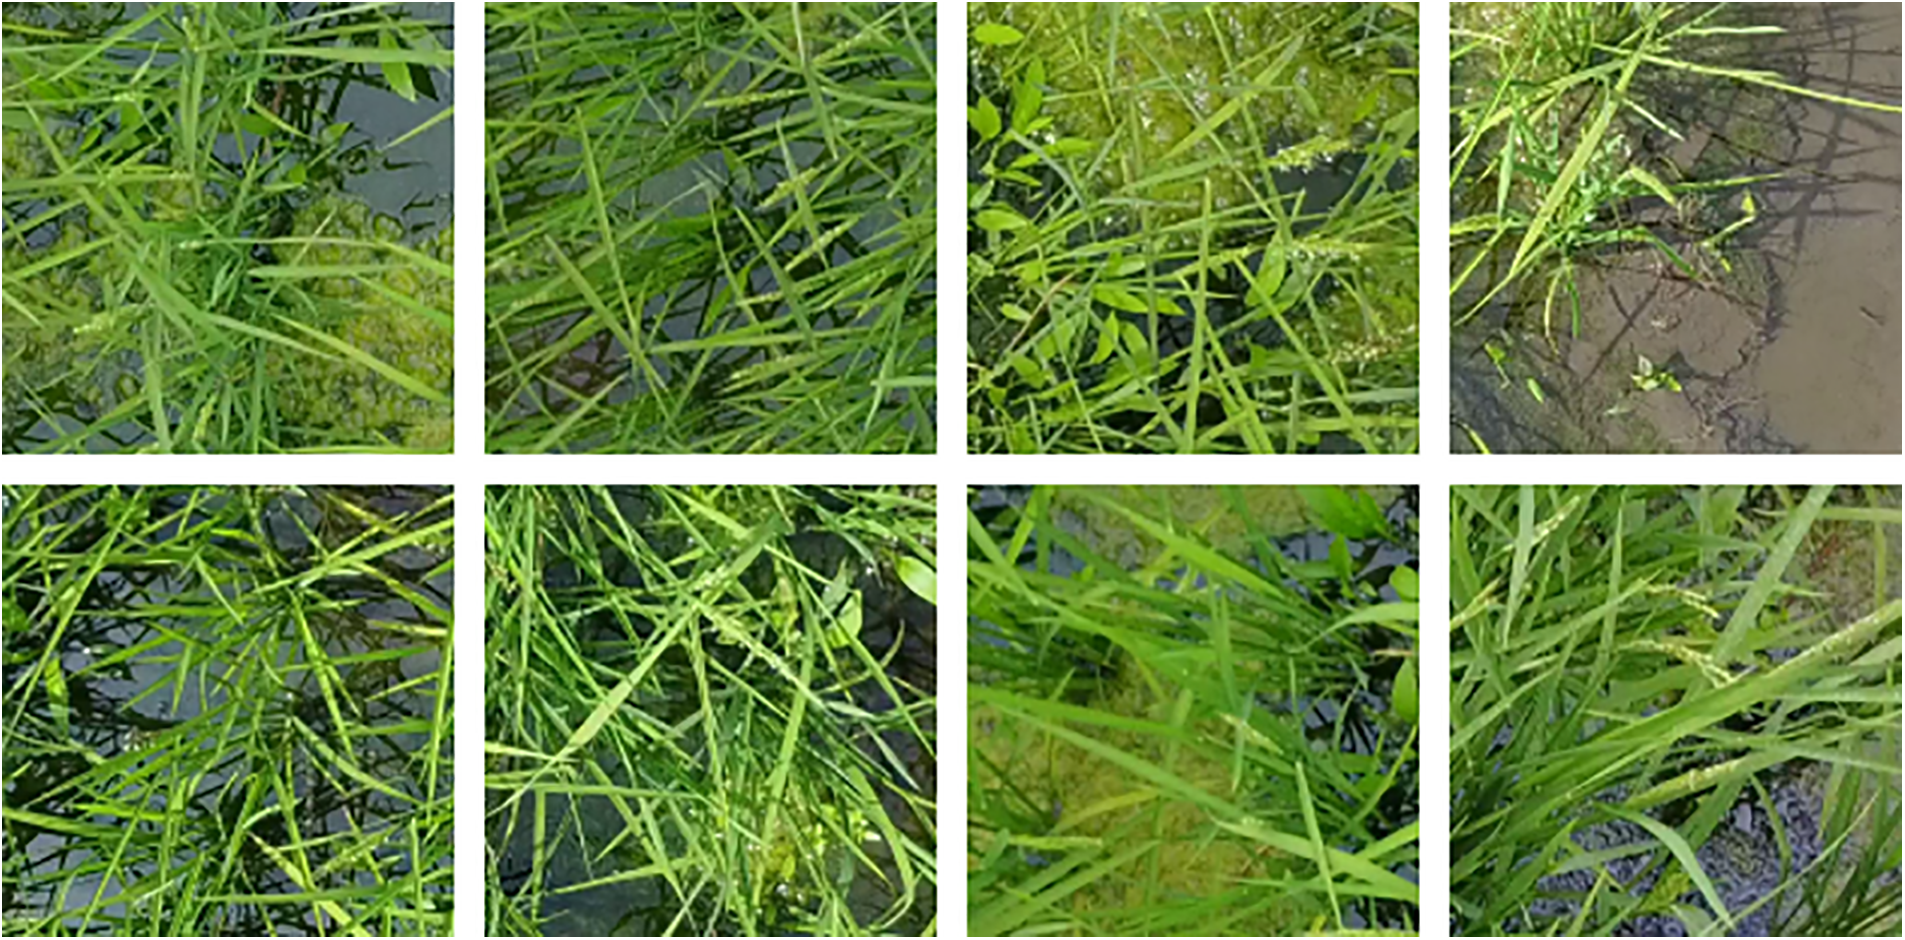
Figure 1: UAV paddy rice imagery dataset samples
Due to the non-overlapping sliding windows, it is unlikely that the same panicle appears in many images. With threshold and morphology filtering, we can refine the confidence map and obtain a refined dataset with manually labeled annotations. There may be some missed annotations since the annotations are manually labeled. It was, however, refined using a deep learning model with an improvement of 40.6%. A minimized receptive area of view cannot ensure panicle completion. Hence, in this study, a
3.2 Border Sensitive Knowledge Distillation
In this section, we will elucidate the proposed Border Sensitive Knowledge Distillation (BSKD) model, as depicted in (Fig. 2). The first step involves an imitation mask. This is designed to separate the foreground features from the background characteristics present in the provided input images. Then, we proceed to explain the technique of feature-based distillation. This section provides a detailed explanation of the proposed teacher network, which utilizes the ResNet50 architecture along with a border sensitive mechanism. Additionally, the process by which the simple student model, ResNet18, distils knowledge from the teacher network is thoroughly described. The Border Sensitive Method is discussed in detail as an independent subsection. Finally, the overall loss calculation is shown.
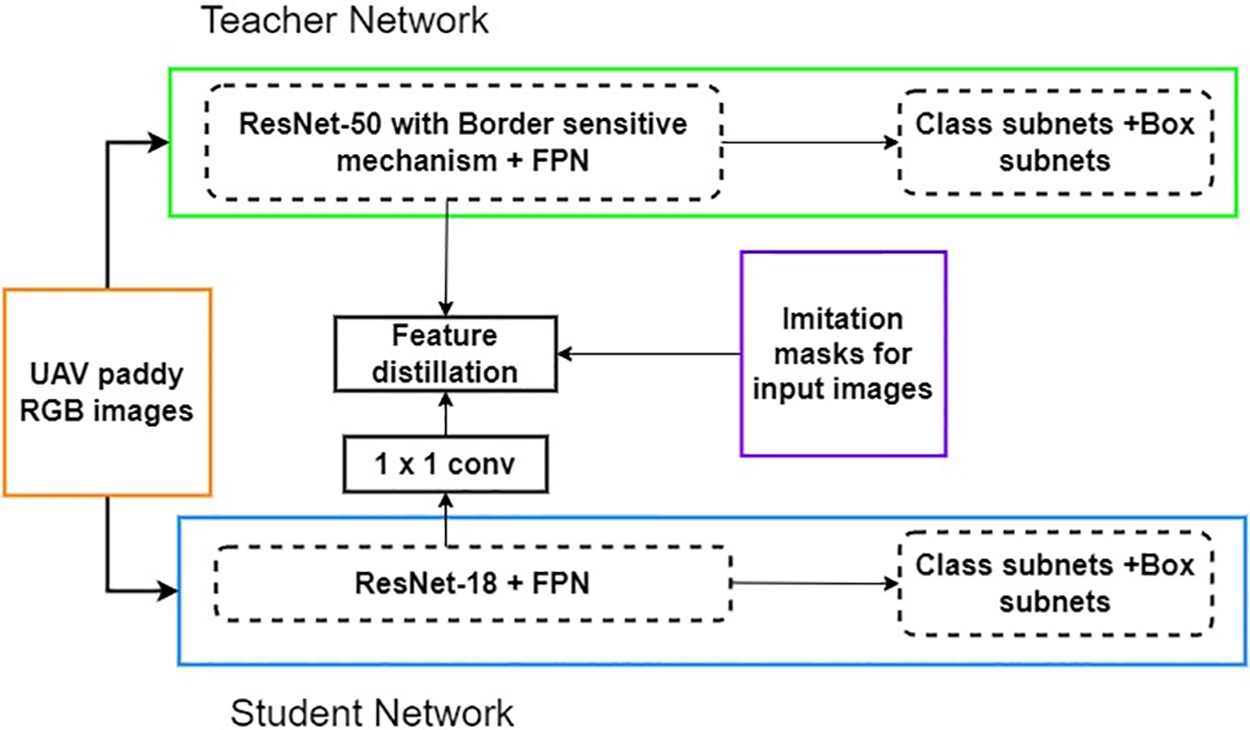
Figure 2: Proposed border sensitive knowledge distillation (BSKD)
The high-level features
Let
3.2.2 Feature Based Distillation
The Knowledge distillation process involves transferring knowledge from one machine learning model (teacher) to another (student). The teacher is a high-capacity, high-performance model, while the student is a compact, low-capacity model. The goal of knowledge transfer is to maximize the student’s compactness without sacrificing performance. After each training step, the teacher model gives feedback to the student model, which is accomplished through a series of iterations. In response, the student model adjusts its parameters. Performance is measured until the desired level is reached. It is regarded as one of the most effective methods of model acceleration and compression. Knowledge distillation can be categorized into logit-based distillation, feature-based distillation, and relationship-based distillation. The feature-based distillation technique involves extracting intermediate features from the teacher network, resulting in a higher level of information than other distillation approaches. In the proposed border sensitive feature distillation approach, the ResNet50 architecture was adopted as the backbone network for the teacher model. The ResNet18 architecture was selected for the student model. The border sensitive mechanism is exclusively implemented for the teacher network at C5 level in ResNet50 (Fig. 3) to ensure that the features extracted are highly informative, even in the border region. The student network has the ability to reproduce the teacher’s model behaviors with regards to the output features of the Feature Pyramid Network (FPN). To implement feature knowledge distillation, an adaptation layer is integrated into the student network. Specifically, a
where
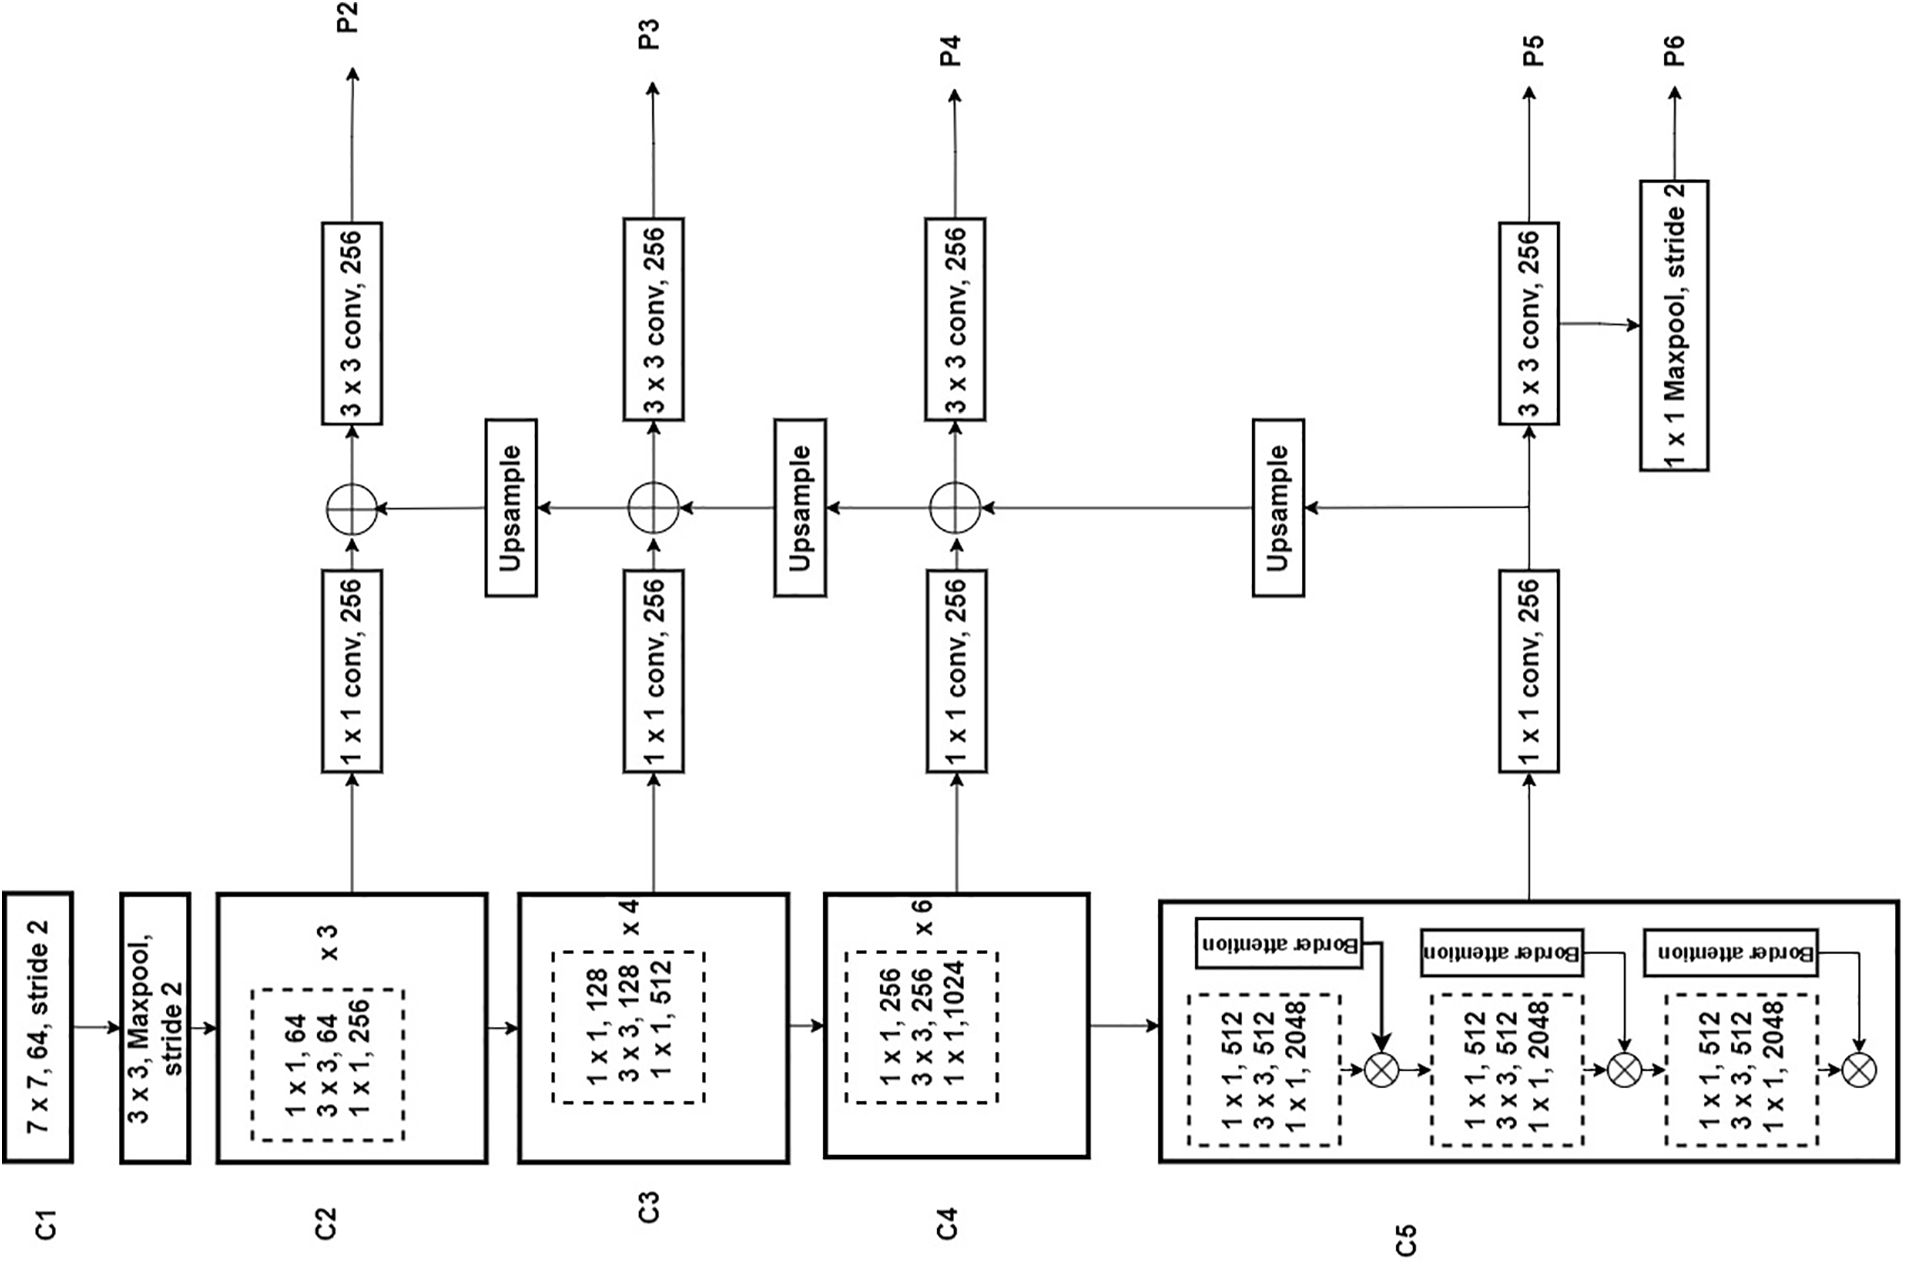
Figure 3: Teacher network–ResNet50+FPN+border sensitive method
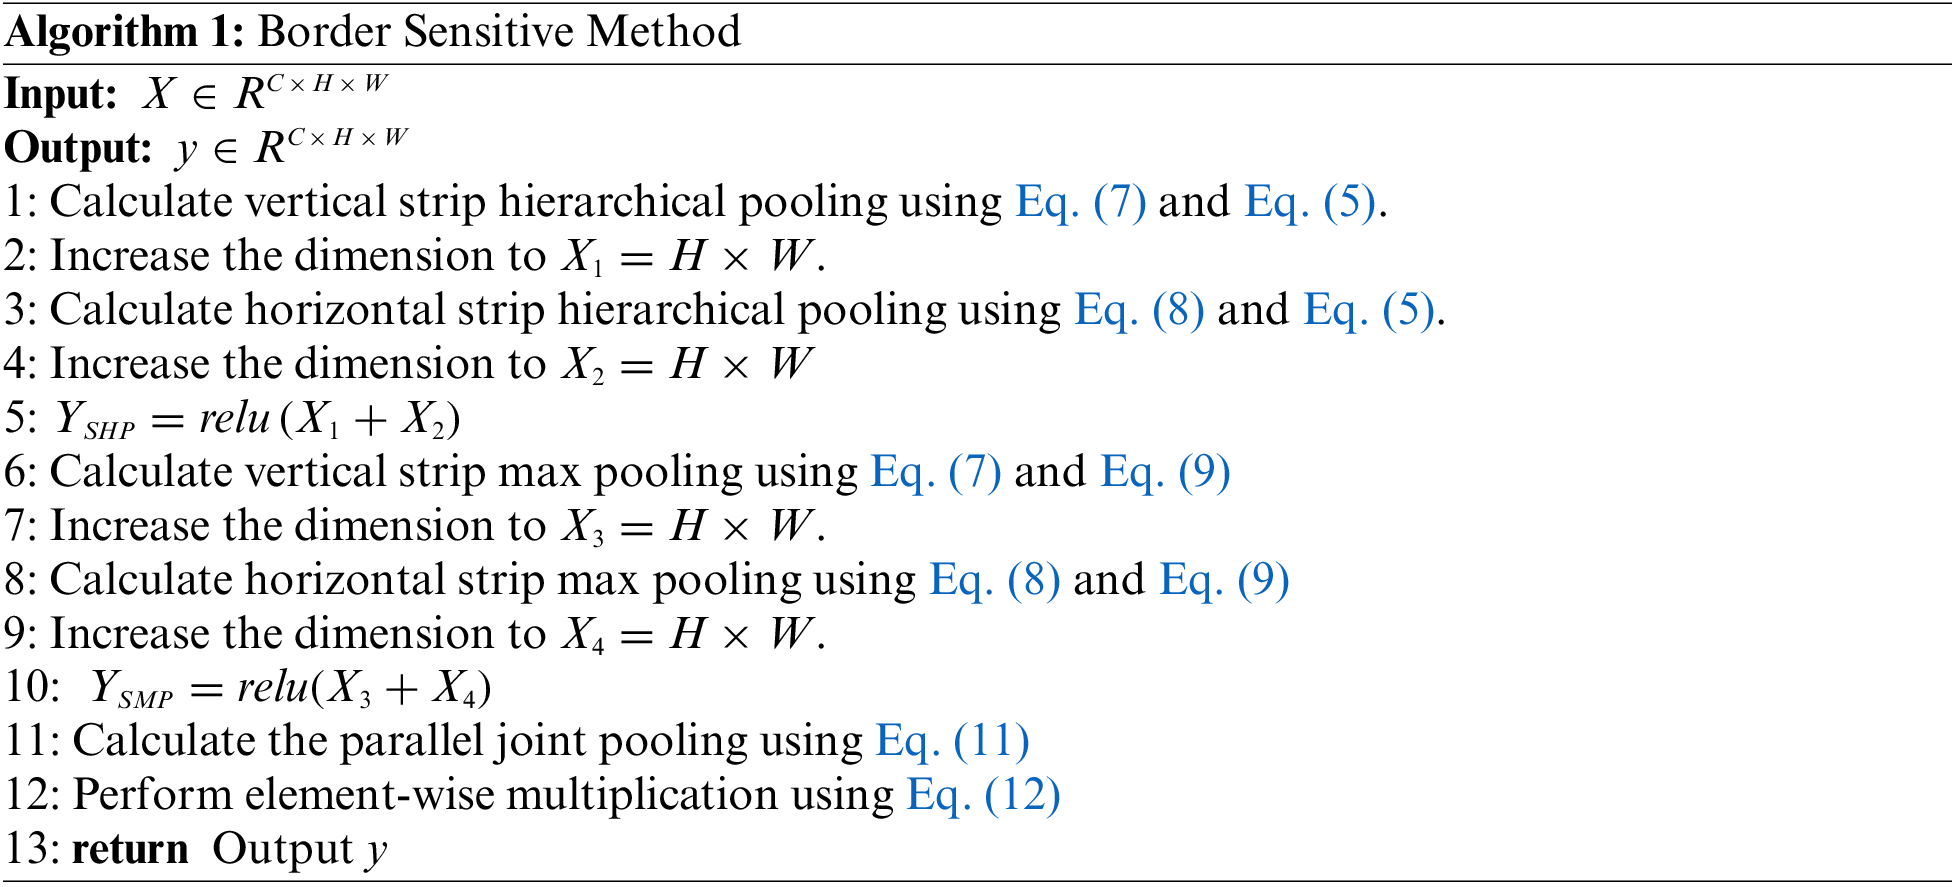
Song et al. [23] proposed border sensitive mechanism inspired by human cortex activation mechanism. Based on a band shape kernel, a hierarchical activation function is applied for a more effective pooling strategy. Moreover, a further extension of strip max pooling has also been introduced to enhance the border characterization of prominent features. The fundamental limitations of existing activation functions necessitate implementing cortex activation in border-sensitive methods. Without a proper learning rate, even for a large gradient, neurons will not be activated after entering the ReLu module and altering their parameters, resulting in “neuron death”. In this study, the intrinsic advantage of the exponential function in establishing the activation mechanism of the cortex is capitalized on the problems of gradient vanishing. The overview of the proposed border sensitive method is illustrated in Fig. 4, where
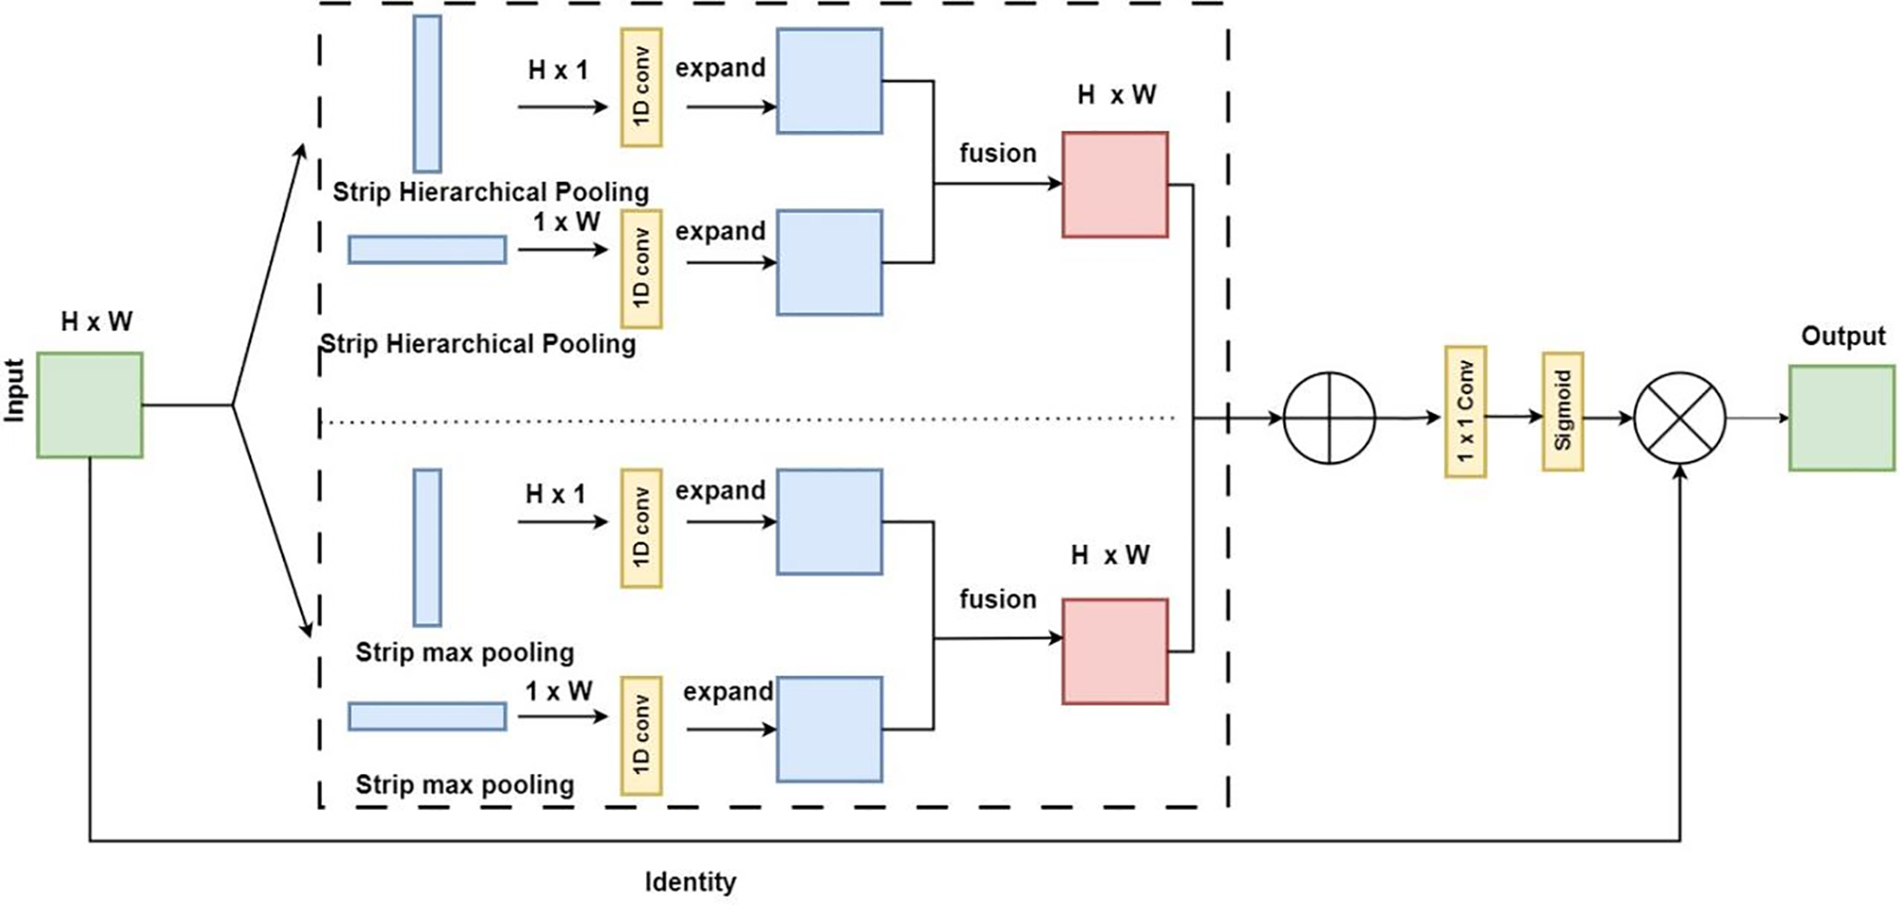
Figure 4: Border sensitive method
Here,
where
In this work, we determined the hyperparameters value
As the activation level increases, there is a corresponding increase in border feature dominance. The efficacy of this activation highlighting mechanism surpasses that of the traditional direct averaging pooling approach. The effective use of a band-shaped kernel is implemented to execute a strip pooling operation in either the vertical or horizontal dimension. The pooling operation computes the average value of all the feature elements within a given row or column, based on spatial dimensions of
As a result of, horizontal strip pooling, the output
In addition to establishing long-term dependencies between the distributed regions, the pooling operation described above encapsulates the regions in a banded shape. This allows the whole downsampling process to emphasize more on the differences between border features, rather than preserving the overall feature information. This method encapsulates strip pooling into a border-sensitive mechanism aimed at preventing model inflation. Strip hierarchical pooling becomes more effective when we implement cortex hierarchical activation into strip pooling. Therefore, the kernel size becomes
Strip max pooling and strip hierarchical pooling combine
Consequently, we can combine strip hierarchical pooling and strip max pooling by performing the following:
The final output for parallel joint pooling can be calculated as:
Here, scale
The total training loss
where
The proposed work is implemented on Windows 11OS (CPU: AMD Ryzen 7 6800HS; RAM: 32GB; GPU: NVIDIA GeForce RTX 3050 Ti). Open-source deep learning frameworks MMdetection [24] and PyTorch are used to implement deep learning models. ResNet50 and ResNet18 are the backbones of teacher and student networks. The initial learning rate is set to 0.002, the weight decay is set to 0.0001, and the momentum is adjusted to 0.9 for all experiments. The value of
4.1.1 Hyper Parameter Sensitivity
The proposed BSKD model is subjected to a sensitivity study regarding the two most relevant hyperparameters,
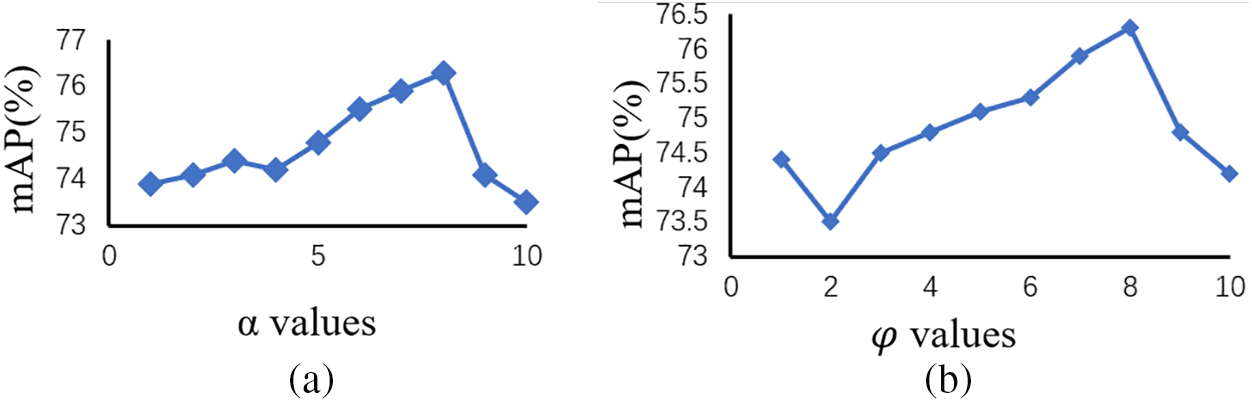
Figure 5: Study of
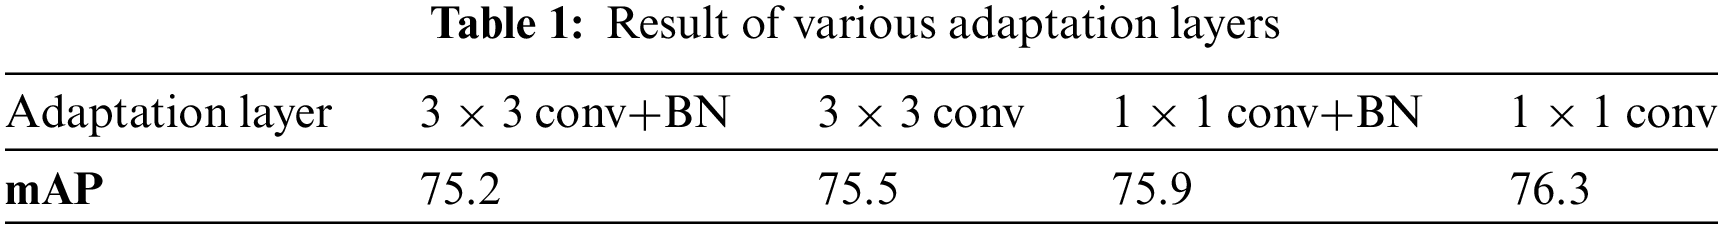
4.1.2 Impact of Various Adaptation Layers
The performance of various adaptation layer types on the UAV paddy dataset with BSKD is shown in Table 1. There are two networks that form the backbone of the teacher and student networks: ResNet50 and RestNet18. In this paper, we analyze four different types of adaptation layers:
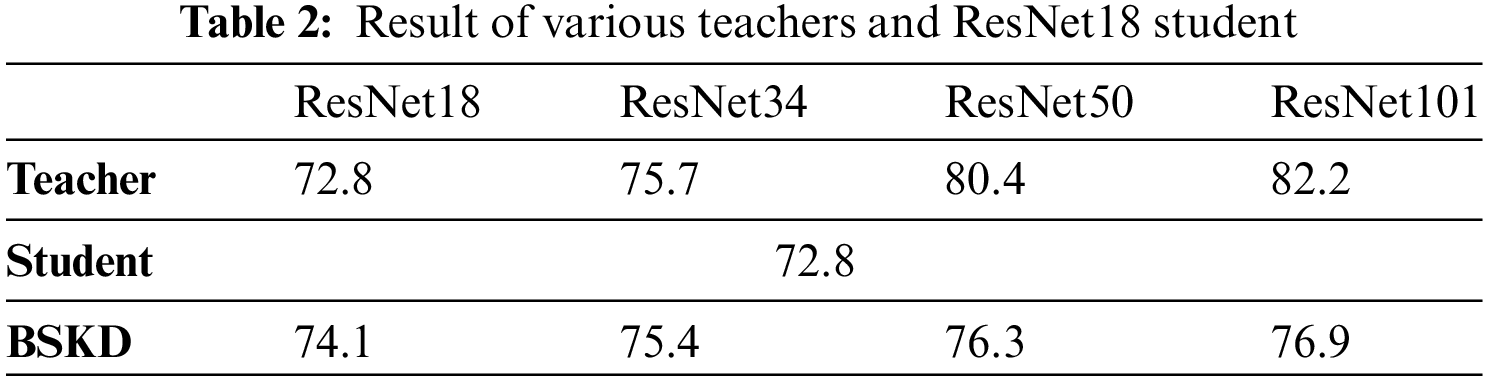
4.1.3 Impact of Different Teachers and ResNet18 Student
In the context of image classification, it has been observed that the student model’s performance tends to deteriorate when there is a significant disparity in performance between the teacher and the student models. In this section, we assess the validity of this observation in the context of UAV-based paddy panicle detection using the proposed BSKD model. ResNet18 is employed as the backbone network for the student model, and knowledge distillation is performed using various teacher sizes. Table 2 presents the findings. There exists a positive link in performance between the teacher and the student networks. The presence of a highly effective teacher is positively correlated with a greater improvement in performance for the respective student. This observation is different from the image classification findings. The rationale for this observation can be attributed to the fact that the distillation process in image classification primarily focuses on optimizing the final classification logits. In contrast, our approach to detecting paddy panicles using drones focuses on manipulating intermediate high-level features. When using one-hot labels as the target, the clean logits would not adequately capture the upgraded teachers’ expanded knowledge. It may be inferred that the presence of a highly qualified teacher is imperative for knowledge distillation implementation.
4.2 Quantitative and Qualitative Detection Comparison
A quantitative comparison of the proposed detection method with various State-Of-The-Art (SOTA) detectors is shown in Table 3. According to the results derived from the developed BSKD algorithm, the performance of the AP50 algorithm is improved over that of the AP75 algorithm. The results of this observation provide us with valuable insight and suggest that a threshold for IoU of 0.50 might be appropriate to use. Similarly, the Average Precision (AP) value increases as the object size increases from small (s) to large (l). APs represents the average precision for small objects with the size less than 322 pixels. The value of APm indicates the average precision for medium objects with a size greater than 322 pixels but less than 962 pixels, while APl indicates the average precision of large objects with a size greater than 962 pixels. As a result of these findings, we can conclude that the proposed model doesn’t perform well when implemented on small panicles. It appears that the proposed detection method is capable of exhibiting superior performance to other SOTA detectors, including both the one-stage and two-stage models (Fig. 6). Yolov8, Yolov3 and SSD were chosen as representatives of one-stage models, and Faster RCNN, mask RCNN and cascade RCNN were selected as representatives of two-stage models. The two-stage models exhibited superior performance to the one-stage SSD, yielding improved results in terms of mean average precision (mAP) values. Yolov8 demonstrates superior performance than two-stage detectors. However, the BSKD model is a single-stage model and shows better accuracy to other detectors. For instance, the mean average precision (mAP) of BSKD is 76.3%. In contrast, the mAP values for Yolov8, Yolov3, SSD, Faster RCNN, mask RCNN, and the cascaded RCNN stand at 65.3%, 64.2%, 53.7%, 54.2%, 54.5% and 63.6%, respectively. The mean average precision (mAP) of BSKD showed substantial improvements of 11%, 12.1%, 22.6%, 22.1%, 21.8% and 12.7% when compared to Yolov8, Yolov3, SSD, Faster RCNN, mask RCNN, and cascaded RCNN, respectively. The visualization of bounding box regression using the proposed method and SOTA detectors cascaded RCNN and Yolov8 is presented in Fig. 7. Cascaded RCNN is selected from other two-stage detectors and Yolov8 is selected from other one-stage detectors for visualization based on accuracy. According to observations, other SOTA detectors cascaded RCNN and Yolov8 cannot detect panicles around the edge. However, if the panicles are larger, they can detect them. In addition, the proposed method demonstrates a reduced convergence of the bounding box regression training loss compared to Yolov8 and cascaded RCNN.
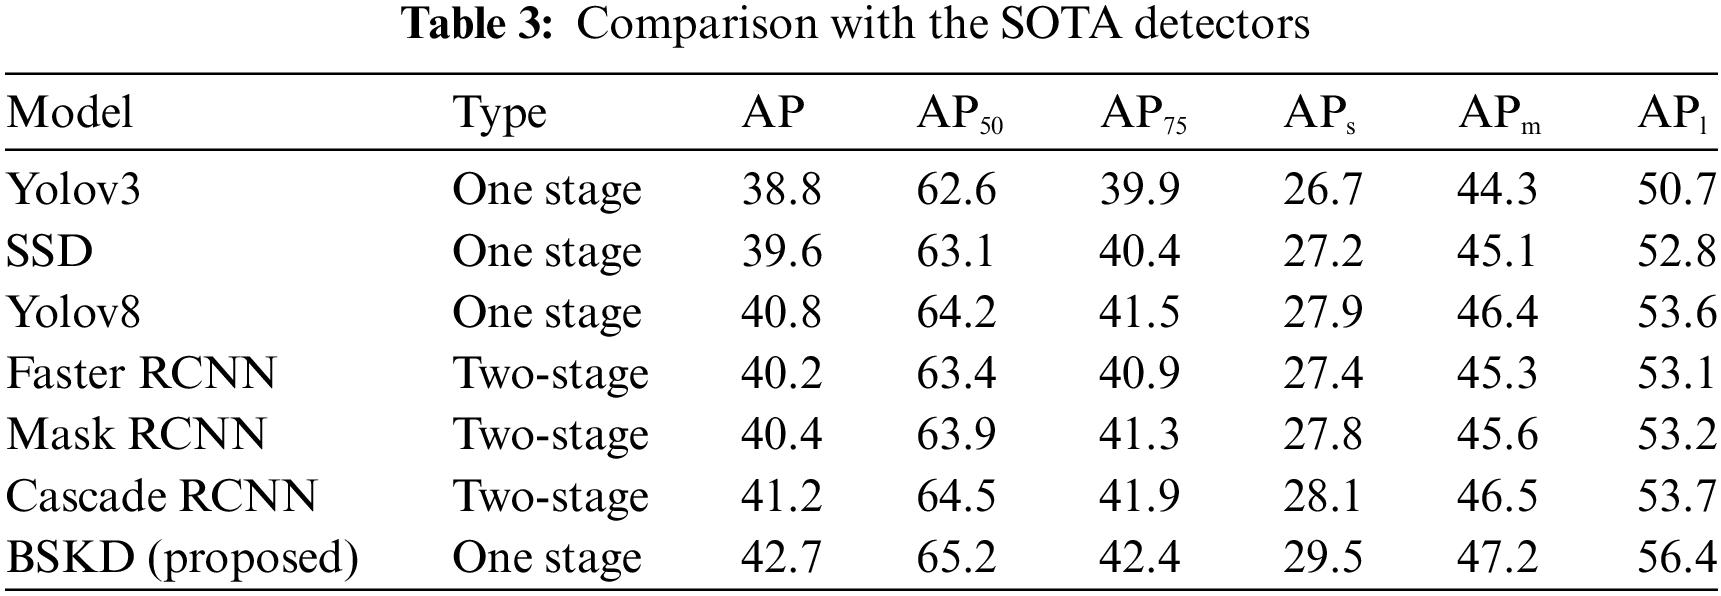
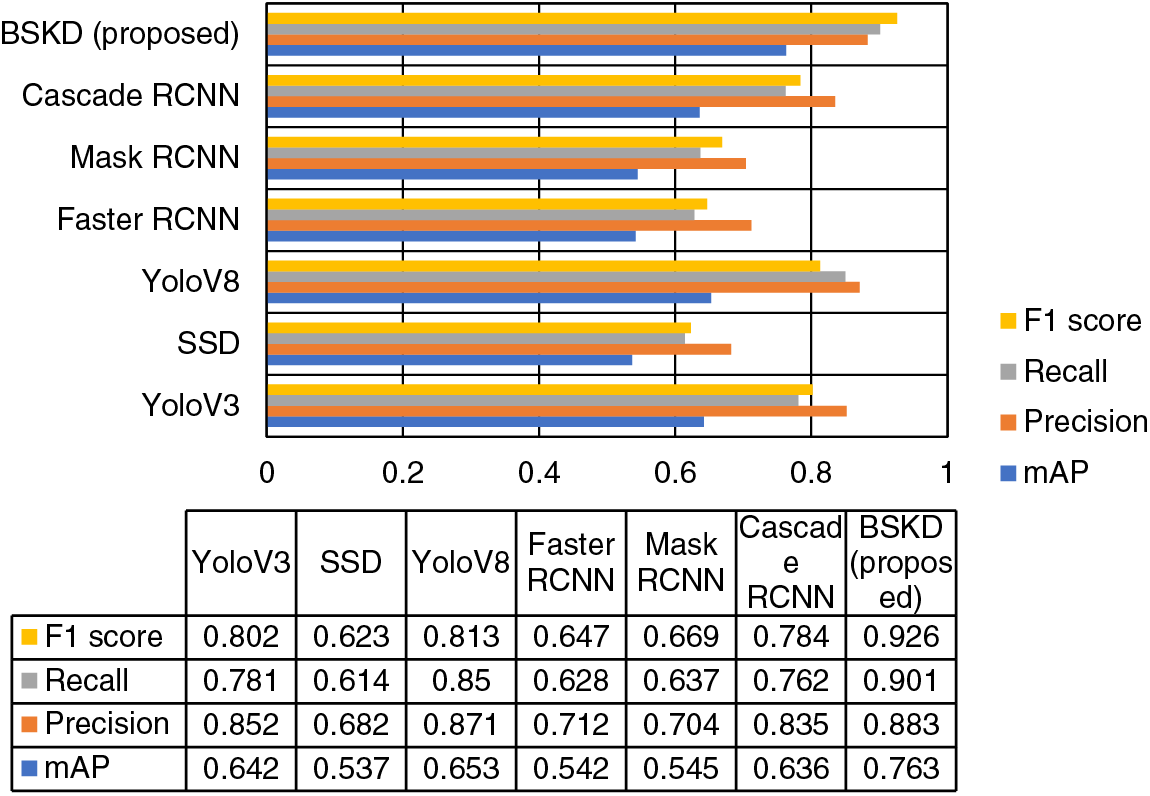
Figure 6: Overall performance comparison with the SOTA detectors
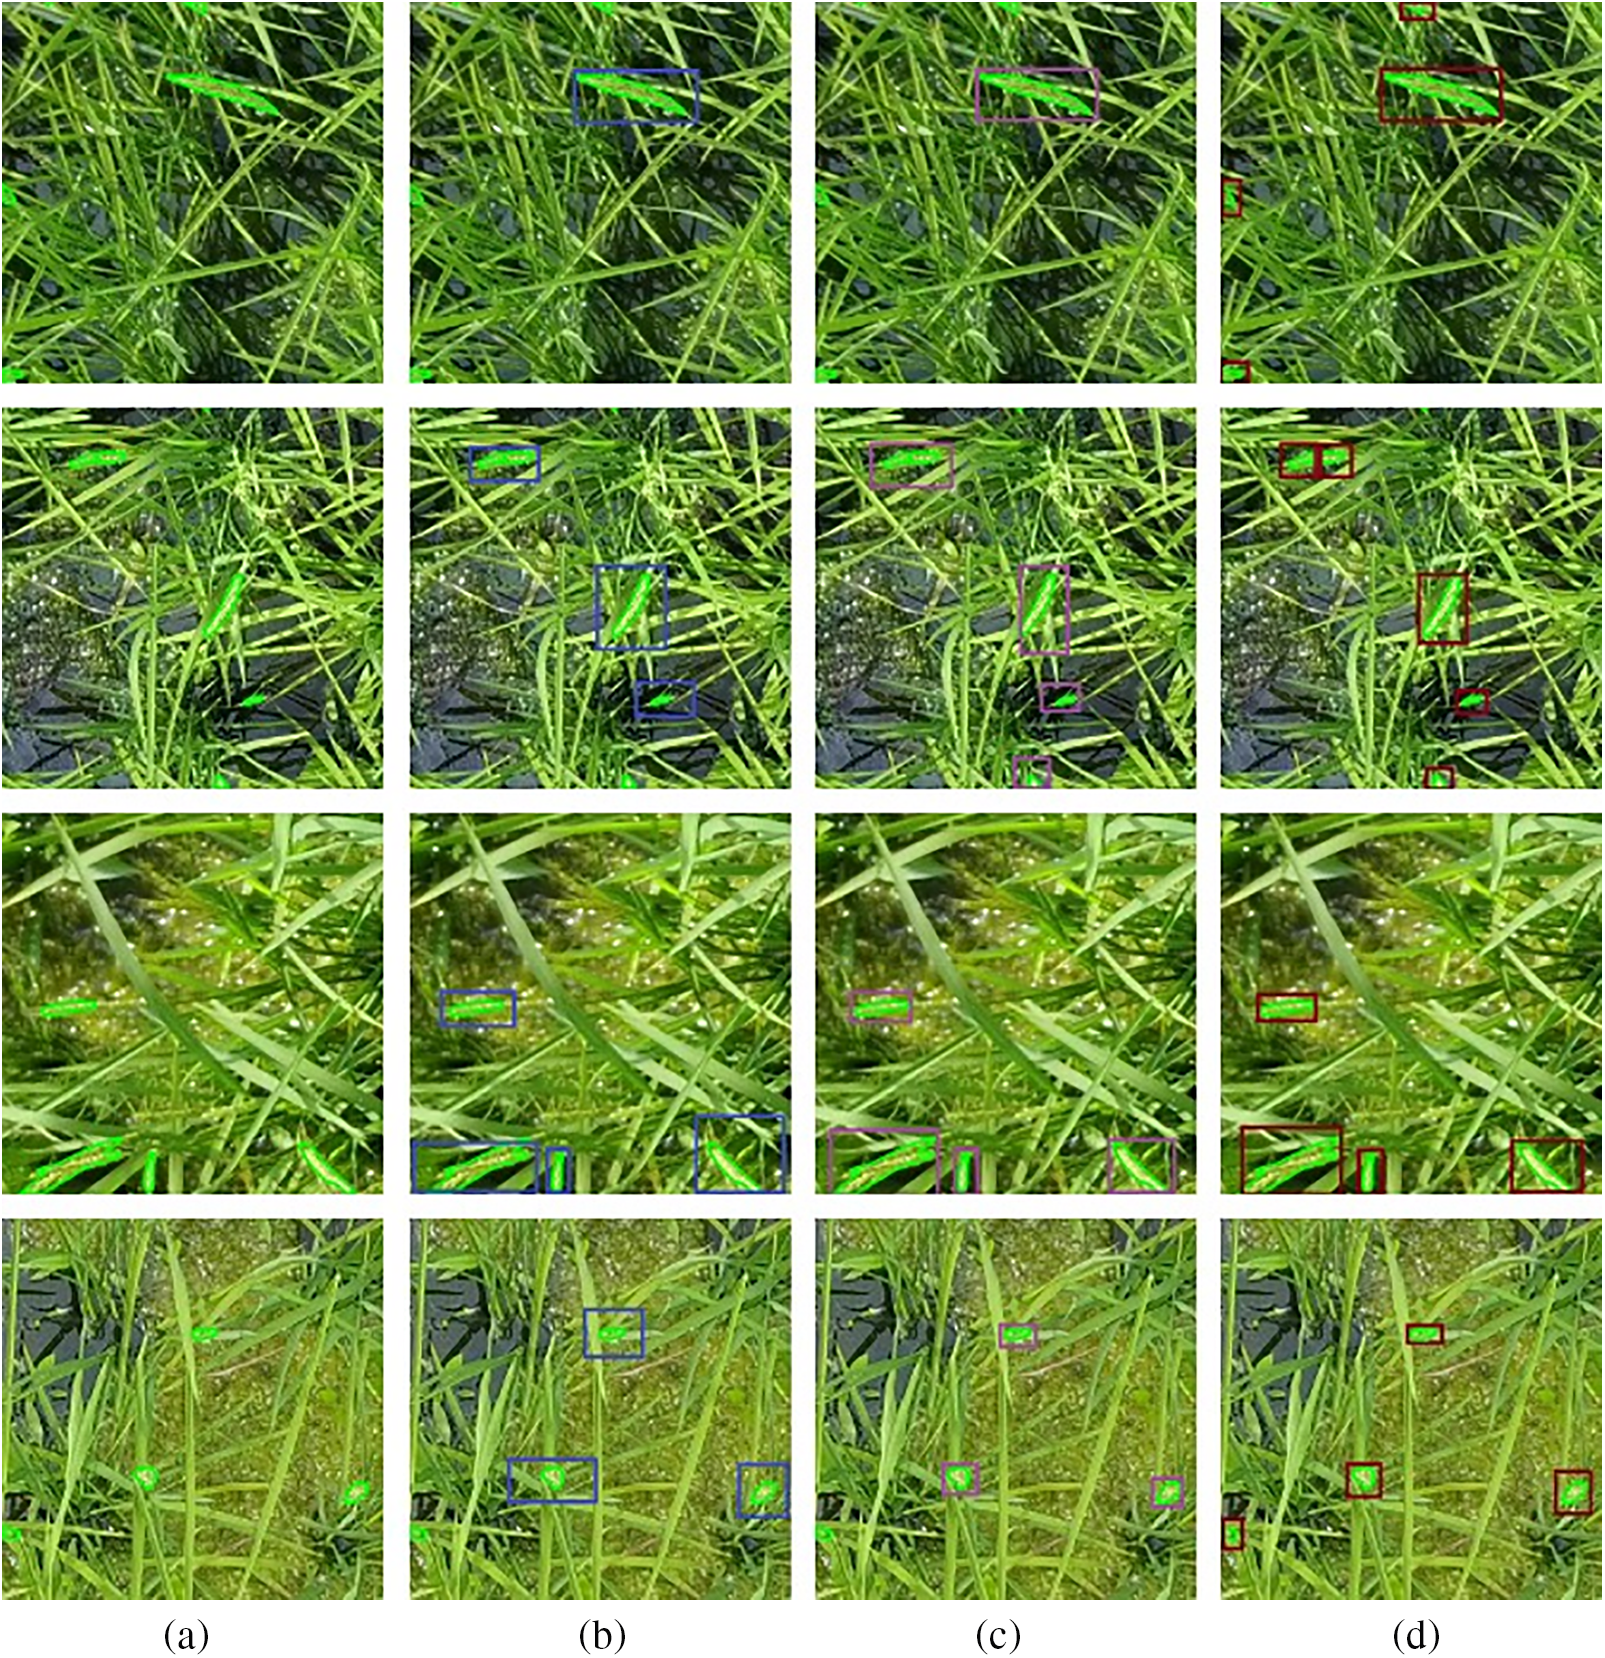
Figure 7: Qualitative comparison of proposed BSKD with SOTA detectors (a) Ground truth (b) Cascaded RCNN prediction (c) Yolov8 prediction (d) Proposed BSKD prediction
It is possible that the primary reason for the outperforming results observed with the proposed model BSKD has to do with a border sensitive approach used for identifying panicles around the border and this in turn leads to an improvement in the total mean average precision. Considering that the UAV rice imagery dataset included samples with different illuminations, panicle sizes, shape distortions, partial occlusions, and complex backgrounds, the increased accuracy of the proposed model may indicate that it is capable of resolving these problems better than SOTA detectors. The main limitation of the proposed model is the fact that due to its border-sensitive nature; it overlooks objects that are located in the vicinity of the border. Thus, it is possible for other objects to be mistakenly detected as panicles around the border, and the performance as a result will degrade.
This study introduces a novel approach called Border Sensitive Knowledge Distillation (BSKD) to detect rice panicles in images captured by Unmanned Aerial Vehicles (UAVs). This research focuses on the use of panicles located along borders to improve detection capabilities. Initially, the input images are acquired through the complicated teacher network, which consists of ResNet50, border sensitive method (BSM), and feature pyramid network (FPN). The generation of imitation masks extracts both foreground and background elements. These masks and intermediate features acquired by the teacher model are distilled by the simple student model, specifically the ResNet18+FPN architecture. The aggregate loss is determined through the summation of both detection and distillation losses. The proposed BSKD model demonstrates improved performance compared to state-of-the-art (SOTA) object detectors when evaluated on the UAV paddy dataset. Further research will focus on improving precision by analyzing images taken by UAVs at high altitudes and extremely small panicles.
Acknowledgement: The authors are grateful to all the editors and anonymous reviewers for their comments and suggestions and thank all the members who have contributed to this work with us.
Funding Statement: The authors received no specific funding for this study.
Author Contributions: The authors confirm contribution to the paper as follows: study conception and design: Anitha Ramachandran; data collection: Anitha Ramachandran; analysis and interpretation of results: Anitha Ramachandran, Sendhil Kumar K.S.; draft manuscript preparation: Anitha Ramachandran. All authors reviewed the results and approved the final version of the manuscript.
Availability of Data and Materials: The data that support the findings of this study are openly available at https://zenodo.org/records/4444741 (accessed on 06 August 2024).
Ethics Approval: Not applicable.
Conflicts of Interest: The authors declare that they have no conflicts of interest to report regarding the present study.
References
1. N. K. Fukagawa and L. H. Ziska, “Rice: Importance for global nutrition,” J. Nutr. Sci. Vitaminol., vol. 65, pp. S2–S3, Oct. 2019. doi: 10.3177/jnsv.65.S2. [Google Scholar] [PubMed] [CrossRef]
2. G. K. Dash, S. K. Sahoo, M. Barik, S. Parida, M. J. Baig and P. Swain, “Perspectives and challenges of phenotyping in rice research,” in Applications of Bioinformatics in Rice Research, M. K. Gupta, L. Behera Eds. Singapore: Springer Singapore, 2021, pp. 171–195, doi: 10.1007/978-981-16-3997-5_9. [Google Scholar] [CrossRef]
3. M. Ikeda et al., “Analysis of rice panicle traits and detection of QTLs using an image analyzing method,” Breed. Sci., vol. 60, no. 1, pp. 55–64, 2010. doi: 10.1270/jsbbs.60.55. [Google Scholar] [CrossRef]
4. M. K. Vishal et al., “Image-based phenotyping of diverse rice (Oryza sativa L.) Genotypes,” 2020, arXiv: 2004.02498. [Google Scholar]
5. C. A. Devia et al., “Aerial monitoring of rice crop variables using an UAV robotic system,” in ICINCO 2019–Int. Conf. Inform. Control, Autom. Robot., Prague, Czech Republic, Jul. 29–31, 2019. doi: 10.5220/0007909900970103. [Google Scholar] [CrossRef]
6. A. K. Sangaiah, F. -N. Yu, Y. -B. Lin, W. -C. Shen, and A. Sharma, “UAV T-YOLO-Rice: An enhanced tiny yolo networks for rice leaves diseases detection in paddy agronomy,” IEEE Trans. Netw. Sci. Eng., pp. 1–16, 2024. doi: 10.1109/TNSE.2024.3350640. [Google Scholar] [CrossRef]
7. F. -N. Yu, W. -C. Shen, A. K. Sangaiah, and Y. -B. Lin, “DSC-T-Yolo-Rice: A sand clock yolo model for rice leaves diseases detection,” in 2024 IEEE Int. Conf. Consum. Electron. (ICCE), Las Vegas, NV, USA, IEEE, Jan. 2024, pp. 1–6, doi: 10.1109/ICCE59016.2024.10444270. [Google Scholar] [CrossRef]
8. W. Wu et al., “Image analysis-based recognition and quantification of grain number per panicle in rice,” Plant Methods, vol. 15, no. 1, Dec. 2019, Art. no. 122. doi: 10.1186/s13007-019-0510-0. [Google Scholar] [PubMed] [CrossRef]
9. W. Yang et al., “Genome-wide association study of rice (Oryza sativa L.) leaf traits with a high-throughput leaf scorer,” J. Exp. Bot., vol. 66, no. 18, pp. 5605–5615, Sep. 2015. doi: 10.1093/jxb/erv100. [Google Scholar] [PubMed] [CrossRef]
10. H. Li et al., “An automatic approach for detecting seedlings per hill of machine-transplanted hybrid rice utilizing machine vision,” Comput. Electron. Agric., vol. 185, no. 06, Jun. 2021, Art. no. 106178. doi: 10.1016/j.compag.2021.106178. [Google Scholar] [CrossRef]
11. W. Guo, T. Fukatsu, and S. Ninomiya, “Automated characterization of flowering dynamics in rice using field-acquired time-series RGB images,” Plant Methods, vol. 11, no. 1, Dec. 2015, Art. no. 7. doi: 10.1186/s13007-015-0047-9. [Google Scholar] [PubMed] [CrossRef]
12. M. -D. Yang, H. -H. Tseng, Y. -C. Hsu, C. -Y. Yang, M. -H. Lai and D. -H. Wu, “A UAV open dataset of rice paddies for deep learning practice,” Remote Sens., vol. 13, no. 7, Apr. 2021, Art. no. 1358. doi: 10.3390/rs13071358. [Google Scholar] [CrossRef]
13. H. -H. Tseng, M. -D. Yang, R. Saminathan, Y. -C. Hsu, C. -Y. Yang and D. -H. Wu, “Rice seedling detection in UAV images using transfer learning and machine learning,” Remote Sens., vol. 14, no. 12, Jun. 2022, Art. no. 2837. doi: 10.3390/rs14122837. [Google Scholar] [CrossRef]
14. L. Yu et al., “An integrated rice panicle phenotyping method based on X-ray and RGB scanning and deep learning,” Crop J., vol. 9, no. 1, pp. 42–56, Feb. 2021. doi: 10.1016/j.cj.2020.06.009. [Google Scholar] [CrossRef]
15. Z. Qiu, H. Xiang, F. Ma, and C. Du, “Qualifications of rice growth indicators optimized at different growth stages using unmanned aerial vehicle digital imagery,” Remote Sens., vol. 12, no. 19, Oct. 2020, Art. no. 3228. doi: 10.3390/rs12193228. [Google Scholar] [CrossRef]
16. X. Wang et al., “Field rice panicle detection and counting based on deep learning,” Front Plant Sci., vol. 13, Aug. 2022, Art. no. 966495. doi: 10.3389/fpls.2022.966495. [Google Scholar] [PubMed] [CrossRef]
17. M. M. Anuar, A. A. Halin, T. Perumal, and B. Kalantar, “Aerial imagery paddy seedlings inspection using deep learning,” Remote Sens., vol. 14, no. 2, Jan. 2022, Art. no. 274. doi: 10.3390/rs14020274. [Google Scholar] [CrossRef]
18. B. Sun et al., “Universal detection of curved rice panicles in complex environments using aerial images and improved YOLOv4 model,” Front Plant Sci., vol. 13, Nov. 2022, Art. no. 1021398. doi: 10.3389/fpls.2022.1021398. [Google Scholar] [PubMed] [CrossRef]
19. C. Zhou et al., “Automated counting of rice panicle by applying deep learning model to images from unmanned aerial vehicle platform,” Sensors, vol. 19, no. 14, Jul. 2019, Art. no. 3106. doi: 10.3390/s19143106. [Google Scholar] [PubMed] [CrossRef]
20. Q. Yang, L. Shi, J. Han, Y. Zha, and P. Zhu, “Deep convolutional neural networks for rice grain yield estimation at the ripening stage using UAV-based remotely sensed images,” Field Crops Res., vol. 235, pp. 142–153, 2019. doi: 10.1016/j.fcr.2019.02.022. [Google Scholar] [CrossRef]
21. X. Bai et al., “Locating and sizing method based on high-throughput UAV RGB images,” Plant Phenomics, vol. 5, 2023, Art. no. 0020. doi: 10.34133/plantphenomics.0020 [Google Scholar] [CrossRef]
22. H. Wang, S. Lyu, and Y. Ren, “Paddy rice imagery dataset for panicle segmentation,” Agronomy, vol. 11, no. 8, 2021, Art. no. 1542. doi: 10.3390/agronomy11081542. [Google Scholar] [CrossRef]
23. Y. Song, P. Zhang, W. Huang, Y. Zha, T. You and Y. Zhang, “Object detection based on cortex hierarchical activation in border sensitive mechanism and classification-GIou joint representation,” Pattern Recognit., vol. 137, no. 2, May 2023, Art. no. 109278. doi: 10.1016/j.patcog.2022.109278. [Google Scholar] [CrossRef]
24. K. Chen et al., “MMDetection: Open MMLab detection toolbox and benchmark,” Jun. 17, 2019, arXiv.1906.07155. [Google Scholar]
Cite This Article
 Copyright © 2024 The Author(s). Published by Tech Science Press.
This work is licensed under a Creative Commons Attribution 4.0 International License , which permits unrestricted use, distribution, and reproduction in any medium, provided the original work is properly cited.
 Downloads
 Citation Tools