
 Submit a Paper
 Propose a Special lssue
 Open Access
ARTICLE

PUNet: A Semi-Supervised Anomaly Detection Model for Network Anomaly Detection Based on Positive Unlabeled Data
Faculty of Computing, Harbin Institute of Technology, Harbin, 150000, China
* Corresponding Author: Zhaoxin Zhang. Email:
Computers, Materials & Continua 2024, 81(1), 327-343. https://doi.org/10.32604/cmc.2024.054558
Received 31 May 2024; Accepted 19 August 2024; Issue published 15 October 2024
 View Full Text
 Download PDF
Abstract
Network anomaly detection plays a vital role in safeguarding network security. However, the existing network anomaly detection task is typically based on the one-class zero-positive scenario. This approach is susceptible to overfitting during the training process due to discrepancies in data distribution between the training set and the test set. This phenomenon is known as prediction drift. Additionally, the rarity of anomaly data, often masked by normal data, further complicates network anomaly detection. To address these challenges, we propose the PUNet network, which ingeniously combines the strengths of traditional machine learning and deep learning techniques for anomaly detection. Specifically, PUNet employs a reconstruction-based autoencoder to pre-train normal data, enabling the network to capture potential features and correlations within the data. Subsequently, PUNet integrates a sampling algorithm to construct a pseudo-label candidate set among the outliers based on the reconstruction loss of the samples. This approach effectively mitigates the prediction drift problem by incorporating abnormal samples. Furthermore, PUNet utilizes the CatBoost classifier for anomaly detection to tackle potential data imbalance issues within the candidate set. Extensive experimental evaluations demonstrate that PUNet effectively resolves the prediction drift and data imbalance problems, significantly outperforming competing methods.Keywords
Network anomaly detection holds a crucial position within the domain of network security [1]. It enables the identification of anomalous network traffic patterns stemming from cyberattacks, facilitates the monitoring and measurement of network data, and triggers appropriate countermeasures. Consequently, it constitutes an indispensable element in ensuring the security of networks [2–5].
The field of network anomaly detection can be broadly categorized into two primary research directions: traditional machine learning-based [6,7] and deep learning-based approaches [8,9]. Traditional machine learning techniques encompass density estimation methods (e.g., LOF [10] and KDE [11]), clustering-based methods (e.g., OC-SVM [12]), sample probability density distribution methods (e.g., ECOD [13] and COPOD [14]), and ensemble learning methods (e.g., IForest [15] and SUOD [16]). However, these methods often encounter challenges in capturing intricate offensive and defensive data patterns and exhibit a high dependence on anomalous data samples. In contrast, deep learning (DL)-based network anomaly detection methods leverage sophisticated neural network architectures such as autoencoders (AEs) [17,18], generative adversarial networks (GANs) [19,20], multi-layer perceptrons (MLPs) [21–23], or Transformers [24–26], which leverage their powerful representation capabilities to effectively model the underlying correlations among sample features, thereby significantly enhancing the performance of network anomaly detection. Nevertheless, DL-based network architectures leverage their powerful representation capabilities to effectively model potential correlations between sample features, leading to significant improvements in network anomaly detection performance. However, these methods often rely on zero-positive sample scenarios for model training and data fitting. This limitation restricts the model’s ability to generalize across diverse data distributions. Inconsistencies between the training and test data distributions can cause overfitting to the former, resulting in subpar performance on the latter. This phenomenon is known as prediction drift. Moreover, network anomaly detection is inherently challenging due to the rarity of abnormal data, which is easily obscured by normal data.
To address the aforementioned challenges, we propose PUNet, a semi-supervised representation learning method for anomaly detection. PUNet adeptly integrates traditional machine learning with deep learning techniques to effectively mitigate the prediction drift problem arising from inconsistent data distributions between training and test sets, as well as the performance degradation caused by imbalanced training data in subsequent anomaly detection classifiers. Specifically, the PUNet architecture begins with a variational recurrent neural network (VRNN) [27] for pre-training on normal data, which integrates the architecture of a variational autoencoder (VAE) [28] and a recurrent neural network (RNN) [29] to effectively capture temporal dependencies and latent variable representations in the data. Subsequently, PUNet employs a candidate set sampling algorithm based on sample reconstruction loss to construct a pseudo-labeled training candidate set containing anomaly data. This approach ensures that the distribution of the candidate set aligns with that of the test set, effectively resolving the prediction drift problem. Finally, considering potential data imbalance within the candidate set, PUNet utilizes CatBoost [30] as the classifier for network anomaly detection. Extensive experimental evaluations demonstrate that PUNet effectively tackles the prediction drift and data imbalance problems, leading to improved network anomaly detection performance and enhanced robustness. The primary contributions of this article can be summarized as follows:
(1) We propose a novel semi-supervised anomaly detection method, named PUNet, which seamlessly integrates traditional machine learning and DL techniques, which effectively solves the prediction offset problem and data imbalance problem caused by inconsistent data distribution, and shows significant advantages in network anomaly detection tasks.
(2) We propose a candidate set sampling algorithm based on reconstruction loss (CSSARL) to mitigate prediction drift between the training set and test set, which stems from inconsistent data distribution, in subsequent anomaly detection algorithms.
(3) We introduce a VRNN-based feature extraction module and a CatBoost anomaly detection module to address the feature encoding and data imbalance challenges of network traffic data.
Experimental results show that PUNet outperforms the one-class semi-supervised network anomaly detection algorithms in terms of Area Under the Receiver Operating Characteristic Curve (AUCROC) and Area Under the Precision-Recall Curve (AUCPR) scores on CTU13 and CIRA-CIC-DoHBrw-2020 datasets.
The remainder of this paper is organized as follows: Section 2 briefly reviews related work. Section 3 presents the details of the proposed PUNet framework. Section 4 compares the test results of the PUNet framework and ablation experiments. Finally, Section 5 concludes the paper.
In this section, we review recent advances in one-class network anomaly detection algorithms and DL-based network anomaly detection algorithms.
2.1 One-Class Classification-Based Network Anomaly Detection Algorithm
Semi-supervised one-class network anomaly detection algorithms, deeply rooted in traditional machine learning techniques, leverage labeled normal samples and unlabeled data during the training process. These algorithms aim to distinguish between normal and abnormal samples and identify outliers within the unlabeled data. Notable semi-supervised one-class anomaly detection algorithms include those based on support vector machines (SVMs) [12], probability density estimation, and gradient boosting decision trees (GBDTs). These algorithms capitalize on limited labeled data to train models, enabling effective outlier detection in unlabeled data scenarios.
Miao et al. [12] introduced a real-time intrusion detection system utilizing the OC-SVM (one-class support vector machine) algorithm. By monitoring and analyzing running container kernel system calls, training data in a secure environment, and evaluating the system’s enhanced network attack detection capabilities, they demonstrated the OC-SVM algorithm’s efficacy across various feature extraction methods, kernel functions, and segment lengths. Inspired by copula theory for modeling multivariate data distributions, Li et al. [14] proposed the COPOD outlier detection algorithm. COPOD estimates the tail probability of each data point by constructing an empirical link function, enabling anomaly assessment. This algorithm exhibits parameter-free, highly interpretable, and efficient computational characteristics. Building upon this work, Li et al. [13] presented ECOD (outlier detection based on empirical cumulative distribution), a semi-supervised algorithm. ECOD estimates the underlying data distribution by computing the empirical cumulative distribution for each data dimension. Subsequently, these empirical distributions are used to evaluate the tail probabilities for each data point, which are then aggregated to calculate an outlier score for each data point. The method’s parameter-free nature and ease of interpretation have been validated through extensive experiments. Furthermore, Zhao et al. [16] consolidated previous research and proposed the SUOD ensemble learning algorithm. SUOD aims to leverage the outliers of abnormal samples to expedite the training and scoring of new samples.
In summary, semi-supervised one-class anomaly detection methods grounded in machine learning exhibit promising anomaly detection performance in specific tasks involving sequence data and low-dimensional encoded data. However, as data volumes and complexity escalate, coupled with increasingly stringent anomaly detection requirements, traditional methods encounter challenges in capturing intricate data patterns and inter-sample dependencies.
2.2 Semi-Supervised Network Anomaly Detection Based on DL
Benefiting from automatic feature learning and intricate model architectures, DL-based anomaly detection algorithms are superior to traditional machine learning methods in terms of data fitting ability and scenario applicability. This advantage becomes particularly pronounced when handling large-scale and complex data sets. Consequently, semi-supervised anomaly detection techniques DL-based have gained widespread adoption in various domains, including network security [31–33], financial fraud detection [34–36], and medical diagnosis [37].
DL-based anomaly detection algorithms primarily leverage architectures such as AEs [17,18], GANs [19,20], MLPs [21–23] and Transformers [24–26] to extract hidden layer features from network data streams. These features are subsequently employed to construct a scoring network or are evaluated based on reconstruction losses to identify anomalous data. Monshizadeh et al. [38] introduced a hybrid architecture that combines conditional variational autoencoders (CVAEs) and random forest (RF) classifiers, which enables the automatic learning of similarities between input features and provides data distribution information. By extracting discriminative features from the original features, the model can classify various types of attacks. Similarly, Wang et al. [39] introduced BAE (BIRCH-Autoencoder), an outlier detection algorithm that ingeniously integrates a clustering algorithm and an autoencoder, which employs the BIRCH clustering algorithm for pre-classification and combines it with an autoencoder model. This integration facilitates threshold-based outlier detection, leading to improved performance on network security data sets. Furthermore, Li et al. [40] introduced OC-LSTM, a semi-supervised learning method that seamlessly integrates the traditional one-class support vector machine (OC-SVM) with a long short-term memory recurrent neural network (LSTM), which effectively tackles the challenge of outlier detection through end-to-end training and target loss optimization functions. Moreover, it efficiently handles data set imbalance issues, as evidenced by its superior performance on multiple complex network traffic datasets.
In brief, the aforementioned one-class semi-supervised anomaly detection algorithms are typically trained using only a single data category (i.e., anomaly detection in zero-positive scenarios). This limitation restricts the model’s ability to generalize to diverse data distributions. Considering the potential inconsistency between the training set and test set data distributions, the model may overfit on the training set, leading to prediction bias on the test set. To address this challenge, we propose the PUNet network. PUNet first employs a variational recurrent neural network (VRNN) for pre-training on a zero-positive data set to capture underlying dependencies and latent variable representations within the data. Subsequently, the Candidate Set Sampling Algorithm based on Reconstruction Loss (CSSARL) constructs a pseudo-label candidate set on the unlabeled data set, effectively mitigating the prediction offset issue. Finally, the CatBoost classifier is utilized for anomaly detection to handle potential data imbalance within the candidate set. Compared with other single-class anomaly detection algorithms, PUNet effectively resolves the prediction drift problem and achieves superior network anomaly detection performance.
As depicted in Fig. 1, the PUNet framework comprises four primary components: Traffic Preprocessing Module (TPM), which is responsible for data acquisition, preprocessing, and normalization. Traffic Feature Extraction Module (TFEM), which employs a VRNN to extract high-level features from the preprocessed data. Candidate Set Sampling Module (CSSM), which constructs a pseudo-label candidate set using the CSSARL algorithm to address the prediction offset problem. Anomaly Detection Module (ADM), which utilizes the CatBoost classifier for anomaly detection, effectively handling potential data imbalance within the candidate set.
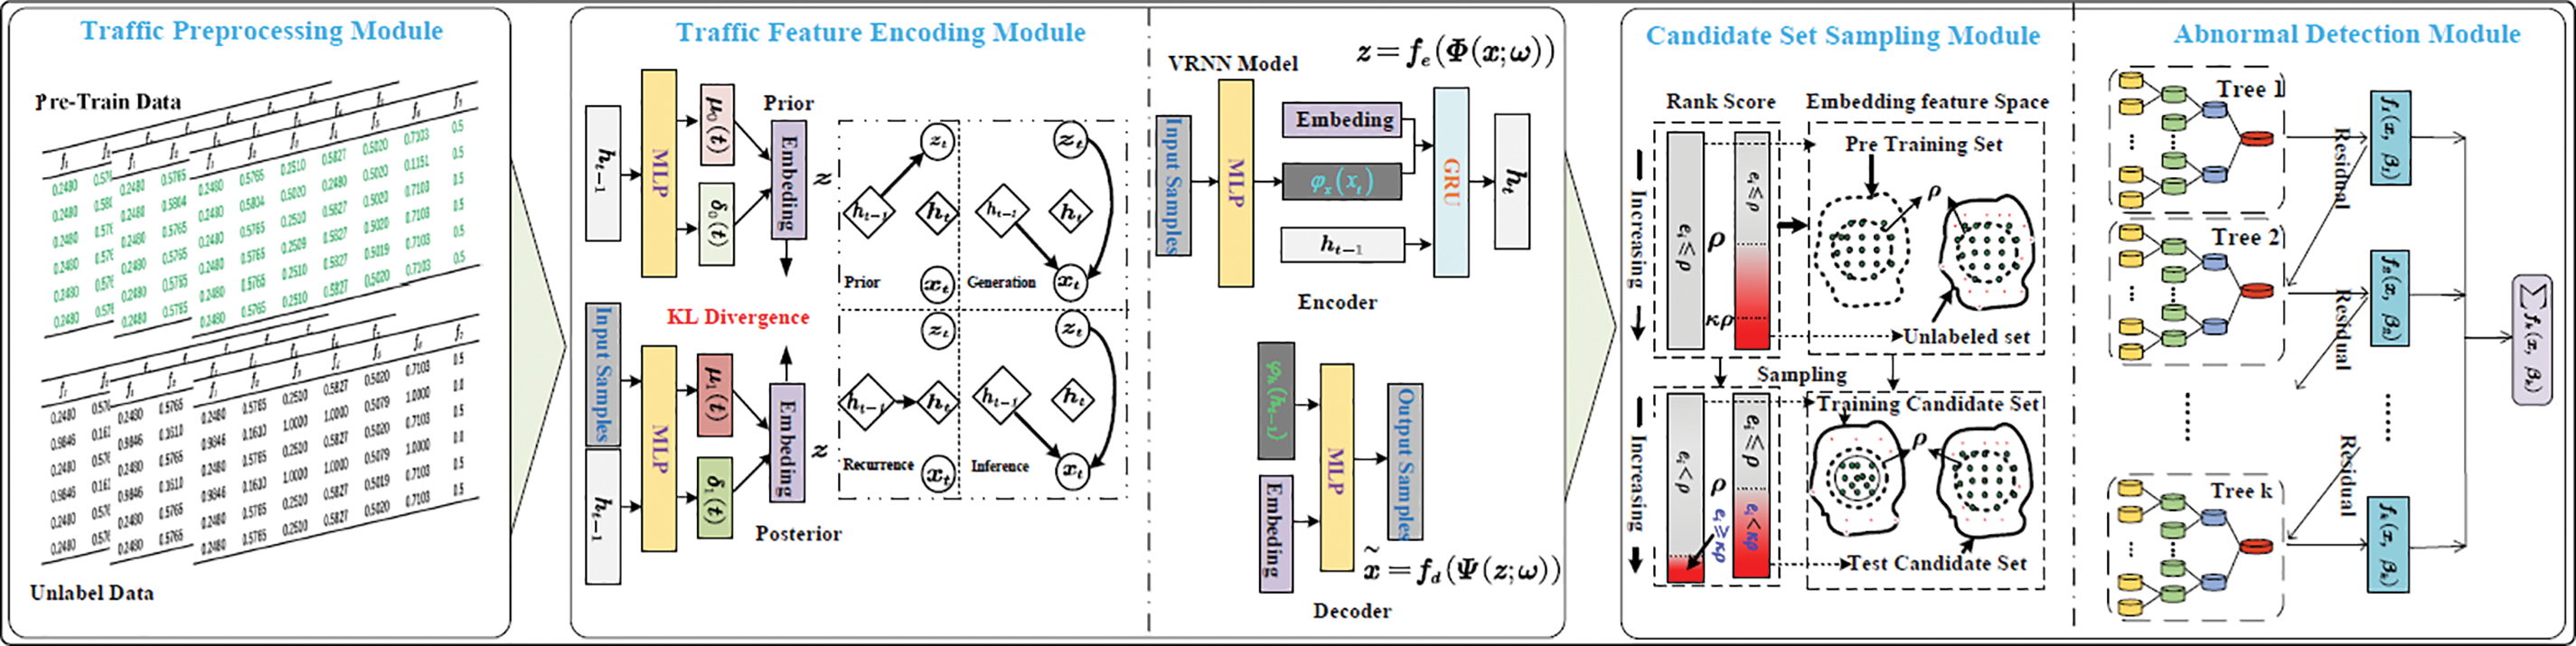
Figure 1: Architecture of PUNet, which includ es traffic preprocessing module, traffic feature extraction module, candidate set sampling module, and anomaly detection module
3.1 Traffic Feature Extraction Module
TFEM is employed to extract hidden layer feature representations
• Feature Encoding (FE): Given n normal flow data as
where
Feature Decoding (FD): The feature decoding process aims to reconstruct the input data
where
Variational Lower Bound: TFEM adopts VRNN, a time series model, and learns data prior information to improve data reconstruction and obtain the correct hidden layer representation
which the first term is to minimize the reconstruction error
Leveraging TFEM, we reconstruct the high-dimensional original traffic data
where
3.2 Candidate Set Sampling Module
Leveraging the TFEM, we extract the feature representation and reconstruction error set of the training set, as well as the feature representation and reconstruction error set of the unlabeled data set. We define the training set data with reconstruction errors smaller than the maximum reconstruction error of the training set as the inlier candidate set
• Normal Candidate Set
where
Pseudo-Label-Based Outlier Candidate Set
By constructing the normal candidate set
The anomaly detection module employs CatBoost as the primary architecture for the classification stage of the PUNet network. CatBoost is a classification algorithm based on boosted trees. Despite its numerous parameters, only a select few significantly influence model performance. A notable advantage of the CatBoost model is that many parameters require minimal adjustment, and satisfactory prediction accuracy can be achieved even with default parameter settings. Therefore, in the anomaly classifier, we employ a combination of grid search and ten-fold cross-validation to optimize a few critical parameters, including the learning rate, tree depth, number of trees, and L2 regularization parameter. All other parameters are set to their default values. The output pseudo-label candidate set generated by CSSM is fed into CatBoost to train an anomaly detection classifier.
After the CSSM, we obtain a set of labeled candidate training data sets
Assume that the feature space
where
In the gradient boosting process, a series of approximate functions
where
After
It is worth mentioning that the target of the first tree
CatBoost processes categorical features during training rather than during preprocessing: for each example, CatBoost performs a random permutation of the dataset and calculates the average label value for that example where the same class value precedes the given class value in the permutation:
where
All categorical features can be combined into a new feature. When constructing new splits for trees, CatBoost considers combinations in a greedy manner. The first split in a tree does not consider any combinations, but for subsequent splits, CatBoost combines all predefined combinations with all categorical features in the dataset. All splits selected in the tree are treated as categories with two values and are used in combination. By sampling based on the Ordered Boosting principle, CatBoost improves upon the standard gradient boosting process, achieving unbiased boosting. Finally, CatBoost uses a forgetting tree as the base predictor, where the same splitting criterion is used throughout the entire tree level. Such trees are balanced and less prone to overfitting. In a forgetting tree, each leaf index is encoded as a binary vector of length equal to the tree depth. Through these combinations, CatBoost achieves high generalization performance.
A two-stage training strategy is adopted to build PUNet. In the first stage, only normal samples are used for pre-training to train the TFEM module. In this stage, all samples containing only normal data can well obtain a hidden layer representation vector, reconstruction error and reconstruction residual, which can uniquely represent the original data. Then we randomly sample part of the data from the unlabeled dataset through the trained TFEM module, and then combine the CSSARL algorithm to obtain part of the pseudo-labeled abnormal data. In the second stage, TFEM is used to use the extracted features and the pseudo-label candidate set provided by the CSSM module to provide input for the subsequent ADM module. The CatBoost algorithm in the ADM module can effectively use part of the pseudo-labeled abnormal data provided by the CSSM module and use it as a priori, thereby effectively realizing anomaly detection.
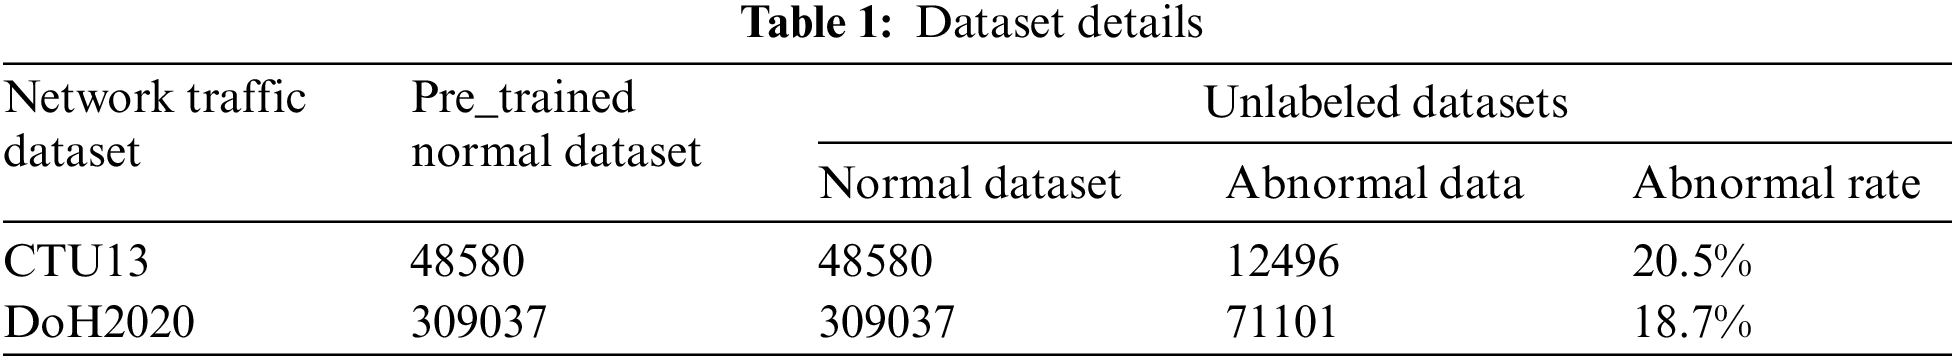
The network anomaly detection performance of PUNet is evaluated on two publicly available encrypted traffic anomaly detection datasets, namely CTU13 [41] and CIRA-CIC-DoHBrw-2020 (DoH2020) [42]. Before using these datasets for anomaly detector evaluation, processing and reconstructing the dataset is a critical step, which involves operations such as encoding and normalizing key features of the dataset to improve the quality of the data and enhance the accuracy of the detection results. Specifically, we first extract the initial 500 bytes of the payload of an individual data flow in each dataset to capture the basic characteristics of the data flow. Then, data streams exceeding 500 bytes are truncated to ensure consistency, and data streams less than 500 bytes in length are numerically padded to maintain the uniformity of training and test data. Finally, we normalized the data to ensure consistent data distribution between different data sets, thereby providing a more consistent and comparable data basis for subsequent network anomaly detection. Table 1 shows the details of the datasets.
Common network anomaly detection methods typically use one-class anomaly scores to identify outliers, usually by setting a threshold to determine anomalies. However, determining an appropriate threshold is a challenging task and often requires domain expertise and continuous tuning. To overcome this problem, this study adopts two methods to evaluate anomaly detection performance: Precision-Recall Area Under Curve (AUCPR) and Receiver Operating Characteristic Area Under Curve (AUCROC). These two methods comprehensively consider all possible thresholds, thereby providing a more comprehensive assessment of anomaly detection performance. In anomaly detection, normal samples are typically much more abundant than abnormal samples, leading to Precision-Recall curves being more reflective of the true performance of the model in network anomaly detection. AUCPR comprehensively considers Precision and Recall, thus providing a more accurate evaluation of the model’s performance at different thresholds, unaffected by sample imbalance issues. In contrast, AUCROC represents the area under the Receiver Operating Characteristic curve, reflecting the relationship between True Positive Rate (TPR) and False Positive Rate (FPR), while AUCPR focuses on the relationship between Precision and Recall. AUCROC is mainly used to evaluate the overall predictive performance of both normal and abnormal categories, whereas AUCPR emphasizes performance centered around anomalies. It is worth mentioning that both AUCROC and AUCPR range from 0 to 1, where higher values indicate better network anomaly detection performance.
4.3 Compare Algorithm and Model Parameter Settings
Competing Methods: PUNet is compared with eight semi-supervised anomaly detection methods, namely: ECOD [13], COPOD [14], OCSVM [12], IForest [15], INNE [5], LOF [10], KDE [11], and SUOD [16]. All comparison algorithms are implemented using the PyOD library in Python, and all methods use default parameters. It is worth noting that PUNet is implemented based on the PyTorch framework and experimented on a computer equipped with a GeForce RTX 3090 GPU and an Intel (R) Xeon (R) Silver 4216 CPU using PyTorch 2.0.0 framework through PyCharm 2022.2.5 (Community Edition).
Parameter Settings: By default, the input encoder and prior encoder of PUNet consist of two linear encoding layers and one Batchnorm1D regularization layer. The decoder structure is similar, using a GRU neural network as the intermediate hidden layer. The activation function for the intermediate layers is ReLU, while the final output layer uses the Sigmoid function as its activation function. The input data dimension is 500, and the dimension of the encoded data is 128, the learning rate is 1e−4. It is worth noting that the PUNet model underwent a total of 200 epochs during training, with a batch size of 128 for each batch, the parameter of the GRU module is 1024. At the end of each training stage, the obtained validation results were used to evaluate the model’s generalization ability, aiding in determining whether to retain the trained TFEM. For the CSSM, 95% of the pre-training set data was selected as the training set, the
4.4 Experiment Results with Competitive Methods
In this section of the experiment, we focus on describing the network anomaly detection performance of PUNet on the data sets DoH2020 and CTU13. To illustrate the advantages of this algorithm, we compared the performance of eight baseline algorithms with PUNet in terms of AUCROC and AUCPR, as shown in the Table 2.
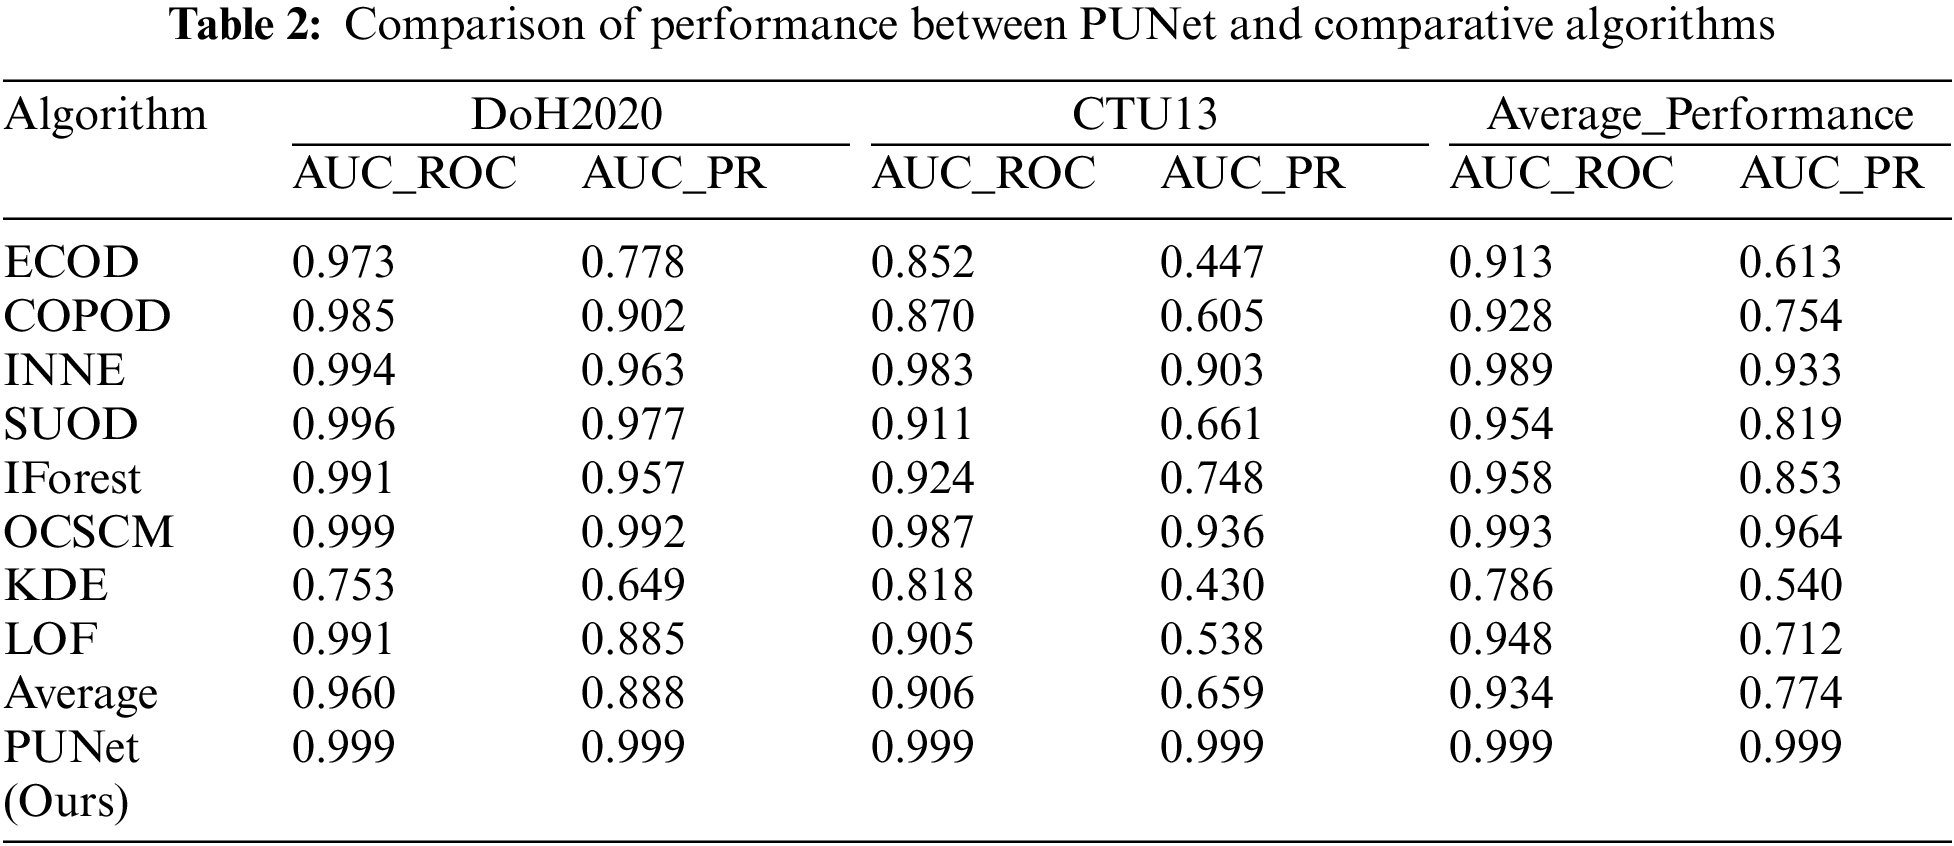
According to the results in the Table 2, it can be observed that PUNet achieved the best objective indicators on both the data sets Doh and CTU13. It is worth noting that compared with the suboptimal method, PUNet improved the AUCPR of the dataset DoH by 0.7%, and improved the AUCROC and AUCPR of the dataset CTU13 by 1.2% and 6.3%, respectively.
4.5.1 Pseudo-Label Data Set Validity Verification
In this section, we test the impact of different sampling ratios on the selection of pseudo-label data in outliers on the results.
Notably, we consider the sample ratio in the candidate set. Given that the unlabeled data set
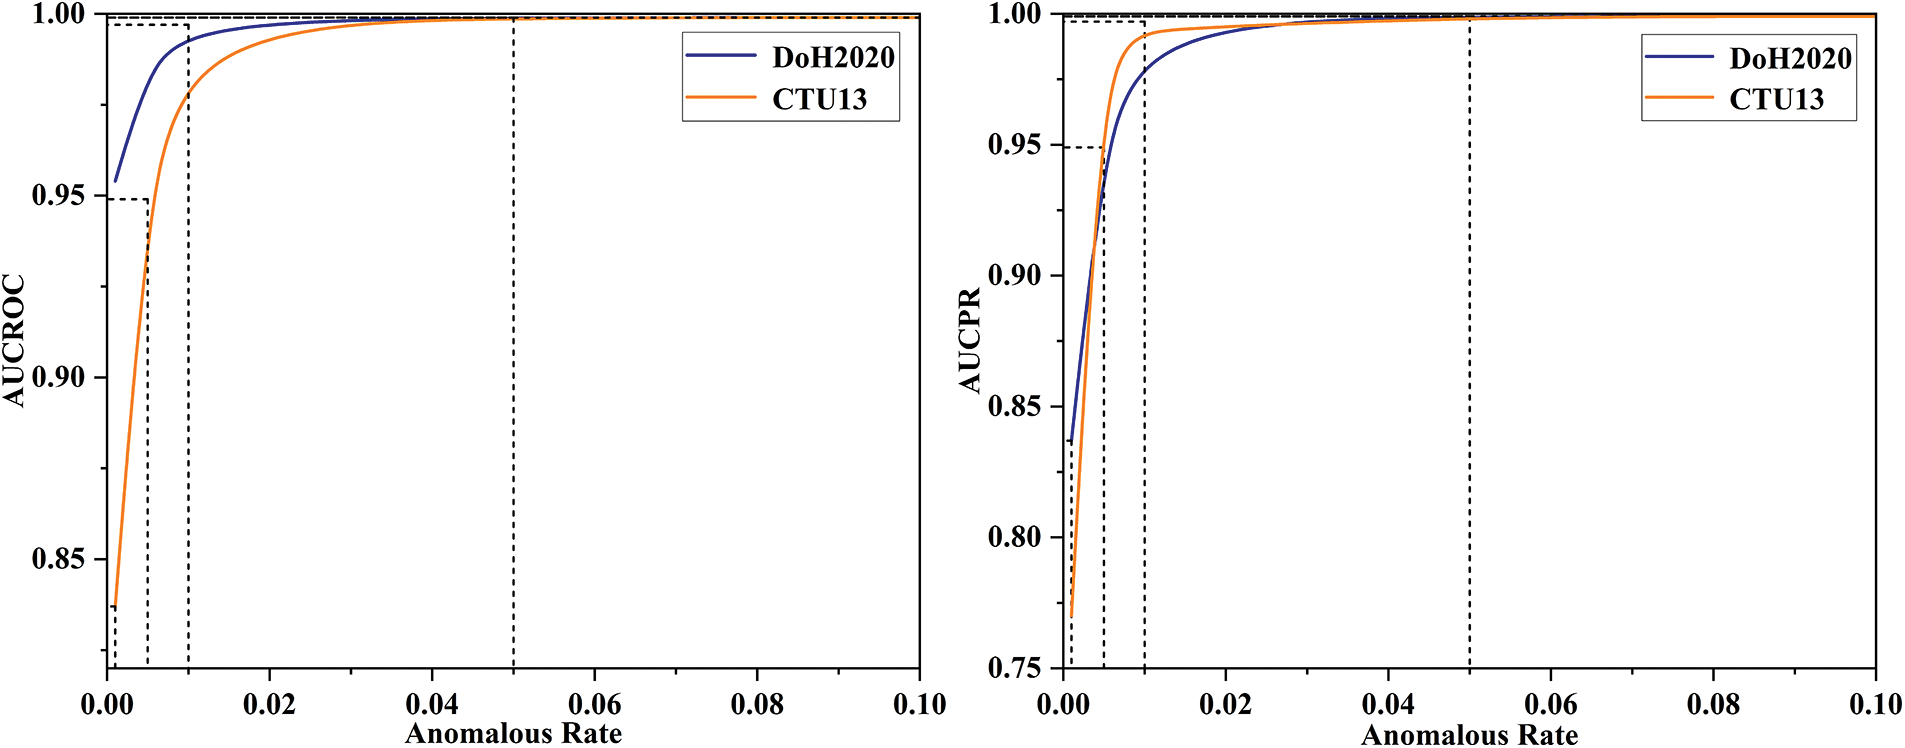
Figure 2: Impact of different sampling rate on the results in abnormal pseudo-label data
4.5.2 Model Robustness against Contamination
In this section, we test the performance comparison of PUNet and five comparison algorithms on two datasets under different contamination rates of the training set data:
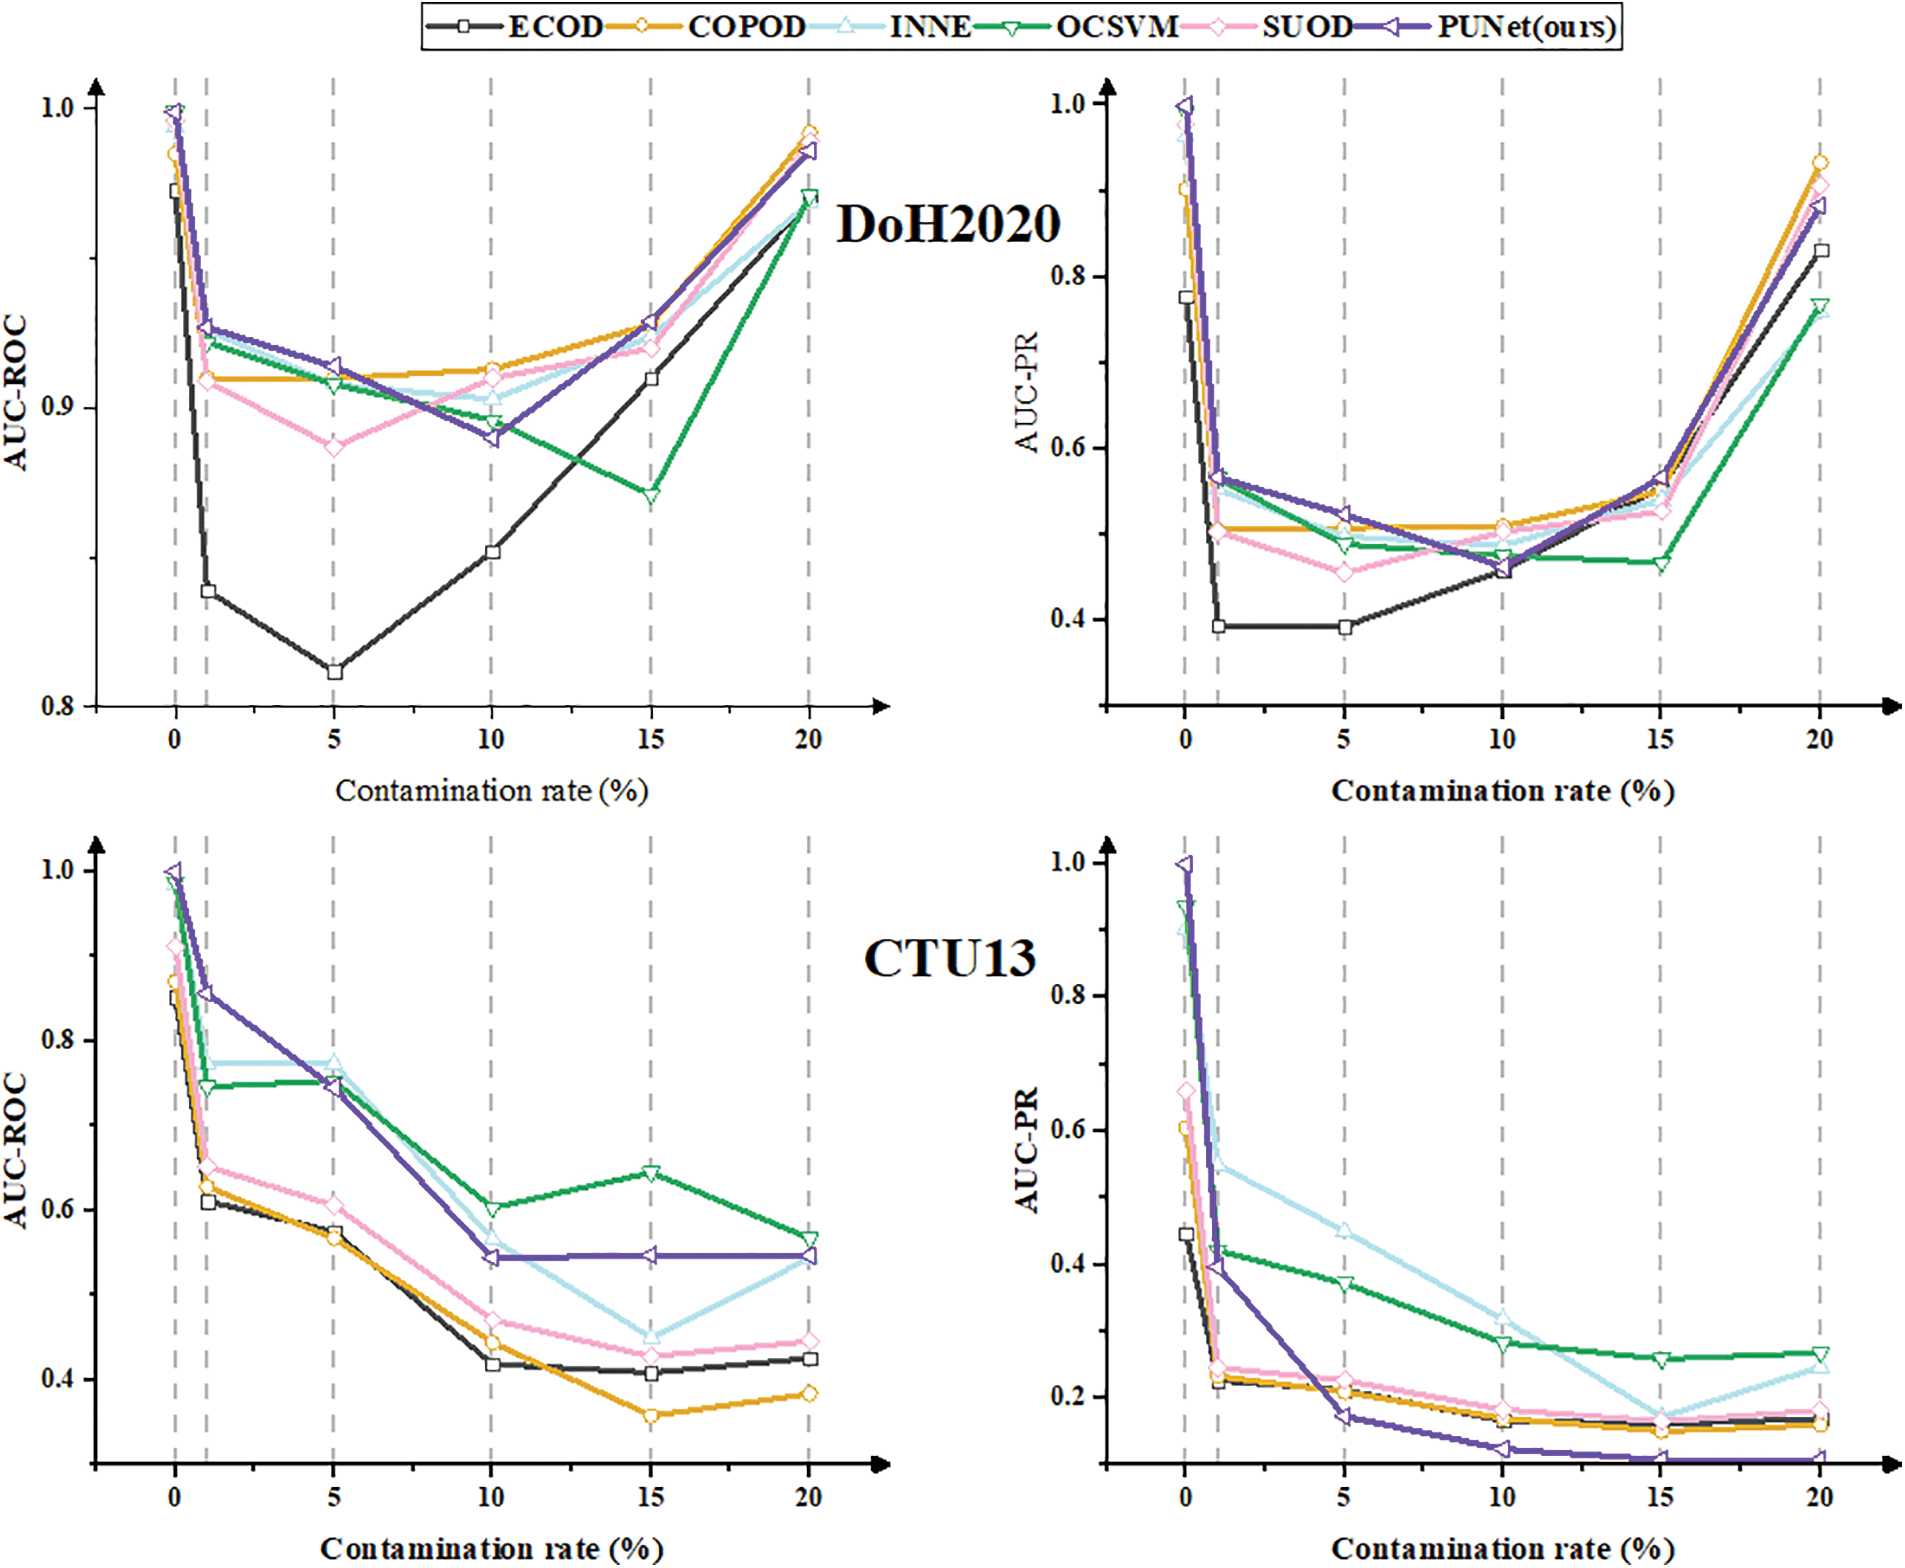
Figure 3: Comparison of robustness against contamination between PUNet and comparative algorithms
According to the experimental results of the performance comparison between PUNet and the five network anomaly detection methods, it can be seen that for the performance indicators on the DoH2020 dataset, PUNet achieves the optimal anomaly detection performance when the contamination rates are at 1%, 5%, and 15%. However, for the performance indicators of the CTU13 dataset, the network anomaly detection performance of PUNet and the five network anomaly detection methods gradually declines with the increase in contamination rate. Compared with most anomaly detection classification algorithms. PUNet performs relatively well and is more robust than other comparison algorithms.
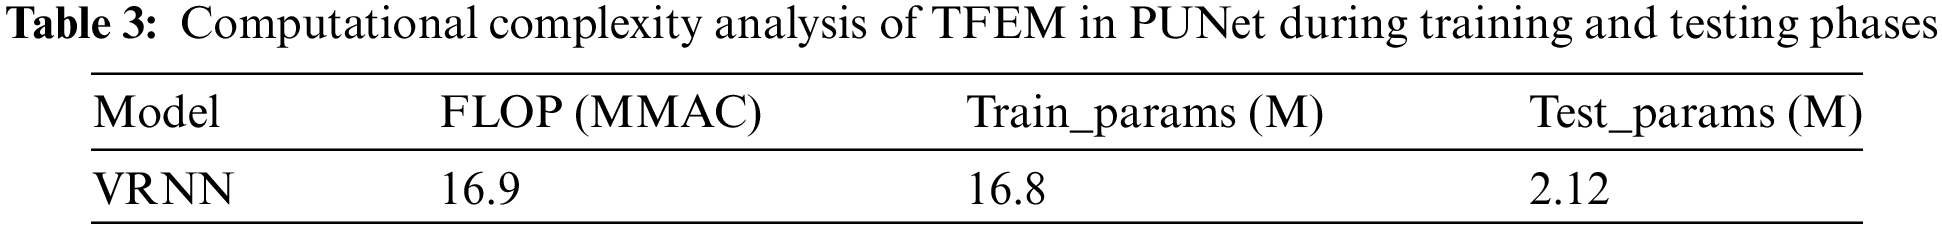
In this part, we present a time complexity evaluation of the proposed PUNet. For the sake of comprehensive comparison, we conducted computational complexity analysis on each component of the model. Notably, since the front end of the model is based on the TFEM of VRNN, we employ two indicators: Floating-point Operations (Flops) and Parameters (Params).
• TFEM Complexity: The complexity of a learning network is a key metric for evaluating its performance and resource requirements. VRNN is used in PUNet for feature extraction. VRNN is a generative model that combines the ideas of autoencoders and probabilistic graphical models. Its principle has been introduced in detail in Section 3.1. The time complexity of TFEM is shown in Table 3. During TFEM training, FLOP and Params were around 16.9 M, but during testing, it was only 2.12 M, which is only 1/8 of the training. Capable of handling applications in large-scale networks.
• CatBoost Complexity: The complexity of the CatBoost model is primarily influenced by the number and depth of trees, the complexity of feature handling, and the size of the model. During training, CatBoost continuously constructs a series of decision trees, with each tree built to minimize the loss of the previous trees. Thus, it optimizes the loss function using gradient descent to establish the final classifier model. Hence, the overall time complexity becomes
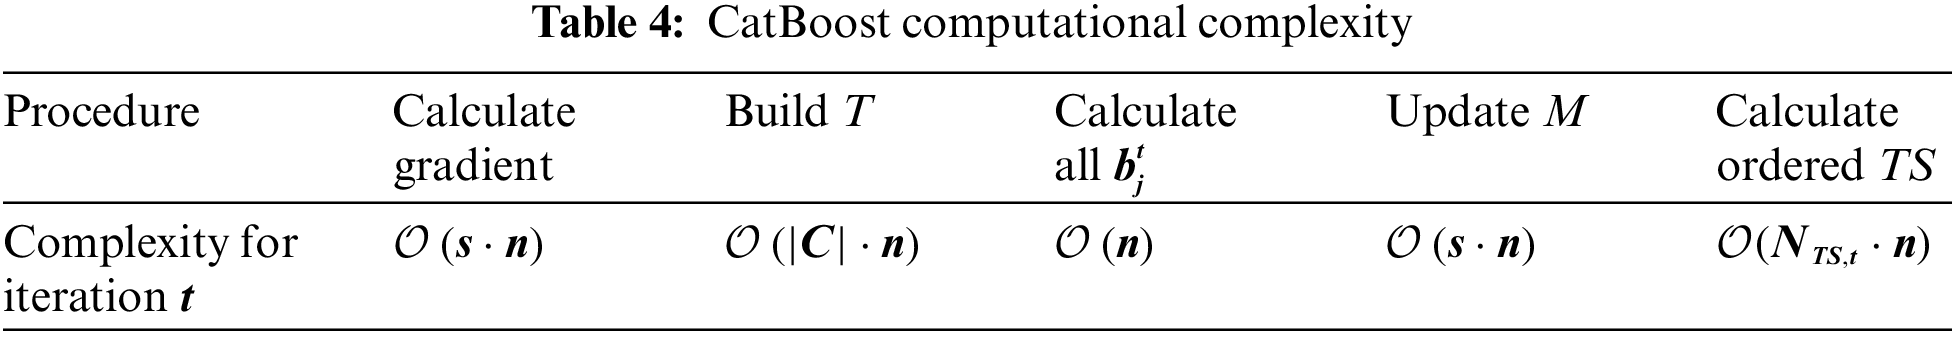
When looking at how complex PUNet is overall, we need to consider two main parts: a) The VRNN in the TEFM part: Its complexity is
In this paper, we propose PUNet, a novel semi-supervised network anomaly detection model, to tackle the prediction drift and data imbalance challenges in semi-supervised one-class anomaly detection. Specifically, in the feature encoding stage, PUNet transforms the input data into a more informative representation, where typical anomalies can deviate significantly from normal samples. Subsequently, we propose CSSARL to address the prediction drift issue caused by discrepancies in the distribution of training set data and test set data. Finally, we introduce a CatBoost-based ADM to handle the data imbalance problem. Extensive experiments demonstrate that the proposed method effectively mitigates prediction drift and data imbalance issues in network anomaly detection and outperforming competing methods. In our future work, we plan to make our model stronger and safer. We will study how bad data and hidden attacks can affect how well the model works, and create ways to find and stop these problems. This will help our model work better in tricky situations. We will also make the model easier to use and faster, so it can work well in real-time. To make sure our model is useful in many different situations, we will test it on more types of network data. We want to see how well it can adapt to different network setups and make it better at handling new situations. All of this work will help make sure our model is useful in real-world situations.
Acknowledgement: The authors appreciate the reviewers and editors for their valuable feedback on this work.
Funding Statement: None.
Author Contributions: Gang Long: Conceptualization, Methodology, Writing—original and editing, Software and Investigation; Zhaoxin Zhang: Investigation, Supervision and Writing—original draft. All authors reviewed the results and approved the final version of the manuscript.
Availability of Data and Materials: Data available on request from the authors.
Ethics Approval: Not applicable.
Conflicts of Interest: The authors declare that they have no conflicts of interest to report regarding the present study.
References
1. F. Ullah, G. Srivastava, S. Ullah, and L. Mostarda, “Privacy-preserving federated learning approach for distributed malware attacks with intermittent clients and image representation,” IEEE Trans. Consum. Electron., vol. 70, no. 1, pp. 4585–4596, Feb. 2024. doi: 10.1109/TCE.2023.3342644. [Google Scholar] [CrossRef]
2. F. Ullah, G. Srivastava, S. Ullah, K. Yoshigoe, and Y. Zhao, “NIDS-VSB: Network intrusion detection system for VANET using spark-based big data optimization and transfer learning,” IEEE Trans. Consum. Electron., vol. 70, no. 1, pp. 1798–1809, Feb. 2024. doi: 10.1109/TCE.2023.3328320. [Google Scholar] [CrossRef]
3. F. Ullah, S. Ullah, G. Srivastava, and J. C. W. Lin, “IDS-INT: Intrusion detection system using transformer-based transfer learning for imbalanced network traffic,” Digit. Commun. Netw., vol. 10, no. 1, pp. 190–204, Feb. 2024. doi: 10.1016/j.dcan.2023.03.008. [Google Scholar] [CrossRef]
4. M. Luo, K. Wang, Z. Cai, A. Liu, Y. Li and C. F. Cheang, “Using imbalanced triangle synthetic data for machine learning anomaly detection,” Comput. Mater. Contin., vol. 58, no. 1, pp. 1–12, Jan. 2019. doi: 10.32604/cmc.2019.03708. [Google Scholar] [CrossRef]
5. K. V. Thakare, N. Sharma, D. P. Dogra, H. Choi, and I. -J. Kim, “A multi-stream deep neural network with late fuzzy fusion for real-world anomaly detection,” Expert. Syst. Appl., vol. 201, Sep. 2022, Art. no. 117030. doi: 10.1016/j.eswa.2022.117030. [Google Scholar] [CrossRef]
6. T. A. Nguyen, J. He, L. T. Le, W. Bao, and N. H. Tran, “Federated PCA on Grassmann manifold for anomaly detection in IoT networks,” in IEEE INFOCOM 2023-IEEE Conf. on Comput. Commun., May 2023, pp. 1–10. doi: 10.1109/INFOCOM53939.2023.10229026. [Google Scholar] [CrossRef]
7. F. Wan, Y. Hua, B. Liao, T. Ma, and X. Qing, “Distributed estimation with novel adaptive data selection based on a cross-matching mechanism,” Circuits Syst. Signal Process., vol. 42, no. 10, pp. 6324–6346, Oct. 2023. doi: 10.1007/s00034-023-02410-6. [Google Scholar] [CrossRef]
8. C. T. Dinh, N. Tran, and J. Nguyen, “Personalized federated learning with Moreau envelopes,” Adv. Neural Inf. Process. Syst., pp. 21394–21405, 2020. doi: 10.48550/arXiv.2006.08848. [Google Scholar] [CrossRef]
9. Z. Wu, H. Li, Y. Qian, Y. Hua, and H. Gan, “Poison-resilient anomaly detection: Mitigating poisoning attacks in semi-supervised encrypted traffic anomaly detection,” IEEE Trans. Netw. Sci. Eng., vol. 1, no. 1, pp. 1–14, May 2024. doi: 10.1109/TNSE.2024.3397719. [Google Scholar] [CrossRef]
10. H. Gao, B. Qiu, R. J. D. Barroso, W. Hussain, Y. Xu and X. Wang, “TSMAE: A novel anomaly detection approach for Internet of Things time series data using memory-augmented autoencoder,” IEEE Trans. on Netw. Sci. Eng., vol. 10, no. 5, pp. 2978–2990, Sep.–Oct. 2023. doi: 10.1109/TNSE.2022.3163144. [Google Scholar] [CrossRef]
11. W. Hu, J. Gao, B. Li, O. Wu, J. Du and S. Maybank, “Anomaly detection using local kernel density estimation and context-based regression,” IEEE Trans. Knowl. Data Eng., vol. 32, no. 2, pp. 218–233, Feb. 2020. doi: 10.1109/TKDE.2018.2882404. [Google Scholar] [CrossRef]
12. X. Miao, Y. Liu, H. Zhao, and C. Li, “Distributed online one-class support vector machine for anomaly detection over networks,” IEEE Trans. Cybern., vol. 49, no. 4, pp. 1475–1488, Apr. 2019. doi: 10.1109/TCYB.2018.2804940. [Google Scholar] [PubMed] [CrossRef]
13. Z. Li, Y. Zhao, X. Hu, N. Botta, C. Ionescu and G. Chen, “ECOD: Unsupervised outlier detection using empirical cumulative distribution functions,” IEEE Trans. Knowl. Data Eng., vol. 35, no. 12, pp. 12181–12193, 2023. doi: 10.1109/TKDE.2022.3159580. [Google Scholar] [CrossRef]
14. Z. Li, Y. Zhao, N. Botta, C. Ionescu, and X. Hu, “COPOD: Copula-based outlier detection,” in 2020 IEEE Int. Conf. on Data Mining (ICDM), 2020, pp. 1118–1123. doi: 10.1109/ICDM50108.2020.00135. [Google Scholar] [CrossRef]
15. F. T. Liu, K. M. Ting, and Z.-H. Zhou, “Isolation-based anomaly detection,” ACM Trans. Knowl. Discov. Data, vol. 6, no. 1, pp. 1–39, 2012. doi: 10.1145/2133360.2133363. [Google Scholar] [CrossRef]
16. Y. Zhao et al., “SUOD: Accelerating large-scale unsupervised heterogeneous outlier detection,” Proc. of Mach. Learn. Syst., vol. 3, pp. 463–478, 2021. [Google Scholar]
17. Y. Mirsky, T. Doitshman, Y. Elovici, and A. Shabtai, “Kitsune: An ensemble of autoencoders for online network intrusion detection,” in Netw. Distrib. Syst. Security Symp., 2018, pp. 1–15. doi: 10.48550/arXiv.1802.09089. [Google Scholar] [CrossRef]
18. V. L. Cao, M. Nicolau, and J. McDermott, “Learning neural representations for network anomaly detection,” IEEE Trans. Cybern., vol. 49, no. 8, pp. 3074–3087, Aug. 2018. doi: 10.1109/TCYB.2018.2838668. [Google Scholar] [PubMed] [CrossRef]
19. K. Wei, S. Yu, and Q. Pan, “Mobile crowdsourcing task allocation based on dynamic self-attention GANs,” Comput. Mater. Contin., vol. 79, no. 1, pp. 1–16, Apr. 2024. doi: 10.32604/cmc.2024.048240. [Google Scholar] [CrossRef]
20. D. Li, X. Nie, R. Gong, X. Lin, and H. Yu, “Multi-branch GAN-based abnormal events detection via context learning in surveillance videos,” IEEE Trans. Circuits Syst. Video Technol., vol. 34, no. 5, pp. 3439–3450, May 2024. doi: 10.1109/TCSVT.2023.3325451. [Google Scholar] [CrossRef]
21. Y. Chen, Z. Liu, B. Zhang, W. Fok, X. Qi and Y. -C. Wu, “MGFN: Magnitude-contrastive glance-and-focus network for weakly-supervised video anomaly detection,” Proc. AAAI Conf. on Artif. Intell., vol. 37, no. 1, pp. 387–395, 2023. doi: 10.1609/aaai.v37i1.25112. [Google Scholar] [CrossRef]
22. Y. Su, Y. Tan, M. Xing, and S. An, “VPE-WSVAD: Visual prompt exemplars for weakly-supervised video anomaly detection,” Knowl.-Based Syst., vol. 299, no. 1, pp. 1–12, May 2024. doi: 10.1016/j.knosys.2024.111978. [Google Scholar] [CrossRef]
23. Y. Wu, S. Zhao, Z. Xing, Z. Wei, Y. Li and Y. Li, “Detection of foreign objects intrusion into transmission lines using diverse generation model,” IEEE Trans. Power Deliv., vol. 38, no. 5, pp. 3551–3560, Oct. 2023. doi: 10.1109/TPWRD.2023.3279891. [Google Scholar] [CrossRef]
24. C. Zhang, X. Wang, H. Zhang, H. Zhang, and P. Han, “Log sequence anomaly detection based on local information extraction and globally sparse transformer model,” IEEE Trans. Netw. Serv. Manag., vol. 18, no. 4, pp. 4119–4133, Dec. 2021. doi: 10.1109/TNSM.2021.3125967. [Google Scholar] [CrossRef]
25. S. Huang et al., “HitAnomaly: Hierarchical transformers for anomaly detection in system log,” IEEE Trans. Netw. Serv. Manag., vol. 17, no. 4, pp. 2064–2076, Dec. 2020. doi: 10.1109/TNSM.2020.3034647. [Google Scholar] [CrossRef]
26. J. Jiang et al., “Masked Swin Transformer Unet for industrial anomaly detection,” IEEE Trans. Ind. Inform., vol. 19, no. 2, pp. 2200–2209, Feb. 2023. doi: 10.1109/TII.2022.3199228. [Google Scholar] [CrossRef]
27. J. Chung, K. Kastner, L. Dinh, K. Goel, A. C. Courville and Y. Bengio, “A recurrent latent variable model for sequential data,” in Proc. NIPS, 2015, vol. 28, pp. 1–9. doi: 10.48550/arXiv.1506.02216. [Google Scholar] [CrossRef]
28. D. P. Kingma and M. Welling, “Auto-encoding variational Bayes,” in Proc. ICLR, Dec. 2013, pp. 1–9. doi: 10.48550/arXiv.1312.6114. [Google Scholar] [CrossRef]
29. R. Pascanu, T. Mikolov, and Y. Bengio, “On the difficulty of training recurrent neural networks,” Int. Conf. on Mach. Learn., vol. 28, no. 3, pp. 1310–1318, 2013. doi: 10.48550/arXiv.1211.5063. [Google Scholar] [CrossRef]
30. L. Prokhorenkova, G. Gusev, A. Vorobev, A. V. Dorogush, and A. Gulin, “CatBoost: Unbiased boosting with categorical features,” Adv. Neural Inf. Process. Syst., pp. 1–11, 2018. doi: 10.48550/arXiv.1706.09516. [Google Scholar] [CrossRef]
31. Y. Hua, F. Wan, B. Liao, S. Zhu, and X. Qing, “Resilient distributed information fusion under multiple malicious attacks,” IEEE Trans. Aerosp. Electron. Syst., vol. 1, no. 1, pp. 1–12, Jun. 2024. doi: 10.1109/TAES.2024.3416082. [Google Scholar] [CrossRef]
32. Y. Su, Y. Tan, S. An, and M. Xing, “Anomalies cannot materialize or vanish out of thin air: A hierarchical multiple instance learning with position-scale awareness for video anomaly detection,” Expert. Syst. Appl., vol. 254, pp. 1–16, Jun. 2024. doi: 10.1016/j.eswa.2024.124392. [Google Scholar] [CrossRef]
33. Y. Hua, H. Gan, F. Wan, X. Qing, and F. Liu, “Distributed estimation with adaptive cluster learning over asynchronous data fusion,” IEEE Trans. Aerosp. Electron. Syst., vol. 59, no. 5, pp. 5262–5274, Mar. 2023. doi: 10.1109/TAES.2023.3253085. [Google Scholar] [CrossRef]
34. Z. Li, G. Liu, and C. Jiang, “Deep representation learning with full center loss for credit card fraud detection,” IEEE Trans. Comput. Soc. Syst., vol. 7, no. 2, pp. 569–579, Apr. 2020. doi: 10.1109/TCSS.2020.2970805. [Google Scholar] [CrossRef]
35. R. Cao, G. Liu, Y. Xie, and C. Jiang, “Two-level attention model of representation learning for fraud detection,” IEEE Trans. Comput. Soc. Syst., vol. 8, no. 6, pp. 1291–1301, Dec. 2021. doi: 10.1109/TCSS.2021.3074175. [Google Scholar] [CrossRef]
36. Y. Xie, G. Liu, C. Yan, C. Jiang, M. Zhou and M. Li, “Learning transactional behavioral representations for credit card fraud detection,” IEEE Trans. Neural Netw. Learn. Syst., vol. 35, no. 4, pp. 5735–5748, Apr. 2024. doi: 10.1109/TNNLS.2022.3208967. [Google Scholar] [PubMed] [CrossRef]
37. Z. Guo, X. Li, H. Huang, N. Guo, and Q. Li, “Deep learning-based image segmentation on multimodal medical imaging,” IEEE Trans. Radiat. Plasma Med. Sci., vol. 3, no. 2, pp. 162–169, Mar. 2019. doi: 10.1109/TRPMS.2018.2890359. [Google Scholar] [PubMed] [CrossRef]
38. M. Monshizadeh, V. Khatri, M. Gamdou, R. Kantola, and Z. Yan, “Improving data generalization with variational autoencoders for network traffic anomaly detection,” IEEE Access, vol. 9, pp. 56893–56907, 2021. doi: 10.1109/ACCESS.2021.3072126. [Google Scholar] [CrossRef]
39. D. Wang, M. Nie, and D. Chen, “BAE: Anomaly detection algorithm based on clustering and autoencoder,” Mathematics, vol. 11, no. 1, pp. 1–14, 2023. doi: 10.3390/math11153398. [Google Scholar] [CrossRef]
40. Y. Li et al., “One-class LSTM network for anomalous network traffic detection,” Appl. Sci., vol. 12, no. 10, pp. 1–16, May 2022. doi: 10.3390/app12105051. [Google Scholar] [CrossRef]
41. S. Garcia, M. Grill, J. Stiborek, and A. Zunino, “An empirical comparison of botnet detection methods,” Comput. Security, vol. 45, pp. 100–123, 2014. doi: 10.1016/j.cose.2014.05.011. [Google Scholar] [CrossRef]
42. M. Montazeri Shatoori, L. Davidson, G. Kaur, and A. H. Lashkari, “Detection of DoH tunnels using time-series classification of encrypted traffic,” in 2020 IEEE Int. Conf. Depend. Auton. Secure Comput., Int. Conf. Pervas. Intell. Comput., Int. Conf. Cloud Big Data Comput., Int. Conf. Cyber Sci. Technol. Cong. (DASC/PiCom/CBDCom/CyberSciTech), 2020, pp. 63–70. doi: 10.1109/DASC-PICom-CBDCom-CyberSciTech49142.2020.00026. [Google Scholar] [CrossRef]
Cite This Article
 Copyright © 2024 The Author(s). Published by Tech Science Press.
This work is licensed under a Creative Commons Attribution 4.0 International License , which permits unrestricted use, distribution, and reproduction in any medium, provided the original work is properly cited.
 Downloads
 Citation Tools