
 Submit a Paper
 Propose a Special lssue
 Open Access
ARTICLE

Automatic Extraction of Medical Latent Variables from ECG Signals Utilizing a Mutual Information-Based Technique and Capsular Neural Networks for Arrhythmia Detection
Department of Computer Engineering and Information Technology, Razi University, Kermanshah, 6714414971, Iran
* Corresponding Author: Fardin Abdali-Mohammadi. Email:
(This article belongs to the Special Issue: Emerging Trends and Applications of Deep Learning for Biomedical Signal and Image Processing)
Computers, Materials & Continua 2024, 81(1), 971-983. https://doi.org/10.32604/cmc.2024.053817
Received 10 May 2024; Accepted 03 September 2024; Issue published 15 October 2024
 View Full Text
 Download PDF
Abstract
From a medical perspective, the 12 leads of the heart in an electrocardiogram (ECG) signal have functional dependencies with each other. Therefore, all these leads report different aspects of an arrhythmia. Their differences lie in the level of highlighting and displaying information about that arrhythmia. For example, although all leads show traces of atrial excitation, this function is more evident in lead II than in any other lead. In this article, a new model was proposed using ECG functional and structural dependencies between heart leads. In the prescreening stage, the ECG signals are segmented from the QRS point so that further analyzes can be performed on these segments in a more detailed manner. The mutual information indices were used to assess the relationship between leads. In order to calculate mutual information, the correlation between the 12 ECG leads has been calculated. The output of this step is a matrix containing all mutual information. Furthermore, to calculate the structural information of ECG signals, a capsule neural network was implemented to aid physicians in the automatic classification of cardiac arrhythmias. The architecture of this capsule neural network has been modified to perform the classification task. In the experimental results section, the proposed model was used to classify arrhythmias in ECG signals from the Chapman dataset. Numerical evaluations showed that this model has a precision of 97.02%, recall of 96.13%, F1-score of 96.57% and accuracy of 97.38%, indicating acceptable performance compared to other state-of-the-art methods. The proposed method shows an average accuracy of 2% superiority over similar works.Keywords
Electrocardiogram (ECG) technology has recently garnered interest as a simple and affordable method in mobile phones and smart wearable devices. A signal ECG is a graphic record produced by an electrocardiograph machine that provides details about heart rate and rhythm and other related abnormalities. The ECG signal has found an important role in medicine due to its ability to carry crucial information about the human cardiovascular, respiratory, and nervous systems and to monitor the health of people remotely. The daily monitoring of human vital signs with ECG signals reduces the risk of heart disease. Heart arrhythmia in ECG signals is among these diseases, which is the most common cause of sudden death. In this arrhythmia, the heart is not able to pump sufficient blood to supply oxygen and nutrients to the organs, which leads to fatigue, breath shortness, and edema. According to the statistics of the European Society of Cardiology, cardiac arrhythmias in ECG signals have been diagnosed in at least 26 million adults worldwide, and 6.3 million new cases are added to this number every year [1]. However, early diagnosis can increase the possibility of treating this disease and thus decrease the risk of death [2].
Heart arrhythmia diagnosis is a time-consuming and exhausting task that requires accurate and constant measurement by a skilled cardiologist. As a result, computer-aided diagnosis, with the help of new and efficient systems, can increase the ability to recognize the information recorded by an ECG [3]. Deep memory models have worked very well to detect arrhythmia in ECG signals. Models based on neural networks, such as convolutional neural networks (CNNs) and residual networks (ResNet) [4] and stack autoencryption extract features with high quality by passing the ECG signal through convolutional layers [5].
In recent years, many methods based on these deep learning models have been presented. Each of these methods has advantages and disadvantages [6,7]. For example, high accuracy is one of the advantages of different methods, which has grown significantly in recent years. In order to show the strengths and weaknesses of some available methods, here we provide a visual comparison. Fig. 1 shows the results of deep learning classifications, including CNN with nine convolutional layers (abbreviated as CNN-9) [4], XGBoost [5], CNN-5 [6], ResNet with 18 convolutional layers (abbreviated as ResNet-18) [7], multilayer perceptron (MLP) [8] and CNN-10 [9], to illustrate the effect of the number of measurement leads on the performance of the ECG arrhythmia classification processing system. The ResNet-18 yielded the best arrhythmia detection result with an accuracy of 95.55%, as reported in [7], according to the diagram in Fig. 1. This method, which uses 12-leads ECG signal to create a classification, can identify a reasonable number of samples. The CNN-9 classifier made from single-lead ECG signals had a decreased performance of 11.31%, resulting in an accuracy of 84.24%, as reported in [4].
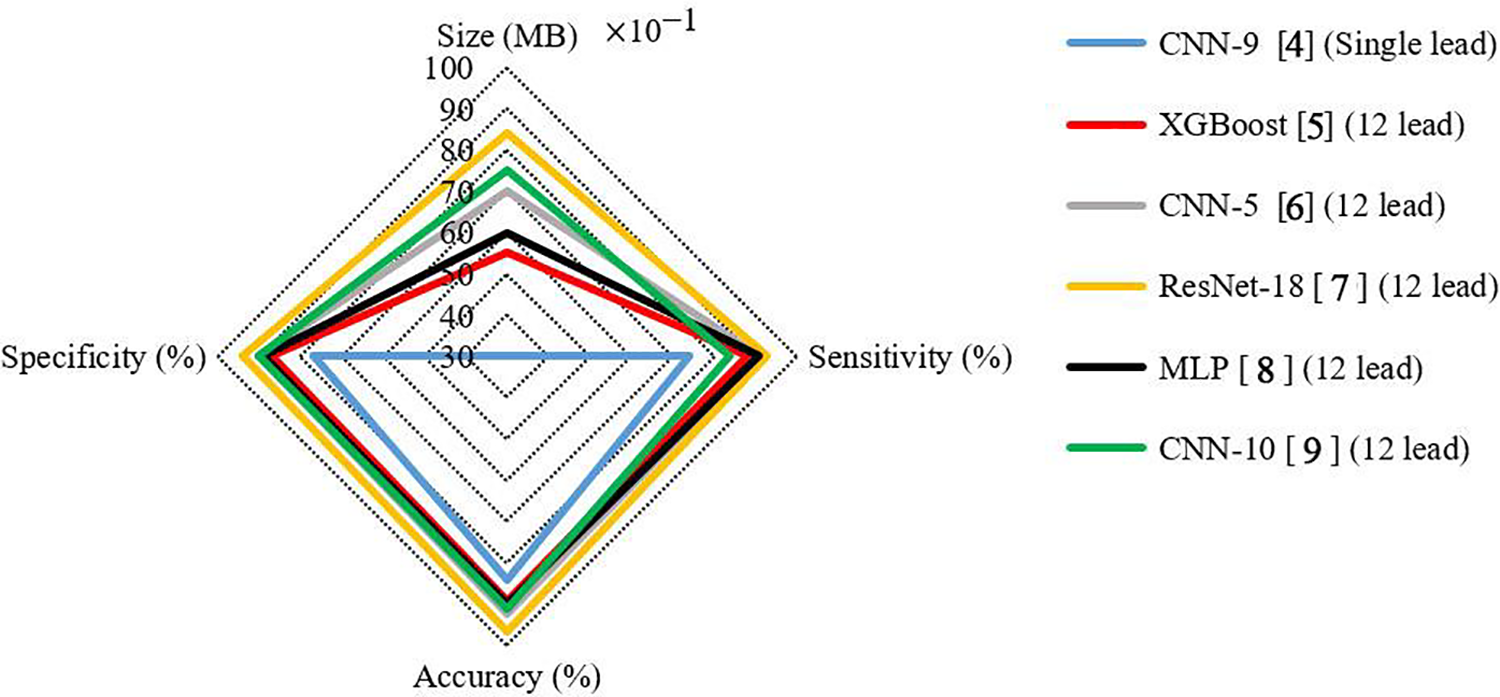
Figure 1: The results of deep learning classifiers in the classification of Chapman ECG dataset [4–9]
From a medical perspective, 12-leads ECG signal has a functional dependency. Therefore, each of these 12-leads ECG signal reports on different aspects of a particular medical phenomenon. Their difference lies in the extent to which they highlight and display information about the phenomenon. However, they all indicate the situation in time, and their information is functionally dependent. For example, in ECG signals, although all leads show traces of atrial pacing, this activity is most evident in lead II. This means that when an arrhythmia appears, there are traces of this phenomenon in almost all leads, although it is more evident in some leads and less evident in others. As such, this effect can be enhanced in some leads. By extracting mutual information between 12-leads ECG signal, knowledge of all leads can be obtained. As a result, the neural network model is trained based on the knowledge extracted from the mutual information between 12-leads ECG signal. Finally, we can provide a classifier based on single lead ECG signal, which is expected to have the following properties:
1. It has acceptable performance compared to classifiers built on 12-leads ECG signal with minimal loss of accuracy (unlike Fig. 1).
2. A small input of this classification optimizes the complexity of calculation and reduces the number of model parameters, and it can be realized on devices with different computing power.
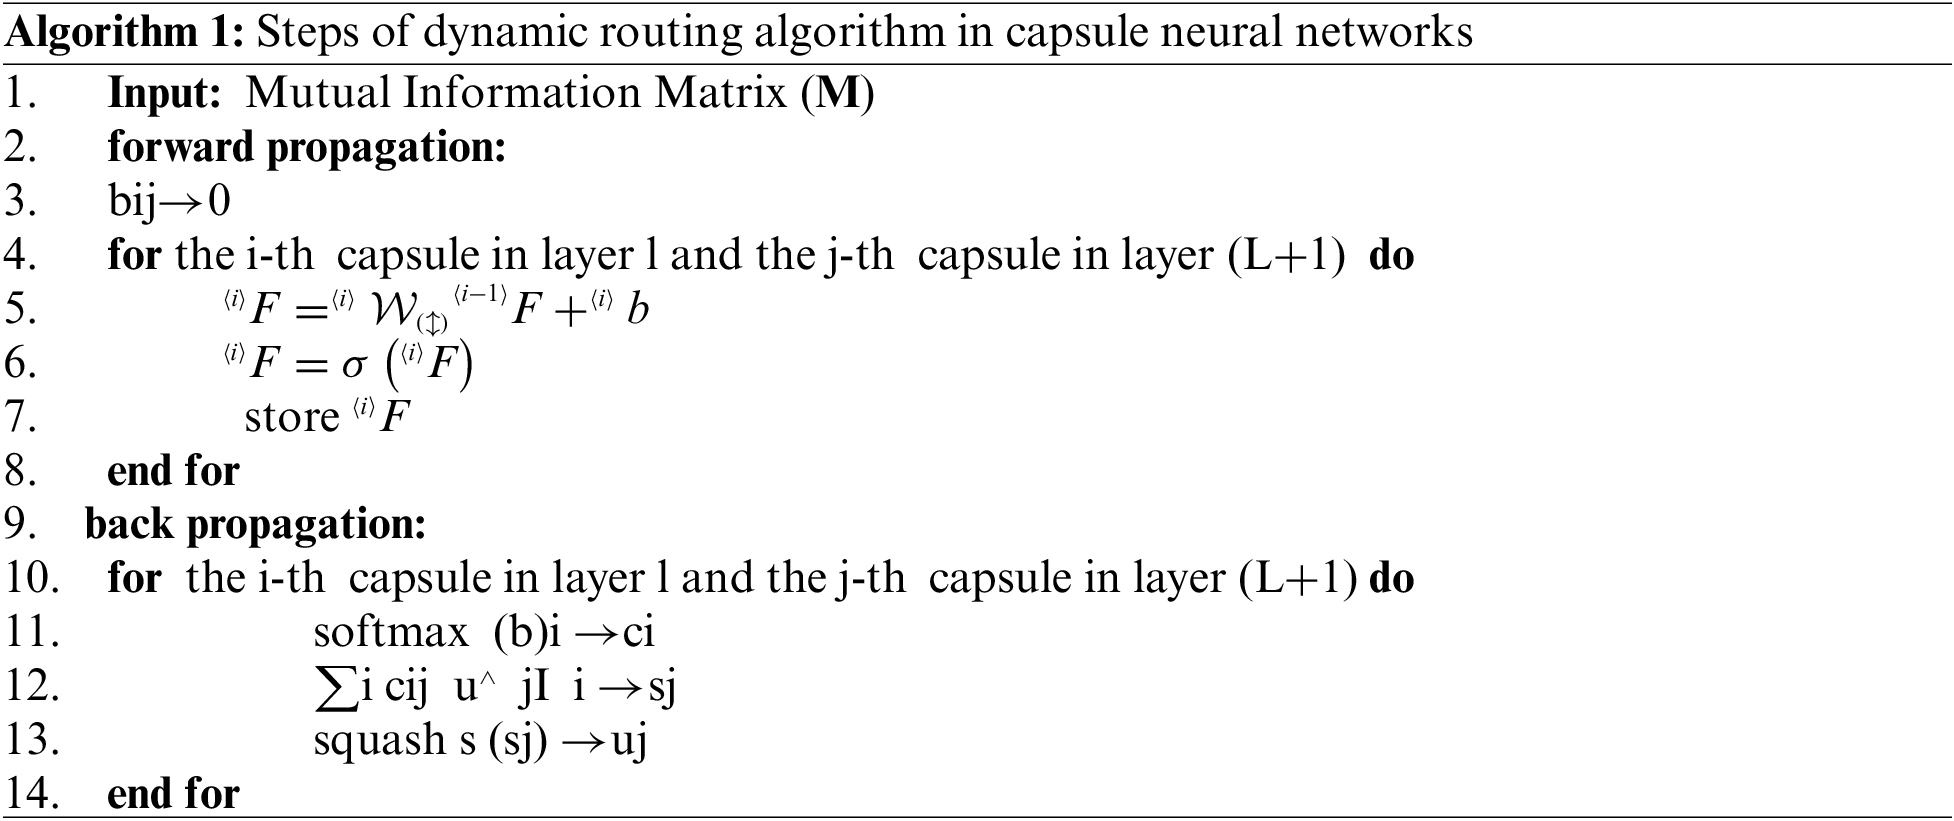
In this paper, this medical fact served as the basis for the introduction of a method based on mutual information (MI) and a capsule neural network model, which aims to enhance weak channels by utilizing strong channel information. Our calculation of this functional and structural dependence between ECG leads will extract latent medical variables. Therefore, in this paper, first, these dependencies were calculated by applying an MI extraction method. Then, capsule neural networks were used for the learning model. Capsule networks have the advantage of better analyzing information related to the sequence pattern, such as ECG signals, by simultaneously using two levels of convolutional layers. Thus, these networks seem to have better results, which, of course, requires laboratory evaluations and comparison with other models. Based on assessments using the Chapman ECG dataset, the proposed method resulted in an accuracy of 97.38% compared to the other state-of-the-art methods for classifying the Chapman ECG dataset. The most important innovations of this paper are as follows:
1. Utilizing an MI-based technique to calculate the functional dependence between the leads of ECG signals.
2. Using capsular neural networks to classify multi-level arrhythmia in ECG signals.
This paper consists of the following sections. Section 2 briefly reviews achievements in related work. Section 3 thoroughly describes the proposed method in detail. Section 4 presents the results and evaluates the parameters of the proposed method in comparison with other techniques. Finally, Section 5 presents the discussion and draws a conclusion.
This section offers an overview of the existing theories related to the ECG signal feature extraction methods. It also provides details and explanations of the relevant formulas, including filters and techniques in the pre-processed signal feature extraction section and the feature and classband selection method [10]. ECG signal arrhythmia detection systems can be divided into two categories based on the features used in them: generation of manual features and generation of deep features [11].
The working mechanism in most methods in the first category is the detection of fiducial points in ECG signals. The QRS complex is the most important fiducial point in ECG signals. After detecting the QRS complex, time and amplitude characteristics [12], statistics [13], signal amplitude [14], and morphological features [15] are extracted from it, and other data, such as the relationship with the adjacent QRS complex [16], are extracted from ECG signals. The quality of features used in this step depends on the exact location of the QRS complex. In many methods, only the approximate location of the QRS complex is identified. In addition, the QRS complex is sometimes damaged and may not be completely clear due to side problems such as noise. In other cases, known as non-fiducial methods, the ECG is randomly divided into different segments, and features of those segments are extracted. Features used include fast Fourier transform, discrete cosine transform, wavelet transform, or symbolic representation. As mentioned in [17], extracting suitable features from an ECG signal is a specialized engineering process (in both fiducial and non-fiducial methods) and requires basic knowledge of the signal. For this reason, the generation of manual features is not generalizable and is not very efficient in the design of detection systems for arrhythmia in strong ECG signals.
Deep learning models are used in the second category of feature generation. In the last decade, deep learning has gained many supporters, and various methods from this branch, including CNN, have been used to solve many problems. Recently, various methods have been presented for automatic feature generation based on the latest deep learning technologies. Deep learning methods, including CNN, provide multiple representations of raw data in the form of multiple processing layers that enable automatic learning from these data. The methods in two families of ECG feature extraction algorithms are described below.
Some essential methods used in feature generation from ECG signals based on CNN architecture are given below. In [18], a DCNN-based ECG signal anomaly detection system was proposed, which was built with four convolutional layers, two cumulative layers, and one fully connected layer. The last layer was used for the classification process. The data used in the experiment consisted of signals obtained from 33 female patients with regular daily activities. This test was performed using the signal in 10 consecutive periods. According to the laboratory results, the accuracy of this method was almost 99%. In [19], a CNN-based ECG signal anomaly detection system was also introduced, in which an ECG signal was entered into the model as a 2D connected image. The CNN architecture of this method included 12 convolution layers, six integration layers, and two fully connected layers. The experimental results using MIT-BIH and PTB dataset obtained from 18 healthy individuals showed an accuracy of about 99% in this method. In [20], a system called deep ECG was introduced to detect arrhythmia in ECG signals based on CNN. In this method, DCNN is used to extract features from different ECG leads. The CNN architecture of this method included six convolution layers, three integration layers, a dropout layer, and a fully connected layer at the end. The laboratory results showed the accuracy of this method to be about 100%. These results were obtained from 52 healthy subjects using E-HOL-03-0202-003 and PTB dataset from Physionet. In [21], a semi-automated standard architecture called ResNet was used to design a system for detecting arrhythmia in ECG signals. At first, S transform was used to make 2D images of the ECG trajectory. These images were then fed into the CNN model to generate features. In [22], the deep CNN architecture of several convolutions and integration layers based on the ResNet standard was used to generate global features. The classification process was performed in the last step of the majority voting algorithm. The laboratory results of this method showed an accuracy between 93% and 99% for different datasets. Although the CNN-based feature generation methods are very accurate and have made significant progress in the ECG signal arrhythmia detection system, as mentioned above, the architecture of CNN models, which includes the number and type of layers, is designed through trial and error.
There are 12-leads ECG signal for each person in the used dataset (
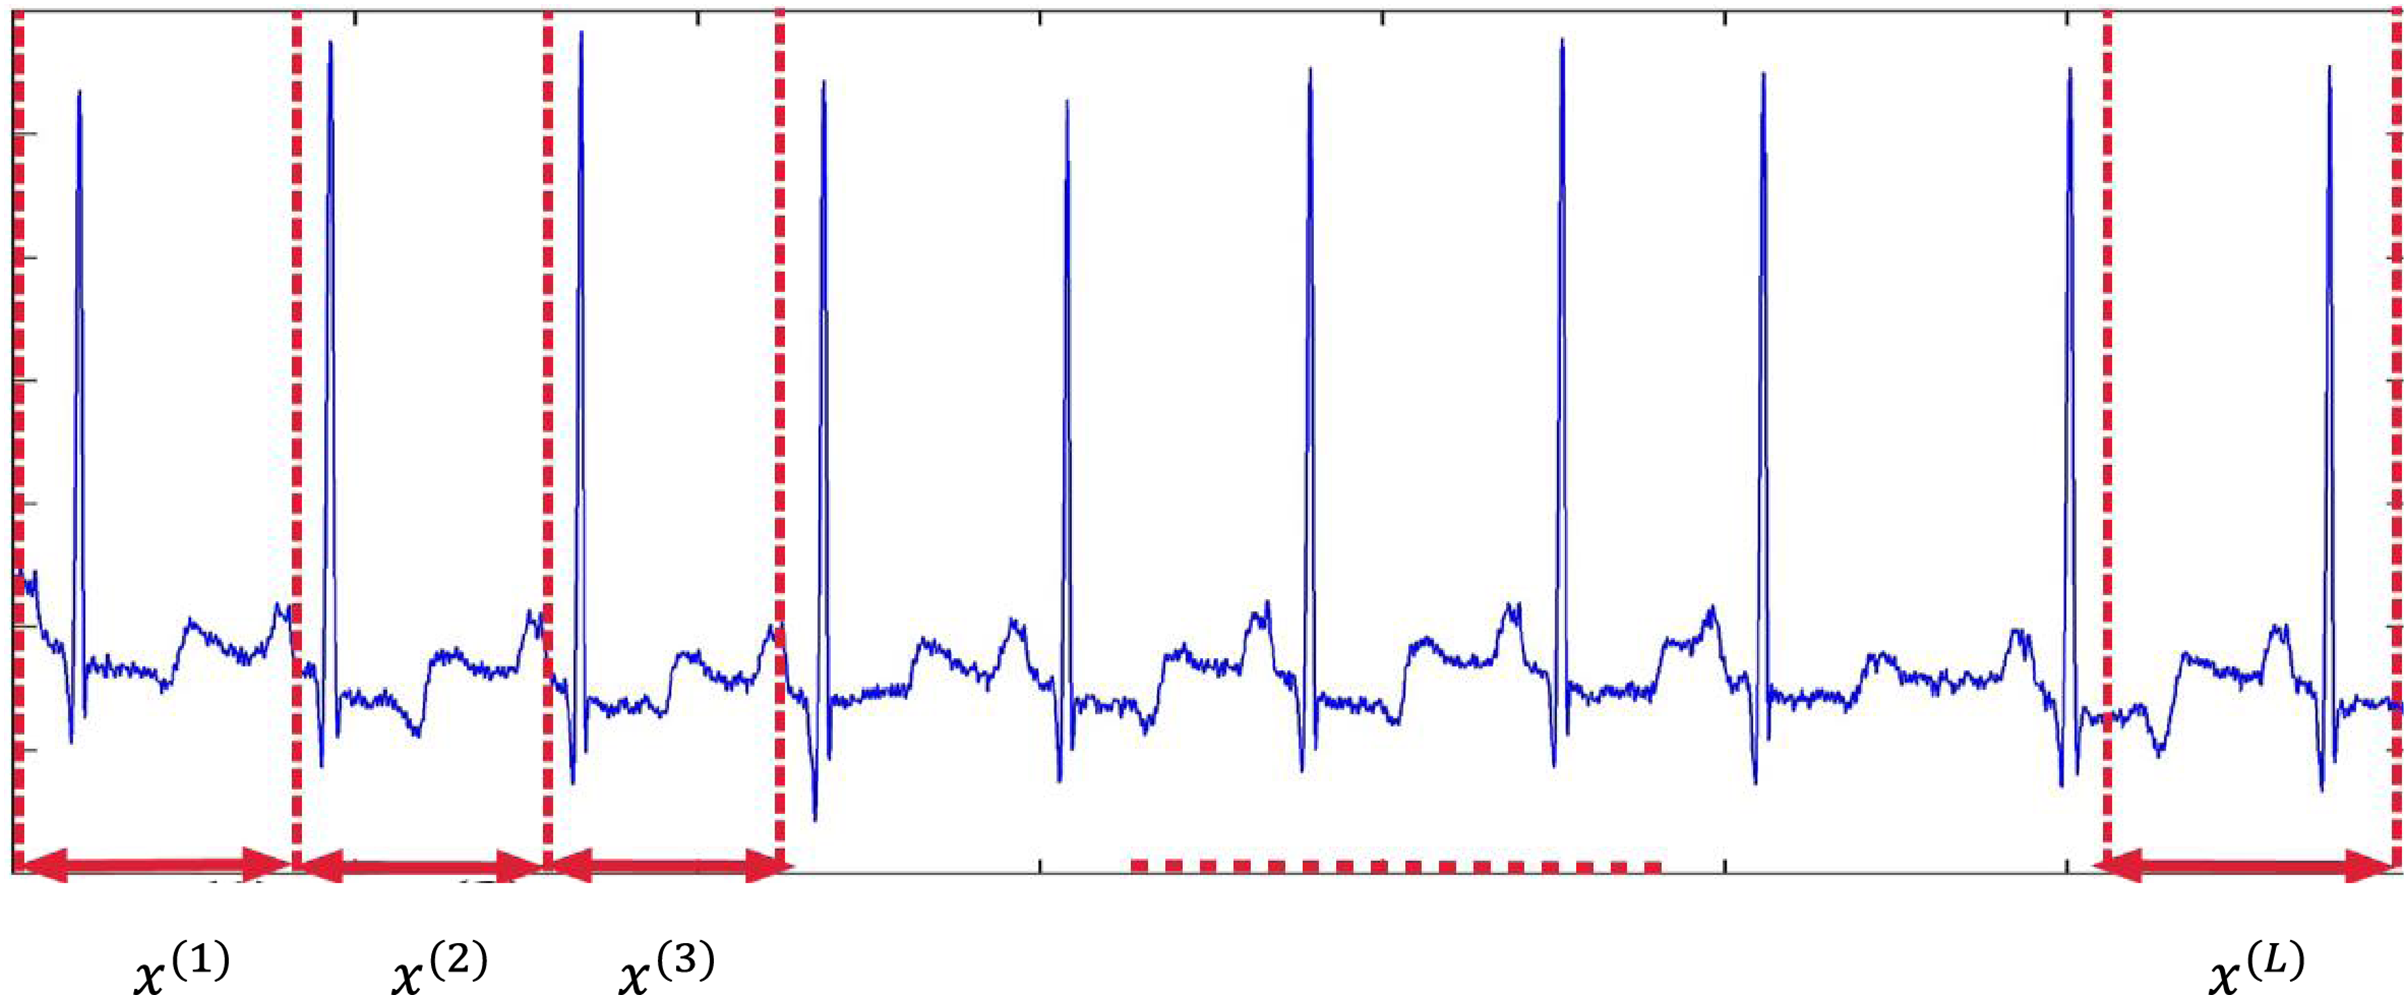
Figure 2: Segmentation of ECG signal into
To extract mutual information between 12 ECG leads, the correlation between them has been calculated. As shown in Fig. 3, the correlation between the two leads
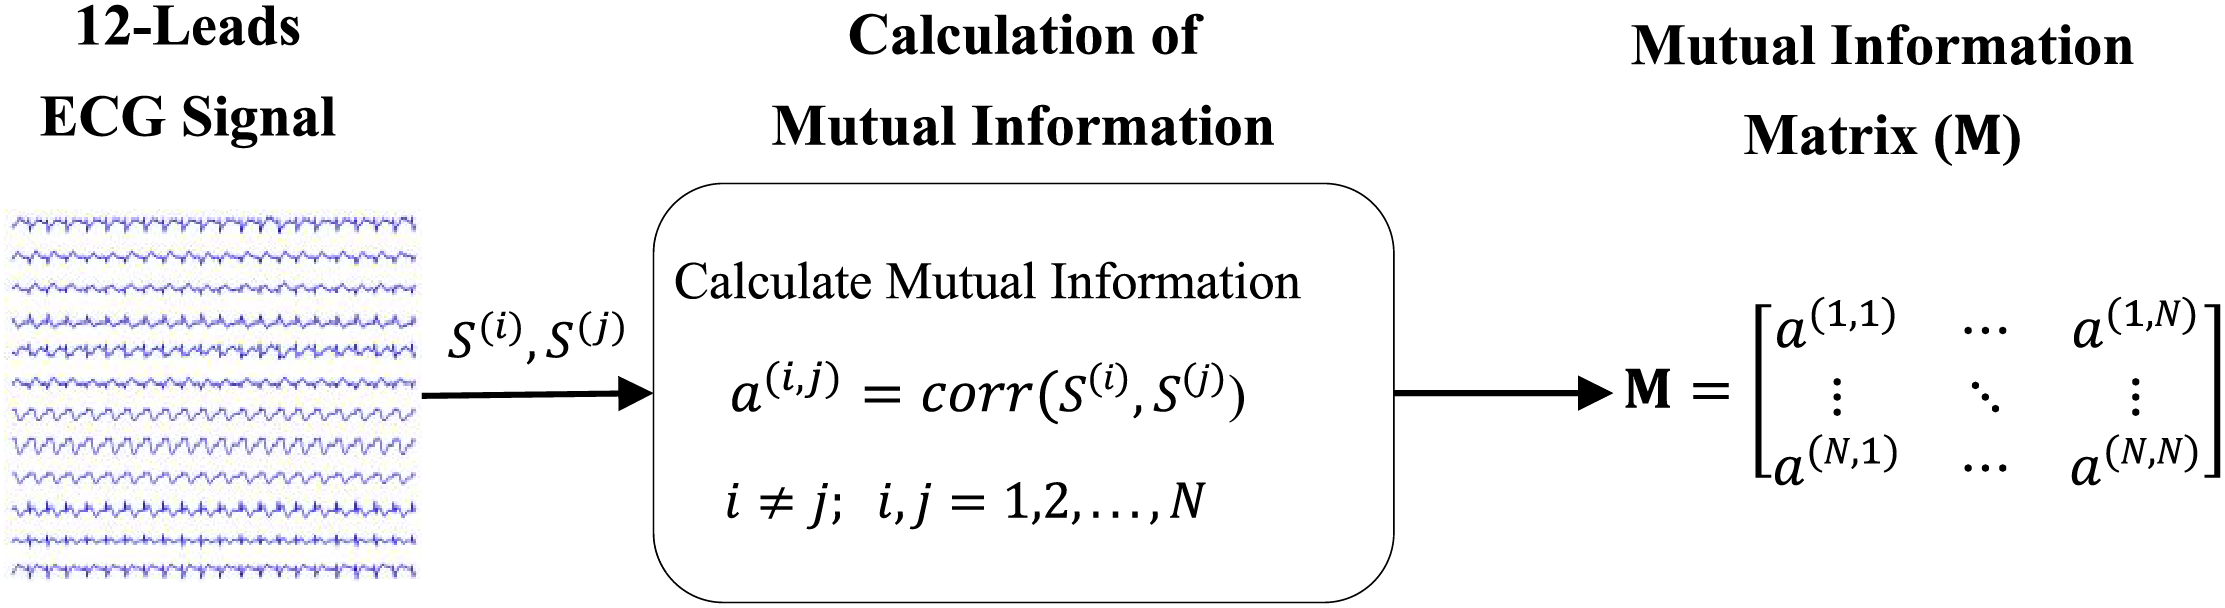
Figure 3: The method of calculating the correlation between two leads
In this equation,
The general structure of the capsule networks is shown in Fig. 4. The given number has two parts: the encoder part and the decoder part. The encoder part usually consists of three layers of convolution, primary capsules, and batch capsules. The encoder takes images as input and learns to encode them into vectors of parameters during training. The decoder part, which is made up of fully connected layers, takes a vector from the bundles capsule and learns to decode it as an image. It is important to mention that the decoder considers only the capsule vector of the correct category during the training process and ignores the incorrect ones. In fact, the decoder part is used as a regulator. As a result, the correct output of the capsule receives the categories as input and learns to reconstruct an image corresponding to it. The cost function of this task is the Euclidean distance between the reconstructed image and the input image. In general, a capsule consists of two important parts: 1- Matrix multiplication of input vectors with weight coefficients; 2-Numerical weighting of vectors created in the previous step, weighted summation of vectors, and vector nonlinearization.
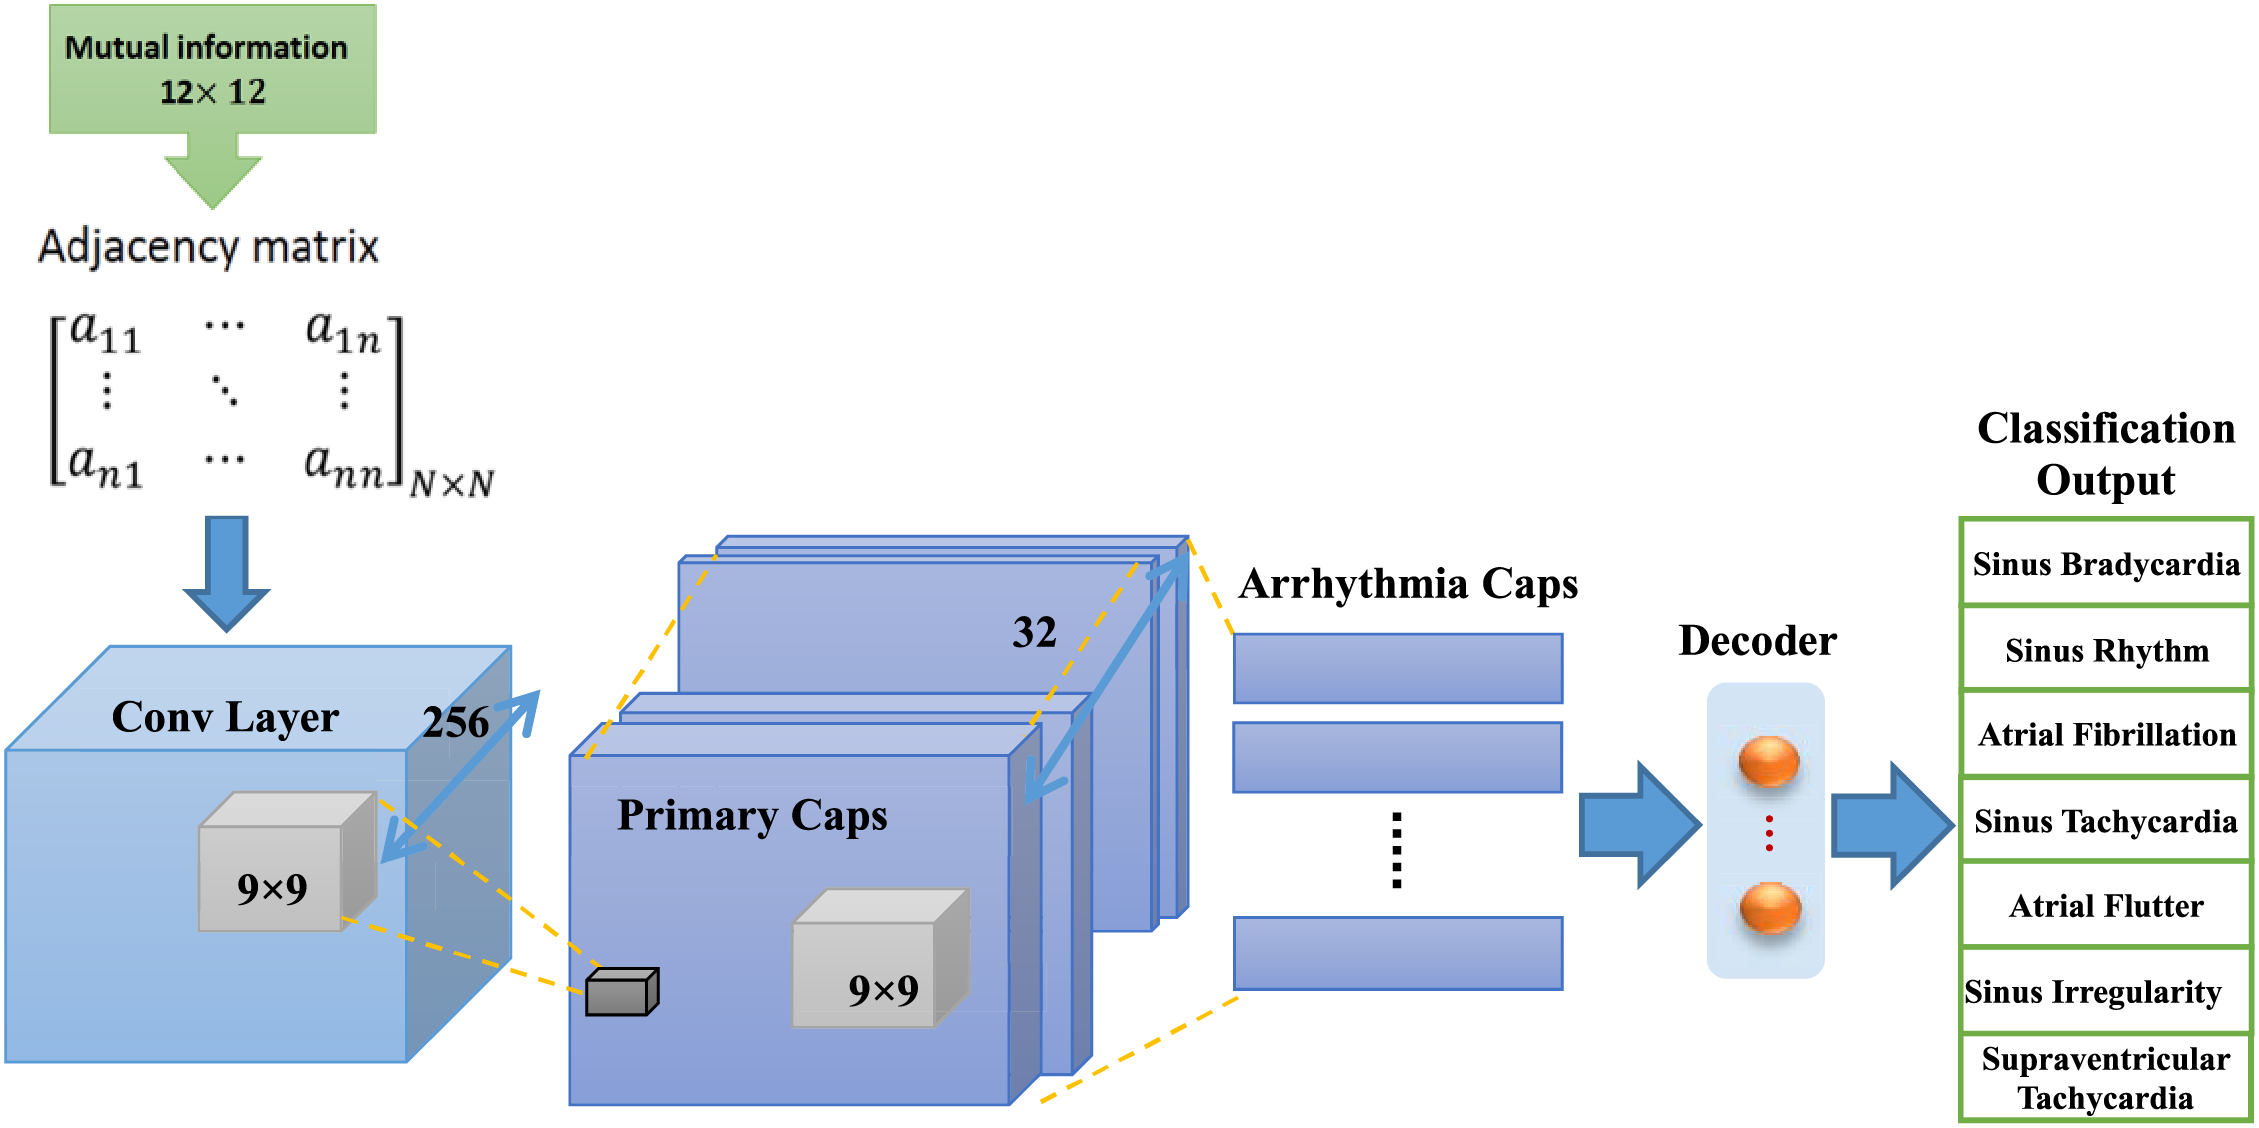
Figure 4: Diagram of capsule neural network for ECG arrhythmia classification, this network includes convolution layer, primary capsules layers, capsules of arrhythmia classes and decoder
Fig. 5 shows structures related to neurons and capsules. According to part (b) of this figure, input vectors are received by capsule
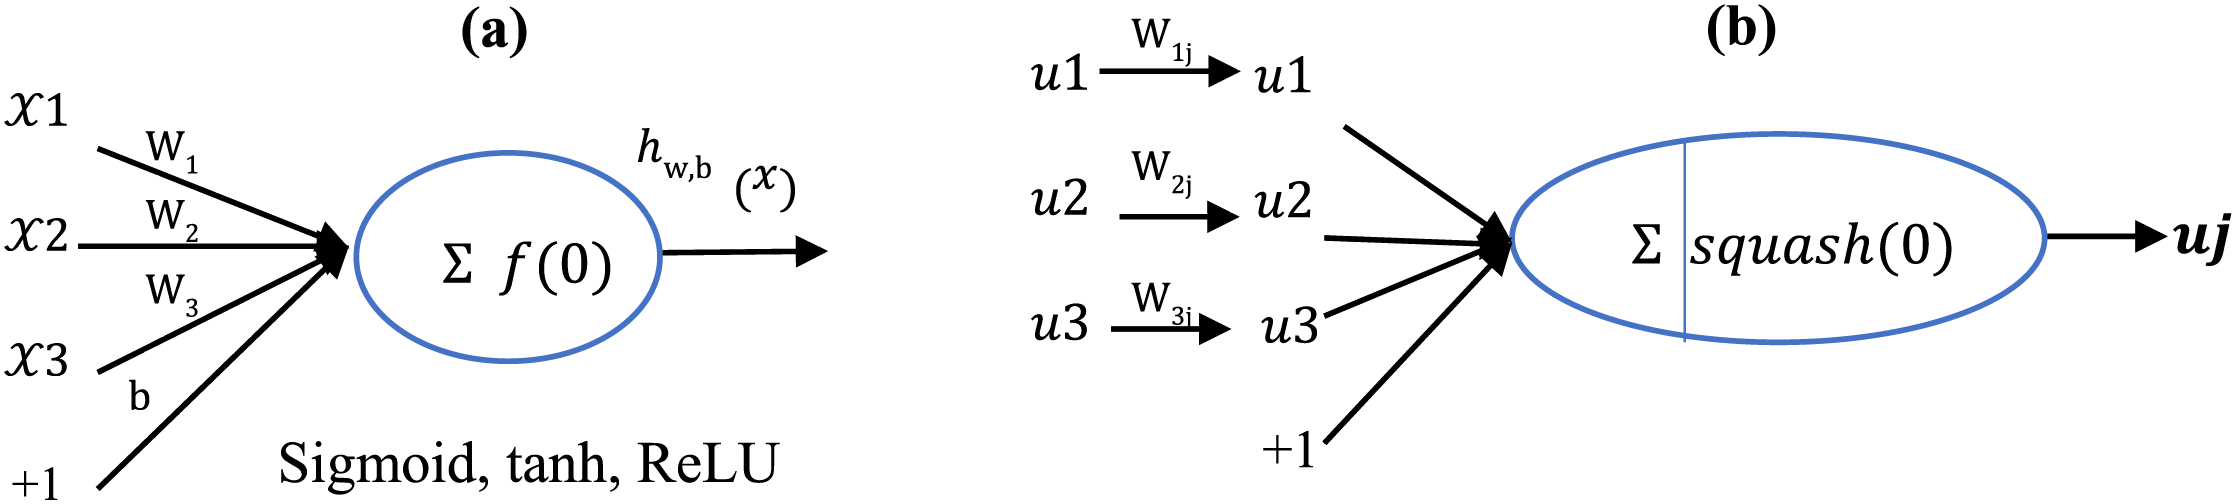
Figure 5: Structure related to (a) standard neuron and (b) capsule
After determining the
The prediction is done by the decoder network by reconstructing the input image from the output capsules that have the most probable label. In the end, the decoder reconstructs the input signal using the output capsules, which will help in the training of the model. Fig. 6 shows model’s decoder structure.

Figure 6: Details about the decoder in capsule neural networks that contain fully connected network neurons
In order to evaluate the proposed method, Chapman University and Shaoxing People’s Hospital (Chapman ECG in short) dataset [23] has been used in this article. The details of the arrhythmia classes as well as the number of samples of each arrhythmia are shown in Table 1. In this dataset, 12-leads ECG signal are collected for 10,496 people. These signals have been recorded during several days and several working sessions. The storage frequency is 500 Hz and the length of each signal is 10 s. The creators of this data set have implemented a Butterworth filter and the Non-Local Means technique in order to remove noise and make the signals smooth. In this paper, the classification model was trained using 70% of the samples, and 15% of the dataset’s samples were used for each of the validation and test stages.
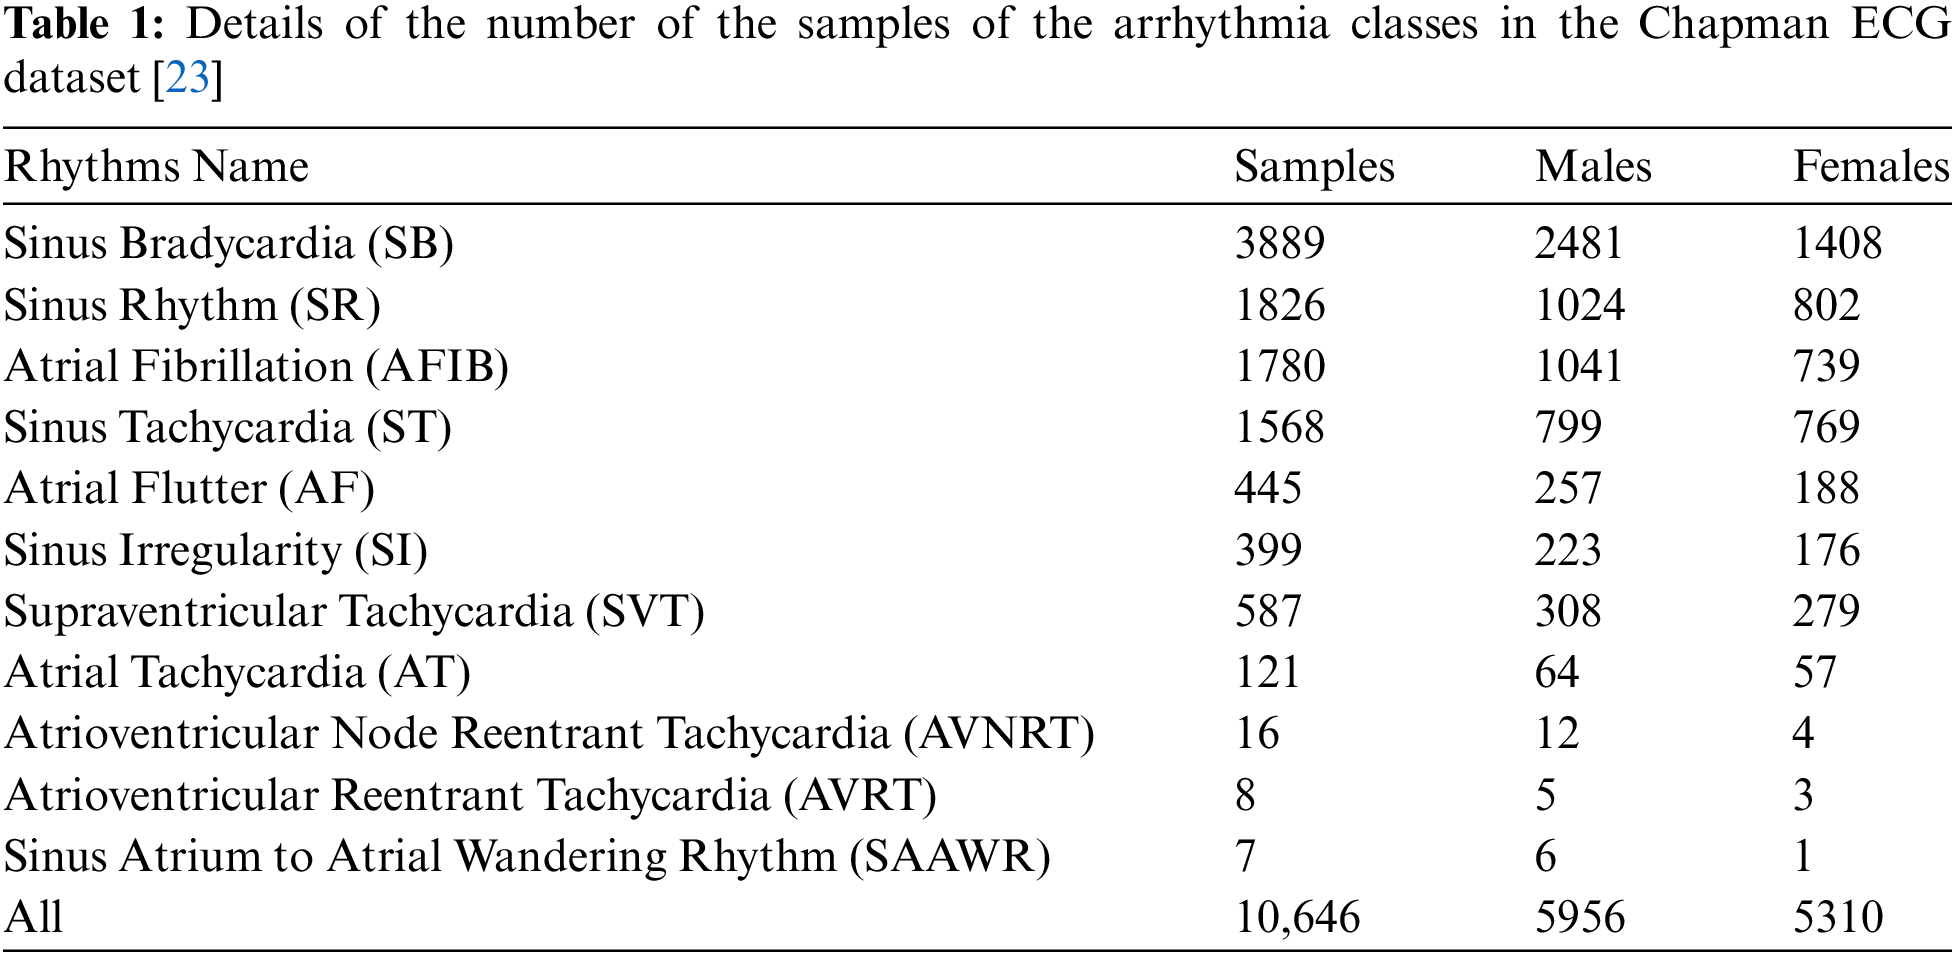
As can see from Table 1, the statistical distribution of the later samples of the Chapman dataset shows an under-representation of some of the classes (fewer samples). This article only used the “first seven classes” marked in Table 1 of the Chapman dataset.
4.2 Performance Evaluation of Model
In this section, the performance of the proposed the capsule neural networks, including its computational complexity and accuracy, is examined. Accuracy, precision, recall and F1-score criteria are also used to evaluate the results (Eqs. (5) to (8)).
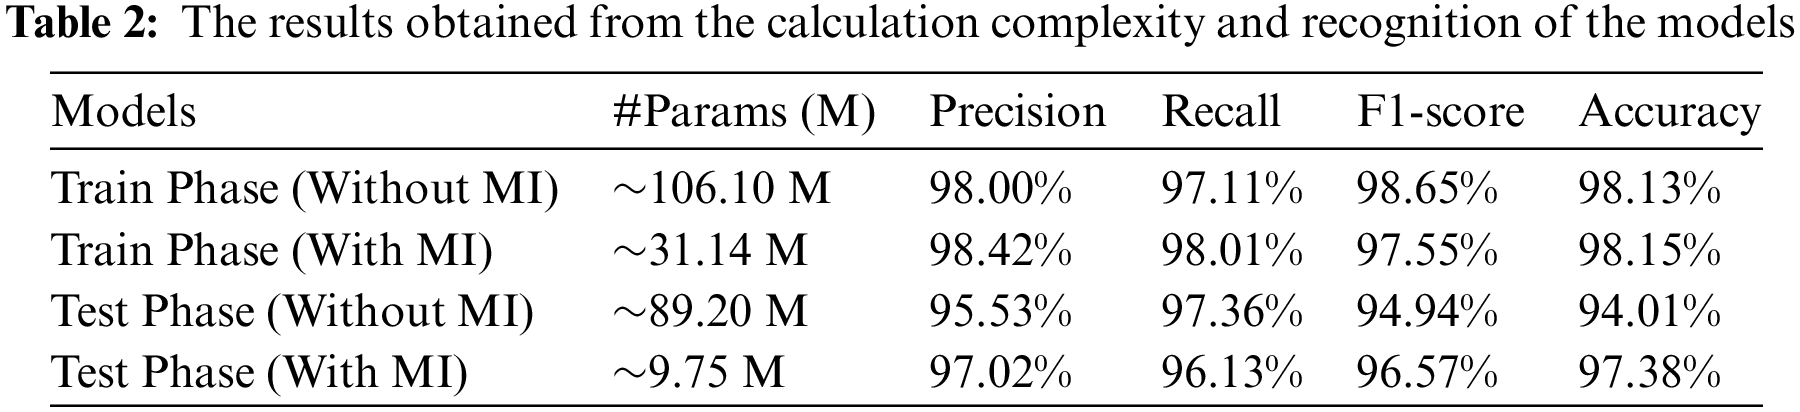
In this section, precision, recall, F1-score and accuracy evaluation criteria are used to evaluate the model. The proposed model was implemented using TensorFlow Lite and Genymotion simulations. The experiments were implemented on a Samsung smartphone with GPU capability. Table 2 displays results for the capsule neural networks without and with MI. According to the accuracy of the proposed model, no overall differences essentially existed between the capsule neural networks without and with MI in cancerous samples. However, the table demonstrates that the capsule neural networks with MI were approximately 259.10 times more compact with only 9.75 M parameters than the capsule neural networks without MI.
4.3 Class-Based Results of Models
The results of the classification model were analyzed for samples in the Chapman ECG dataset. Fig. 7 shows the results of the capsule network of the samples in the Chapman ECG dataset, shown as confusion matrices. The performance of capsule neural network model, which was fully capable of distinguishing samples in the Chapman ECG dataset, is amply demonstrated by this matrix, which shows a high percentage of true positives. For instance, out of 2480 samples, or 2400 cases, the capsule neural network model model recognized 2400 cases as true and only 118 classes—or 4% of cases in this class—as false (false positive instances in the matrix).
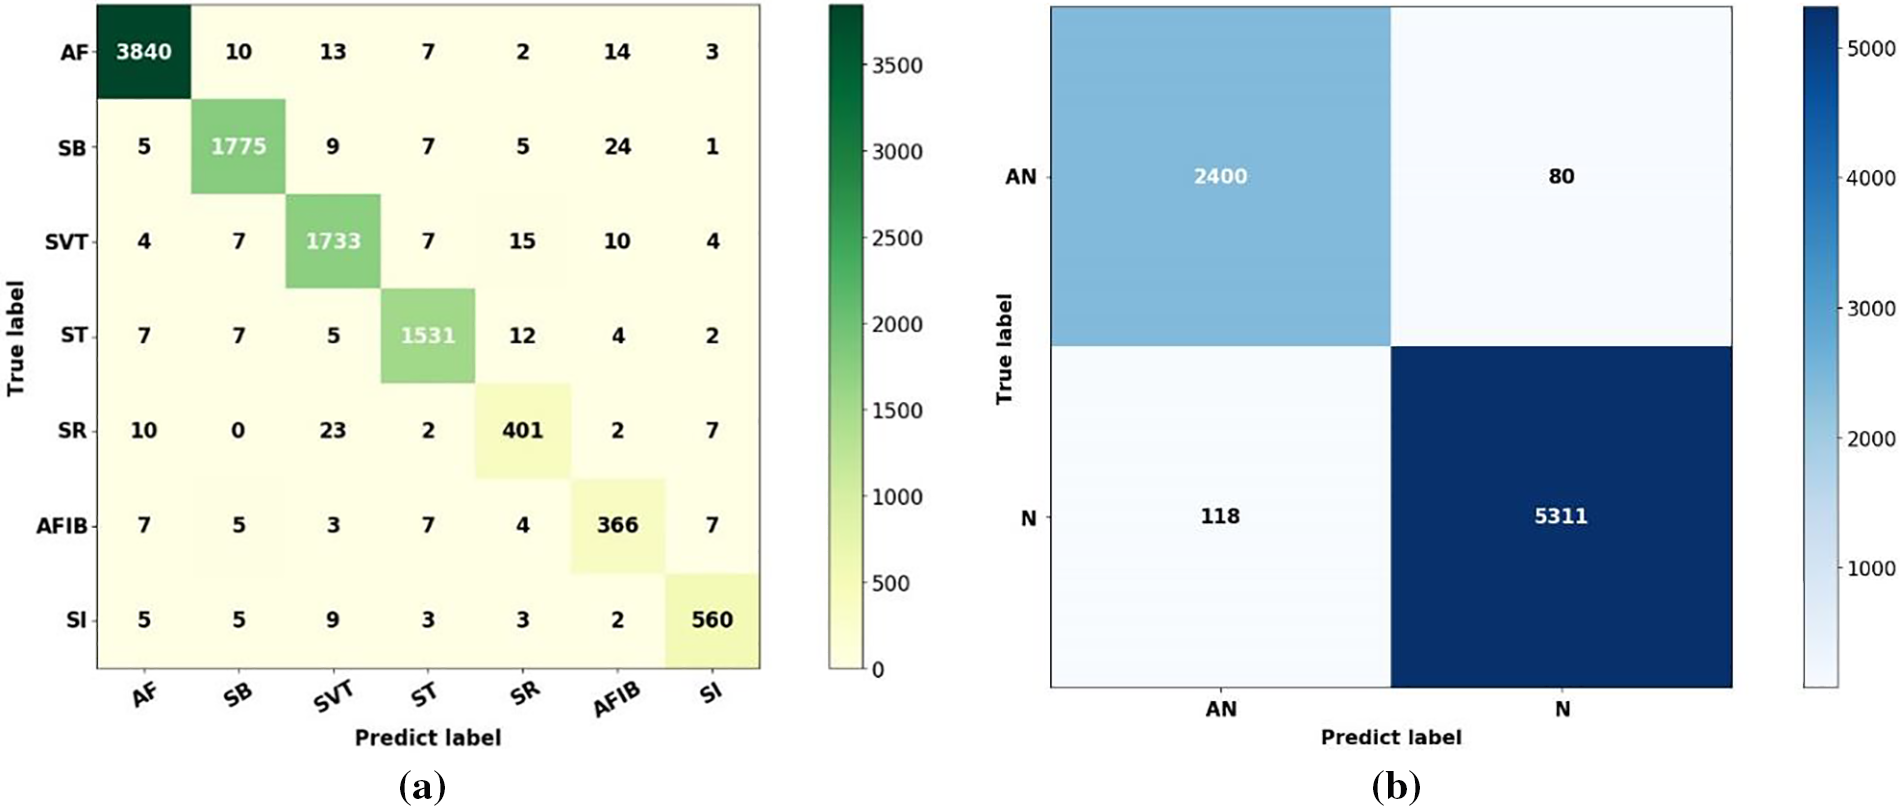
Figure 7: The results obtained through the confusion matrix of the capsule neural network model (a) Seventh-class confusion matrix, (b) Binary confusion matrix
The classification model generates results that satisfy all relevant criteria, such as accuracy, precision, recall, and F-score, when a matrix similar to that in Fig. 7 is generated. This problem is illustrated in the paper for every class. The ratio of the true positive rate to the false positive rate for capsule neural network model is represented by a receiver operating characteristics. All samples in the Chapman ECG dataset were binary categorized using this diagram. Requirements such as sensitivity and specificity are crucial in this case. Receiver operating characteristics shows the true positive rate to false positive rate ratio, as determined by the capsule neural network model. This led to the achievement of 97% of the area under the ROC curve (AUC).
4.4 Comparison of Proposed Method with Other State-of-the-Arts Method
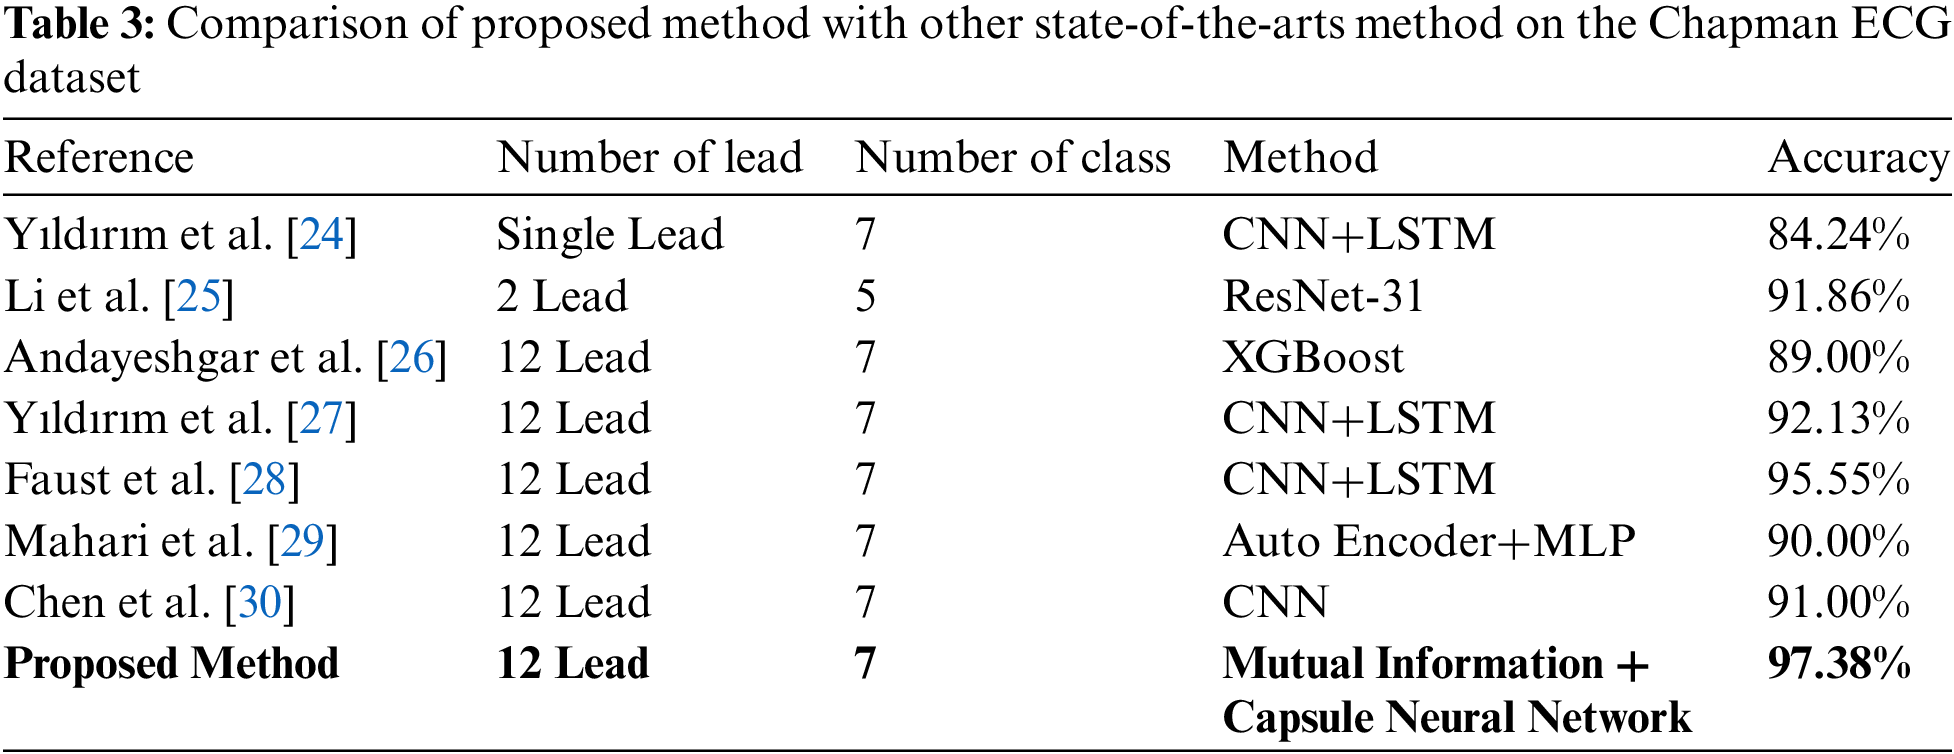
The proposed method was compared with previously introduced works in the categorization of Chapman dataset samples. Table 3 highlights earlier work, all of which use deep learning approaches. Yıldırım et al. [24] used a CNN+LSTM classifier to classify seven categories of arrhythmia in a single-lead ECG signal. In [25], a separate section for classification based on 2 leads ECG signal was introduced. The results of this study for 10,436 patients in 2 lead type revealed accuracies of 91.86% in evaluations. Andayeshgar et al. [26] have presented a method based on XGBoost for the classification of 12-lead ECG signals, which shows 89.00% accuracy. Yıldırım et al. [27] have presented a method based on CNN and LSTM for the classification of 12-lead ECG signals, which shows 92.13% accuracy. Moreover, Faust et al. [28] described a method for classifying 10,093 cases using Detrending+ResNet-18. They reported a 95.55% accuracy in classifying seven categories of arrhythmia in the evaluation portion. Deep learning approaches, such as CNN, have demonstrated improved performance by increasing the number of inputs; thus, the methods described in Table 3 are advanced and have generally acceptable accuracies. The proposed method exhibits behavior comparable to classifiers created with 12-leads ECG signal and can compete with these classifications.
This article proposes a new model using ECG functional and structural dependencies between heart leads. The model evaluates the relationship between leads using mutual information indices. Furthermore, to calculate the structural information of ECG signals, a capsule neural network is implemented to aid physicians in automatically classifying cardiac arrhythmias. The experimental results section applies the proposed model to classify arrhythmias in ECG signals from the Chapman dataset. Numerical evaluations indicate that this model has a precision of 97.02%, recall of 96.13%, F1-score of 96.57%, and accuracy of 97.38%, indicating acceptable performance compared to other state-of-the-art methods. The proposed method can be further improved by presenting a multi-capsule neural network version for ECG arrhythmia classification, considering the diversity problem and generalization preservation.
Acknowledgement: We would like to thank the reviewers for the valuable comments that enhanced the paper’s quality.
Funding Statement: The authors received no specific funding for this study.
Author Contributions: The authors confirm contribution to the paper as follows: Study conception and design: Abbas Ali Hassan; picture drawing: Abbas Ali Hassan; analysis of results: Abbas Ali Hassan, Fardin Abdali-Mohammadi; draft manuscript preparation: Abbas Ali Hassan, Fardin Abdali-Mohammadi. All authors reviewed the results and approved the final version of the manuscript.
Availability of Data and Materials: Not applicable.
Ethics Approval: Not applicable.
Conflicts of Interest: The authors declare that they have no conflicts of interest to report regarding the present study.
References
1. E. Adib, F. Afghah, and J. J. Prevost, “Arrhythmia classification using CGAN-augmented ECG signals,” in IEEE Int. Conf. Bioinform. Biomed. (BIBM), Las Vegas, NV, USA, 2022, pp. 1865–1872. doi: 10.1109/BIBM55620.2022.9995088. [Google Scholar] [CrossRef]
2. A. A. Ahmed, W. Ali, T. A. A. Abdullah, and S. J. Malebary, “Classifying cardiac arrhythmia from ECG signal using 1D CNN deep learning model,” Mathematics, vol. 11, no. 3, 2023, Art. no. 562. doi: 10.3390/math11030562. [Google Scholar] [CrossRef]
3. M. O. Agyeman, A. F. Guerrero, and Q. -T. Vien, “A review of classification techniques for arrhythmia patterns using convolutional neural networks and Internet of Things (IoT) devices,” IEEE Access, vol. 10, pp. 87387–87403, 2022. doi: 10.1109/ACCESS.2022.3192390. [Google Scholar] [CrossRef]
4. Y. Ansari, O. Mourad, K. Qaraqe, and E. Serpedin, “Deep learning for ECG Arrhythmia detection and classification: An overview of progress for period 2017–2023,” Front. Physiol., vol. 14, 2023, Art. no. 1246746. doi: 10.3389/fphys.2023.1246746. [Google Scholar] [PubMed] [CrossRef]
5. A. Boulif, B. Ananou, M. Ouladsine, and S. Delliaux, “A literature review: ECG-based models for arrhythmia diagnosis using artificial intelligence techniques,” Bioinform. Biol. Insights, vol. 17, no. 3, 2023, Art. no. 11779322221149600. doi: 10.1177/11779322221149600. [Google Scholar] [PubMed] [CrossRef]
6. M. K. Chaitanya and L. D. Sharma, “Capsule network for 1-D biomedical signals: A review,” in 2023 2nd Int. Conf. Paradigm Shifts Commun. Embed. Syst., Mach. Learn. Signal Process. (PCEMS), Nagpur, India, IEEE, 2023, 1–6. doi: 10.1109/PCEMS58491.2023.10136076. [Google Scholar] [CrossRef]
7. C. -Y. Chen et al., “Automated ECG classification based on 1D deep learning network,” Methods, vol. 202, no. 2, pp. 127–135, 2022. doi: 10.1016/j.ymeth.2021.04.021. [Google Scholar] [PubMed] [CrossRef]
8. V. Gupta, N. K. Saxena, A. Kanungo, A. Gupta, P. Kumar and Salim, “A review of different ECG classification/detection techniques for improved medical applications,” Int. J. Syst. Assur. Eng. Manag., vol. 13, no. 3, pp. 1037–1051, 2022. doi: 10.1007/s13198-021-01548-3. [Google Scholar] [CrossRef]
9. M. Hammad, S. Meshoul, P. Dziwiński, P. Pławiak, and I. A. Elgendy, “Efficient lightweight multimodel deep fusion based on ECG for arrhythmia classification,” Sensors, vol. 22, no. 23, 2022, Art. no. 9347. doi: 10.3390/s22239347. [Google Scholar] [PubMed] [CrossRef]
10. A. Honnashamaiah and S. Rathnakara, “Detection of arrhythmia in ECG signal using deep learning methods–A exhaustive review & summary of the concepts & techniques,” Tuijin Jishu/J. Propuls. Technol., vol. 44, no. 4, pp. 5088–5095, 2023. doi: 10.52783/tjjpt.v44.i4.1845. [Google Scholar] [CrossRef]
11. A. A. Rawi, M. K. Albashir, and A. M. Ahmed, “Classification and detection of ECG arrhythmia and myocardial infarction using deep learning: A review,” Webology, vol. 19, no. 1, pp. 1151–1170, 2022. doi: 10.14704/WEB/V19I1/WEB19078. [Google Scholar] [CrossRef]
12. P. Madan, V. Singh, D. P. Singh, M. Diwakar, B. Pant and A. Kishor, “A hybrid deep learning approach for ECG-based arrhythmia classification,” Bioengineering, vol. 9, no. 4, 2022, Art. no. 152. doi: 10.3390/bioengineering9040152. [Google Scholar] [PubMed] [CrossRef]
13. F. Kusumoto, ECG Interpretation: From Pathophysiology to Clinical Application (no. 1). New York, NY: Springer Nature, 2020, p. 302. [Google Scholar]
14. H. Lee and M. Shin, “Learning explainable time-morphology patterns for automatic arrhythmia classification from short single-lead ECGs,” Sensors, vol. 21, no. 13, 2021, Art. no. 4331. doi: 10.3390/s21134331. [Google Scholar] [PubMed] [CrossRef]
15. S. Mian Qaisar and S. F. Hussain, “An effective arrhythmia classification via ECG signal subsampling and mutual information based subbands statistical features selection,” J. Ambient Intell. Humaniz. Comput., vol. 14, no. 3, pp. 1473–1487, 2023. doi: 10.1007/s12652-021-03275-w. [Google Scholar] [CrossRef]
16. S. C. Mohonta, M. A. Motin, and D. K. Kumar, “Electrocardiogram based arrhythmia classification using wavelet transform with deep learning model,” Sens. Biosens. Res., vol. 37, no. 20, 2022, Art. no. 100502. doi: 10.1016/j.sbsr.2022.100502. [Google Scholar] [CrossRef]
17. M. Sepahvand and F. Abdali-Mohammadi, “A novel multi-lead ECG personal recognition based on signals functional and structural dependencies using time-frequency representation and evolutionary morphological CNN,” Biomed. Signal Process. Control, vol. 68, no. 6, 2021, Art. no. 102766. doi: 10.1016/j.bspc.2021.102766. [Google Scholar] [CrossRef]
18. M. Janveja, R. Parmar, M. Tantuway, and G. Trivedi, “A DNN-based low power ECG co-processor architecture to classify cardiac arrhythmia for wearable devices,” IEEE Trans. Circuits Syst. II: Express Briefs, vol. 69, no. 4, pp. 2281–2285, 2022. doi: 10.1109/TCSII.2022.3146036. [Google Scholar] [CrossRef]
19. Q. Xiao et al., “Deep learning-based ECG arrhythmia classification: A systematic review,” Appl. Sci., vol. 13, no. 8, 2023, Art. no. 4964. doi: 10.3390/app13084964. [Google Scholar] [CrossRef]
20. B. M. Mathunjwa, Y. -T. Lin, C. -H. Lin, M. F. Abbod, and J. -S. Shieh, “ECG arrhythmia classification by using a recurrence plot and convolutional neural network,” Biomed. Signal Process. Control, vol. 64, no. 19, 2021, Art. no. 102262. doi: 10.1016/j.bspc.2020.102262. [Google Scholar] [CrossRef]
21. Y. Wang, G. Yang, S. Li, Y. Li, L. He and D. Liu, “Arrhythmia classification algorithm based on multi-head self-attention mechanism,” Biomed. Signal Process. Control, vol. 79, no. 21, 2023, Art. no. 104206. doi: 10.1016/j.bspc.2022.104206. [Google Scholar] [CrossRef]
22. J. Li, S. -P Pang, F. Xu, P. Ji, S. Zhou and M. Shu, “Two-dimensional ECG-based cardiac arrhythmia classification using DSE-ResNet,” Sci. Rep., vol. 12, no. 1, 2022, Art. no. 14485. doi: 10.1038/s41598-022-18664-0. [Google Scholar] [PubMed] [CrossRef]
23. J. Zheng, J. Zhang, S. Danioko, H. Yao, H. Guo and C. Rakovski, “A 12-lead electrocardiogram database for arrhythmia research covering more than 10,000 patients,” Sci. Data, vol. 7, no. 1, 2020, Art. no. 48. doi: 10.1038/s41597-020-0386-x. [Google Scholar] [PubMed] [CrossRef]
24. Ö. Yıldırım, P. Pławiak, R. -S. Tan, and U. R. Acharya, “Arrhythmia detection using deep convolutional neural network with long duration ECG signals,” Comput. Biol. Med., vol. 102, no. 4, pp. 411–420, 2018. doi: 10.1016/j.compbiomed.2018.09.009. [Google Scholar] [PubMed] [CrossRef]
25. Z. Li, D. Zhou, L. Wan, J. Li, and W. Mou, “Heartbeat classification using deep residual convolutional neural network from 2-lead electrocardiogram,” J. Electrocardiol., vol. 58, no. 4, pp. 105–112, 2020. doi: 10.1016/j.jelectrocard.2019.11.046. [Google Scholar] [PubMed] [CrossRef]
26. B. Andayeshgar, F. Abdali-Mohammadi, M. Sepahvand, A. Almasi, and N. Salari, “Arrhythmia detection by the graph convolution network and a proposed structure for communication between cardiac leads,” BMC Med. Res. Methodol., vol. 24, no. 1, 2024, Art. no. 96. doi: 10.1186/s12874-024-02223-4. [Google Scholar] [PubMed] [CrossRef]
27. O. Yildirim, M. Talo, E. J. Ciaccio, R. S. Tan, and U. R. Acharya, “Accurate deep neural network model to detect cardiac arrhythmia on more than 10,000 individual subject ECG records,” Comput. Methods Programs Biomed., vol. 197, no. 9, 2020, Art. no. 105740. doi: 10.1016/j.cmpb.2020.105740. [Google Scholar] [PubMed] [CrossRef]
28. O. Faust and U. R. Acharya, “Automated classification of five arrhythmias and normal sinus rhythm based on RR interval signals,” Expert. Syst. Appl., vol. 181, no. 23, 2021, Art. no. 115031. doi: 10.1016/j.eswa.2021.115031. [Google Scholar] [CrossRef]
29. T. Mehari and N. Strodthoff, “Self-supervised representation learning from 12-lead ECG data,” Comput. Biol. Med., vol. 141, 2022, Art. no. 105114. doi: 10.1016/j.compbiomed.2021.105114. [Google Scholar] [PubMed] [CrossRef]
30. B. Chen et al., “A deep learning model for the classification of atrial fibrillation in critically ill patients,” Intensive Care Med. Exp., vol. 11, no. 1, Jan. 13, 2023, Art. no. 2. doi: 10.1186/s40635-022-00490-3. [Google Scholar] [PubMed] [CrossRef]
Cite This Article
 Copyright © 2024 The Author(s). Published by Tech Science Press.
This work is licensed under a Creative Commons Attribution 4.0 International License , which permits unrestricted use, distribution, and reproduction in any medium, provided the original work is properly cited.
 Downloads
 Citation Tools