
 Submit a Paper
 Propose a Special lssue
 Open Access
ARTICLE

Enhancing Early Detection of Lung Cancer through Advanced Image Processing Techniques and Deep Learning Architectures for CT Scans
1 Computers and Systems Department, Electronics Research Institute, El Nozha, Huckstep Cairo, 12622, Egypt
2 Department of Electronics and Electrical Communications Engineering, Faculty of Electronic Engineering, Menoufia University, Menouf, 32952, Egypt
3 Security Engineering Lab, Computer Science Department, Prince Sultan University, Riyadh, 11586, Saudi Arabia
4 Department of Information Technology, College of Computer and Information Sciences, Princess Nourah bint Abdulrahman University, Riyadh, 84428, Saudi Arabia
* Corresponding Author: Nahed Tawfik. Email:
(This article belongs to the Special Issue: Data and Image Processing in Intelligent Information Systems)
Computers, Materials & Continua 2024, 81(1), 271-307. https://doi.org/10.32604/cmc.2024.052404
Received 01 April 2024; Accepted 09 August 2024; Issue published 15 October 2024
 View Full Text
 Download PDF
Abstract
Lung cancer remains a major concern in modern oncology due to its high mortality rates and multifaceted origins, including hereditary factors and various clinical changes. It stands as the deadliest type of cancer and a significant cause of cancer-related deaths globally. Early diagnosis enables healthcare providers to administer appropriate treatment measures promptly and accurately, leading to improved prognosis and higher survival rates. The significant increase in both the incidence and mortality rates of lung cancer, particularly its ranking as the second most prevalent cancer among women worldwide, underscores the need for comprehensive research into efficient screening methods. Advances in diagnostic techniques, particularly the use of computed tomography (CT) scans, have revolutionized the identification of lung cancer. CT scans are renowned for their ability to provide high-resolution images and are particularly effective in detecting small, calcified areas, crucial for identifying early-stage lung cancer. Consequently, there is growing interest in enhancing computer-aided detection (CAD) systems. These algorithms assist radiologists by reducing false-positive interpretations and improving the accuracy of early cancer diagnosis. This study aims to enhance the effectiveness of CAD systems through various methods. Initially, the Contrast Limited Adaptive Histogram Equalization (CLAHE) algorithm is employed to preprocess CT scan images, thereby improving their visual quality. Further refinement is achieved by integrating different optimization strategies with the CLAHE method. The CutMix data augmentation technique is applied to boost the performance of the proposed model. A comparative analysis is conducted using deep learning architectures such as Inception-V3, ResNet101, Xception, and EfficientNet. The study evaluates the performance of these architectures in image classification tasks, both with and without the implementation of the CLAHE algorithm. The empirical findings of the study demonstrate a significant reduction in the false positive rate (FPR) and an overall enhancement in diagnostic accuracy. This research not only contributes to the field of medical imaging but also holds significant implications for the early detection and treatment of lung cancer, ultimately aiming to reduce its mortality rates.Keywords
Lung cancer, characterized as the most fatal of all cancers, accounts for a staggering 18% of total cancer-related mortalities globally [1]. Smoking, considered the primary etiological factor in lung cancer genesis, remains a pressing issue, with its prevalence still on an upward trajectory in various regions. This tendency indicates that lung cancer will remain a substantial health concern in the near future. The pivotal role of early detection in enhancing survival rates cannot be overstated [2]. Lung cancer also ranks as the second most prevalent cancer among women, further amplifying its impact on global health.
The World Health Organization reports lung cancer as the sixth leading cause of death worldwide, underscoring its severe health burden [3]. Projections by the American Cancer Society for the year 2023 indicate a bleak prediction of 238,340 new lung cancer cases, alongside an estimated 127,070 fatalities [4], as depicted in Fig. 1.

Figure 1: Lung and other cancer statistics (reprinted from Reference [5])
Lung cancer is a multifaceted and challenging disease that is mainly divided into two main types: small cell lung cancer (SCLC) and non-small cell lung cancer (NSCLC). Lung cancer has a multifaceted origin, involving several risk factors like tobacco smoking, second-hand smoke exposure, and air pollution, as well as individual characteristics such as gender, genetic predispositions, and aging [5]. The various reasons highlight the complex nature of lung cancer development and the need for a wide range of preventive and diagnostic approaches.
This result emphasizes the need for more studies on early detection approaches and more efficient treatment processes. The rising rates of lung cancer cases and deaths require a comprehensive strategy that includes encompassing public health initiatives aimed at smoking cessation, improvements in early detection through medical imaging, and the creation of new treatment methods. The global health community reaction to this persistent catastrophe will be vital in shaping the future trends of lung cancer morbidity and fatality rates.
There is a critical need for increased attention in the biological, medicinal, and scientific fields to create new and advanced diagnostic methods. Early diagnosis is crucial in medical decision-making and substantially impacts the effectiveness of treatments, eventually affecting patient outcomes and healthcare advancements [6]. Developing and implementing computer-aided diagnostic (CAD) systems are crucial strategies for solving this urgent healthcare concern. These technological improvements are expected to help healthcare providers diagnose lung cancer early, improving the likelihood of timely intervention and possibly lowering mortality rates linked to the condition.
Medical imaging is important in identifying and characterizing aberrant growths and diseases in diagnostic pathology. Experienced pathologists heavily depend on a variety of imaging techniques to identify and diagnose different types of cancer, such as lung cancer. The tools include conventional radiography, magnetic resonance imaging (MRI), computed tomography (CT), and positron emission tomography (PET). Using these imaging techniques early on is vital for detecting lung cancer, as it helps identify malignancies when they are more treatable.
This paradigm highlights the capability of combining sophisticated image technologies with machine learning and artificial intelligence in CAD systems. This integration intends to improve the precision and effectiveness of lung cancer detection, therefore playing a crucial part in the overall strategy to fight this widespread illness. Collaboration among medical, scientific, and technical fields is crucial for creating and enhancing novel diagnostic tools, leading to better patient outcomes and decreased worldwide burden of lung cancer.
Convolutional Neural Networks (CNNs) have gained widespread prominence in the identification of lung cancer. Yet, the prediction and accurate detection of lung cancer through CNNs are fraught with challenges, primarily attributed to the intricate architecture of CT scans. Additionally, the effectiveness of CNN models is often hampered by various technical difficulties, including the selection of an optimal architecture, the determination of appropriate model parameters, and the fine-tuning of ideal weight and bias values.
In the realm of supervised machine learning, algorithms are trained on labeled datasets where they discern both known and previously unidentified attributes. This training enables the algorithms to predict or detect the presence of cancerous conditions in medical images. In the typical workflow of a CAD system employing machine learning, images are first subjected to preprocessing [7]. Subsequently, salient features are extracted to streamline data processing, followed by the deployment of classifiers to differentiate between cancerous and non-cancerous images. Historically, the manual extraction of diverse features represented the most labor-intensive and time-consuming aspect of traditional detection methodologies. Deep learning models, however, have revolutionized this process by autonomously extracting image features, thereby significantly enhancing the efficiency of CAD systems in recent years. Deep learning algorithms have demonstrated remarkable effectiveness in the field of medical image processing [8].
In summary, advancements in medical imaging have significantly enhanced diagnostic capabilities. Integrating intelligent assisted diagnosis systems is crucial for boosting the efficacy and reliability of cancer detection, especially in the early stages. These technologies assist doctors in making informed decisions and enable more individualized and effective treatment regimes, leading to improved patient outcomes in oncological care. Although there have been notable improvements in the detection and diagnosis of lung cancer, contemporary methods still encounter difficulties in accuracy, early identification, and efficiency. Current research shows a deficiency in advancing and utilizing new computational methods, specifically in combining complex image processing algorithms and deep learning models for categorizing lung cancer through CT scans. Although traditional methods and some CAD systems have been used, comprehensive strategies still need to successfully integrate the most recent developments in image improvement, data augmentation, and deep learning architectures. Reducing false positives (FPs) and enhancing the precision of detection in early-stage lung cancer is a crucial topic that existing technologies have not fully tackled.
The motivation for this research is the pressing necessity to enhance lung cancer diagnostic techniques, which are essential for improving survival rates. Timely and precise identification of lung cancer greatly impacts the effectiveness of treatment. However, it is difficult due to the intricate nature of lung tissue imaging and the modest signs of early-stage development. This research intends to overcome the shortcomings of current diagnostic methods by utilizing advanced image processing techniques, such as Contrast Limited Adaptive Histogram Equalization (CLAHE) and the CutMix data augmentation method, in combination with deep learning models. Combining these strategies is anticipated to improve the sharpness and excellence of CT images, thereby assisting in more precise and effective lung cancer categorization. The main objective is to enhance medical imaging and cancer diagnosis by developing a more dependable, accurate, and early detection system that could improve patient outcomes and potentially increase survival rates for lung cancer patients.
In this work, we selected the CLAHE algorithm to enhance CT images due to its ability to improve local contrast, adapt to image features, handle restricted dynamic range, and reduce the influence of noise. By improving local contrast, it effectively accentuates subtle details without causing any distortion to the overall image. The technique adaptive nature allows it to modify parameters based on the image characteristics, ensuring effective improvement while maintaining image integrity. Furthermore, CLAHE evenly distributes intensity values across the spectrum of brightness levels, improving visibility in dark and bright areas without causing saturation. The technique resilience to noise allows for the easy distinction of visual features from unwanted artifacts. Through non-linear changes to image histograms, CLAHE improves the display of anatomical details by drawing attention to important structures and removing unnecessary background data. This technology efficacy in several medical imaging techniques, including CT scans, has been well documented through extensive research and practical use [9].
Consequently, in this research, we developed an automated methodology for cancer diagnosis using grayscale images from CT scans. The keystone of this approach is the utilization of the CLAHE algorithm, which is employed to adjust the contrast, thereby rendering pulmonary nodules more discernible. In addition, different optimization techniques are used to attain optimal outcomes from the CLAHE technique. Moreover, the CutMix data augmentation technique is incorporated to enhance deep learning models’ performance and predictive accuracy. This technique is instrumental in creating varied and novel training examples crucial for robust dataset training. Subsequently, a range of deep learning models is applied to classify CT lung images, illustrating the versatility and efficacy of these computational architectures.
The salient contributions of this paper are multifaceted and can be delineated as follows:
• This paper presents an in-depth review of existing literature pertaining to lung cancer classification techniques. This review serves as a foundational framework, situating our research within the broader context of current scientific understanding.
• We propose various deep neural network architectures for lung cancer classification, demonstrating their potential in enhancing diagnostic precision.
• A key contribution is the introduction of an automated system designed specifically for the classification of lung cancer types. This system leverages the robustness of classification architectures based on deep learning, signifying a leap in computational diagnostics.
• We underscore the importance of conducting essential pre-processing steps prior to the training and testing phases. These steps are critical in reducing FPs and augmenting the precision of the deployed deep learning architectures.
• The integration of different optimization techniques with the CLAHE method is employed to significantly improve the quality of medical imaging, thus enhancing diagnostic accuracy.
• The implementation of the CutMix data augmentation technique is a noteworthy aspect of this research. This technique contributes to the enhanced performance of deep learning models when analyzing chest CT scan datasets.
• A comprehensive analysis is conducted, juxtaposing the proposed techniques with recent traditional algorithms. This analysis provides a nuanced understanding of the advantages and potential limitations of both the novel and traditional methodologies in lung cancer diagnosis.
In essence, this paper not only offers novel computational approaches for lung cancer classification but also provides a critical evaluation of these methods in comparison to established techniques. This comprehensive approach ensures that the research contributes meaningfully to the advancement of medical imaging and cancer diagnosis, potentially leading to improved patient outcomes and more effective clinical practices.
This research paper is systematically structured into distinct sections. Section 2 provides a comprehensive literature review and examines existing lung cancer classification techniques. Section 3 delves into the theoretical foundations and relevant concepts integral to the study. The proposed methodology, including data processing and application of classification techniques, is detailed in Section 4. Section 5 presents an analysis of the results obtained from these techniques. Finally, the paper conclusion is given in Section 6, summarizing the findings and suggesting directions for future research.
Recent advancements in lung cancer diagnosis have been significantly influenced by the integration of computational techniques in medical imaging. Many studies have concentrated on utilizing machine learning and deep learning algorithms to detect lung cancer through CT images. Many studies have used deep and ensemble learning techniques to classify lung lesions. Our study thoroughly examined the most advanced methodologies in classifying lung nodules. This field has attracted significant research focus, resulting in considerable effort to improve diagnostic precision and effectiveness in this domain. The abundance of studies in this area highlights the crucial significance of precise lung nodule classification, serving as a diagnostic tool and a predictor of patient cases. In the following subsections, various studies have been summarized.
The study in [9] employed a deep neural network (DNN) to extract features from medical images. This research methodology consisted of three main phases: data augmentation techniques, classification, and cancer detection. The authors effectively utilized transfer learning approaches to overcome limited available data in medical image analysis. The authors employed well-known architectures such as Xception, VGG 19, and VGG 16 to train their classifiers. The performance of these models was noteworthy, with Xception achieving an accuracy of 97.4%, VGG 19 reaching 98.05%, and VGG 16 excelling at 98.83%.
The authors in [10] exploited the CNN architecture for classifying lung image. This study incorporated six shape-based elements, which improved the model’s analytical abilities. The features comprised the histogram of oriented gradients (HOG), circularity, solidity, the discrete Fourier transform of the radial length (RL) function, moments, and the histogram of the active contour image. The findings of this study achieved an average precision of 95.26% and an average recall of 69.56%.
Combining autoencoders with CNN is accomplished in [11] for lung image classification. The first stage in this approach was applying a convolution filter to the images, then down-sampling them using max pooling to preprocess the images. The system utilized an autoencoder within the CNN framework to extract essential features from the images. A multi-space image reconstruction technique was used to enhance the procedure to reduce error rates. In the last phase, the reconstructed images were fe into a SoftMax layer to aid in the classification of the CT images. This approach demonstrated an accuracy of 99.5%.
Deep learning approaches with transfer learning algorithms were used in [12] to classify different lung diseases. This method entailed analyzing unprocessed lung images using an EfficientNet v2-M deep learning network. This approach displayed variable performance metrics for distinct disease groups, with accuracies of 63.60% for normal patients, 82.30% for pneumonia, 82.80% for pneumothorax, and 89.90% for tuberculosis.
Nageswaran et al. [13] introduced an approach for predicting and classifying lung cancer by combining multiple machine-learning algorithms and image-processing methods. The images were first preprocessed using the geometric mean filter. The K-means clustering technique was used to divide the improved images into separate regions, making identification of specific areas of interest easier. This study utilized machine learning techniques such as K-Nearest Neighbors (KNN), Artificial Neural Networks (ANN), and Random Forest (RF) for the classification task. The artificial ANN showed the highest accuracy among these methods, indicating its potential for lung cancer categorization.
Masood et al. [14] introduced a three-dimensional (3D) deep CNN system. This system was a hybrid structure of deep learning and cloud computing, specifically developed to diagnose lung nodules. Utilizing the multi-region proposal network (mRPN) within this architecture, the authors integrated cloud computing to enhance the overall performance of the CAD system. Their system exhibited impressive capabilities, achieving a 98.5% accuracy in lung cancer detection. Moreover, Ozdemir et al. [15] proposed a system based on 3D CNN for diagnosing and detecting lung cancer. This model was noteworthy for its high accuracy, achieving a rate of 96.5% in lung cancer diagnosis.
The double-deep CNN was introduced in [16] to predict the stages of lung cancer. The authors employed CT scans to train both the deep CNN and the standard deep CNNs, focusing specifically on the Tx stage of lung cancer. A double deep neural network, incorporating convolution and max-pooling layers, was tested using pulmonary cancer images to evaluate their capacity in staging lung cancer, with a particular emphasis on the Tx stage. This approach yielded an accuracy of 99.62%.
The work in [17] presented an approach combining a metaheuristic algorithm with a CNN—the method was initiated by creating a CNN architecture and then calculating the model’s solution vector. The solution vector was improved using the Ebola optimization search algorithm (EOSA) to find the best weights and biases for training the CNN model. After training the EOSA-CNN hybrid model, an optimal configuration was established. EOSA-CNN acquired a specificity of 0.7941, 0.97951, 0.9328, and sensitivity of 0.9038, 0.13333, and 0.9071 for normal, benign, and malignant cases, respectively.
An automated deep-learning framework was introduced for early detection and classification of lung nodules [18]. The methodology encompassed three integral stages: initial lung segmentation using a modified 3D U-Net, termed 3D Res-U-Net; nodule detection using YOLO-v5; and final classification via a Vision Transformer-based architecture. The proposed Vision Transformer network achieved an accuracy of 93.57%.
The study in [19] applied various machine learning algorithms for classifying lung cancer images. This approach included integrating two features, Gabor energy, and Gabor entropy, in conjunction with five features derived from the grey-level co-occurrence matrix (GLCM). The methodology was tested using 450 CT scan lung images from the publicly available Lung Image Database Consortium (LIDC) and Image Database Resource Initiative (IDRI) dataset. The results were obtained with the support vector machine (SVM), artificial neural network (ANN), naive Bayes (NB), and perceptron algorithms, achieving accuracy rates of 100%, 99%, 83%, and 92%, respectively.
The work in [20] introduced a deep-learning framework for analyzing lung pneumonia and cancer. The authors proposed two deep-learning methods. The first method, a modified version of the AlexNet, was designed to categorize chest X-ray images into normal and pneumonia classes, employing SVM for classification and comparing its efficacy against the SoftMax classifier. The second method in this study focused on augmenting the modified AlexNet with a fusion of learned and handcrafted features. This method was implemented through serial fusion and principal component analysis (PCA) with a feature selection process, resulting in a classification accuracy of 97.27%.
In [21], an improved CNN was proposed for the classification of lung cancer types. This approach integrated a gray wolf optimization algorithm to fine-tune the CNN hyperparameters. The results from this model indicated an accuracy of up to 98.21%, with a minimal loss of approximately 0.10%.
Lanjewar et al. [22] employed an enhanced DenseNet architecture for the detection of lung cancer in CT scans. Initially, they extended the original DenseNet framework, derived from the DenseNet201 model, to specifically target lung cancer identification. They then performed feature extraction using DenseNet201 and utilized it in a machine learning classifier. Ultimately, their findings indicate a system accuracy of 100%, with an average accuracy of 95%.
Recent progress in deep learning has demonstrated substantial potential in different sectors, particularly in examining medical images. These techniques have successfully identified medical disorders, such as cancer, in images. Conventional machine learning algorithms face challenges in reliability because of the significant variability in medical imaging among individuals. The main limitations of current systems are their time-consuming procedures, high costs, and demand for specialized knowledge. Deep learning methods can help overcome these obstacles by creating an intelligent system that can identify lung cancer independently and precisely.
CNNs have distinct benefits in medical imaging, including location invariance, enabling their filters to identify patterns irrespective of their spatial arrangement. Sliding windows allow filters to learn patterns over the entire image, enhancing this potential. CNNs’ hierarchical structure automatically recognizes intricate patterns, with initial layers detecting fundamental boundaries and structures, intermediate layers concentrating on shapes, and higher-level layers identifying broader object shapes [11]. CNNs benefit from a layered approach, improving their effectiveness in analyzing medical images, especially in the complex field of lung cancer diagnosis.
While existing literature provides significant insights into lung cancer detection using computational methods, there remains a noticeable gap in the comprehensive integration of advanced image processing techniques, innovative data augmentation methods, and deep learning for CT scan analysis. This research aims to bridge this gap by combining CLAHE for image enhancement, CutMix for data augmentation, and various deep learning architectures to improve the accuracy and efficiency of lung cancer classification. This approach is expected to contribute to reducing FPs and enhancing the reliability of early-stage lung cancer detection.
This section delineates the foundational theories and techniques integral to our research, encompassing the CLAHE and CutMix data augmentation.
3.1 Contrast Limited Adaptive Histogram Equalization (CLAHE)
Histogram equalization is an essential technique to improve medical images by adjusting the contrast according to the image histogram. Conventional histogram equalization entails adjusting the grayscale values of an image to create a more even distribution in the resulting histogram. This approach assumes consistent quality throughout the image, implying that a single grayscale mapping could improve all areas globally. This assumption is invalid when grayscale distributions differ significantly across several image regions.
The Adaptive Histogram Equalization (AHE) algorithm is employed to address this, offering significant improvements over traditional methods, especially in images with variable grayscale distributions. An advanced variant of AHE is the CLAHE, initially introduced in [23] and further elaborated in [24]. CLAHE stands out by incorporating a limiting mechanism to reduce noise amplification in near-constant regions, a common drawback of standard AHE. This feature makes CLAHE particularly advantageous in categorizing medical imagery, where it has gained traction for its effective image enhancement capabilities [25,26]. In medical imaging, CLAHE has been shown to not only improve image contrast but also to equalize lightness and mitigate noise [27].
In our work, CLAHE is applied to enhance image contrast and accentuate image edges. A distinctive feature of CLAHE is its ability to retain and redistribute the concentrated portions of the histogram instead of discarding them. This approach ensures a more subtle and effective enhancement of medical images.
The underlying principle of the CLAHE algorithm involves applying histogram equalization to distinct, non-overlapping sections of an image. To smooth out any anomalies at the tile boundaries, the algorithm employs bilinear interpolation. This resampling technique, pivotal in both computer vision and image processing, is sometimes referred to as bilinear texture mapping or bilinear filtering. Bilinear interpolation functions by executing linear interpolation twice to interpolate functions with two variables [28], thereby seamlessly blending adjacent tiles and eliminating spurious borders. This technique enhances the overall fidelity and clarity of the processed images, making itself a robust tool in our medical image analysis framework.
Implementing the CLAHE algorithm significantly impacts the source lung images, as depicted in Fig. 2. This figure illustrates the original image values distributed across a range from a minimum of 0 to a maximum of 255. In contrast, the image enhanced through CLAHE exhibits a considerable centralization of pixel values within the histogram median range. This visual comparison underscores the effectiveness of CLAHE in altering and improving the image contrast, thereby facilitating more precise medical image analysis.

Figure 2: Original and enhanced images using CLAHE algorithm
Two critical parameters warrant careful consideration while implementing the CLAHE technique: the clip limit and the tile grid size.
1. Clip Limit: This parameter plays a vital role in setting the threshold for contrast limitation. It effectively establishes the maximum extent to which contrast enhancement is permitted before being curtailed. The clip limit is thus instrumental in preventing over-amplification of contrast, which can lead to the loss of essential image details.
2. Tile Grid Size: The configuration of the tile grid size determines the dimensions of the grid, thereby defining the number of tiles in each row and column. This parameter is crucial as it dictates the granularity with which the image is partitioned in the CLAHE process. The selected tile grid size influences the algorithm localized adaptability, allowing variable contrast adjustments across different image regions [29].
The clip limit largely governs the efficacy of CLAHE. This limit ensures that the histograms for non-overlapping regions are normalized to a level below the specified threshold [30]. The mathematical expression for calculating the clip limit β in the CLAHE method is as follows:
Here, I and J represent the number of pixels in each area, K denotes the number of grayscale levels, α is the clip parameter, and
The CLAHE technique is executed through a series of methodical and well-defined procedural steps, as illustrated in Fig. 3, ensuring optimal image contrast enhancement while preserving essential details. These steps are outlined as follows:

Figure 3: Main steps of the CLAHE algorithm
1. Image Partitioning: The process begins with segmenting the original image into discrete, non-overlapping tiles or regions. This partitioning is critical as it allows for the localized application of contrast enhancement, catering to the unique characteristics of each region.
2. Histogram Computation: A histogram is computed for each of these segmented tiles, accurately representing the distribution of intensity levels within that specific region. This step forms the basis for subsequent contrast modifications.
3. Contrast Enhancement: The enhancement phase involves modifying each tile’s histogram using histogram equalization techniques. These techniques are applied in a manner tailored to each region’s unique intensity distribution, thereby ensuring a more nuanced enhancement of contrast.
4. Clipping Mechanism: A crucial step in the CLAHE process is implementing a contrast-limiting clipping operation on the histogram. This mechanism is designed to prevent noise over-amplification, a common issue in standard histogram equalization. By limiting the amplification of pixel values, the clipping step maintains the integrity of the image details.
5. Interpolation Procedure: The final step involves the interpolation of the enhanced tiles. This procedure is essential to smoothly blending the edges of adjacent tiles, thereby eliminating abrupt transitions and producing a cohesive and visually coherent output image.
Through these steps, CLAHE effectively adapts to varying contrast levels across different regions of the image. This localized approach to histogram equalization results in a significantly improved output, offering enhanced visual clarity compared to global histogram equalization methods. The use of CLAHE in medical imaging, particularly in lung image analysis, provides a powerful tool for enhancing image quality and aiding in accurate diagnosis.
Parameter Optimization for CLAHE
Calibrating parameters for the CLAHE is a pivotal aspect that directly influences its effectiveness. A series of advanced optimization techniques were implemented to establish the most suitable clip limit value and tile grid size for CLAHE. These techniques include particle swarm optimization (PSO), covariance matrix adaptation evolution strategy (CMA-ES), modified CMA-ES optimization, sequential least square programming (SLSQP) algorithm, basin hopping optimization, and the genetic algorithms (GA).
Through these optimization procedures, the study aimed to refine the operational parameters of CLAHE, thereby enhancing its applicability and effectiveness in medical image processing, particularly in lung image analysis.
Initially, the PSO algorithm was selected for its renowned efficiency in parameter optimization. This technique application in image processing, particularly for the optimization of operational parameters in CLAHE, represents a novel approach in this study. PSO is acknowledged for its robustness in tackling complex optimization challenges across various fields. In this context, it was employed to determine the optimal settings for the CLAHE algorithm, with a specific focus on maximizing image quality.
The optimization process involved initializing a population of particles with random values for the clip limit and tile grid size, confined within pre-established boundaries. Each particle, representing a potential solution, was evaluated in successive iterations using a predefined objective function. This function assesses the fitness of the solution, primarily based on the quality of the image enhancement achieved.
During the PSO optimization, special attention was paid to the selection of the clip limit, a critical parameter in the CLAHE algorithm. The chosen value needs to balance the enhancement of image contrast while mitigating quality degradation factors such as saturation, shifts in mean intensity, and alterations in geometrical and intensity features. Moreover, the algorithm also considers potential changes in the textural attributes of the images. Such comprehensive evaluation was crucial to ensure that the CLAHE algorithm, when applied to medical images, achieves an optimal balance between enhancing contrast and preserving image quality [31].
The CMA-ES, developed by Nikolaus Hansen, falls under the category of evolution strategy algorithms. It is particularly well-known for its proficiency in solving complex optimization problems that are nonlinear, non-convex, and typically classified as black-box challenges in continuous domains. CMA-ES is characterized by its iterative process, generating new solutions around a dynamically adaptive recombination point, and is especially effective in scenarios involving small population sizes, demonstrating impressive sample efficiency. The algorithm operates by sampling each generation from a distribution optimized to favor solutions with superior fitness values. Central to its methodology is the adaptive adjustment of the covariance matrix, enhancing the algorithm convergence rate while concurrently averting premature convergence. This attribute positions CMA-ES as a formidable tool in optimization, adept at tackling intricate optimization problems [32].
The SLSQP is a gradient-based method designed for nonlinear optimization problems, incorporating constraints. The SLSQP adeptly manages the nonlinear relationships among various features. It offers a comprehensive approach to parameter determination, considering not only the objective function but also additional constraints. This is particularly relevant in optimizing image properties related to anticancer compounds [33].
Basin Hopping Optimization, developed by David Wales and Jonathan Doye, is an iterative global optimization technique designed to determine the global minimum of a complex, multimodal objective function. This method combines local minimization steps with random perturbations, effectively navigating through intricate, multimodal landscapes. The process involves a random perturbation of the system, followed by local optimization to find a minimum near the perturbed configuration. Decisions on accepting or rejecting new configurations are made similar to the Metropolis criterion in simulated annealing. This combination of global perturbations and iterative local searches enables the Basin Hopping Optimization to explore various minima and traverse complex terrains, making it particularly suitable for problems with numerous local minima [34].
The GA is an optimization technique based on the principles of Darwinian evolution. GA is versatile, with applications ranging from finding extrema in functions to addressing routing issues and solving mathematical problems, including both linear and non-linear programming. GA implementation in various problems is typically accompanied by detailed formulations and live software demonstrations, providing both theoretical and practical insights [35].
The evaluation of image quality post-enhancement is conducted through both visual and objective assessment parameters. Visual evaluation is crucial for observing the effects of different optimization techniques on the enhanced image, as shown in Fig. 4. Objective assessment involves metrics such as Peak Signal-to-Noise Ratio (PSNR), Structural Similarity Index (SSIM), Mean Squared Error (MSE), and Normalized Root Mean Square Error (NRMSE) [36,37], as detailed in Table 1. These metrics provide a quantitative evaluation of the image quality, allowing for an objective comparison of the effectiveness of the various enhancement algorithms.

Figure 4: (a) Original image, (b) image enhanced by CLAHE with SLSQP, (c) image enhanced by CLAHE with differential evolution optimizer (d) image enhanced by CLAHE with PSO, (e) image enhanced by CLAHE with Basin hopping optimizer, (f) image enhanced by CLAHE with CMA-ES optimizer, (g) image enhanced by CLAHE with modified CMA-ES optimizer, (h) image enhanced by CLAHE with GA optimizer

The SSIM is an analytical tool employed to quantify the structural resemblance between the enhanced image and the original one. SSIM values range from 0 to 1, where a value of 0 indicates no correlation with the original image, and a value of 1 signifies complete similarity. A high SSIM value shows a closer structural similarity of the enhanced image to the original one. The SSIM between the input (A) and the enhanced image (B) is mathematically defined as:
In this equation,
The PSNR is another quantitative metric used to evaluate the discrepancy between an original image and its enhanced version. A higher PSNR indicates a less disparity between the compared images, typically signifying higher image quality. Additionally, the MSE is widely used to assess image quality. It serves as a reference measure where values closer to zero are indicative of superior image quality. The formulas for PSNR and MSE are as follows:
Here, L represents the maximum grayscale level, and (m, n) are the dimensions of the original image (A) and the enhanced image (B).
The NRMSE is a metric used to evaluate the quality of images by measuring the normalized difference between the values of the enhanced image and the original one. A lower NRMSE value indicates better image quality, as it signifies less variation between the actual and expected image data [38]. The NRMSE of the enhanced image is defined as:
In this formula, A(i, j) and B(i, j) represent the pixel intensities of the original and enhanced images, respectively.
The analysis of outcomes from our study reveals that the CMA-ES optimizer demonstrates exceptional effectiveness in reducing distortions, such as noise, while preserving critical local features in the images, including edges, corners, and textures. This performance is notably superior to that of other optimization methods tested.
In the realm of objective assessments, the modified CMA-ES optimizer has shown remarkable results, particularly in terms of the PSNR, a key indicator of image quality. A higher PSNR value achieved by the modified CMA-ES indicates an enhanced quality of the image when compared to the results obtained using other optimization techniques.
Additionally, the low values observed for the MSE and the NRMSE further underscore the superiority of the modified CMA-ES optimizer. Specifically, the modified CMA-ES gives values of 0.054058 for MSE and 0.0091 for NRMSE, both of which are significantly close to zero. These figures are indicative of a high degree of fidelity of the enhanced images, affirming the effectiveness of the modified CMA-ES in image enhancement. Furthermore, the SSIM value obtained was 0.9666, approaching the ideal value of one. This high SSIM value signifies a greater structural similarity between the enhanced image and the original one, corroborating the modified CMA-ES optimizer capacity to retain the inherent characteristics of the original image while enhancing its quality.
Given these compelling results, the modified CMA-ES optimizer efficacy stands out in comparison to other optimization techniques. Therefore, the subsequent phases of our proposed methodology will be grounded on the enhanced images obtained through the application of the modified CMA-ES optimizer. This strategic decision is based on the optimizer proven ability to significantly improve image quality while maintaining the integrity of crucial image features.
To justify the implementation of the CLAHE enhancement method in the CT lung images, a comparison with different traditional enhancement methods is accomplished, as illustrated in Table 2.

This table illustrates that the CLAHE method outperforms the other methods in enhancing the CT lung images in terms of PSNR, SSIM, MSE, and MRMSE.
In addressing the challenge of CNN model overfitting on limited labeled training datasets, data augmentation has emerged as a crucial preprocessing step to enhance the performance of deep learning models. This approach involves training models on datasets that have been expanded and diversified through various data augmentation techniques. Among these techniques, data augmentation has garnered significant attention for its effectiveness in improving model performance in recent years [39]. A method called CutMix was used to enhance these procedures.
CutMix operates by randomly cutting and pasting patches from one image onto another within a pair of images, effectively blending elements of both. This technique goes further by proportionally mixing the ground truth labels corresponding to the area of the patches involved. Distinct from traditional regional dropout strategies, which typically replace excised regions with zeros or random noise, CutMix adopts a more productive approach. Rather than simply omitting pixels, it supplements the removed areas with patches from different images. This innovative approach takes advantage of the absence of uninformative pixels during the training phase, thus enhancing the efficiency and efficacy of the learning process [40].
Remarkably, CutMix has been shown to outperform other state-of-the-art data augmentation strategies consistently [41]. Our research demonstrates that CutMix not only contributes to the improvement of model robustness against input corruptions but also significantly enhances categorization performance for out-of-distribution data. To visually illustrate the effect of the CutMix augmentation technique, Fig. 5 presents samples generated after its application. These visual representations offer insights into how CutMix alters training images, providing a deeper understanding of its impact on model training and performance.

Figure 5: Examples after applying CutMix data augmentation
• Algorithm: Implementation of CutMix Augmentation
The CutMix augmentation strategy is implemented with the objective of generating new training samples
The core of the CutMix strategy is encapsulated in the following equations:
Here, M represents a binary mask, which delineates the areas to be dropped out from the first sample and filled in with corresponding regions from the second sample. The parameter λ, ranging between 0 and 1, is sampled from a Beta distribution with parameter α. The operator ⊙ signifies element-wise multiplication.
The binary mask M is generated by selecting bounding box coordinates
In practical implementation, the rectangular masks M are sampled such that their dimensions are proportional to the main image dimensions. During each iteration of training, a new sample is created by amalgamating two randomly selected training samples in accordance with the above Eqs. (6) and (7). This approach ensures the continuous generation of variable and complex training samples, thereby enhancing the model ability to learn from a rich and diversified dataset.
This research introduces a comprehensive framework (Fig. 6) dedicated to the automatic classification of CT lung cancer images, with the primary objective of distinguishing between cancerous and non-cancerous images. Given the pivotal role of preprocessing in the classification of medical images, special attention is paid to this phase. CT scans often contain a variety of artifacts, including noise, which can significantly impede the accuracy of image analysis. To address this challenge, the study employs the CLAHE. CLAHE is used to effectively enhance the contrast and accentuate the edges throughout the images, thereby improving their overall quality for subsequent analysis.

Figure 6: Automatic classification framework for CT lung images
Due to the often-limited datasets available in the biomedical field, the research incorporates data augmentation techniques. These techniques are well-established as instrumental tools in image classification tasks, particularly within deep learning methodologies. Data augmentation serves to increase the volume of training data and reduce the risk of overfitting, a common challenge in model training. Consequently, additional training images are generated by applying augmentation techniques to the original training set.
In this study, the CutMix algorithm is prominently utilized as an augmentation strategy. CutMix differs from traditional regional dropout strategies by replacing regions at a more granular level. It involves randomly selecting patches from one image and pasting them onto another within a pair of images. Concurrently, the ground truth labels are proportionally mixed based on the area of the patches involved. Unlike conventional methods that simply eliminate pixels, CutMix strategically replaces removed regions with patches from different images, leveraging the concept that each pixel in the training images contains valuable information. This approach not only enhances the efficiency and efficacy of the training process but also contributes to the robustness of the resulting model.
The final step of this process is the classification stage, when a variety of deep learning architectures are used. They include Inception-V3, ResNet101, Xception, and EfficientNet. Each architecture offers unique strengths and capabilities, making them well-suited for the complex task of lung cancer image classification. By utilizing these advanced deep learning models, the study aims to achieve high accuracy and reliability in the automatic classification of lung cancer from CT images.
For this study, CT scan images were selected as the primary data source due to high quality imaging capabilities and relatively lower levels of noise compared to other imaging techniques like X-rays and Magnetic Resonance Imaging (MRI). To accommodate the technical requirements of the deep learning models utilized in this research, the images were not in the DICOM (DCM) format. Instead, they were provided in more common image formats such as JPG or PNG.
The dataset employed in this study was precisely compiled and made publicly available by Mohammad Hany. It is a comprehensive collection that includes three distinct types of chest cancer: adenocarcinoma, large cell carcinoma, and squamous cell carcinoma. Additionally, the dataset contains a separate category for normal cells, with a total of 1000 images, as illustrated in Fig. 7. This extensive dataset is structured for ease of access and use, with a primary folder named ‘Data’ acting as the central repository. Within this repository, the data is further organized into various subfolders, namely ‘test’, ‘train’, and ‘valid’. Each of these subfolders serves a specific purpose in the dataset utilization, facilitating efficient and systematic data handling for different phases of the research, including model training, validation, and testing [42]. This structured organization of the dataset is instrumental in ensuring a streamlined and effective workflow, contributing to the robustness and accuracy of the cancer classification models developed in this study.

Figure 7: Samples of the Chest CT-scan images dataset, (a) normal, (b) large cell carcinoma, (c) adenocarcinoma, and (d) squamous cell carcinoma
4.2 Data Splitting Methodology
In this study, the dataset undergoes a strategic partitioning into three distinct subsets: a training set, a testing set, and a validation set. This segmentation is meticulously orchestrated to optimize the process of classifying lung images. The training set plays a crucial role in the initial training and optimization of the model. It provides the necessary data for the model to learn and adapt its parameters effectively. Concurrently, the validation set is instrumental in the ongoing assessment and fine-tuning of the model throughout the training phase. It enables the evaluation of the model performance in a controlled environment, separate from the training data. This separation is critical as it allows for the identification and rectification of any overfitting or underfitting issues, thereby ensuring that the model generalizes well to new, unseen data.
Following the training and validation phases, the model is then subjected to the test set. This subset comprises data that the model has not previously encountered. The test set is used to generate predictions from the algorithm, which are then meticulously compared and evaluated against the original labels. This comparison is vital to quantifying the efficacy and accuracy of the proposed methodology in a real-world scenario, akin to its application in clinical settings.
For this research, the data distribution among the training, testing, and validation subsets has been determined to be proportional, with allocations of 70%, 20%, and 10%, respectively. This distribution ratio is chosen to ensure a systematic evaluation and robust analysis of the model performance, balancing the need for sufficient training data against the necessity of adequate testing and validation to ascertain the model generalizability and reliability in lung image classification.
Evaluating the performance of a deep learning model is essential for determining its effectiveness in accurately classifying data. Through meticulous assessment, one can identify potential limitations or challenges and take steps to enhance the model accuracy. In our study, we have measured the model performance using several metrics, including accuracy, sensitivity, specificity, precision, false positive rate (FPR), F1_score, Matthews correlation coefficient (MCC), and Kappa. The accuracy of the model is calculated as:
In this equation, TP (True Positive) refers to the number of correctly identified positive cases, while TN (True Negative), FP, and FN (False Negative) denote the counts of correctly identified negative cases, incorrectly labeled positive cases, and incorrectly labeled negative cases, respectively. These terms are crucial for assessing the proportion of instances accurately classified in comparison to the ground truth [43].
Precision, another key metric, measures the accuracy of the model positive predictions:
Precision gives the ratio of TP to the total number of positive predictions made by the model.
Sensitivity is calculated as:
Specificity is defined by:
FPR is given by:
F1_score is calculated by:
Furthermore, the MCC is used as a statistical parameter to evaluate the proposed system. MCC assesses the correlation between predicted values and actual values, providing a comprehensive measure of the model predictive performance. The MCC scale extends from −1 to +1, where a value of +1 signifies an ideal classifier, 0 signifies a random classifier, and −1 denotes a classifier that is entirely inaccurate [44]. The MCC is calculated as:
Additionally, the Kappa statistic is utilized to succinctly express the level of agreement between two nominal categorizations that share the same categories. This measure is particularly valuable in evaluating the consistency and reliability of the model classification accuracy [45]. Landis and Koch proposed a way to classify values: 0 indicates no agreement, 0–0.20 represents a slight agreement, 0.21–0.40 indicates acceptable agreement, 0.41–0.60 defines moderate agreement, 0.61–0.80 recommends substantial agreement, and 0.81–1 signifies almost perfect agreement [46]. The Kappa parameter is given by:
Moreover, we employed a confusion matrix to evaluate the efficacy of our approach. In the matrix, the columns represent the predicted class instances, while the rows display the observed class instances. This matrix is particularly useful for identifying instances of misclassification between two classes by the model [46].
In this research, we conducted a comprehensive evaluation of various deep learning models using a chest CT-scan image dataset sourced from Kaggle. This dataset is specifically curated to advance research and development in medical imaging analysis, with a focus on chest-related diseases. Our study leveraged diverse deep learning models, including Inception-V3, Xception, ResNet101, and EfficientNet, to enhance the diagnosis and early detection of various lung conditions. These models were tasked with classifying lung images into four categories: adenocarcinoma, large cell carcinoma, squamous cell carcinoma, and normal. In the preprocessing stage, the CLAHE algorithm with different optimization techniques and the CutMix data augmentation technique were employed to refine the image quality.
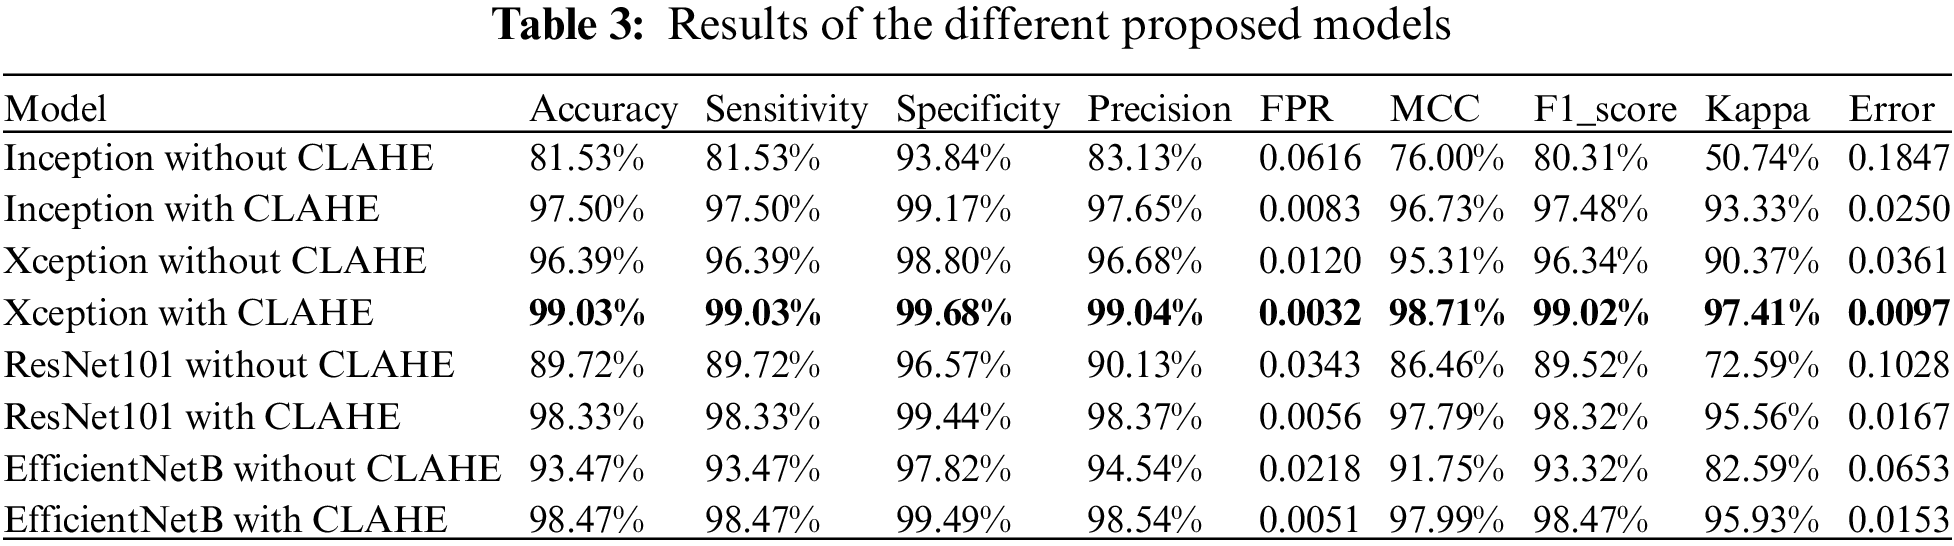
Two sets of experiments were conducted: the first using the mentioned models without the application of CLAHE, and the second incorporating the optimized CLAHE algorithm in the preprocessing phase. The accuracy of the models without image enhancement yielded results of 81.53% for Inception-V3, 96.39% for Xception, 89.72% for ResNet101, and 93.47% for EfficientNet. Following the implementation of the CLAHE preprocessing, the accuracy significantly improved, with Inception-V3 achieving 97.50%, Xception 99.03%, ResNet101 98.33%, and EfficientNet 98.47%. These results underscore the substantial impact of image enhancement on model performance.
Our study effectively demonstrates the utility of various CNN architectures in the classification of lung images. The insights gained from this research have significant implications for practical applications in healthcare settings. The proposed methodology can be utilized in hospitals, medical centers, and radiology clinics to assist specialists in accurately identifying lung diseases. Additionally, this research provides a valuable resource for researchers in developing their studies in the field of medical imaging analysis, contributing to advancements in the diagnosis and treatment of lung-related ailments.
Table 2 presents a comprehensive comparison of the performance metrics for the various models proposed in this study. These metrics include accuracy, error, sensitivity, specificity, precision, FPR, F1_score, MCC, and Cohen’s Kappa.
The results demonstrate a marked improvement in all performance metrics following the implementation of the optimized CLAHE image enhancement technique across all models. This enhancement is particularly evident in metrics such as accuracy, sensitivity, specificity, and MCC. The application of CLAHE not only improved the model ability to accurately classify the images but also enhanced their reliability and precision in distinguishing between various classes of lung ailments.
The results from our study unequivocally indicate that the Xception model surpasses the other proposed models in performance. Consequently, the Xception model, as integrated into our proposed methodology, emerges as the optimal choice for lung disease categorization among the models evaluated. This superior performance is underscored by the alignment observed between the training and accuracy curves, which provides compelling evidence of the absence of overfitting in our model implementation.
Additionally, we employed precision as a key metric to assess the efficacy of our models. Precision, being a common measure in model evaluation, gauges the accuracy of positive predictions made by the model. Alongside precision, sensitivity and specificity were utilized to estimate the quality of positive and negative predictions, respectively. Sensitivity measures the model ability to correctly identify positive instances, while specificity assesses its capability to accurately identify negative instances. Overall, the proposed models demonstrated a notable reduction in the FPR and a significant enhancement in overall accuracy.
To visually assess the performance of our models, accuracy and loss graphs as indicated in Figs. 7–31 were utilized. Figs. 12 and 13 represent the performance of Inception-V3. Figs. 18 and 19 show the evaluation of Xception. Additionally, the performance of ResNet101 is displayed in Figs. 24 and 25. Finally, Figs. 30 and 31 illustrate the accuracy and loss graph of EfficientNet. These graphical representations are instrumental in evaluating the effectiveness of all models.

Figure 8: Performance representation of Inception-V3 using confusion matrix

Figure 9: Performance representation of Inception-V3 with image enhancement using confusion matrix

Figure 10: ROC curve for image classification using Inception-V3
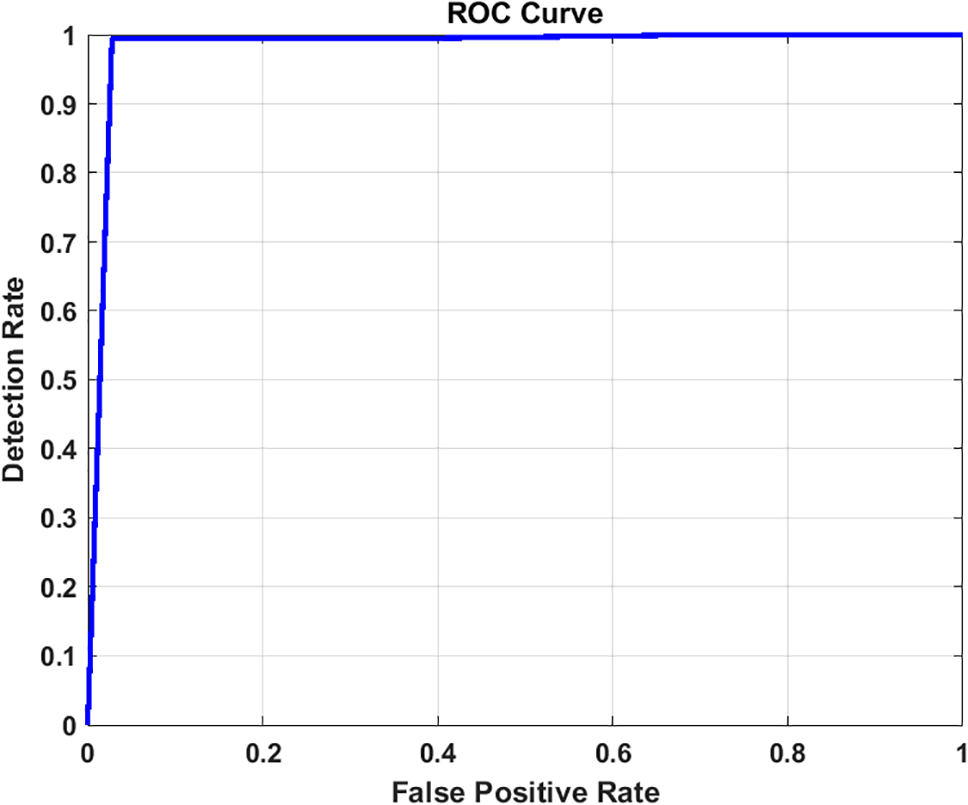
Figure 11: ROC curve for image classification using Inception-V3 with image enhancement

Figure 12: Accuracy and loss graph using Inception-V3

Figure 13: Accuracy and loss graph using Inception-V3 with image enhancement

Figure 14: Performance representation of Xception using confusion matrix

Figure 15: Performance representation of Xception with image enhancement using confusion matrix
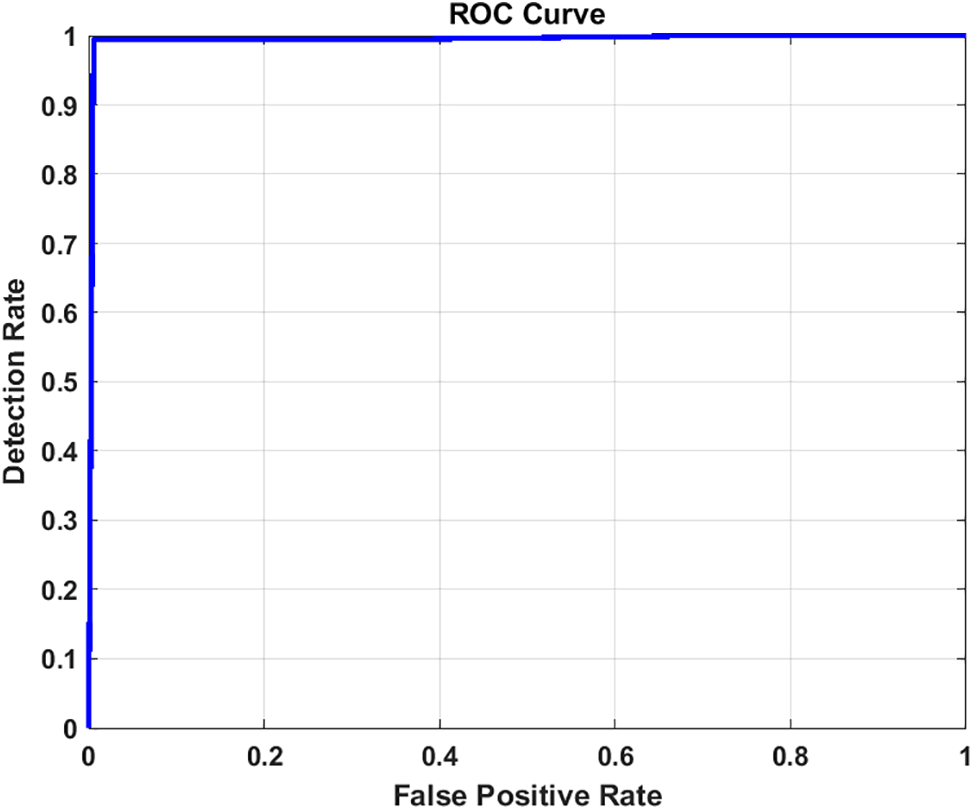
Figure 16: ROC curve for image classification using Xception

Figure 17: ROC curve for image classification using Xception with image enhancement

Figure 18: Accuracy and loss graph using Xception

Figure 19: Accuracy and loss graph using Xception with image enhancement

Figure 20: Performance representation of ResNet101 using confusion matrix

Figure 21: Performance representation of ResNet101 with image enhancement using confusion matrix

Figure 22: ROC curve for image classification using ResNet101

Figure 23: ROC curve for image classification using ResNet101 with image enhancement

Figure 24: Accuracy and loss graph using ResNet101

Figure 25: Accuracy and loss graph using ResNet101 with image enhancement

Figure 26: Performance representation of EfficientNetB using confusion matrix

Figure 27: Performance representation of EfficientNetB with image enhancement using confusion matrix

Figure 28: ROC curve for image classification using EfficientNetB

Figure 29: ROC curve for image classification using EfficientNetB with image enhancement

Figure 30: Accuracy and loss graph using EfficientNetB

Figure 31: Accuracy and loss graph using EfficientNetB with image enhancement
Furthermore, the graphical representation of our results is effectively illustrated through the receiver operating characteristic (ROC) curves. These curves are constructed from a finite set of points, with linear interpolation typically employed between adjacent points under dictionary order. An effective classifier is characterized by a ROC curve that rapidly ascends towards the unit square ceiling, indicating high true positive rates. Conversely, a less effective classifier will have a ROC curve that is smoother and more closely aligned with the diagonal line. The Area Under the Curve (AUC) of the ROC, bounded by the square base and the ROC curve, serves as an additional metric for classifier performance. For our models, Figs. 10 and 11 for Inception, Figs. 16 and 17 for Xception, Figs. 22 and 23 for ResNet101, and Figs. 28 and 29 for EfficientNet depict the ROC curves before and after applying the image enhancement technique.
Lastly, the confusion matrices for the normal, adenocarcinoma, large cell carcinoma, and squamous cell carcinoma classes from the validation set of the chest CT scan images are presented in Figs. 8 and 9 for Inception, Figs. 14 and 15 for Xception, Figs. 20 and 21 for ResNet101, and Figs. 26 and 27 for EfficientNet. These figures demonstrate the performance of each model, both with and without the application of image enhancement, providing a clear visualization of the classification accuracy across different classes.
In this study, we have employed a 5-fold cross-validation method [47] to assess the robustness and reliability of our predictive models, specifically focusing on the Xception model, which was identified as the best-performing model in our proposed method. The dataset was divided into five distinct subsets, or folds, ensuring that each fold was used as a test set exactly once, with the remaining four folds serving as the training set. This approach allows for a comprehensive evaluation as each data point is used for both training and validation exactly once throughout the process.
The results in Table 3 indicate that our model (Xception) achieves robust performance across all folds, demonstrating its efficacy and generalizability in diverse scenarios. The consistent performance metrics across the folds underscore the predictive stability and reliability of our proposed methods. This comprehensive evaluation method ensures that our findings are not biased by any specific subset of data and confirms the general applicability of the Xception model for lung cancer classification.
The performance of our models was evaluated on each fold separately, and the results were averaged to provide a holistic assessment of the model effectiveness. Key performance metrics, including accuracy, precision, sensitivity, specificity, and the area under the receiver operating characteristic (AUC-ROC) curve [48,49], were calculated for each fold. As shown in Table 4, the average of these metrics across all folds provides a reliable measure of our model overall performance.

5.3 Comparative Analysis with Existing Methods
Table 5 provides an in-depth comparative analysis of the proposed models against several state-of-the-art classification algorithms. This comparison specifically focuses on methods utilizing chest CT scan images for classification, highlighting the relative performance of our models, particularly the Xception architecture-based model.

Upon examining the performance metrics, it is observed that the method described in [45] slightly surpasses our model in terms of accuracy and precision. However, our proposed methodology exhibits superior results in sensitivity and F1_score. Sensitivity, or the true positive rate, is a critical measure of a model ability to correctly identify positive cases, and in this regard, our method achieves a remarkable 99.03% sensitivity. This is a notable improvement over the 97.22% and 91% sensitivity scores reported in [45,47], respectively.
Precision, a key metric for evaluating the accuracy of positive predictions, is exceptionally high in our proposed model, standing at 99.03%. Additionally, our method shows a significant reduction in the FPR, enhancing the reliability of the diagnosis. Comparing the F1_scores, which harmonize precision and recall, our model demonstrates an increased ability to diagnose lung diseases, accurately, outperforming existing techniques.
Specificity, which measures the true negative rate is another area where our proposed model excels. The specificity of our model in diagnosing lung disease is higher than that of the other models examined, with an overall specificity of 99.68%. This high specificity is indicative of the model effectiveness in correctly identifying negative cases, thus minimizing false alarms.
Overall, the proposed method not only demonstrates high accuracy but also shows a marked improvement in specificity, sensitivity, and F1_score. These results indicate that our model is highly effective in diagnosing lung diseases, outperforming existing methods in several key performance metrics. This enhanced capability is particularly crucial for medical applications, where accurate and reliable diagnoses are essential.
Lung cancer represents a significant health threat, making early detection imperative. Diseases affecting the chest and lungs rank among the most severe chronic conditions globally, often resulting from factors such as smoking, exposure to polluted air, bacterial infections, and genetic predispositions. These factors can damage the lungs and respiratory system, leading to serious long-term conditions like asthma, chest infections, and bronchitis, thereby compromising respiratory efficiency. Effective management and treatment strategies are vital for patients, as these conditions, while not always curable, can be significantly mitigated through appropriate interventions. In this research, various Convolutional Neural Network (CNN) architectures, including Inception-V3, ResNet101, Xception, and EfficientNet, were utilized to develop deep learning models for classifying chest diseases using chest CT images. We presented a lung image classification method based on the Contrast Limited Adaptive Histogram Equalization (CLAHE) algorithm and data augmentation techniques. The performance of these models was evaluated with and without the implementation of image enhancement techniques. The results of this study highlighted a decrease in the false positive rate (FPR) and an improvement in overall accuracy. Additionally, our models demonstrated superior performance compared to other existing methods.
Future work in this field may focus on enhancing the reliability of computer-assisted techniques for lung cancer diagnosis. There is also an opportunity to develop frameworks that prioritize CAD in emergency medical situations, potentially accelerating the treatment process. Furthermore, we propose expanding the application of these models to diagnose other conditions, such as liver diseases and kidney cancer. This expansion would not only assist healthcare professionals, caregivers, radiologists, and patients but also provide valuable insights for researchers involved in the diagnosis of various medical conditions. While the current methodology has shown promising results, there is still room for improvement in accuracy, which could be achieved by exploring diverse preprocessing techniques. The ongoing development of these models will continue to contribute significantly to the field of medical imaging and disease diagnosis.
Acknowledgement: The authors extend their appreciation to the Deanship of Scientific Research at Princess Nourah bint Abdulrahman University, through the Research Groups Program through the Grant number RGP-1444-0054.
Funding Statement: This work was funded by the Deanship of Scientific Research at Princess Nourah bint Abdulrahman University, through the Research Groups Program Grant number RGP-1444-0054.
Author Contributions: The authors confirm contribution to the paper as follows: study conception and design: Nahed Tawfik, Heba M. Emara; data collection: Walid El-Shafai; analysis and interpretation of results: Naglaa F. Soliman, Abeer D. Algarni, Fathi E. Abd El-Samie; draft manuscript preparation: Nahed Tawfik, Heba M. Emara, Walid El-Shafai. All authors reviewed the results and approved the final version of the manuscript.
Availability of Data and Materials: Data will be available from the corresponding author upon reasonable request.
Ethics Approval: Not applicable.
Conflicts of Interest: The authors declare that they have no conflicts of interest to report regarding the present study.
References
1. American Cancer Society. 2024. Accessed: Apr. 12, 2024. [Online]. Available: https://www.cancer.org/content/dam/cancer-org/research/cancer-facts-and-statistics/annual-cancer-facts-and-figures/2023/2023-cff-special-section-lung-cancer.pdf [Google Scholar]
2. H. Hosseini, R. Monsefi, and S. Shadroo, “Deep learning applications for lung cancer diagnosis: A systematic review,” Multimed. Tools Appl., vol. 3, no. 5, pp. 1–19, 2022. [Google Scholar]
3. R. L. Siegel, K. D. Miller, N. S. Wagle, and A. Jemal, “Cancer statistics, 2023,” CA: Cancer J. Clin., vol. 73, no. 1, pp. 17–48, Jan. 2023. doi: 10.3322/caac.21763. [Google Scholar] [PubMed] [CrossRef]
4. “Cancer Facts & Figures 2023 | American Cancer Society,” 2023. Accessed: Nov. 01, 2023. [Online]. Available: https://www.cancer.org/research/cancer-facts-statistics/all-cancer-facts-figures/2023-cancer-facts-figures.html [Google Scholar]
5. “Lung cancer causes | Lung cancer in non-smokers | American Cancer Society,” 2023. Accessed: Sep. 26, 2023. [Online]. Available: https://www.cancer.org/cancer/types/lung-cancer/causes-risks-prevention/what-causes.html [Google Scholar]
6. S. N. A. Shah and R. Parveen, “An extensive review on lung cancer diagnosis using machine learning techniques on radiological data: State-of-the-art and perspectives,” Arch. Comput. Methods Eng., vol. 30, pp. 4917–4930, 2023. doi: 10.1007/s11831-023-09964-3. [Google Scholar] [CrossRef]
7. M. A. Thanoon, M. A. Zulkifley, M. A. A. Mohd Zainuri, and S. R. Abdani, “A review of deep learning techniques for lung cancer screening and diagnosis based on CT images,” Diagnostics, vol. 13, no. 16, Aug. 2023, Art. no. 2617. doi: 10.3390/diagnostics13162617. [Google Scholar] [PubMed] [CrossRef]
8. A. A. Siddiqi, G. B. Narejo, M. Tariq, and A. Hashmi, “Investigation of histogram equalization filter for ct scan image enhancement,” Biomed. Eng., vol. 31, no. 5, Oct. 2019, Art. no. 1950038. doi: 10.4015/S1016237219500388. [Google Scholar] [CrossRef]
9. M. Humayun, R. Sujatha, S. N. Almuayqil, and N. Z. Jhanjhi, “A transfer learning approach with a convolutional neural network for the classification of lung carcinoma,” Healthcare, vol. 10, no. 6, pp. 1–15, 2022. doi: 10.3390/healthcare10061058. [Google Scholar] [PubMed] [CrossRef]
10. V. Srivastava and R. K. Purwar, “Classification of CT scan images of lungs using deep convolutional neural network with external shape-based features,” J. Digit. Imaging, vol. 33, no. 1, pp. 252–261, 2020. doi: 10.1007/s10278-019-00245-9. [Google Scholar] [PubMed] [CrossRef]
11. B. R. Pandit et al., “Deep learning neural network for lung cancer classification: Enhanced optimization function,” Multimed. Tools Appl., vol. 82, no. 5, pp. 6605–6624, Feb. 2023. doi: 10.1007/s11042-022-13566-9. [Google Scholar] [CrossRef]
12. S. Kim, B. Rim, S. Choi, A. Lee, and S. Min, “Deep learning in multi-class lung diseases” classification on chest X-ray images,” Diagnostics, vol. 12, no. 4, 2022, Art. no. 915. doi: 10.3390/diagnostics12040915. [Google Scholar] [PubMed] [CrossRef]
13. S. Nageswaran et al., “Lung cancer classification and prediction using machine learning and image processing,” BioMed Res. Int., vol. 2022, pp. 1–8, 2022. doi: 10.1155/2022/1755460. [Google Scholar] [PubMed] [CrossRef]
14. A. Masood et al., “Cloud-based automated clinical decision support system for detection and diagnosis of lung cancer in chest CT,” IEEE J. Transl. Eng. Health Med., vol. 8, pp. 1–13, 2020. doi: 10.1109/JTEHM.2019.2955458. [Google Scholar] [PubMed] [CrossRef]
15. O. Ozdemir, R. L. Russell, and A. A. Berlin, “A 3D probabilistic deep learning system for detection and diagnosis of lung cancer using low-dose CT scans,” IEEE Trans. Med. Imaging, vol. 39, no. 5, pp. 1419–1429, May 2020. doi: 10.1109/TMI.2019.2947595. [Google Scholar] [PubMed] [CrossRef]
16. G. Jakimovski and D. Davcev, “Using double convolution neural network for lung cancer stage detection,” Appl. Sci., vol. 9, no. 3, Jan. 2019, Art. no. 427. doi: 10.3390/APP9030427. [Google Scholar] [CrossRef]
17. T. I. A. Mohamed, O. N. Oyelade, and A. E. Ezugwu, “Automatic detection and classification of lung cancer CT scans based on deep learning and ebola optimization search algorithm,” PLoS One, vol. 18, no. 8, 2023, Art. no. e0285796. doi: 10.1371/journal.pone.0285796. [Google Scholar] [PubMed] [CrossRef]
18. S. B. Shuvo, “An automated end-to-end deep learning-based framework for lung cancer diagnosis by detecting and classifying the lung nodules,” Apr. 28, 2023, arXiv: 2305.00046. [Google Scholar]
19. V. Bishnoi, N. Goel, and A. Tayal, “Automated system-based classification of lung cancer using machine learning,” Int. J. Med. Eng. Inform., vol. 15, no. 5, pp. 403–415, 2023. doi: 10.1504/IJMEI.2023.133130. [Google Scholar] [CrossRef]
20. A. Bhandary et al., “Deep-learning framework to detect lung abnormality–A study with chest X-Ray and lung CT scan images,” Pattern Recognit. Lett., vol. 129, pp. 271–278, Jan. 2020. doi: 10.1016/j.patrec.2019.11.013. [Google Scholar] [CrossRef]
21. D. Paikaray, A. K. Mehta, and D. A. Khan, “Optimized convolutional neural network for the classification of lung cancer,” J. Supercomput., vol. 80, pp. 1973–1989, 2023. doi: 10.1007/s11227-023-05550-3. [Google Scholar] [CrossRef]
22. M. G. Lanjewar, K. G. Panchbhai, and P. Charanarur, “Lung cancer detection from CT scans using modified DenseNet with feature selection methods and ML classifiers,” Expert. Syst. Appl., vol. 224, pp. 957–4174, 2023. doi: 10.1016/j.eswa.2023.119961. [Google Scholar] [CrossRef]
23. E. D. Pisano et al., “Contrast limited adaptive histogram equalization image processing to improve the detection of simulated spiculations in dense mammograms,” J. Digit. Imaging, vol. 11, no. 4, pp. 193–200, 1998. doi: 10.1007/BF03178082. [Google Scholar] [PubMed] [CrossRef]
24. S. Hadiyoso, S. Aulia, and I. D. Irawati, “Diagnosis of lung and colon cancer based on clinical pathology images using convolutional neural network and CLAHE framework,” Int. J. Appl. Sci. Eng., vol. 20, no. 1, 2023. doi: 10.6703/IJASE.202303_20(1).006. [Google Scholar] [CrossRef]
25. H. Kumar Buddha, M. James Stephen, and P. Choppala, “OCR image enhancement & Implementation by using CLAHE algorithm,” Mukt. Shabd. J., vol. 9, pp. 3595–3599, 2020. Accessed: Nov. 09, 2023. [Online]. Available: https://www.researchgate.net/publication/342872425. [Google Scholar]
26. V. Stimper, S. Bauer, R. Ernstorfer, B. Schölkopf, and R. P. Xian, “Multidimensional contrast limited adaptive histogram equalization,” IEEE Access, vol. 7, pp. 165437–165447, 2019. doi: 10.1109/ACCESS.2019.2952899. [Google Scholar] [CrossRef]
27. F. Hussein et al., “Hybrid CLAHE-CNN deep neural networks for classifying lung diseases from X-ray acquisitions,” Electronics, vol. 11, no. 19, Oct. 2022, Art. no. 3075. doi: 10.3390/electronics11193075. [Google Scholar] [CrossRef]
28. A. Shamila Ebenezer, S. Deepa Kanmani, M. Sivakumar, and S. Jeba Priya, “Effect of image transformation on EfficientNet model for COVID-19 CT image classification,” Mater. Today: Proc., 2021. doi: 10.1016/j.matpr.2021.12.121. [Google Scholar] [PubMed] [CrossRef]
29. U. Kuran and E. C. Kuran, “Parameter selection for CLAHE using multi-objective cuckoo search algorithm for image contrast enhancement,” Intell. Syst. Appl., vol. 12, Nov. 2021, Art. no. 200051. doi: 10.1016/j.iswa.2021.200051. [Google Scholar] [CrossRef]
30. A. Fawzi, A. Achuthan, and B. Belaton, “Adaptive clip limit tile size histogram equalization for non-homogenized intensity images,” IEEE Access, vol. 9, pp. 164466–164492, 2021. doi: 10.1109/ACCESS.2021.3134170. [Google Scholar] [CrossRef]
31. J. Joseph, J. Sivaraman, R. Periyasamy, and V. R. Simi, “An objective method to identify optimum clip-limit and histogram specification of contrast limited adaptive histogram equalization for MR images,” Biocybern. Biomed. Eng., vol. 37, no. 3, pp. 489–497, 2017. doi: 10.1016/j.bbe.2016.11.006. [Google Scholar] [CrossRef]
32. S. Malasri, “Optimization using genetic algorithms,” in MAESC Conf., Memphis, TN, USA, 1999. Accessed: Nov. 09, 2023. [Online]. Available: https://www.researchgate.net/publication/283269696 [Google Scholar]
33. N. Tawfik, H. A. Elnemr, M. Fakhr, M. I. Dessouky, and F. E. Abd El-Samie, “Hybrid pixel-feature fusion system for multimodal medical images,” J. Ambient Intell. Hum. Comput., pp. 1–18, 2021. doi: 10.1007/s12652-020-02154-0. [Google Scholar] [CrossRef]
34. U. Sara, M. Akter, and M. S. Uddin, “Image quality assessment through FSIM, SSIM, MSE and PSNR—A comparative study,” J. Comput. Commun., vol. 7, no. 3, pp. 8–18, 2019. doi: 10.4236/jcc.2019.73002. [Google Scholar] [CrossRef]
35. D. Lewy and J. Mańdziuk, “An overview of mixing augmentation methods and augmentation strategies,” Artif. Intell. Rev., vol. 56, no. 3, pp. 2111–2169, Mar. 2023. doi: 10.1007/s10462-022-10227-z. [Google Scholar] [CrossRef]
36. D. Walawalkar, Z. Shen, Z. Liu, and M. Savvides, “Attentive CutMix: An enhanced data augmentation approach for deep learning based image classification,” 2020, arXiv: 2003.13048. [Google Scholar]
37. S. Yun, D. Han, S. J. Oh, S. Chun, J. Choe and Y. Yoo, “CutMix: Regularization strategy to train strong classifiers with localizable features,” in Proc. of the IEEE/CVF Int. Conf. on Comput. Vis., Osaka, Japan, May 2019, pp. 6023–6032. [Google Scholar]
38. “Chest CT-scan images dataset,” 2023. Accessed: Sep. 27, 2023. [Online]. Available: https://www.kaggle.com/datasets/mohamedhanyyy/chest-ctscan-images [Google Scholar]
39. H. Davis, S. Russell, E. Barriga, M. Abramoff, and P. Soliz, “Vision-based, real-time retinal image quality assessment,” in Proc. IEEE Symp. Comput. Based Med. Syst., Albuquerque, NM, USA, 2009. doi: 10.1109/CBMS.2009.5255437. [Google Scholar] [CrossRef]
40. B. D. Basaran, W. Zhang, M. Qiao, B. Kainz, P. M. Matthews, and W. Bai, “LesionMix: A lesion-level data augmentation method for medical image segmentation,” in Data Augmentation, Labelling, and Imperfections, 2014, pp. 73–83. doi: 10.1007/978-3-031-58171-7_8. [Google Scholar] [CrossRef]
41. M. M. Fahmy, “Confusion matrix in binary classification problems: A step-by-step tutorial,” J. Eng. Res., vol. 6, no. 5, 2022. doi: 10.21608/erjeng.2022.274526. [Google Scholar] [CrossRef]
42. I. Shafi et al., “An effective method for lung cancer diagnosis from CT scan using deep learning-based support vector network,” Cancers, vol. 14, no. 21, Nov. 2022. doi: 10.3390/cancers14215457. [Google Scholar] [PubMed] [CrossRef]
43. G. Kasinathan and S. Jayakumar, “Cloud-based lung tumor detection and stage classification using deep learning techniques,” BioMed Res. Int., vol. 2022, 2022, Art. no. 4185835. doi: 10.1155/2022/4185835. [Google Scholar] [PubMed] [CrossRef]
44. P. M. Shakeel, M. A. Burhanuddin, and M. I. Desa, “Automatic lung cancer detection from CT image using improved deep neural network and ensemble classifier,” Neural Comput. Appl., vol. 34, no. 12, pp. 9579–9592, Jun. 2022. doi: 10.1007/s00521-020-04842-6. [Google Scholar] [CrossRef]
45. R. Raza et al., “Lung-EffNet: Lung cancer classification using EfficientNet from CT-scan images,” Eng. Appl. Artif. Intell., vol. 126, Nov. 2023, Art. no. 106902. doi: 10.1016/j.engappai.2023.106902. [Google Scholar] [CrossRef]
46. I. Ahmed, A. Chehri, G. Jeon, and F. Piccialli, “Automated pulmonary nodule classification and detection using deep learning architectures,” IEEE/ACM Trans. Comput. Biol. Bioinform., vol. 20, no. 4, pp. 2445–2456, Jul. 2023. doi: 10.1109/TCBB.2022.3192139. [Google Scholar] [PubMed] [CrossRef]
47. P. Yadlapalli, D. Bhavana, and S. Gunnam, “Intelligent classification of lung malignancies using deep learning techniques,” Int. J. Intell. Comput. Cybern., vol. 15, no. 3, pp. 345–362, Jul. 2022. doi: 10.1108/IJICC-07-2021-0147. [Google Scholar] [CrossRef]
48. U. Prasad, S. Chakravarty, and G. Mahto, “Lung cancer detection and classification using deep neural network based on hybrid metaheuristic algorithm,” Soft Comput., 2023. doi: 10.1007/s00500-023-08845-y. [Google Scholar] [CrossRef]
49. C. J. Lin, S. Y. Jeng, and M. K. Chen, “Using 2D CNN with taguchi parametric optimization for lung cancer recognition from CT images,” Appl. Sci., vol. 10, no. 7, Apr. 2020, Art. no. 2591. doi: 10.3390/APP10072591. [Google Scholar] [CrossRef]
Cite This Article
 Copyright © 2024 The Author(s). Published by Tech Science Press.
This work is licensed under a Creative Commons Attribution 4.0 International License , which permits unrestricted use, distribution, and reproduction in any medium, provided the original work is properly cited.
 Downloads
 Citation Tools