
 Submit a Paper
 Propose a Special lssue
 Open Access
ARTICLE

A Joint Estimation Method of SOC and SOH for Lithium-ion Battery Considering Cyber-Attacks Based on GA-BP
1 Key Laboratory of Modern Power System Simulation and Control & Renewable Energy Technology, Ministry of Education, Northeast Electric Power University, Jilin, 132012, China
2 Department of Electrical Engineering, Northeast Electric Power University, Jilin, 132012, China
3 College of Information and Control Engineering, Jilin Institute of Chemical Technology, Jilin, 132022, China
4 Center for Research on Microgrids, Department of Energy, Aalborg University, Aalborg, 9220, Denmark
* Corresponding Author: Sen Tan. Email:
Computers, Materials & Continua 2024, 80(3), 4497-4512. https://doi.org/10.32604/cmc.2024.056061
Received 13 July 2024; Accepted 14 August 2024; Issue published 12 September 2024
 View Full Text
 Download PDF
Abstract
To improve the estimation accuracy of state of charge (SOC) and state of health (SOH) for lithium-ion batteries, in this paper, a joint estimation method of SOC and SOH at charging cut-off voltage based on genetic algorithm (GA) combined with back propagation (BP) neural network is proposed, the research addresses the issue of data manipulation resulting from cyber-attacks. Firstly, anomalous data stemming from cyber-attacks are identified and eliminated using the isolated forest algorithm, followed by data restoration. Secondly, the incremental capacity (IC) curve is derived from the restored data using the Kalman filtering algorithm, with the peak of the IC curve (ICP) and its corresponding voltage serving as the health factor (HF). Thirdly, the GA-BP neural network is applied to map the relationship between HF, constant current charging time, and SOH, facilitating the estimation of SOH based on HF. Finally, SOC estimation at the charging cut-off voltage is calculated by inputting the SOH estimation value into the trained model to determine the constant current charging time, and by updating the maximum available capacity. Experiments show that the root mean squared error of the joint estimation results does not exceed 1%, which proves that the proposed method can estimate the SOC and SOH accurately and stably even in the presence of false data injection attacks.Keywords
Characterized by low self-discharge and high output voltage, the lithium-ion battery is a green energy storage device, which is highly valued in many fields. To ensure optimal performance of vehicle power batteries, a battery management system (BMS) is configured [1].
Additionally, due to the continuous development of network technology, BMS has become a cyber-physical system whose safety directly impacts the vehicle’s driving status. However, this also means the BMS faces the threat of cyber-attacks [2,3]. Once the system is subjected to false data injection attacks (FDIAs) [4,5], the estimation accuracy of the battery’s SOC and SOH will be affected. Hence, detecting and repairing FDIAs is significant for accurately estimating SOC and SOH. In Reference [6], Gallo et al. propose a distributed monitoring approach to detect false data, but it has low sensitivity and slow detection speed. In Reference [7], an FDIAs detection approach that combines model predictive control and artificial neural networks is proposed, but this method is prone to localized convergence during online identification. The isolated forest algorithm can detect anomalous data quickly and is well suited to deal with large-scale datasets, so this algorithm is used to detect and remove FDIAs widely [8].
The common methods for estimating SOC include the ampere-hour integration method, the open circuit voltage method (OCV), the filtering method, and the data-driven method. Among these, the ampere-hour integration method is simple in principle and computationally efficient, but it is susceptible to interference, and has high initial value requirements [9]. The OCV method requires long-term static processing of the battery and is inadequate for online applications [10]. The filtering method is generally combined with the equivalent circuit model (ECM) of the battery [11], offering strong self-correction ability as well as high accuracy, but the parameter calculation of ECM is cumbersome. Unlike methods relying on the intrinsic mechanism of the battery, the data-driven method employs a machine learning model to construct a SOC estimation model using extensive training data [12]. This method is easy to implement and offers high prediction accuracy, but it demands substantial computational resources and training data. The continuous rise of big data offers effective solutions to the aforementioned challenges.
Currently, the main SOH estimation methods include direct measurement method, empirical recession models method, and data-driven method. The direct measurement method assesses the parameters directly impacting battery life and constructs a function mapping to determine the SOH. While its principle is straightforward, its practical application is constrained by demanding accuracy requirements and computational complexity [13]. The empirical recession model utilizes functions to align with the battery’s capacity decline trend [14], it demonstrates strong robustness but faces challenges in adapting to diverse capacity decay trends due to individual variations. The data-driven method reduces the process of physical modeling and parameter identification. Its accuracy largely hinges on the selection of HF and algorithms [15].
From the concept of SOC and SOH, it is evident that the common parameter between them is the current maximum available capacity, which decreases with an increased number of cycles, Therefore, conducting a joint estimation of SOC and SOH is essential. In Reference [16], Yin et al. propose a joint estimation method of SOC and SOH using the particle filtering algorithm. Li et al. [17] employ a combination of gate recurrent units and convolutional neural networks to estimate both parameters. However, the accuracy of filtering methods is influenced by model accuracy, and the deep learning method has high requirements on training data and hardware equipment, posing challenges for rapid updates of SOC and SOH. GA-BP neural network can effectively avoid the above problems, with high prediction accuracy and strong generalization ability, so it is used to construct the estimation model widely. Considering that the critical point of constant current charging and constant voltage charging is the charging cut-off voltage, and the SOC value is already at a very high level during constant voltage charging, the battery’s capacity decline becomes more pronounced with the growth of charging time. Therefore, this paper investigates the joint estimation of SOC and SOH specifically at the charging cut-off voltage.
From the above introduction, it can be seen that the isolated forest algorithm can detect and eliminate FDIAs quickly, and the data-driven method has a good potential for application in the field of lithium-ion battery state estimation. Therefore, in this paper, the isolated forest algorithm is used to detect the abnormal data, after which the GA-BP neural network is used to build the estimation model. By combining the global search ability of GA and the nonlinear fitting ability of BP neural network, the neural network model can be effectively optimized to improve the accuracy and generalization ability of prediction. Experimental validation demonstrates that this method can estimate the SOC and SOH accurately and stably even in the presence of cyber-attacks.
SOC is defined as the ratio of the battery’s current capacity to maximum available capacity, the SOC is calculated at charging cut-off voltage in the paper. The SOH is defined as the ratio of the current maximum available capacity to the rated capacity. The formulas are as follows:
where: I represents the current value of constant current charging; T is the constant current charging time; Cm is the current maximum available capacity; Co indicates the rated capacity.
To validate the method proposed in this paper, the dataset comprises normal data points and anomalies. The normal points include data from the following lithium-ion battery datasets, while anomalies consist of artificially altered data aimed at simulating the FDIAs.
Eight batteries from the Oxford University battery dataset are selected as experimental data [18], these batteries are experimented at 40°C, with a rated capacity of 740 mA·h and a nominal voltage of 4.2 V. The experimental procedure is as follows: firstly, charge at a constant current of 1.48 A; secondly, discharge under simulated urban driving dynamic conditions; finally, repeat the above steps, and every 100 cycles, discharge occurs at a constant current until the voltage reaches 2.7 V. Fig. 1 depicts the SOH change curves of these eight batteries post-simulated cyber-attack.
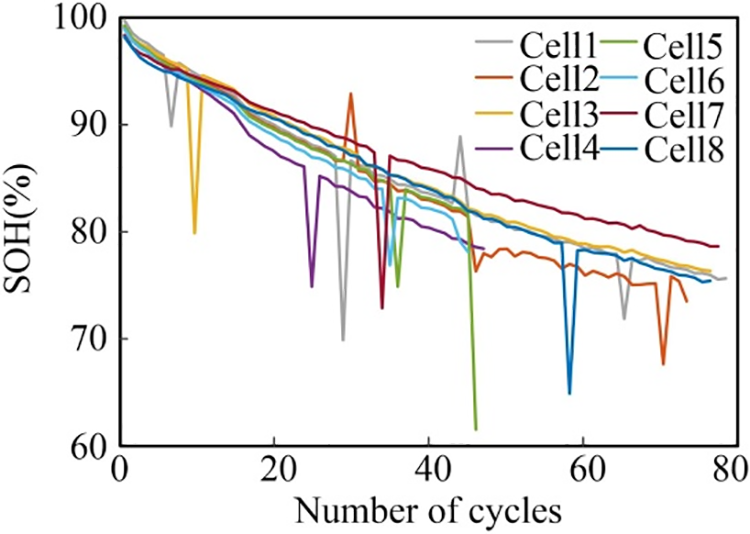
Figure 1: SOH curves for simulated cyber-attacks on the Oxford University battery dataset
As shown in Fig. 1, each battery exhibits significant variability in SOH change curves, but all of them have a tendency to decrease SOH with an increased number of cycles. Additionally, the curves display abnormal fluctuations attributed to the cyber-attack.
Four batteries from the Center for Advanced Life Cycle Engineering (CALCE) of Maryland University battery dataset were selected as experimental data [19]. These batteries are rated at 1.1 A·h and are experimented at an ambient temperature of 1°C. The aging experimental process adopts a constant current charging plus constant voltage charging mode. In this mode, the charging stage was conducted at a constant current of 0.5 C with a charging cut-off voltage set to 4.2 V, and the charging was terminated when the current decreased to 0.05 A; the discharging stage was carried out at a constant current of 1C until the voltage dropped to 2.7 V, and then the aforementioned steps were repeated. The SOH change curves for batteries CS2_35, CS2_36, CS2_37, and CS2_38 after the simulated cyber-attack are depicted in Fig. 2.
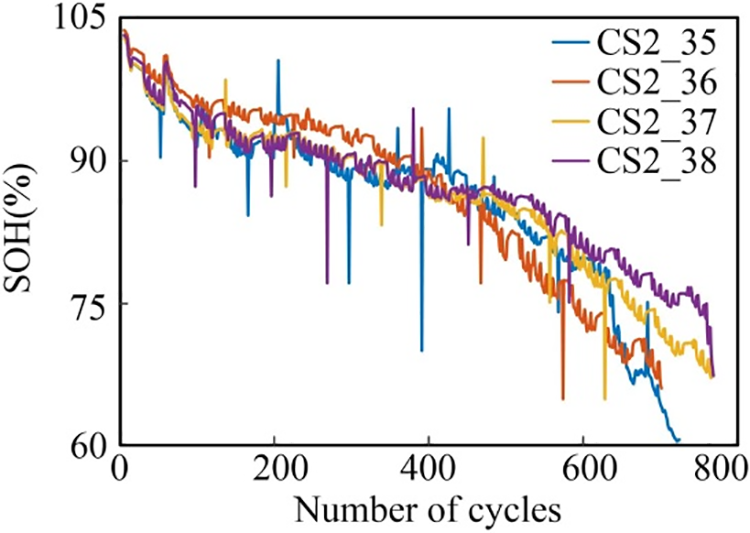
Figure 2: SOH curves for simulated cyber-attacks on the CALCE battery dataset
2.3 Detection and Interpolation of Abnormal Data
In this paper, the isolated forest algorithm is employed for monitoring and removing anomalous data. The isolated forest algorithm is an unsupervised method for detecting anomalous data, its main idea is to map data into a binary tree structure through constantly randomized divisions and assess the isolation degree of each data based on its path length within the tree [20]. The steps for detecting anomalous data based on isolated forest algorithm are outlined below:
(1) Import the sample dataset;
(2) Select a factor and threshold randomly from the dataset for binary fission;
(3) Repeat Step 2 until the tree reaches the specified height;
(4) Calculate the length of the path from the sample data point to the root node;
(5) Assess outliers based on the anomaly evaluation coefficients of the data points as follows:
where: n represents the total number of samples in the dataset; c(n) denotes the average path length of the binary tree; h(x) indicates the path length of the tested sample in a binary tree; E[h(x)] represents the average path length of the tested sample across all binary trees. If S(x,n) tends to approach 1, there is a higher probability of it being an anomaly; if all S(x,n) is less than or distributed around 0.5, the data is confirmed to be normal.
As abnormal data are excluded from the dataset, the measurement data of this node are missing, considering that the state estimation of lithium-ion battery is a time series problem, it is necessary to supplement the missing data. This paper employs the polynomial interpolation method to supplement the excluded anomalies. The method aims to make the sum of squares of the errors (I) between the fitted function and the actual curves corresponding to each point (ti, yi) (i = 0, 1, 2,…, n) reach a minimum value. The formula is as follows:
where: j = 0, 1, 2, …, n, the optimal fitted curve is derived by solving a0, a1, a2, …, an.
Health factor extraction is performed on the data following abnormal data repair, and the extracted HF should have a high correlation with variables, be easy to extract, and conform to practical applications. Battery charging and discharging curves change significantly with an aging degree, in the actual situation, the battery is strongly affected by the random load discharge during the discharging process. Conversely, charging processes are stable, resulting in smoother voltage curves conducive to HF extraction. Consequently, this study employs incremental capacity analysis (ICA) [21] to numerically differentiate the charging curves and approximate corresponding dQ/dV curves, the calculation formula is shown in Eq. (5). This method can better reflect the changes in the charging voltage curve caused by the aging.
where: Q is the capacity; L is the differential step; V is the voltage; k is the sampling moment.
Due to the low accuracy of current voltage and current sensors, causing the problem of noise interference when calculating the difference between capacity and voltage, the Kalman filter (KF) algorithm is used for smoothing [22]. One of the battery Cell1 IC curves is shown in Fig. 3.
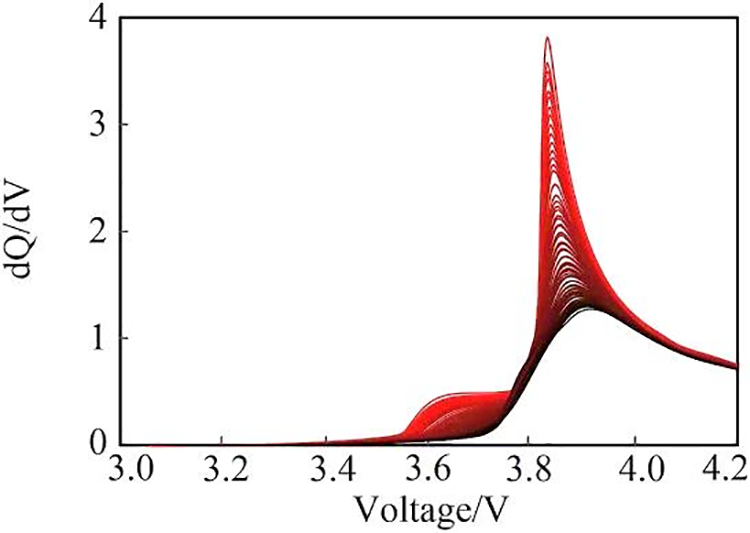
Figure 3: IC curves of the Cell1 under full cycles
As shown in Fig. 3, the curve from bright to dark in the graph indicates the more serious the aging of the battery is, the lower the ICP value will be, and the higher the voltage corresponding to ICP (Up) will be. It can be seen that ICP and Up have a good correlation with the SOH.
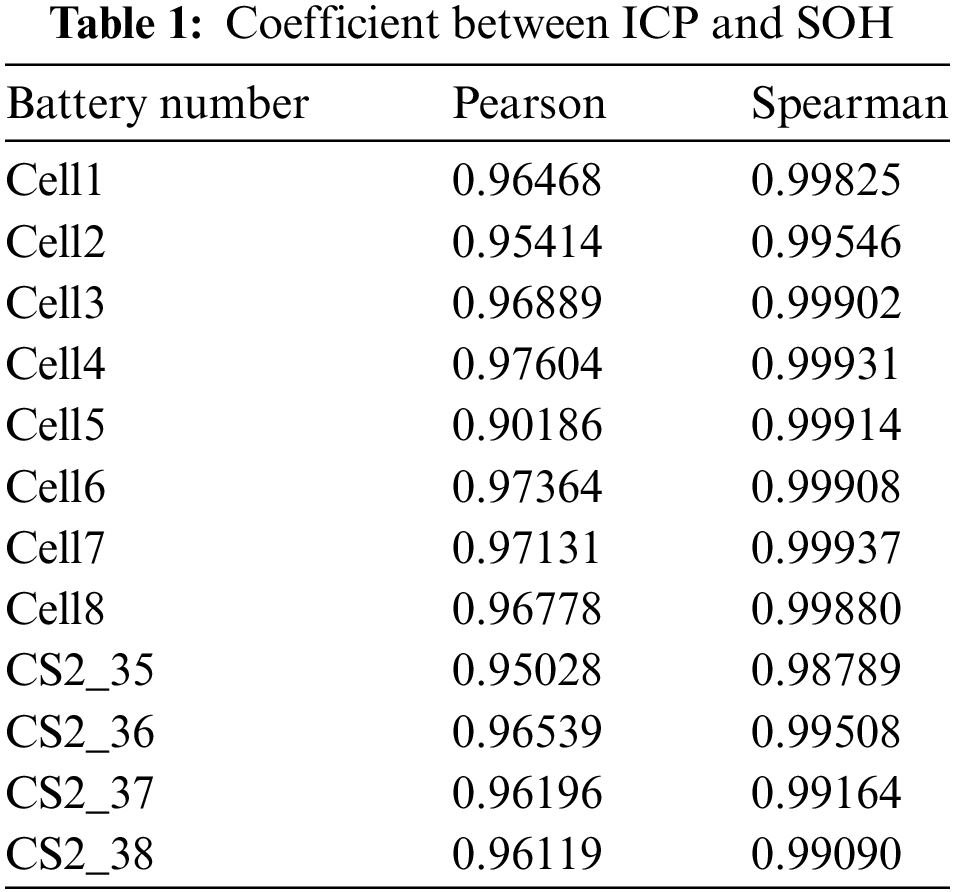
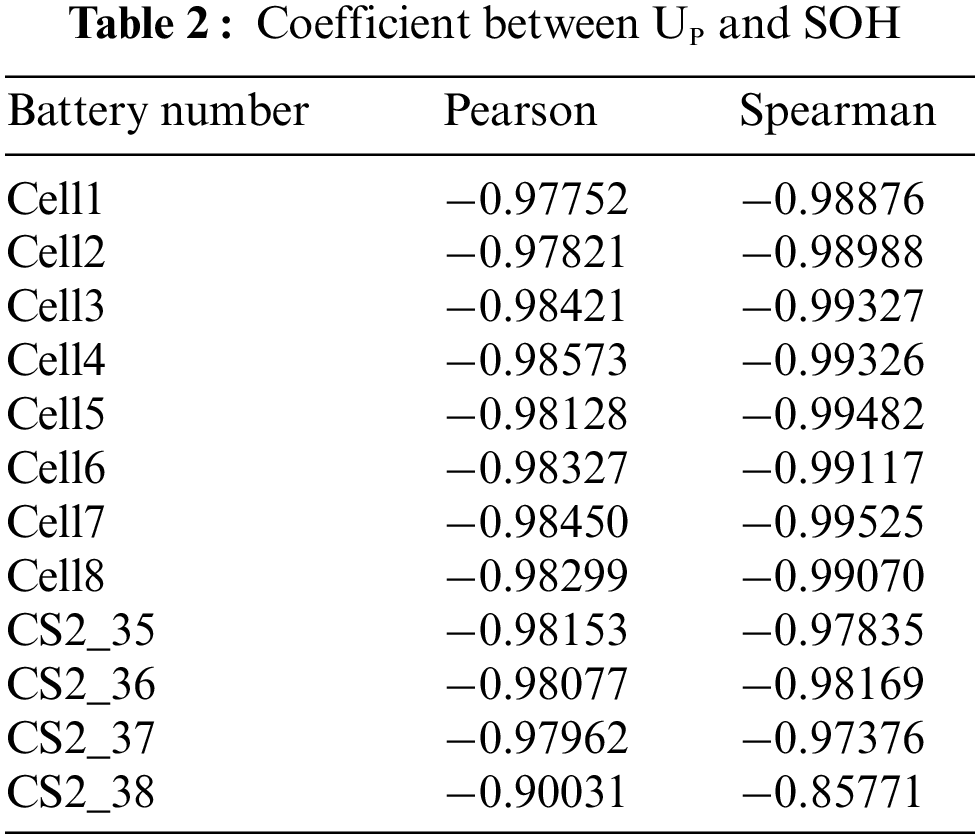
To quantify the correlation between ICP and SOH, Up and SOH, this section evaluates them using Pearson and Spearman correlation coefficients expressed as:
where: X is the health factor; Y is SOH; xi and yi are sample data, respectively.
The correlation between two variables can be measured by Pearson and Spearman correlation coefficients. A higher absolute value indicates a stronger correlation between two variables. If the absolute value is 1, the variables are perfectly correlated. Tables 1 and 2 present the Pearson and Spearman correlation coefficients for ICP with SOH and Up with SOH, respectively. It can be seen that the correlation coefficients for each battery almost all exceed 0.95, indicating a strong correlation between the selected HFs and SOH.
3 Joint Estimation of SOC and SOH
The structure of the BP neural network is depicted in Fig. 4 [23]. BP neural network comprises a three-layer structure consisting of input, hidden, and output layers. Neurons are present in each layer, with thresholds on them, and neurons in each layer are connected by weights. The process of neural network training can be described as follows: a sample is brought into the network model and transmitted to the neurons of the input layer, then it is processed sequentially through the hidden and output layers to produce the final output. This process known as forward propagation involves continuous layer-by-layer advancement and modification of the weights. If discrepancies occur between the output result and the actual value, an error is propagated in the reverse direction, similar to the forward propagation process. These steps are repeated until the error is minimized, ensuring sample outputs fall within acceptable error limits.
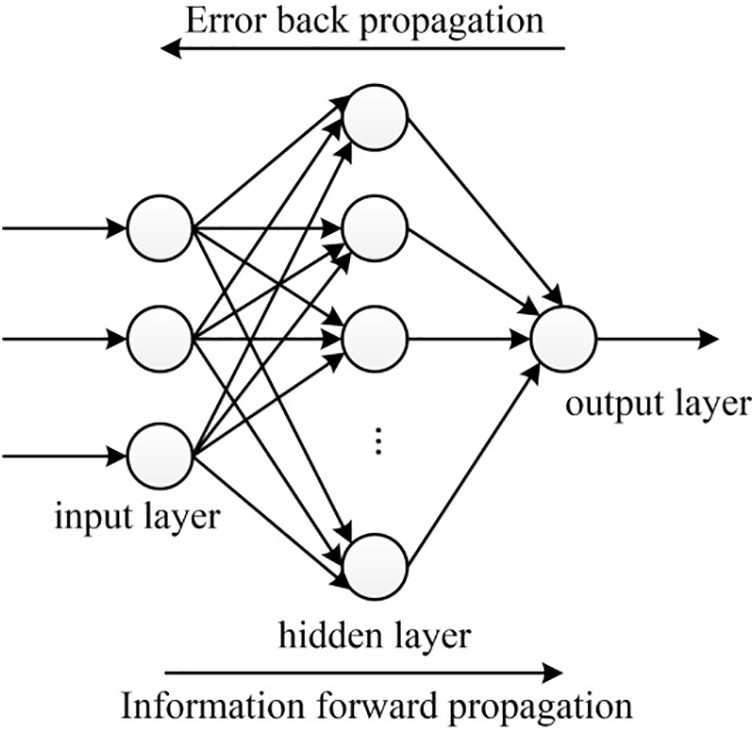
Figure 4: The BP neural network structure
To summarize, the process of training a BP neural network involves iteratively adjusting weights and thresholds to minimize errors. The weight update formula is as follows:
where: η is the learning rate; ω is the weight; E is the error.
Define the input information as S = (s1, s2, s3, …, sn)T, the output information as C = (c1, c2, c3, …, cm)T, the input layer has n nodes, the hidden layer has h nodes, and the output layer has m nodes. The output expressions of the hidden layer and the output layer are as follows:
where: Pj represents the output of the hidden layer, xi denotes the output of the input layer, αij signifies the weight between the input and hidden layers, Of donates the output of the output layer, βjf donates the weight between the hidden and output layers, and g denotes the activation function.
The BP neural network exhibits some randomness in selecting initial weights and thresholds, potentially reducing the estimation accuracy. Therefore, this paper combines the GA with BP neural network, which can effectively overcome the shortcomings of the respective algorithms, such as slow convergence, falling into the local minima, high time cost, and so on. Thus, the neural network model can be optimized to improve the accuracy and training speed of regression prediction [24]. The flowchart of the GA-BP neural network is depicted in Fig. 5.
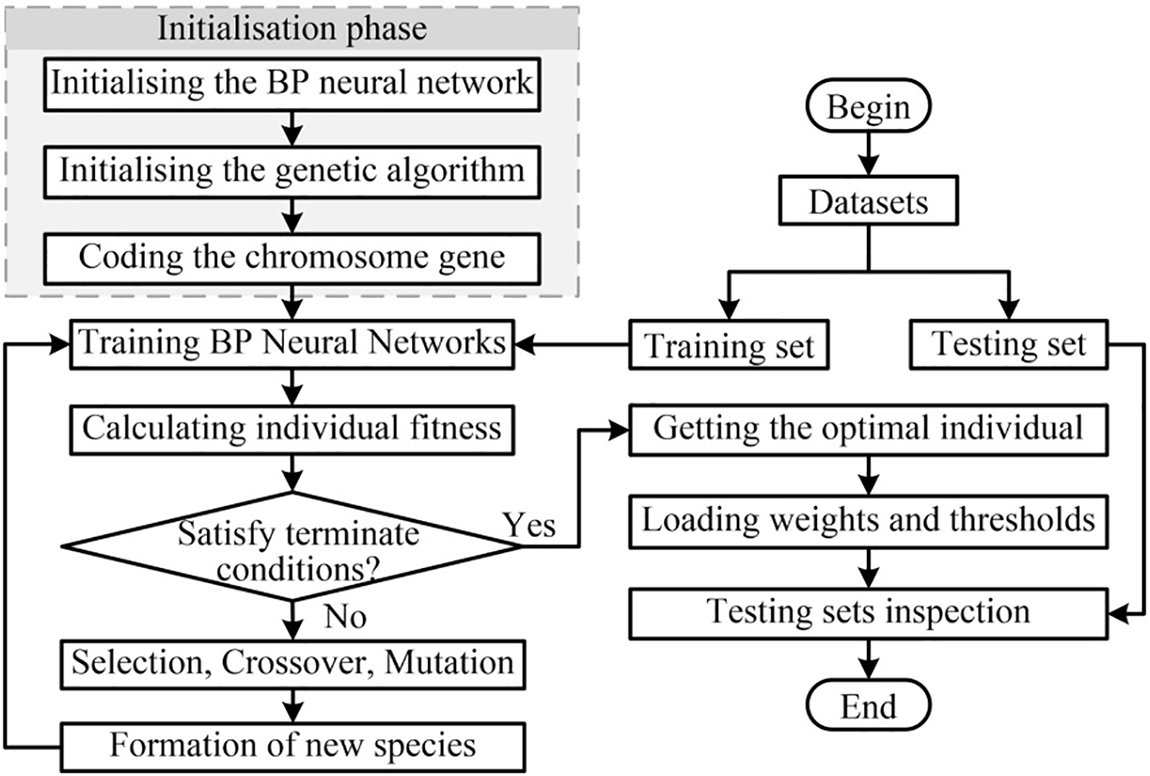
Figure 5: Flowchart of the GA-BP neural network algorithm
The implementation process of the GA-BP neural network is described as follows: firstly, delineate the training set and testing set. Secondly, initialize the BP neural network determine its parameters, and then initialize the parameters of the genetic algorithm, including the initial population size and the maximum number of genetic generations. Thirdly, encode the chromosomes gene. Subsequently, train the BP neural network using the training set, calculate individual fitness, and evaluate whether termination conditions are satisfied; if not, carry out the next operations with selection, crossover, and mutation to update the genetic coding of the population and then return to the step of training BP neural network to repeat the above process until the termination conditions are met. Finally, assign the optimal chromosome coding to the initial weights and thresholds of the BP neural network, train the BP neural network using the optimized weights and thresholds, and verify its performance with the testing set.
3.3 Joint Estimation of SOC and SOH Based on GA-BP Neural Network
The joint estimation based on the GA-BP neural network is illustrated in Fig. 6.

Figure 6: Flowchart of the joint estimation of the SOC and the SOH
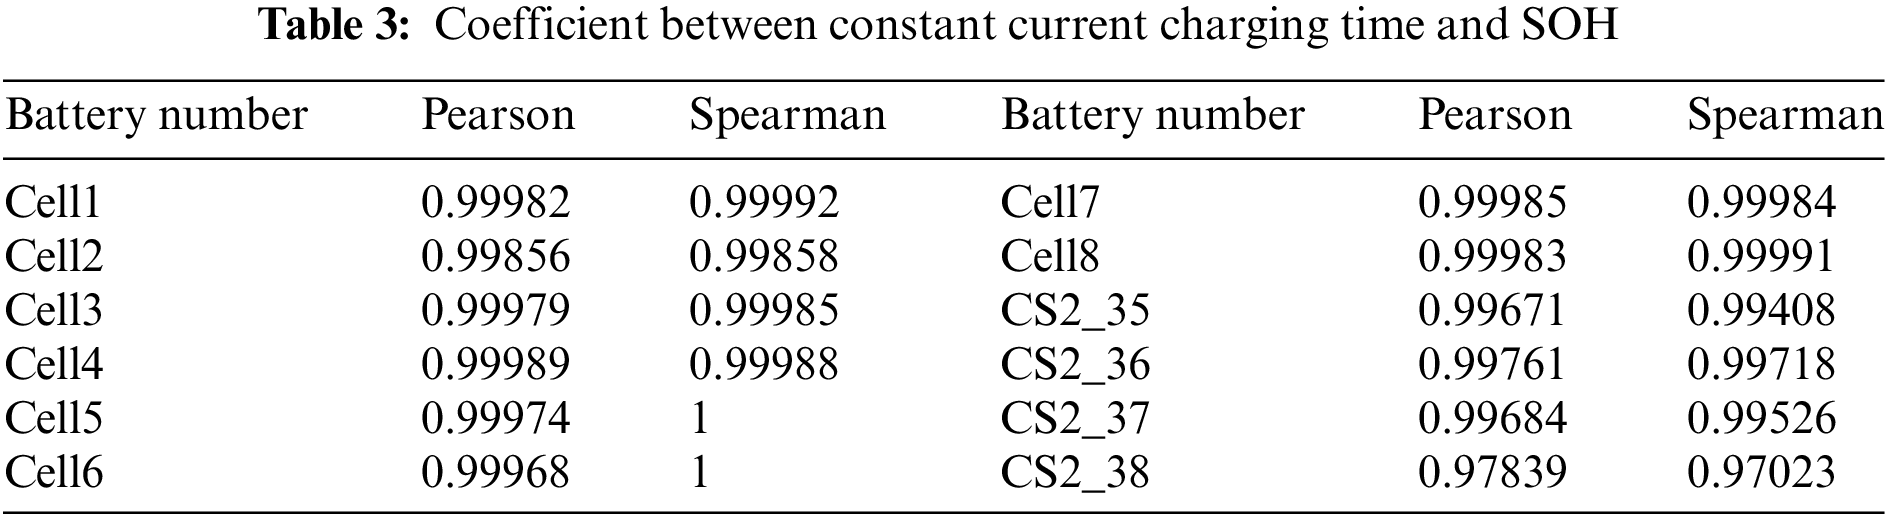
The joint estimation of SOC and SOH of lithium-ion batteries based on the GA-BP neural network is divided into two phases: offline training and online testing. The offline phase primarily involves training the GA-BP neural network. Initially, anomalous data in the training set are repaired. Subsequently, the KF algorithm is applied to extract smooth IC curves, with ICP and Up serving as the health factors. Two BP neural networks are used to establish Model 1 and Model 2, respectively, where HF is the input and SOH is the output, which are brought into Model 1 for training; SOH is the input and constant current charging time is the output for Model 2 training. Theoretically, the constant current charging time can be measured online. Considering that electric vehicle users have a certain randomness during the startup charging phase, which makes it difficult to measure. Therefore, it is necessary to obtain the constant current charging time by constructing Model 2. Table 3 presents Pearson and Spearman correlation coefficients demonstrating a strong correlation, with coefficients exceeding 0.99 across all cells, underscoring the robust relationship between constant current charging time and SOH.
The online process focuses on estimating SOH and real-time correcting the SOC value at the charging cut-off voltage. Firstly, repairing abnormal data in the testing set, extracting health factors, and inputting them into trained Model 1 to obtain the SOH estimation value; secondly, the SOH estimation value is brought into the trained Model 2 to obtain the predicted value of the constant current charging time, and update the current maximum available capacity according to the SOH estimation value; finally, calculating the SOC estimation value under the charging cut-off voltage according to Eq. (1). In summary, the proposed method realizes the multi-step mapping from HF to the SOC estimation value, completing the joint estimation of SOC and SOH.
The GA-BP neural networks designed in this paper all adopt a 3-layer structure. Model 1 has 2 nodes and Model 2 has 1 node in the input layer; they all have 8 nodes in the hidden layer, and 1 node in the output layer. The maximum number of genetic generations is set to 100, the number of populations is 30, and the fitness function is the error of the BP neural network. Other designs of the GA-BP neural network are detailed below:
(1) Data preprocessing. A normalization method is used to preprocess the data before experimenting, the expressions for normalization and inverse normalization are as follows:
where: x is the sample data value, xmax is the largest data value and xmin is the smallest data value.
(2) Selection of loss function. The model employs the mean square error (MSE) function as its loss function, expressed as follows:
where: yk and
(3) Parameter optimizer selection. Adam is employed as the parameter optimization algorithm for the model. The initial learning rate is set to 0.001 and the number of iterations for training is set to 500.
4 Experimental Results and Analysis
To validate the feasibility and accuracy of the paper’s method, this section performs the joint estimation of SOC and SOH based on the aforementioned battery datasets. Evaluation metrics, namely root mean squared error (RMSE), mean absolute error (MAE), and maximum error (MAX), are employed to assess performance. These metrics are calculated as follows:
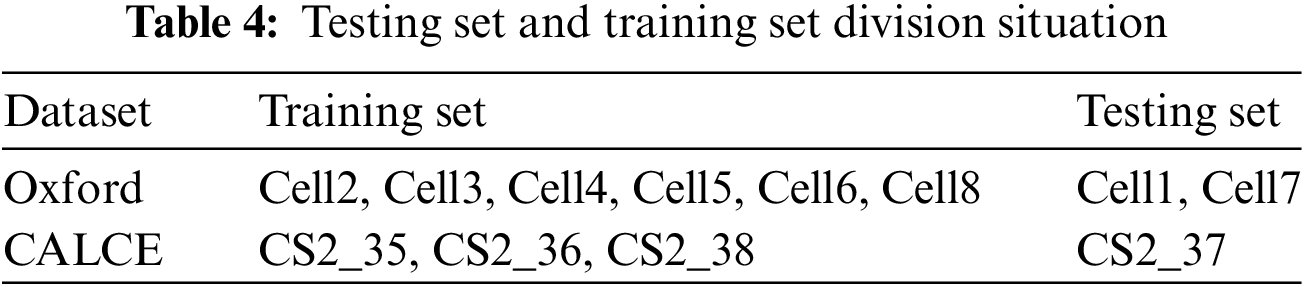
The battery state estimation model is required to maintain independence between training and testing datasets. The division results are summarized in Table 4.
This section aims to demonstrate the superiority of the GA-BP neural network in estimating the SOH of lithium-ion batteries. The SOH estimation model based on the BP neural network is trained and tested using the Oxford and CALCE battery datasets, and the estimation results are compared with those obtained using the method proposed in this paper. Figs. 7 to 9 illustrate the SOH estimation curves and error curves for Cell1, Cell7, and CS2_37, respectively.
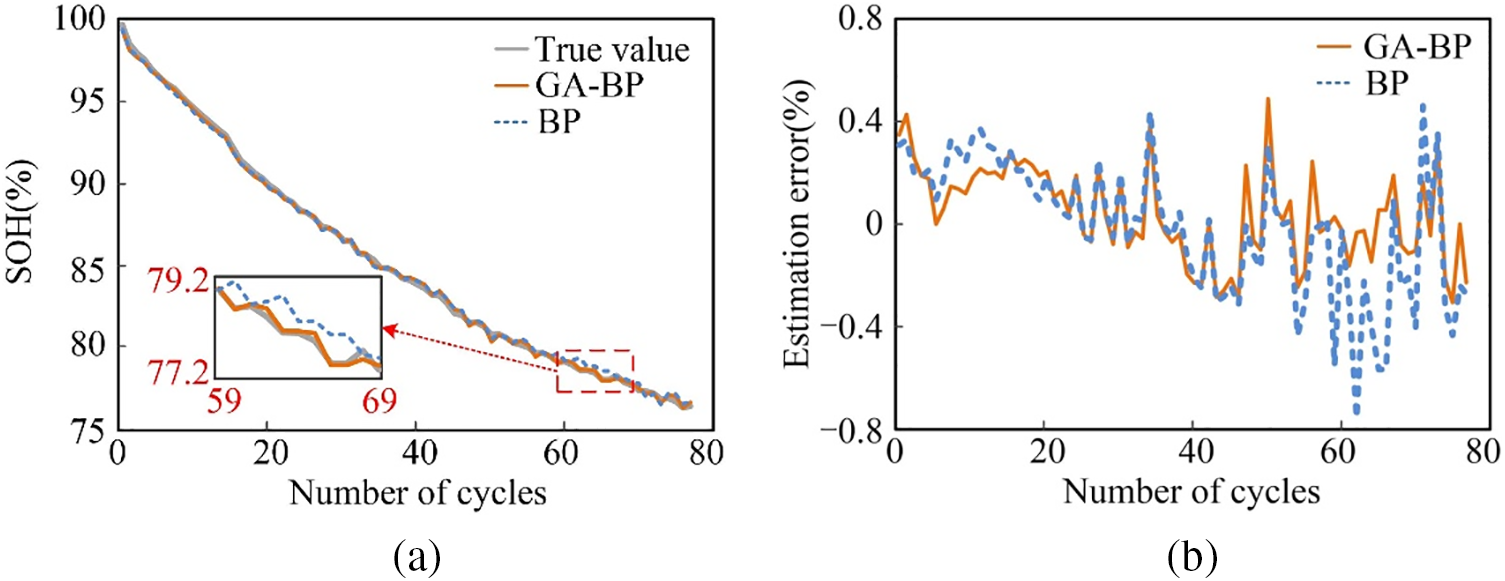
Figure 7: The SOH estimation results of Cell1. (a) SOH. (b) Estimation error curve

Figure 8: The SOH estimation results of Cell7. (a) SOH. (b) Estimation error curve

Figure 9: The SOH estimation results of CS2_37. (a) SOH. (b) Estimation error curve
Evaluation of the Oxford battery dataset (Figs. 7 and 8) reveals that both methods exhibit accurate SOH estimation curves. The BP neural network achieves an estimation error typically within ±0.6%, whereas the GA-BP neural network achieves an error typically within ±0.4%, with a maximum of ±0.5%. This demonstrates superior SOH estimation accuracy with the GA-BP approach. Analysis of Table 5 indicates that this paper’s algorithm achieves RMSE and MAE values within 0.3% and the MAX value not exceeding 0.7%, demonstrating relatively small errors. It shows that the HF selected in this paper can not only reveal the aging information of the battery well but also effectively deal with the capacity decline changes due to battery inconsistency. Furthermore, it underscores the GA-BP neural network’s robust mapping capability for precise SOH estimation of lithium-ion batteries.
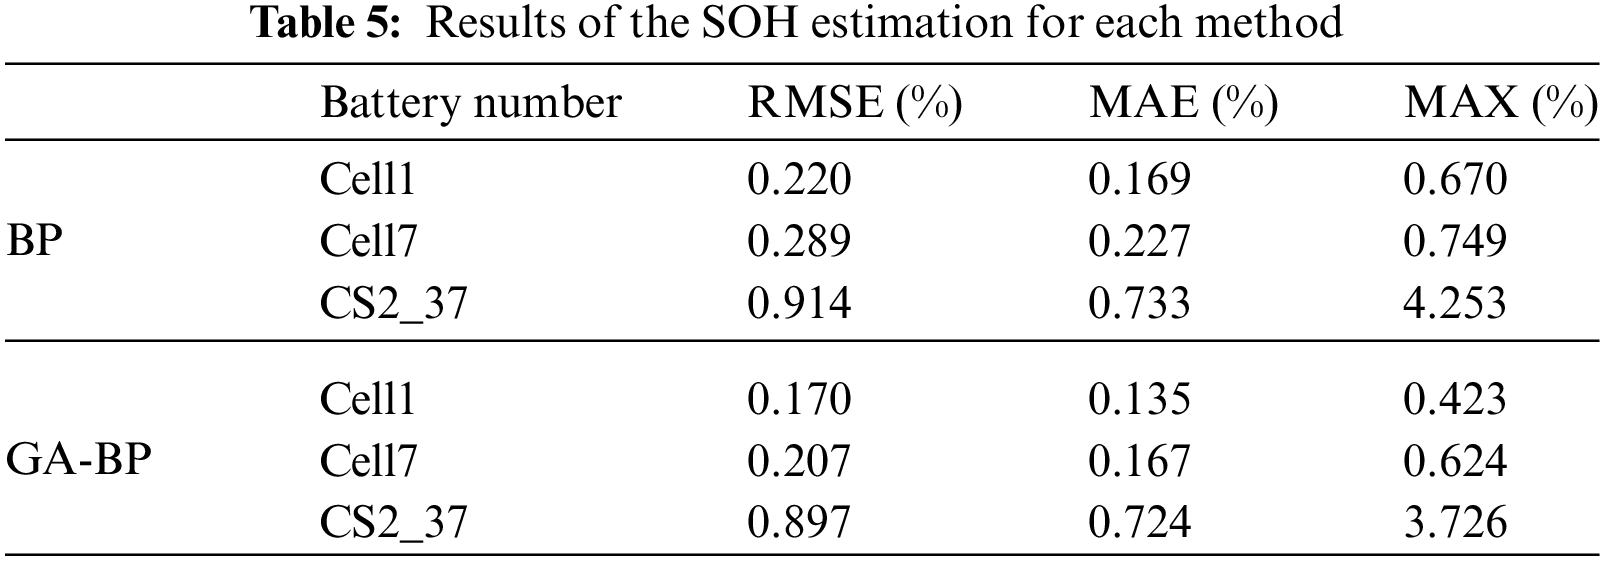
Evaluation of the CALCE dataset in Fig. 9 reveals superior accuracy and better followability of the GA-BP neural network compared to the BP neural network algorithm. Additionally, as shown in Table 5, both MAE and RMSE are maintained below 1%, and the MAX not exceeding 4%, which indicates the stable and reliable SOH estimation by the GA-BP neural network algorithm. These findings show that the proposed method has good generalizability and can be applied to SOH estimation for a variety of lithium-ion batteries.
Based on the accurate and reliable estimation of SOH, the joint SOC and SOH estimation is conducted. Figs. 10 to 12 depict the SOC estimation results using both methods on the testing data. Specifically, the SOC estimation curves and error curves are shown for cells Cell1, Cell7, and CS2_37, respectively. Table 6 presents the MAE, RMSE, and MAX values obtained by both algorithms.
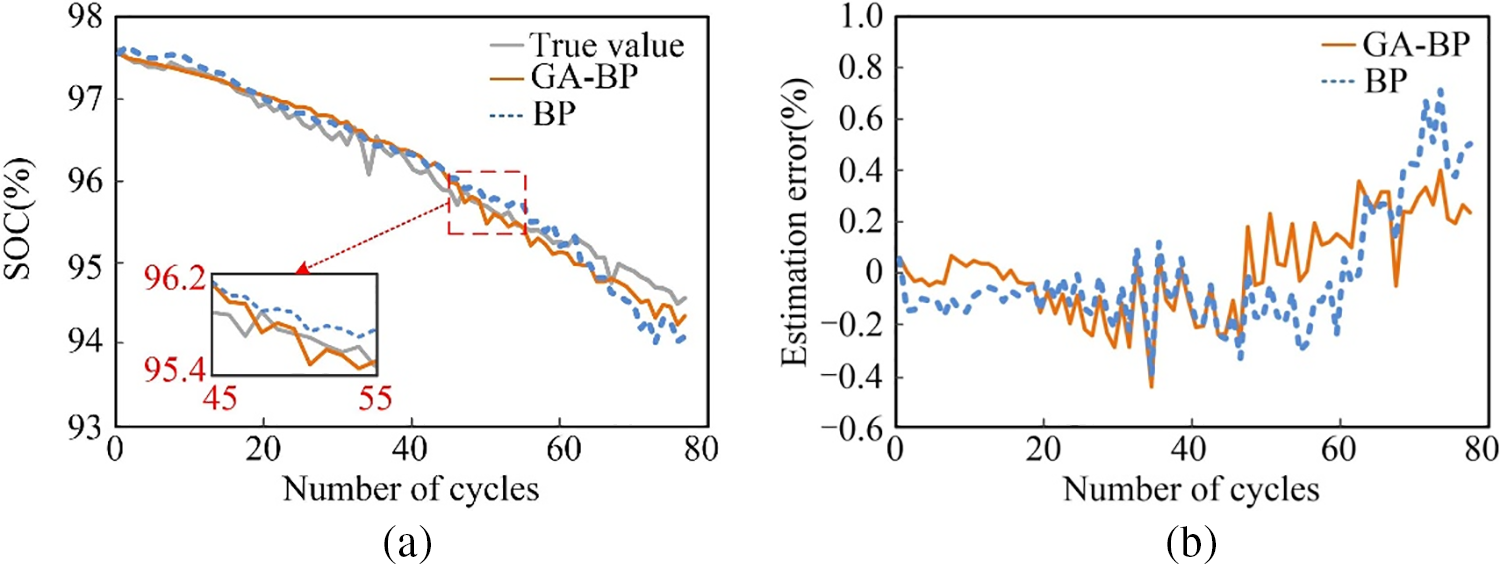
Figure 10: The SOC estimation results of Cell1. (a) SOC. (b) Estimation error curve
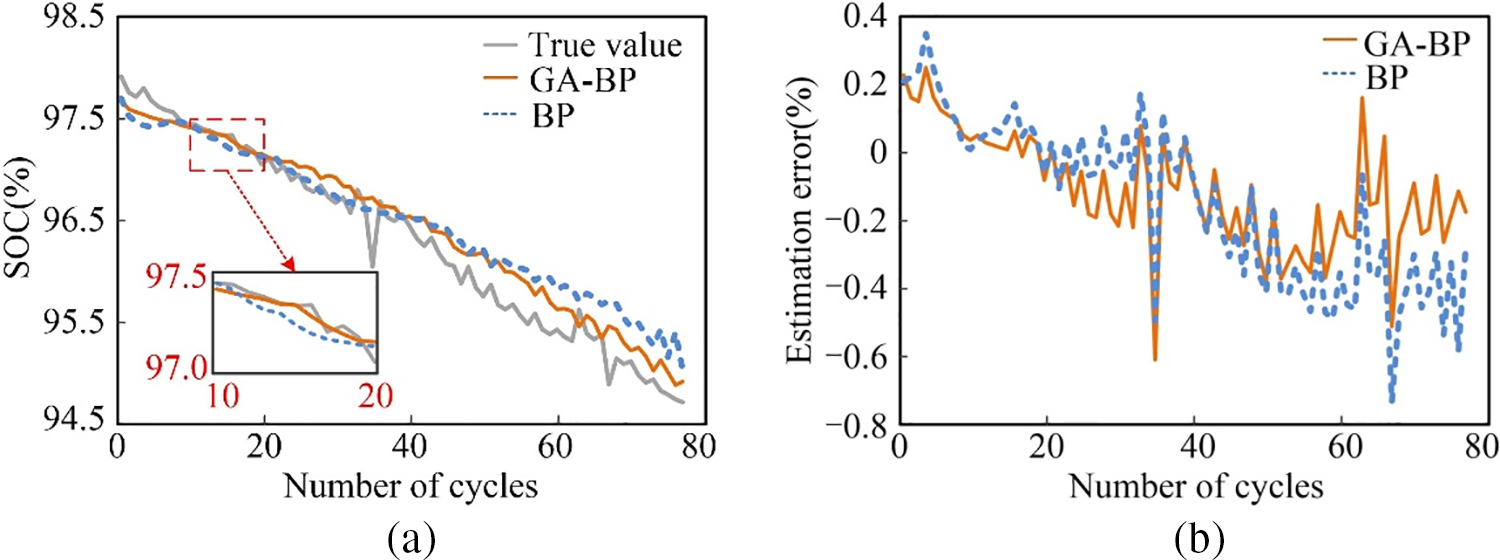
Figure 11: The SOC estimation results of Cell7. (a) SOC. (b) Estimation error curve
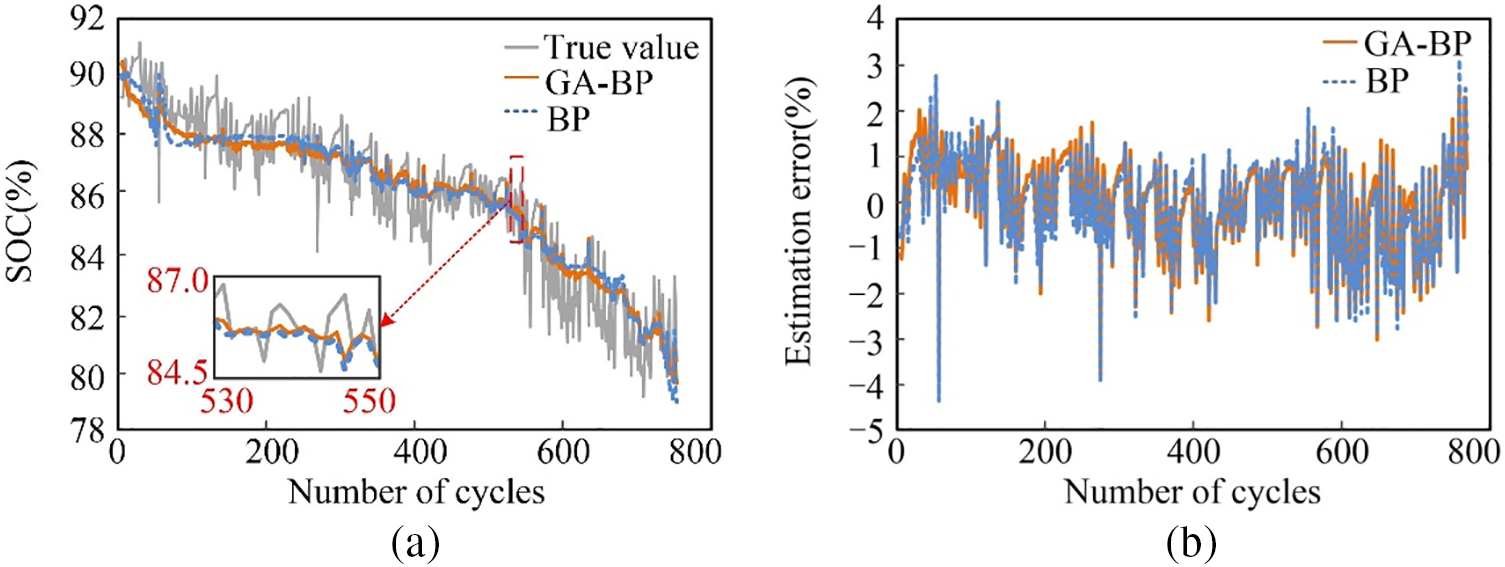
Figure 12: The SOC estimation results of CS2_37. (a) SOC. (b) Estimation error curve
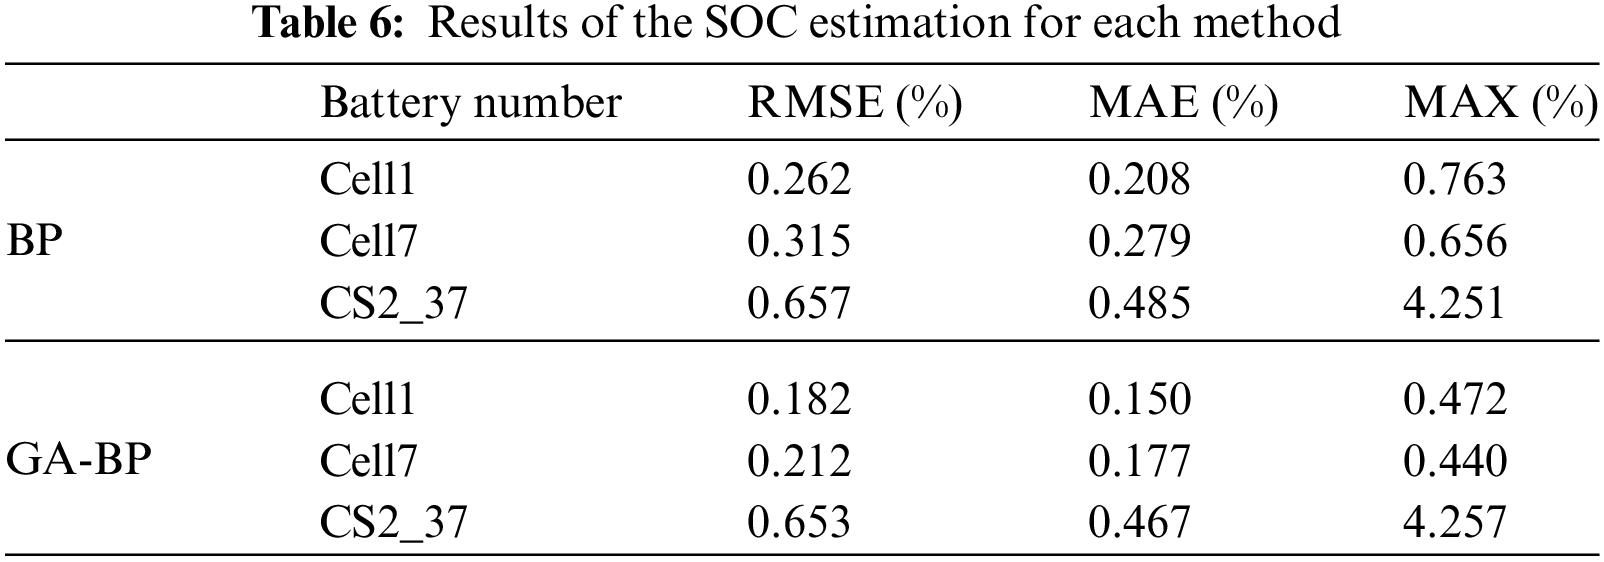
Figs. 10 and 11 depict the estimation results of both methods based on the Oxford battery dataset. The estimation curve of this paper’s method demonstrates superior performance, with errors typically within ±0.4% and the maximum not exceeding ±0.6%. Analysis of Table 6 reveals that the MAE and RMSE obtained by this paper’s method are smaller compared to those derived from the BP neural network, with MAE and RMSE typically restricted to 0.3%, and the MAX not exceeding 0.5%, reflecting the advantages of this paper’s method in estimating SOC and underscoring the GA-BP neural network’s robust mapping capability.
Examination of the SOC estimation results from the CALCE dataset in Fig. 12 shows that although the SOC fluctuation of battery CS2_37 at the charging cut-off voltage is drastic, the paper’s method effectively tracks the true values. Analysis of Table 6 indicates that errors are maintained at a low level, with MAE and RMSE restricted to 0.7%, and the MAX not exceeding 5%, demonstrating superior performance. These findings reveal that the paper’s method achieves high accuracy and broad applicability, facilitating real-time correction of SOC under the corresponding charging cut-off voltage of different types of lithium-ion batteries.
In this paper, a joint estimation method of SOC and SOH for lithium-ion batteries at charging cut-off voltage based on GA-BP neural network is proposed, this method addresses data tampering due to cyber-attacks on BMS. Firstly, FDIAs are detected and eliminated using the isolated forest algorithm, and then normal battery data can be reconstructed through polynomial interpolation method to supplement the eliminated data; secondly, the smooth IC curve is extracted using the KF algorithm from the repaired data, with ICP and Up are taken as the HF; thirdly, mapping relationships between HF and SOH as well as between SOH and constant current charging time are established using the GA-BP neural network, facilitating the estimation of SOH through bringing HF into the trained model; finally, the SOH estimation value is used to determine constant current charging time, update the maximum available capacity, and compute SOC estimation, thereby achieving joint SOC and SOH estimation. Experimental results based on the Oxford and CALCE battery datasets demonstrate that despite BMS suffering from cyber-attacks, the paper’s method maintains high accuracy. It proves effective across various battery types, ensuring reliable SOC and SOH estimates. Furthermore, this method considers the correlation among state parameters during battery usage, achieving long-term stable prediction of each parameter within a unified framework. However, this paper does not validate the stability and accuracy of the method in estimating battery state under complex operating conditions. Future research could extend this method to the state estimation of battery packs to assess its applicability in complex operating conditions.
Acknowledgement: We are grateful for the valuable comments provided by the anonymous reviewers, which have helped us to improve the content of this paper and make it even better.
Funding Statement: This research was funded by the Scientific Research Project of the Education Department of Jilin Province (No. JJKH20230121KJ).
Author Contributions: The authors confirm contribution to the paper as follows: study conception and design: Tianqing Yuan; data collection: Na Li; analysis and interpretation of results: Hao Sun; draft manuscript preparation: Sen Tan. All authors reviewed the results and approved the final version of the manuscript.
Availability of Data and Materials: Due to the nature of this research, participants of this study did not agree for their data to be shared publicly, so supporting data is not available.
Ethics Approval: Not applicable.
Conflicts of Interest: The authors declare that they have no conflicts of interest to report regarding the present study.
References
1. M. Gholizadeh and A. Yazdizadeh, “Systematic mixed adaptive observer and EKF approach to estimate SOC and SOH of lithium-ion battery,” IET Electr. Syst. Transp., vol. 10, no. 2, pp. 135–143, 2020. doi: 10.1049/iet-est.2019.0033. [Google Scholar] [CrossRef]
2. W. Duo, M. Zhou, and A. Abusorrah, “A survey of cyber attacks on cyber physical systems: Recent advances and challenges,” IEEE/CAA J. Autom. Sin., vol. 9, no. 5, pp. 784–800, May 2022. doi: 10.1109/JAS.2022.105548. [Google Scholar] [CrossRef]
3. Y. C. Li and Q. H. Liu, “A comprehensive review study of cyber-attacks and cyber security; emerging trends and recent developments,” Energy Rep., vol. 7, no. 8, pp. 8176–8186, Nov. 2021. doi: 10.1016/j.egyr.2021.08.126. [Google Scholar] [CrossRef]
4. S. Tan, P. L. Xie, J. M. Guerrero, and J. C. Vasquez, “Lyapunov-based resilient cooperative control for DC microgrid clusters against false data injection cyber-attacks,” IEEE Trans. Smart Grid, vol. 15, no. 3, pp. 3208–3222, May 2024. doi: 10.1109/TSG.2023.3332946. [Google Scholar] [CrossRef]
5. J. Bi, F. Luo, G. Liang, X. Yang, S. He and Z. Y. Dong, “Impact assessment and defense for smart grids with FDIA against AMI,” IEEE Trans. Netw. Sci. Eng., vol. 10, no. 2, pp. 578–591, Mar.–Apr. 2023. doi: 10.1109/TNSE.2022.3197682. [Google Scholar] [CrossRef]
6. A. J. Gallo, M. S. Turan, F. Boem, and T. Parisini, “A distributed cyber-attack detection scheme with application to DC microgrids,” IEEE Trans. Automat. Contr., vol. 65, no. 9, pp. 3800–3815, 2020. doi: 10.1109/TAC.2020.2982577. [Google Scholar] [CrossRef]
7. M. R. Habibi, H. R. Baghaee, F. Blaabjerg, and T. Dragicevic, “Secure MPC/ANN-based false data injection cyber-attack detection and mitigation in DC microgrids,” IEEE Syst. J., vol. 16, no. 1, pp. 1487–1498, 2022. doi: 10.1109/JSYST.2021.3086145. [Google Scholar] [CrossRef]
8. H. Xu, G. Pang, Y. Wang, and Y. Wang, “Deep isolation forest for anomaly detection,” IEEE Trans. Knowl. Data Eng., vol. 35, no. 12, pp. 12591–12604, Dec. 2023. doi: 10.1109/TKDE.2023.3270293. [Google Scholar] [CrossRef]
9. X. Y. Li, W. J. Zhu, Y. C. Liu, and C. X. Cai, “Improved Ah integration method considering the operation state of battery,” Battery Bimonthly, vol. 53, no. 5, pp. 509–513, 2023. doi: 10.19535/j.1001-1579.2023.05.009. [Google Scholar] [CrossRef]
10. P. Wang, X. Y. Peng, Z. Cheng, and J. A. Zhang, “A multi-time scale joint state estimation method for lithium-ion batteries based on data-driven model fusion,” (in Chinese), Automot. Eng., vol. 44, no. 3, pp. 362–371+378, 2022. doi: 10.19562/j.chinasae.qcgc.2022.03.007. [Google Scholar] [CrossRef]
11. X. L. Dong, C. P. Zhang, and J. C. Jiang, “Evaluation of SOC estimation method based on EKF/AEKF under noise interference,” Energy Proc., vol. 152, pp. 520–525, 2018. doi: 10.1016/j.egypro.2018.09.204. [Google Scholar] [CrossRef]
12. M. Jiao, D. Q. Wang, and J. L. Qiu, “A GRU-RNN based momentum optimized algorithm for SOC estimation,” J. Power Sources, vol. 459, no. 4, 2020, Art. no. 228051. doi: 10.1016/j.jpowsour.2020.228051. [Google Scholar] [CrossRef]
13. P. Wang, Q. R. Gong, J. A. Zhang, and Z. Cheng, “An online state of health prediction method for lithium batteries based on combination of data-driven and empirical model,” (in Chinese), Trans. China Electrotech. Soc., vol. 36, no. 24, pp. 1–12, 2021. [Google Scholar]
14. Q. N. Han, F. Jiang, and Z. Cheng, “The state of health estimation framework for lithium-ion batteries based on health feature extraction and construction of mixed model,” J. Electrochem. Soc., vol. 168, no. 7, 2021, Art. no. 070509. doi: 10.1149/1945-7111/ac0e4c. [Google Scholar] [CrossRef]
15. J. P. Tian, R. Xiong, and W. X. Shen, “State-of-health estimation based on differential temperature for lithium ion batteries,” IEEE Trans. Power Electron., vol. 35, no. 10, pp. 10363–10373, 2020. doi: 10.1109/TPEL.2020.2978493. [Google Scholar] [CrossRef]
16. X. H. Yin, Y. C. Song, W. Liu, and D. T. Liu, “Multi-scale state joint estimation for lithium-ion battery,” Chin. J. Sci. Instrum., vol. 39, no. 8, pp. 118–126, 2018. [Google Scholar]
17. C. Li, F. Xiao, Y. Fan, X. Tang, and G. Yang, “Joint estimation of the state of charge and the state of health based on deep learning for lithium-ion batteries,” Proc. CSEE, vol. 41, no. 2, pp. 681–692, 2021. [Google Scholar]
18. C. Birkl, Oxford Battery Degradation Dataset 1. Oxford: University of Oxford, 2017. [Google Scholar]
19. C. Chen, J. Wei, and Z. Li, “Remaining useful life prediction for lithium-Ion batteries based on a hybrid deep learning model,” Processes, vol. 11, no. 8, 2023, Art. no. 2333. doi: 10.3390/pr11082333. [Google Scholar] [CrossRef]
20. S. Hariri, M. C. Kind, and R. Brunner, “Extended isolation forest,” IEEE Trans. Knowl. Data Eng., vol. 33, no. 4, pp. 1479–1489, 2019. doi: 10.1109/TKDE.2019.2947676. [Google Scholar] [CrossRef]
21. J. T. He, Z. B. Wei, and X. L. Bian, “State-of-health estimation of lithium-ion batteries using incremental capacity analysis based on voltage capacity model,” IEEE Trans. Transp. Electrific., vol. 6, no. 2, pp. 417–426, 2020. doi: 10.1109/TTE.2020.2994543. [Google Scholar] [CrossRef]
22. J. A. Zhang, P. Wang, and Z. Cheng, “SOH estimation method for Li-ion battery based on ICA and Box-Cox transform,” (in Chinese), Proc. CSU-EPSA, vol. 34, no. 2, pp. 9–15, 2022. [Google Scholar]
23. Z. A. Yu, H. H. Shao, and K. Y. Chen, “SOC estimation of lithium ion battery based on IGWO-BP neural network,” J. Power Supply, vol. 47, no. 9, pp. 1153–1157, 2023. [Google Scholar]
24. Q. Wu, R. Xu, Q. Yang, and L. Xu, “Lithium battery capacity estimation method based on PCA and GA-BP neural network,” Electron. Meas. Technol., vol. 45, no. 6, pp. 66–71, 2022. [Google Scholar]
Cite This Article
 Copyright © 2024 The Author(s). Published by Tech Science Press.
This work is licensed under a Creative Commons Attribution 4.0 International License , which permits unrestricted use, distribution, and reproduction in any medium, provided the original work is properly cited.
 Downloads
 Citation Tools