
 Submit a Paper
 Propose a Special lssue
 Open Access
ARTICLE

YOLO-RLC: An Advanced Target-Detection Algorithm for Surface Defects of Printed Circuit Boards Based on YOLOv5
1 School of Computer and Software Engineering, Huaiyin Institute of Technology, Huai’an, 223003, China
2 Huaiyin Institute of Technology, Laboratory for Internet of Things and Mobile Internet Technology of Jiangsu Province, Huai’an, 223001, China
3 Jiangsu Kesheng Xuanyi Technology Co., Ltd., Huai’an, 223300, China
* Corresponding Author: Yuanyuan Wang. Email:
Computers, Materials & Continua 2024, 80(3), 4973-4995. https://doi.org/10.32604/cmc.2024.055839
Received 08 July 2024; Accepted 22 August 2024; Issue published 12 September 2024
 View Full Text
 Download PDF
Abstract
Printed circuit boards (PCBs) provide stable connections between electronic components. However, defective printed circuit boards may cause the entire equipment system to malfunction, resulting in incalculable losses. Therefore, it is crucial to detect defective printed circuit boards during the generation process. Traditional detection methods have low accuracy in detecting subtle defects in complex background environments. In order to improve the detection accuracy of surface defects on industrial printed circuit boards, this paper proposes a residual large kernel network based on YOLOv5 (You Only Look Once version 5) for PCBs surface defect detection, called YOLO-RLC (You Only Look Once-Residual Large Kernel). Build a deep large kernel backbone to expand the effective field of view, capture global information more efficiently, and use 1 1 convolutions to balance the depth of the model, improving feature extraction efficiency through reparameterization methods. The neck network introduces a bidirectional weighted feature fusion network, combined with a brand-new noise filter and feature enhancement extractor, to eliminate noise information generated by information fusion and recalibrate information from different channels to improve the quality of deep features. Simplify the aspect ratio of the bounding box to alleviate the issue of specificity values. After training and testing on the PCB defect dataset, our method achieved an average accuracy of 97.3% (mAP50) after multiple experiments, which is 4.1% higher than YOLOv5-S, with an average accuracy of 97.6% and an Frames Per Second of 76.7. The comparative analysis also proves the superior performance and feasibility of YOLO-RLC in PCB defect detection.Keywords
Electronic components and sensors are physically installed and electrically connected through printed circuit boards, enabling them to work together and perform specific functions. Printed circuit boards (PCBs) play a crucial role in ensuring circuit performance and reliability. Due to mechanical errors, improper operation, and material issues, there are many subtle defects on the surface of PCBs. These defects hinder the effective connection between electronic components and sensors, making the entire device unable to function properly and causing serious economic losses. Timely detection and detection of defective printed circuit boards is essential, especially for PCBs used in medical and aviation fields. Therefore, improving the accuracy of objective detection of surface component defects in PCBs manufacturing is crucial.
Compared to traditional manual investigation solutions that are inefficient and labor-intensive, computer vision provides an economically efficient solution for defect detection in printed circuit boards. Defect detection aims to label defect content belonging to PCBs in a pixel-based manner. In existing literature, extensive research has been conducted on advanced defect detection techniques to improve detection efficiency or accuracy. In the early stages, traditional convolutional neural network defect detection methods [1,2], inter-finger electrode probe detection methods [3], and multi-scale feature fusion detection methods based on up-sampling and skip layer connections were used [4]. However, the effectiveness of these technologies is easily affected by changes in data sources and testing environments.
The latest deep learning techniques have brought hope for intelligent interpretation of defect detection in visual tasks. Yang et al. [5] increased convolutional blocks of different sizes by adding detection heads and introduced attention modules (CBAM) to enhance image information in complex backgrounds. Increasing attention mechanism is a commonly used method, but both channel attention and spatial attention have compression and restoration processes, which can lead to a small amount of noise in feature information. Liu et al. [6] proposed a feature fusion structure called ASFPN (Attention Spatial Feature Fusion Pyramid Network), as well as a decoupled head structure, which can achieve semantic information fusion of shallow and deep features. However, its performance advantage in small-scale object detection is relatively weak. Yan et al. [7] proposed replacing the C2f module in YOLOv8 (You Only Look Once version 8) with an MOP (Mobile One Partial Convolution) Block module to improve detection speed. However, this method significantly reduces detection accuracy. The authors added attention modules to multiple parts of the network model to compensate for the accuracy loss caused by replacing the C2f module. Pan et al. [8] introduced PAN (Path Aggregation Network) + FPN (Feature Pyramid Network) and SIoU (Structured Intersection over Union) modules to improve the detection accuracy of the algorithm. SIoU considers the angle problem based on CIoU (Complete Intersection over Union), which makes the calculation of box intersection and union ratio loss more comprehensive. However, it is too complex and makes the training not smooth enough. In addition, many previous studies on PCB defect detection have expanded the field of view by appropriately deepening the stacking of small convolution kernels. However, with too many convolutional kernels, more data and longer training time are needed to optimize all parameters, and the model may learn noise or details from the training data instead of generic features.
To address the appeal challenge, we construct an advanced object detection algorithm YOLO-RLC (You Only Look Once-Residual Large Kernel) based on YOLOv5-S for detecting and locating surface defect positions on PCBs. This algorithm includes the backbone of technologies such as large kernel convolution combined with deep convolution, reparameterization, and shortcut, feature enhancement extractor and noise filtering module for semantic saliency feature enhancement, bidirectional feature pyramid network with different weights at different levels, and high-resolution detection head for task-oriented applications. The proposed algorithm exhibits excellent performance for different defects. Our main contributions to this study are as follows:
• We innovatively apply large kernel convolution to the field of defect detection, which can reduce the number of convolution overlays while effectively expanding the field of view. combined with reparameterization, Convolutional Feed Forward Network (ConvFFN), and shortcut technology, a backbone network is formed, which enables the network to accurately identify defect areas and categories, while optimizing computational efficiency.
• We introduce a bidirectional feature pyramid network (BiFPN) that optimizes the integration of multi-scale information between the up-sampling and down-sampling processes of PCB feature images, combined with increased high-precision detection, overcoming the disadvantages of general feature fusion structures in small-scale object detection. We propose a novel and unprecedented noise filtering module (NFM) that not only focuses on defect areas like an attention mechanism but also eliminates deterministic interference signals caused by feature map scaling.
• We draw inspiration from the split idea of the C2f module in YOLOv8 and have developed a new multi-branch information calibration principle, C2CR, for the C3 module. C2CR can segment the input, process it through a series of bottleneck layers, and then merge it, achieving effective integration of features at different scales. At the same time, it reduces the abstraction of advanced feature representations and improves the quality of deep feature extraction.
• To address the complexity and training instability of using penalty terms to calculate the aspect ratio of joint complete crossover (CIoU). The introduction of CIoU-based Enhanced Cross Union (EIoU) loss solves the training stability problem caused by ambiguous aspect ratio definitions and computational complexity. However, during the training process, when the real box moves away from the bounding box, specific outliers may occur. Our proposed EIoU2 avoids the situation of specific values by directly calculating the absolute error in height and width between them.
By systematically reviewing the latest developments in anomaly defect detection in intelligent manufacturing analyzed by Liso et al. [9] in the literature. Due to various factors, defect identification has become crucial, as everything from reducing production costs to maintaining necessary safety standards depends on it. Therefore, widely used sensor networks generate a large amount of data, which provides detailed information for the observation process. This situation has led to the widespread application of deep learning techniques, which excel in high precision, accuracy, and repeatability, and can effectively detect abnormal situations. In the research on machine learning algorithms for PCB detection. Tang et al. [10] proposed a method to improve defect prediction performance with the help of static analysis technology. Bulnes et al. [11] designed a method to divide images into a set of overlapping regions during defect detection and used genetic algorithms to automatically determine the optimal configuration parameters for detection technology. Sano et al. [12] used a two-dimensional moving range filter to highlight fault points and unanimously voted through a color component classifier to achieve the identification of defective products. Despite the excellent performance of the aforementioned traditional algorithms on certain datasets, they are less adaptable to the different pixel distributions and unexpected noise of images. Furthermore, these algorithms have relatively limited generalization capabilities when applied to other datasets. Much research on a PCB detection algorithm has been based on a two-level object detection network. Zhao et al. [13] adopted a cascaded Faster R-CNN (Region-based Convolutional Neural Network) structure. First, it includes classifying different types of defects through a pre-classifier network and then passing these classification results to the Faster R-CNN for defect detection. This cascade structure can handle different types of defects more effectively, improving the accuracy of defect detection, but it greatly reduces efficiency. This type of detection method is usually too harsh when facing industrial demands and cannot achieve satisfactory performance in terms of robustness and real-time performance.
In order to address the challenges of two-stage object detection methods, researchers have proposed single-stage detection algorithms. Huang et al. [14] used YOLOv4-based technology to achieve small target detection. Through extended feature fusion of shallow features, detection performance was improved, but it ignores deep semantic information. Hu et al. [15] used a deep feature extraction module with the multiscale pyramid, and the design of attention mechanism and strip convolution, which can effectively extract deep semantic information at multiple scales. Li et al. [16] proposed a defect detection model called M2-BL-YOLOv4, in this model, the complex CSPDarkNet53 backbone network was improved, and an inverse residual structure was adopted, which significantly reduced the number of parameters of the model and improved the detection speed. In [17], by using a fully convolutional network (FCN), the features of defect texture could be extracted at multiple levels and multiple scales, thereby significantly enhancing the ability to represent textures, but there is a significant deviation in locating the defect location. Wen et al. [18] proposed a multiscale defect detection algorithm, the core of which was a model based on artificial neural networks, including an anchor box generation algorithm that used density clustering technology to locate defects. Hu et al. [19] used a multi-scale time sampling module and a deep spatiotemporal feature extraction module to expand the receptive field of the feature map. The extraction of spatiotemporal-related feature information was enhanced through the network, and the performance of three currently existing multi-channel fusion methods were also compared. Zang et al. [20] proposed a method that can accurately detect FPC (flexible printed circuit) defects in non-inspection template and defect detection image input pairs. This method makes full use of the inherent multi-scale pyramid hierarchy of deep neural networks (DNNs) to construct multi-scale features. Taken together, the one-stage target detection algorithms achieve a good balance in maintaining fast detection speed and good detection accuracy. However, its performance is relatively insufficient in high-precision small-target detection.
In this article, we chose YOLOv5-S as the benchmark model for three reasons: (1) YOLOv5-S has been validated for its stability and reliability through extensive practical applications. This stability helps ensure the reproducibility and comparability of research results. (2) YOLOv5-S has comprehensive documentation and active development community support, which provides important assistance for the use, debugging, and optimization of the model, allowing us to focus on researching the problem itself without having to pay too much attention to the technical details of the model itself. Compared to frequently updated subsequent versions, the stability of YOLOv5-S makes it more suitable for the experiments and result interpretation in this study. (3) YOLOv5-S is the first in the YOLO series to use gradient partitioning to obtain more gradient information, and this idea has been adopted even in subsequent versions.
YOLOv5 is an object detection model proposed by the Ultralytics company, the model includes multiple versions, such as YOLOv5-S, YOLOv5-M, YOLOv5-L, and YOLOv5-X, with the main difference being the different settings of the model’s depth and width parameters. We chose YOLOv5-S as the benchmark model. The structure diagram of YOLOv5-S is depicted in Fig. 1.
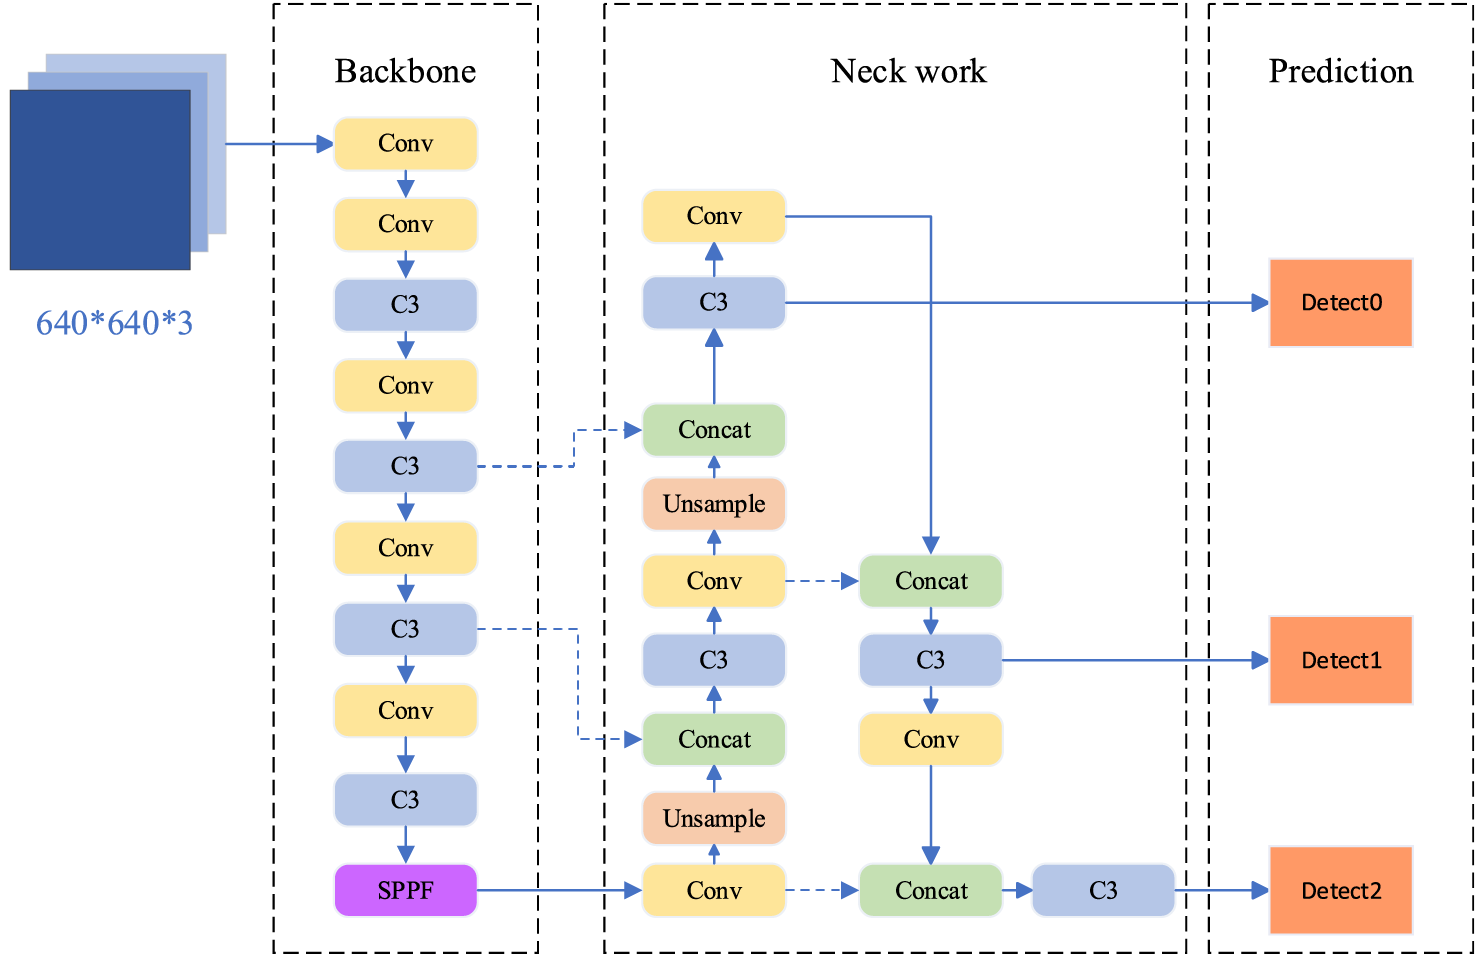
Figure 1: YOLOv5-S network architecture
The entire network mainly consists of three parts: backbone, neck, and head. Backbone is mainly responsible for extracting image features and reducing the size of feature maps. Neck is used to fuse feature maps of different scales. The head is responsible for predicting the position, category, and confidence of the bounding box. YOLOv5-S adopts a fully convolutional network structure and does not include fully connected layers. In YOLOv5-S, various techniques are also used to improve the performance of the model, including Mosaic data augmentation, adaptive anchor box calculation, adaptive image scaling, and so on. In addition, YOLOv5-S also introduces Focus structure, CSP structure, etc., to further optimize the training process of the model.
We have made improvements to the backbone, neck, and detection head of YOLOv5-S, as shown in Fig. 2. We reconstructed RLCNet (Residual Large Kernel Network) as the backbone network of YOLOv5-S based on RepLKNet [21], We use large kernel convolution with fewer stacking modules to obtain a complete image with an effective receptive field. We set the stacking times of modules in Stages 1–4 of the backbone network to (1, 2, 1), reducing the intermediate high redundancy of the feature layer while ensuring the acquisition of effective receptive fields. For the neck network, the idea of using BiFPN [22] to integrate bidirectional cross connections and weighted fusion backbone networks to generate original output features is improved to achieve multi-scale feature fusion through top-down and bottom-up path aggregation in PANet in YOLOv5-S. Specifically, we have designed a novel noise filtering module (NFM) in the neck network, which introduces information mutual supervision and counts the correlation of channel information to filter out task-irrelevant signals. In addition, we have made minor improvements to the C3 module of YOLOv5-S by replacing linear operations with some linear operations and reducing nonlinear operations appropriately can make the gradient more stable. In the prediction section, in order to improve the detection ability of small targets such as PCB surface defects, we added a high-resolution detection branch in the detection head section.
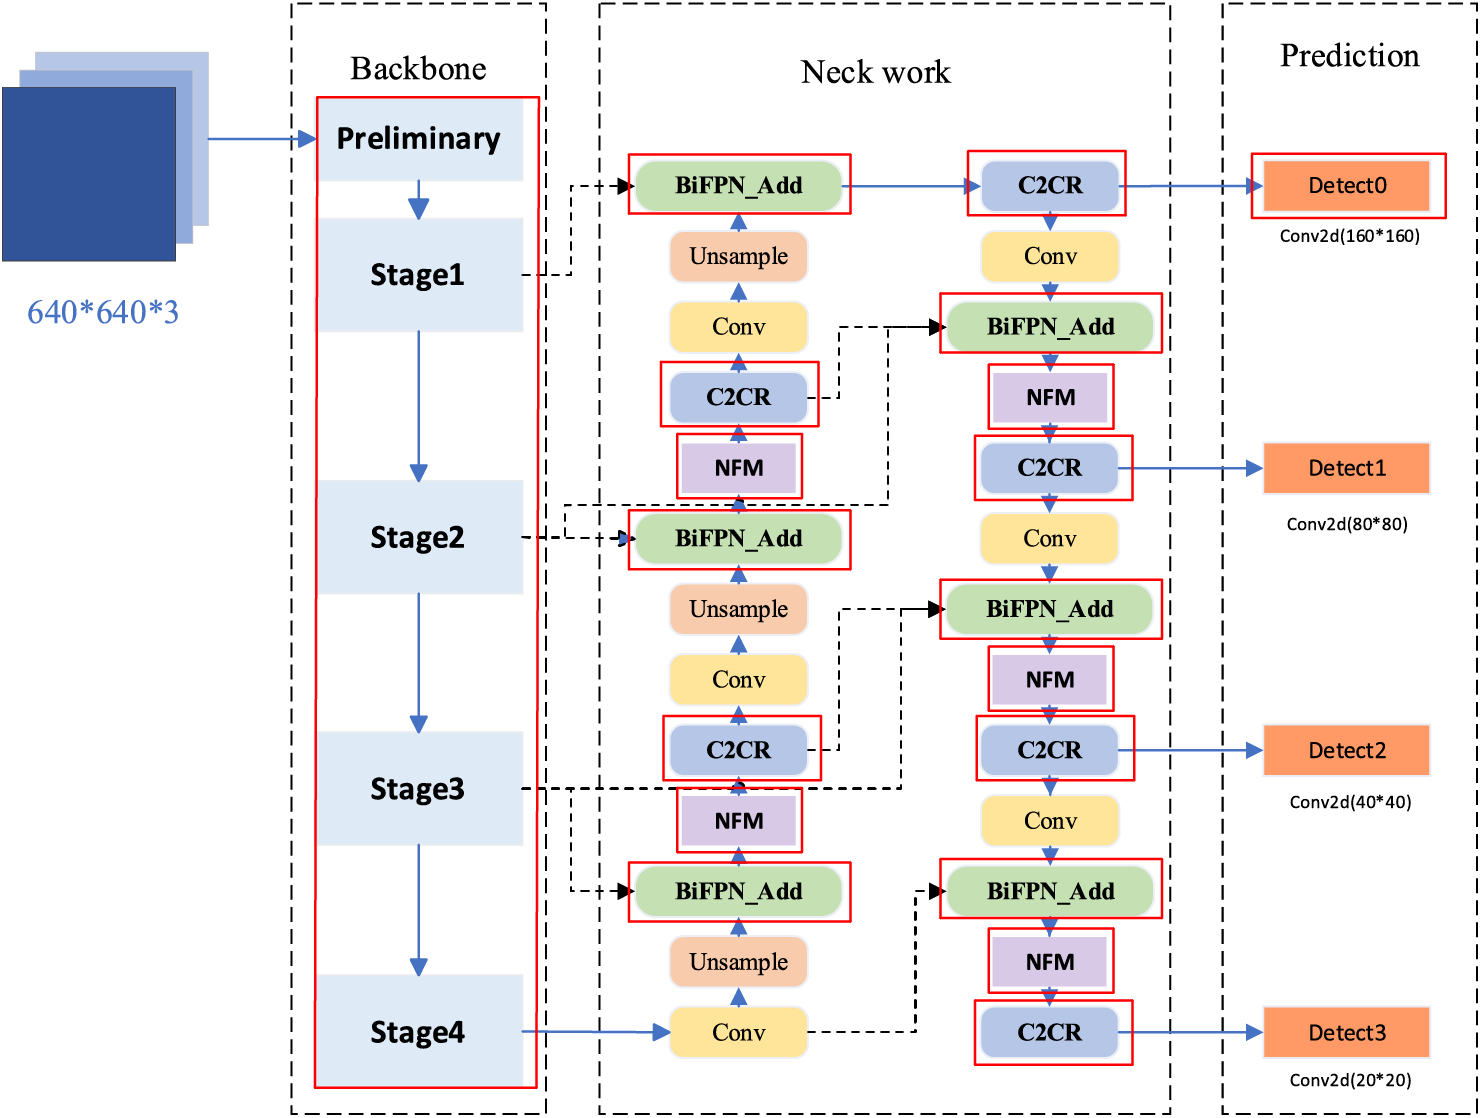
Figure 2: Network structure of the YOLO-RLC (the parts highlighted in red are improvement modules)
The overall network architecture of RLCNet is shown in Fig. 3. The entire RLCNet is divided into 5 stages. The first stage is the preliminary stage. In the preliminary stage, we first use a 3 × 3 conventional convolution for the first feature extraction of the original image. Considering the relatively high resolution of the initial feature map, we down-sampled the feature map by arranging a 3 × 3 deep convolution (DW) [23] to capture low-level patterns and reduce the computational complexity of subsequent large convolution kernels. In the initial stage, we also adopted the Structural Reparameterization (SR) module [24]. The concept of structural reparameterization was to fuse a small convolution kernel into the center of a larger convolution kernel and adjust the parameters appropriately to achieve an equivalent transformation of the model structure, and it is usually applied in deep layers of networks. We innovatively introduce the smallest three types of odd-sized convolution kernels in the shallow layers of the network for structural reparameterization operations. As shown in Fig. 4, this selection allows the network to introduce more information while avoiding excessive computational load associated with larger kernels.
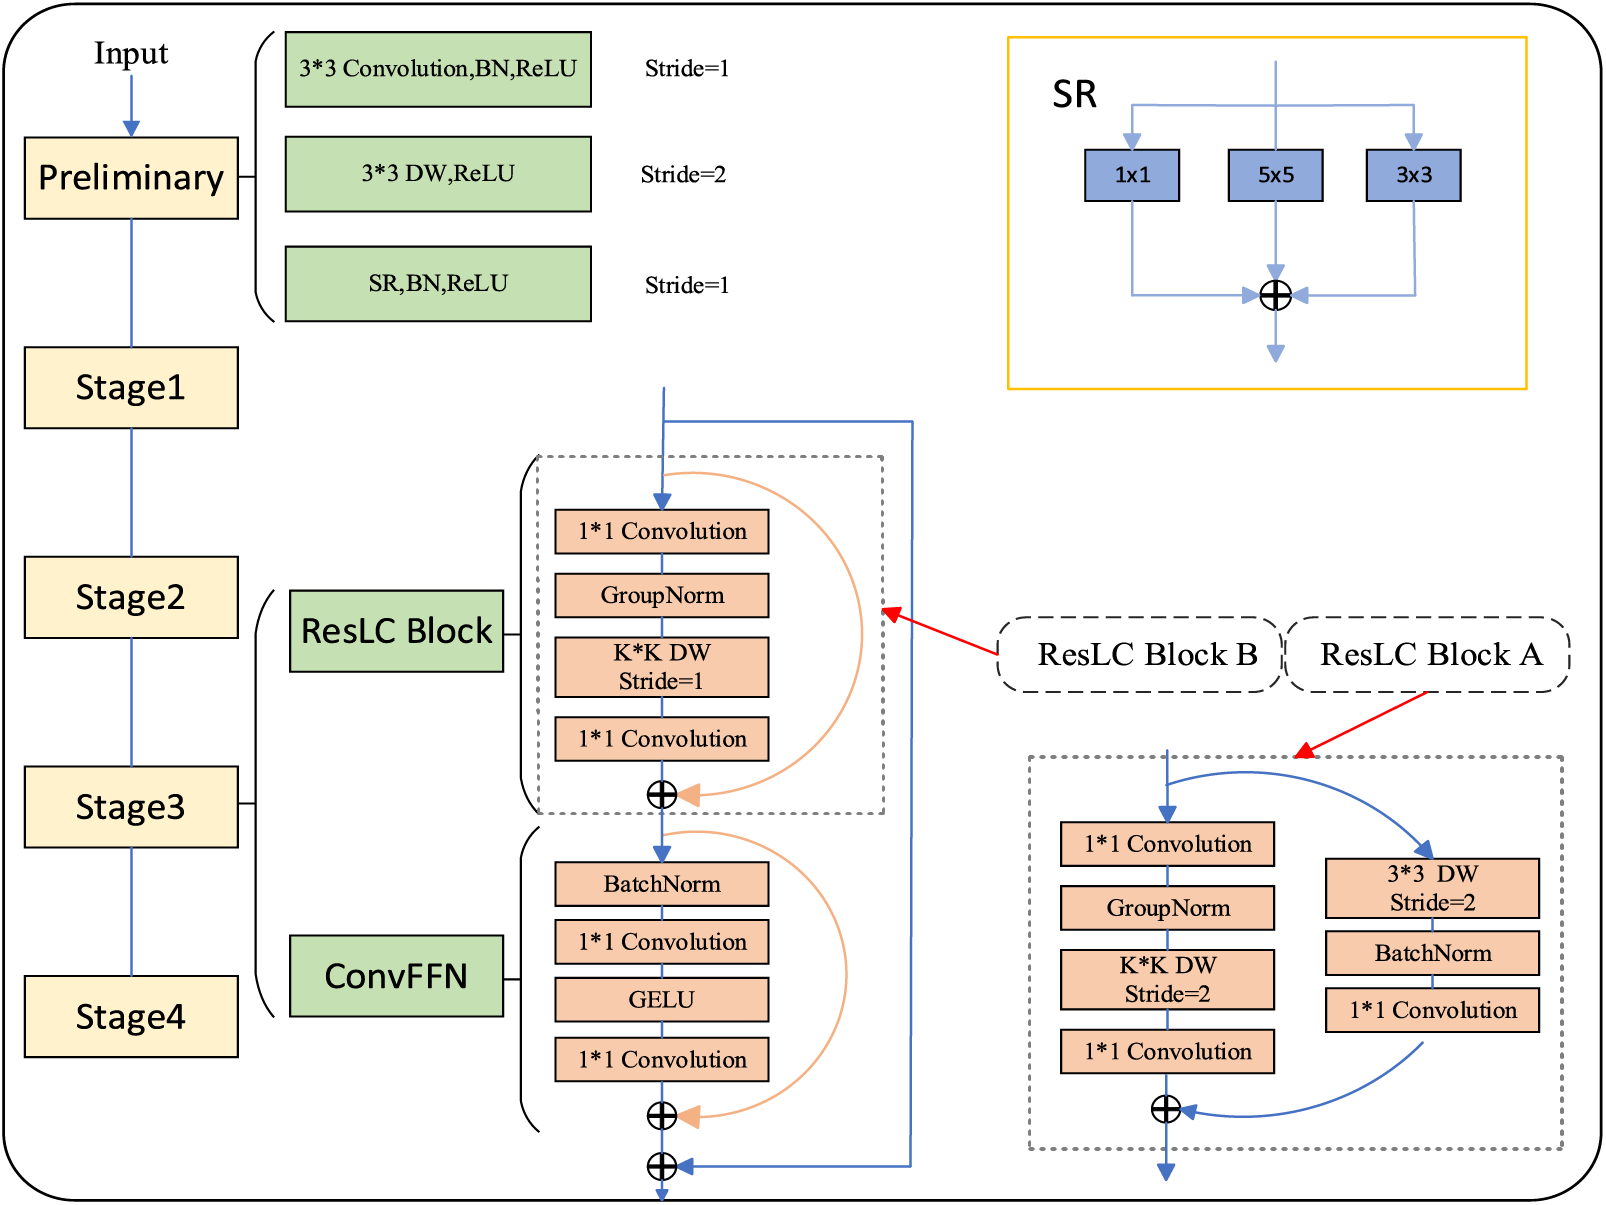
Figure 3: RLCNet overall architecture diagram
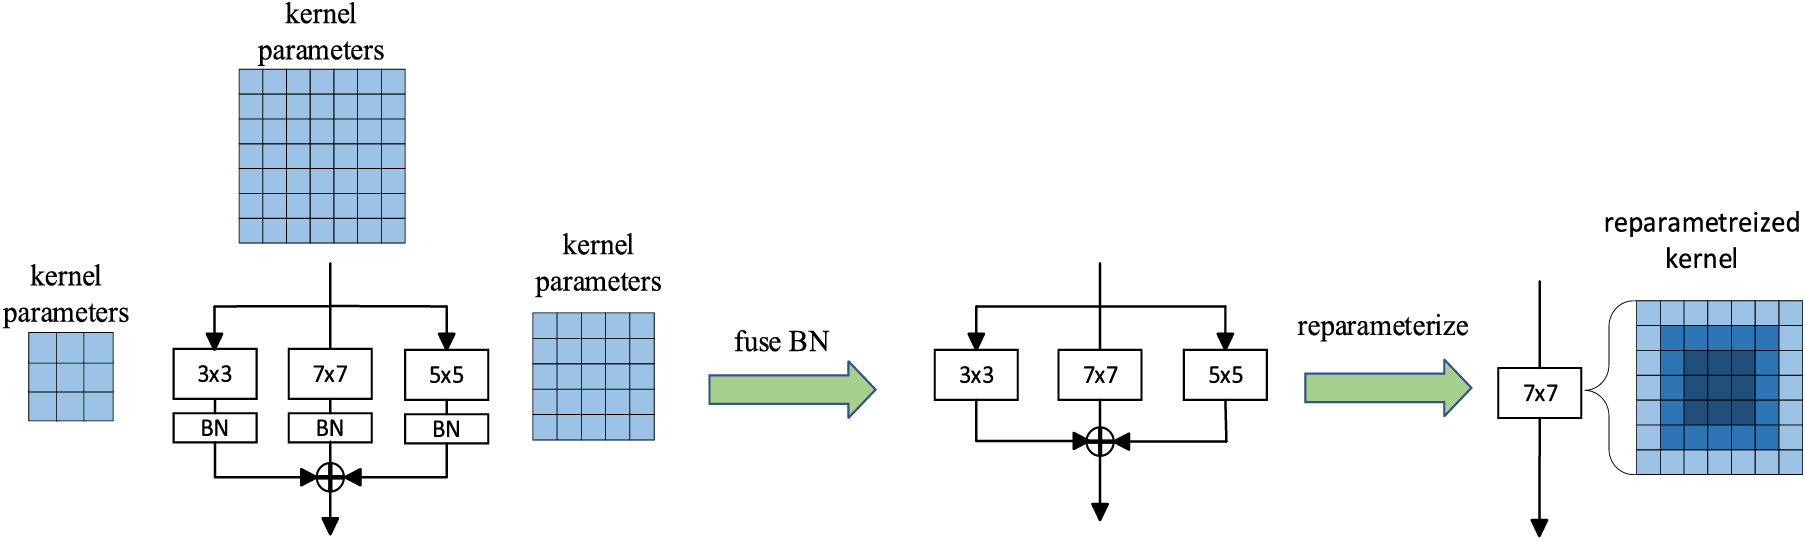
Figure 4: Details of multiscale structural parameterization
After the preliminary stage, each stage includes ResLC (Residual Large Kernel) blocks and ConvFFN [25] blocks. The ResLC module uses large kernel DW convolution, and the maximum con-volution kernel used in this article is 15 × 15. The larger the nucleus, the larger the receptive field, and the better the global features obtained. However, we did not use convolution kernels of size 31 × 31 or even larger like RepLKNet. The reason is that large convolution kernels can lead to a sharp increase in computational complexity, which is not conducive to increasing model depth and reducing computational performance. This does not meet the computational constraints in practical applications, especially in the field of PCB defect detection projects. The step size of the first ResLC module in each stage is 2, which we refer to as ResLC Block A, and the step size of the subsequent stacked module ResLC Block B is 1. The difference between the two is that the residual branch of ResLC Block A uses a 3 × 3 DW convolution to down-sample the input.
The ResLC module uses Group-Norm (GN) instead of regular Batch-Norm (BN) before large kernel DW convolution [26]. GN divides channels into several groups and then regularizes the channels in each group. For large kernel convolutional GN, it will be more efficient. In addition to large convolutional layers that help capture a wide range of features and overall spatial information, the representation ability of the model is also closely related to the depth of the network. Our goal is to increase the depth of the network by using low-cost 1
In order to eliminate noise information that may have a negative impact on the fusion results due to similar image background features of PCB boards, and make the final fused features more effective, we propose a noise filtering module. Its structure is shown in Fig. 5.
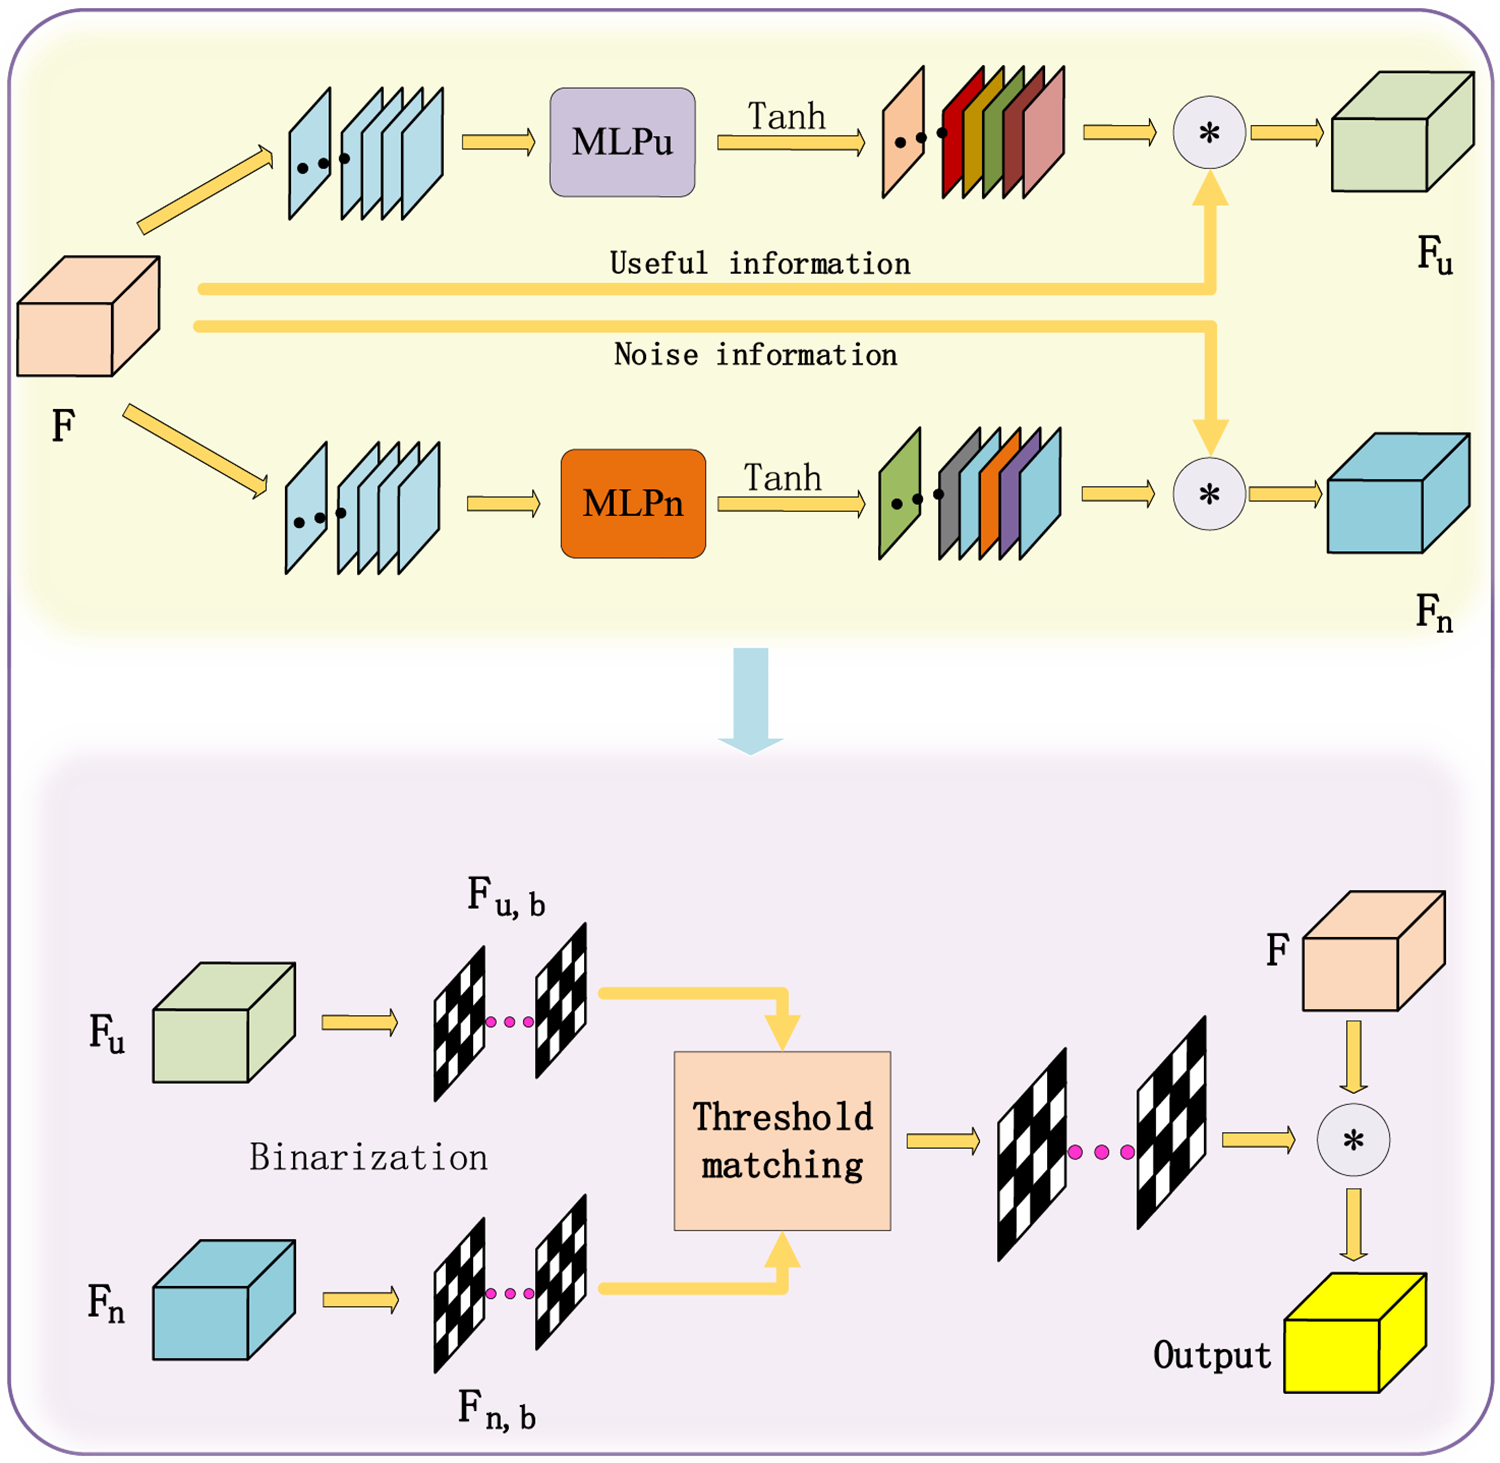
Figure 5: Noise filtering module
Given the feature map representation F, we activate the corresponding feature channels, decompose them into useful information
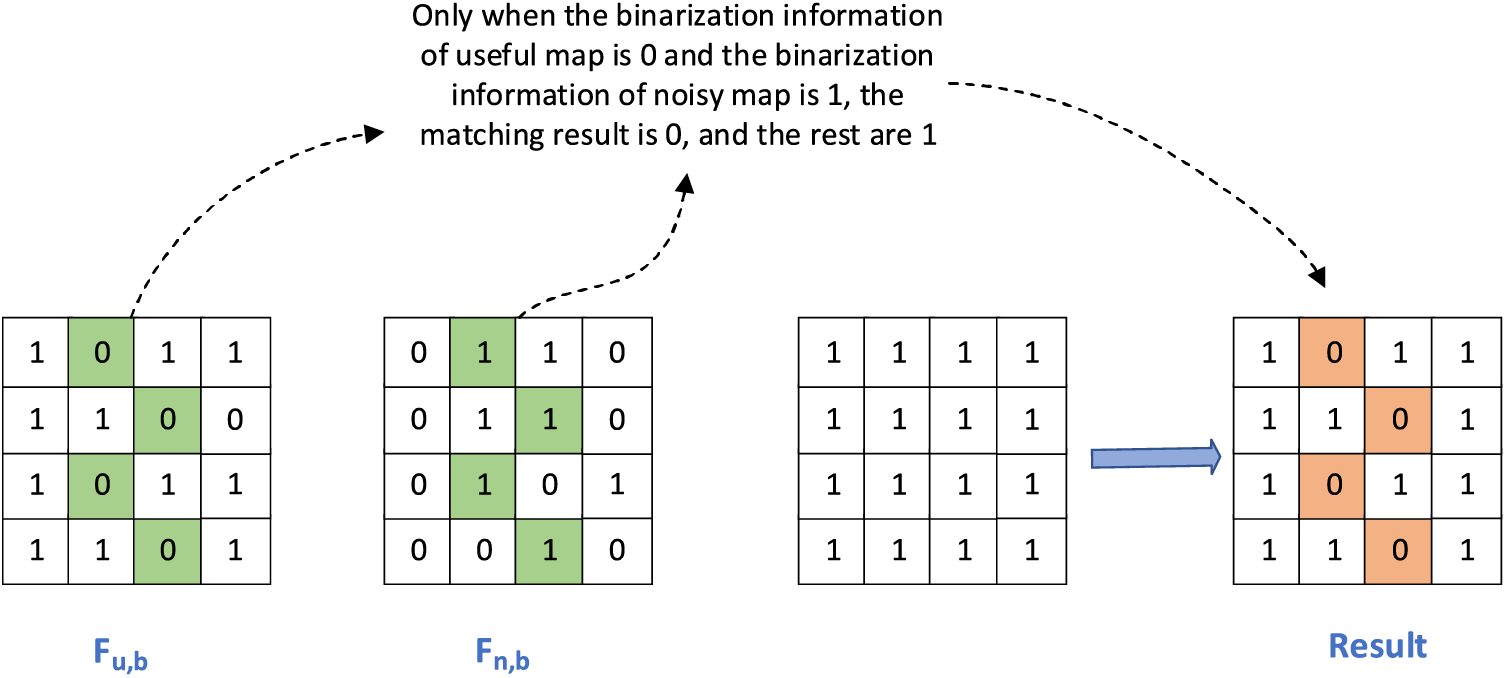
Figure 6: Threshold matching
The symbols
3.2.3 Feature Enhancement Extractor
In order to achieve an effective exchange of abstract information and interpretation of local attributes, contextual semantics enter a larger receptive field as the network depth increases, leading to the abstraction of high-level feature representations. Specifically, the differences and correlations among different feature channels, especially those that reflect the foreground, are interfered with by background information and cannot be focused on, which performs poorly in researching robust, task-oriented feature fusion. As an effective solution, the improvement of deep feature quality has been intensified in recent years. Therefore, in order to further improve the feature quality exported by the C3 extractor (Fig. 7a), we improved and reconstructed a new extractor C2CR, as shown in Fig. 7b. The upper input is split into three parts after passing through the first CBS block, with one part retaining the original input, one part performing a Bottle-Neck operation on one branch, and the other part performing the same CBS block again and performing a Bottle-Neck operation, then cascading the three branches and feeding them to the CRC block. CBS consists of 1
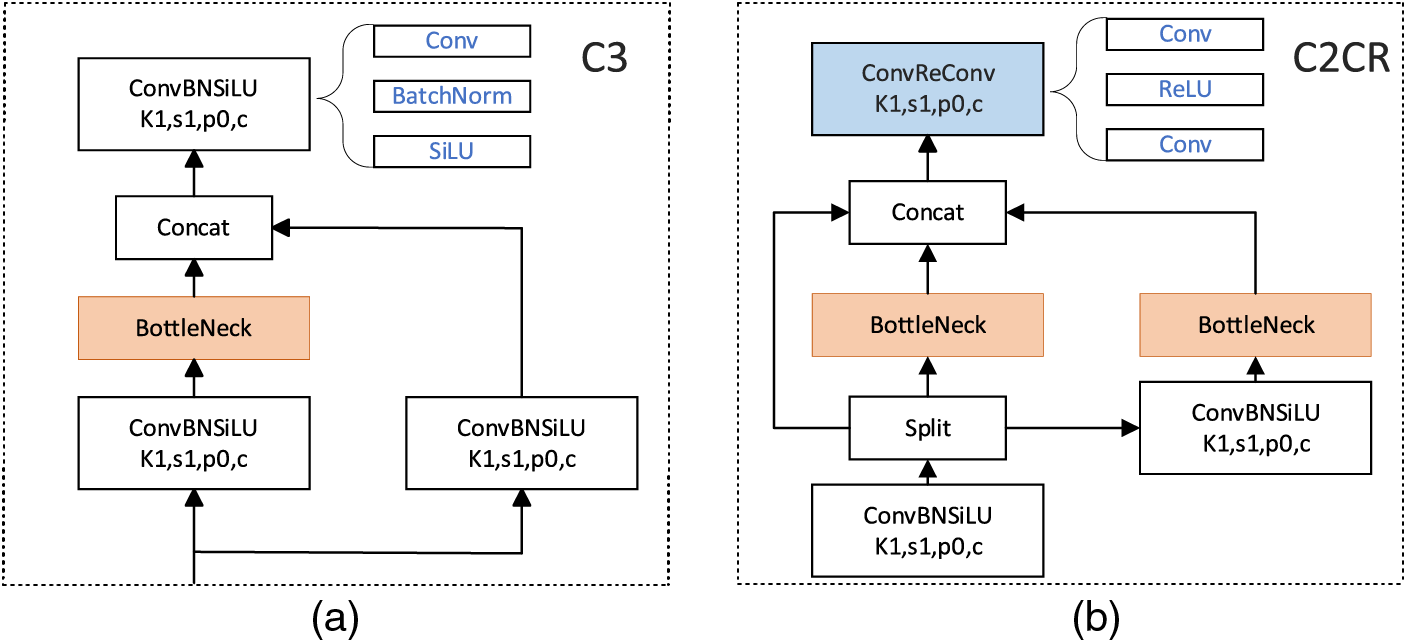
Figure 7: (a) Details of the C3 module. (b) Details of the C2CR module
This article introduces a weighted feature pyramid structure called BiFPN to solve the problem of complex texture interference on PCB surfaces. The BiFPN structure can span different layers and enhance the feature interaction ability between the up-sampling layer and the down-sampling layer at different scales. Essentially, on the one hand, BiFPN enriches the feature hierarchy of the YOLO-RLC model through weighted fusion, improving the model’s ability to accurately locate defects. On the other hand, using adjustable weights can achieve a fusion of features at different levels without losing feature information.
In the YOLOv8 model, a PANet pyramid structure is adopted, which emphasizes path aggregation from bottom to top. However, it has shortcomings in integrating features of different scales. Therefore, in the BiFPN module, we retain bottom-up aggregation and connect the network nodes from the previous layer to the next layer to achieve cross-scale information transmission, in order to achieve the fusion of image feature information before fusion. As shown in Fig. 8, each circular block represents the feature information extracted from the image, which is obtained through convolution operations. Multiple BiFPN modules are applied to the entire YOLO-RLC structure. In the feature fusion process, using generally weighted fusion will face problems of training instability and convergence difficulties, as the multi-dimensional tensor of each pixel is not limited. Softmax-based fusion may slow down training speed due to the involvement of a large number of exponential operations. Therefore, the use of fast normalized feature fusion in BiFPN can alleviate this problem, as shown in Eq. (7).

Figure 8: Comparison of BiFPN (left) with the PANet (right) network (the yellow arrows represent up-sampling, the blue arrows represent down-sampling, and the red arrows represent skip connections)
By using ReLU to limit
The default prediction box loss function used by YOLOv5-S is CIoU (Complete Intersection over Union) [28], as shown in Eq. (8).
Intersection over Union (IoU) represents the intersection and union ratio between the predicted and actual regions.
The positioning regression loss
But when the real box is far away from the bounding box, the difference between the width and height of the real box and the bounding box is a constant value, while the height of the bounding rectangle tends to infinity, making the difference between the true box and the bounding box close to 0. To alleviate this issue, we improved the EIoU loss by calculating the absolute error between the true box width and height and the bounding box width and height when calculating the difference between them. This makes it more robust to outliers, as shown in Eq. (12).
In the appeal formula,
4.1 Model Training Details and Experimental Environment
In this work, we use an advanced object detection algorithm YOLO-RLC based on YOLOv5-S to conduct experiments on a PCB defect dataset and verify its performance. The hyperparameters used for training the proposed algorithm model are shown in Table 1.
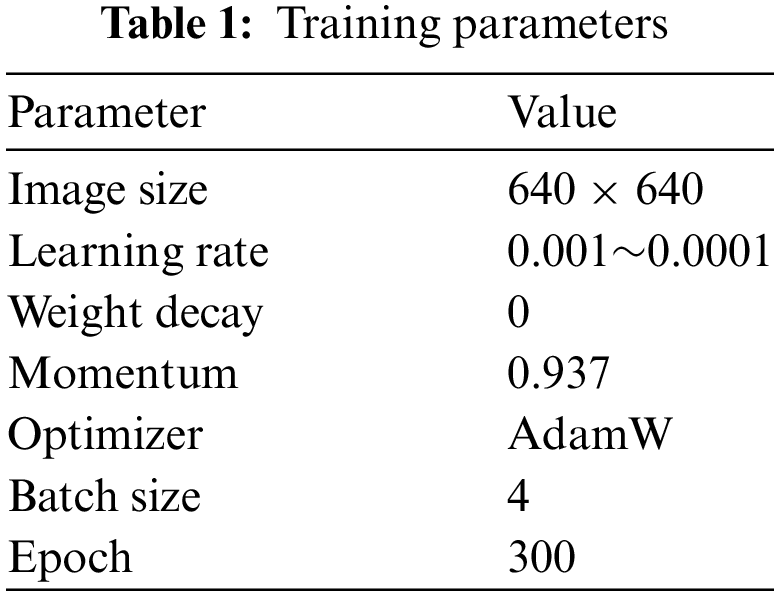
Set the batch size to 4. Within 300 periods, the learning rate is set between 0.001 and 0.0001. The selection of this optimizer is crucial for the large kernel convolutional network in this article. When traditional SGD (Stochastic Gradient Descent), Adam (Adaptive Moment Estimation), etc., are used together with Optimizer, the experimental results will be very unsatisfactory. Therefore, using the AdamW optimizer is more appropriate. AdamW combines Adam with Weight Decay, directly incorporating Weight Decay into the optimization algorithm without the need to additionally enable Weight Decay in the loss function. For the YOLOv5-S original algorithm, SGD used an initial learning rate of 0.01 and Adam used 0.001. Due to the use of the AdamW optimizer, we chose an initial learning rate of 0.001.
All experiments in this article were completed under Ubuntu 20.04, using the PyTorch 1.11.0 framework, Python version 3.8, CUDA version 11.3, an Intel Xeon(R) Platinum 8352V CPU, with a single CPU having 32 cores and 64 threads @2.4–3.5 GHz, and a 24 GB NVIDIA GTX4090 GPU.
For the predictions of the model, successfully identifying true positive instances is referred to as True Positive (TP). If the model incorrectly predicts negative instances as positive, it is termed False Positive (FP). Similarly, correctly identifying true negative instances is labeled as True Negative (FN). On the other hand, if the model misses true positive instances, it is known as False Negative (TN). Therefore, we have defined Precision and Recall. Due to the contradiction between Precision and Recall, in order to comprehensively evaluate the detection results, we used mAP as the indicator. AP represents the accuracy of a certain category, and for samples with m positive examples in each category, each positive example corresponds to a
4.3 Evaluation of YOLO-RLC Performance
4.3.1 Performance of Algorithm YOLO-RLC on Dataset PKU-Market-PCB
The dataset we used in our research (PKU Market PCB) was published by the Peking University Open Lab, Beijing, China on Human-Robot Interaction This dataset is public and can be obtained through the following link address: https://robotics.pkusz.edu.cn/resources/dataset/ (accessed on 02 April 2024). This dataset contains a total of 693 images, including 6 types of defects (Missing holes, Mouse bite, Open circuit, Short, Spur, Spurious cupper). The dataset is carefully divided into training, validation, and testing sets with a ratio of 8:1:1. It is emphasized that we did not use rotation, random cropping, or other methods to expand the dataset, which did improve the performance of the model on a common benchmark. However, the similarity between the expanded data samples and the original data samples is too high, which affects the objective evaluation of the model’s performance. We used the Mosaic data augmentation technique to randomly combine four images to create a mosaic to increase sample complexity, and the MixUp technique to create new training samples by randomly linearly combining samples and labels during the training process. This method makes the decision boundary smoother and helps the model learn more coherent input-output relationships, thereby improving the model’s generalization ability. The magnified examples of these 6 defects are shown in Fig. 9.
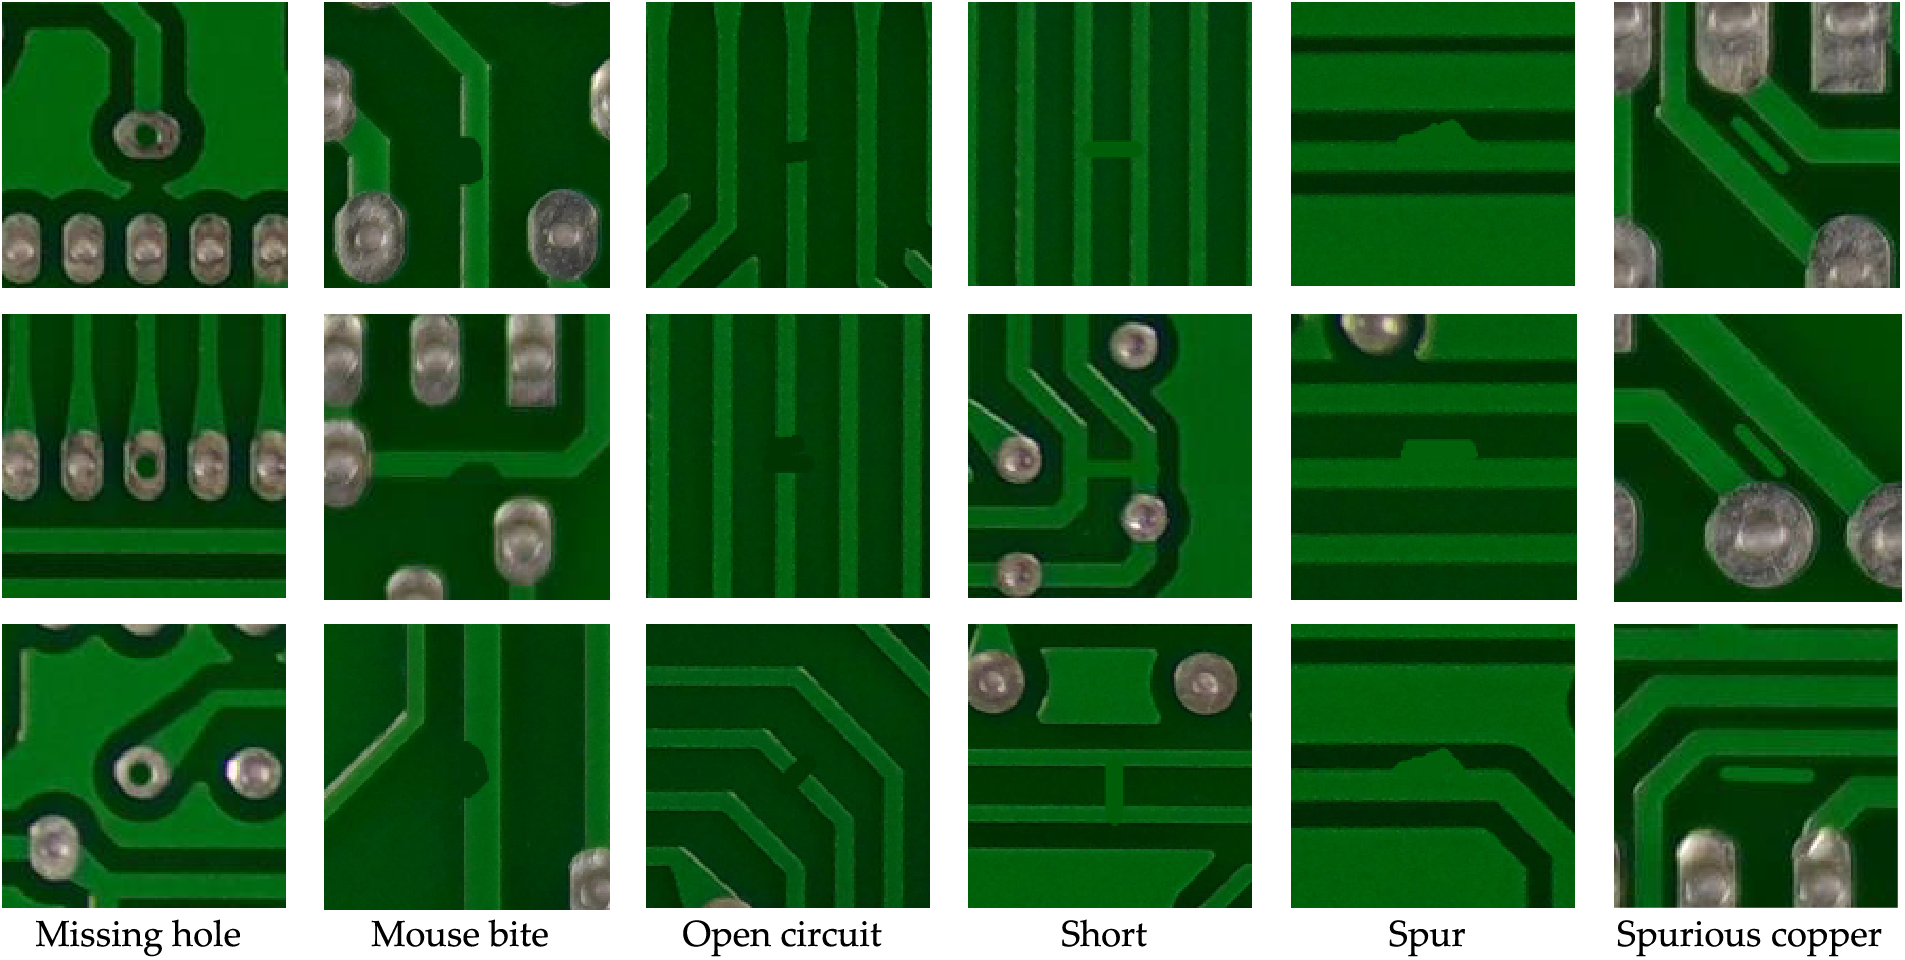
Figure 9: Example of the PKU-Market-PCB dataset
Evaluate the performance of the model during the training and testing stages through category loss, confidence loss, and location loss. Fig. 10 shows various metrics and performance of the model in object detection tasks, where the convergence speed of confidence loss is slower than that of category loss and position loss. However, overall comprehensive evaluation shows that the model has good performance, especially in important evaluation indicators such as recall, accuracy, and mAP during the testing phase, fully demonstrating the superior performance of YOLO-RLC.
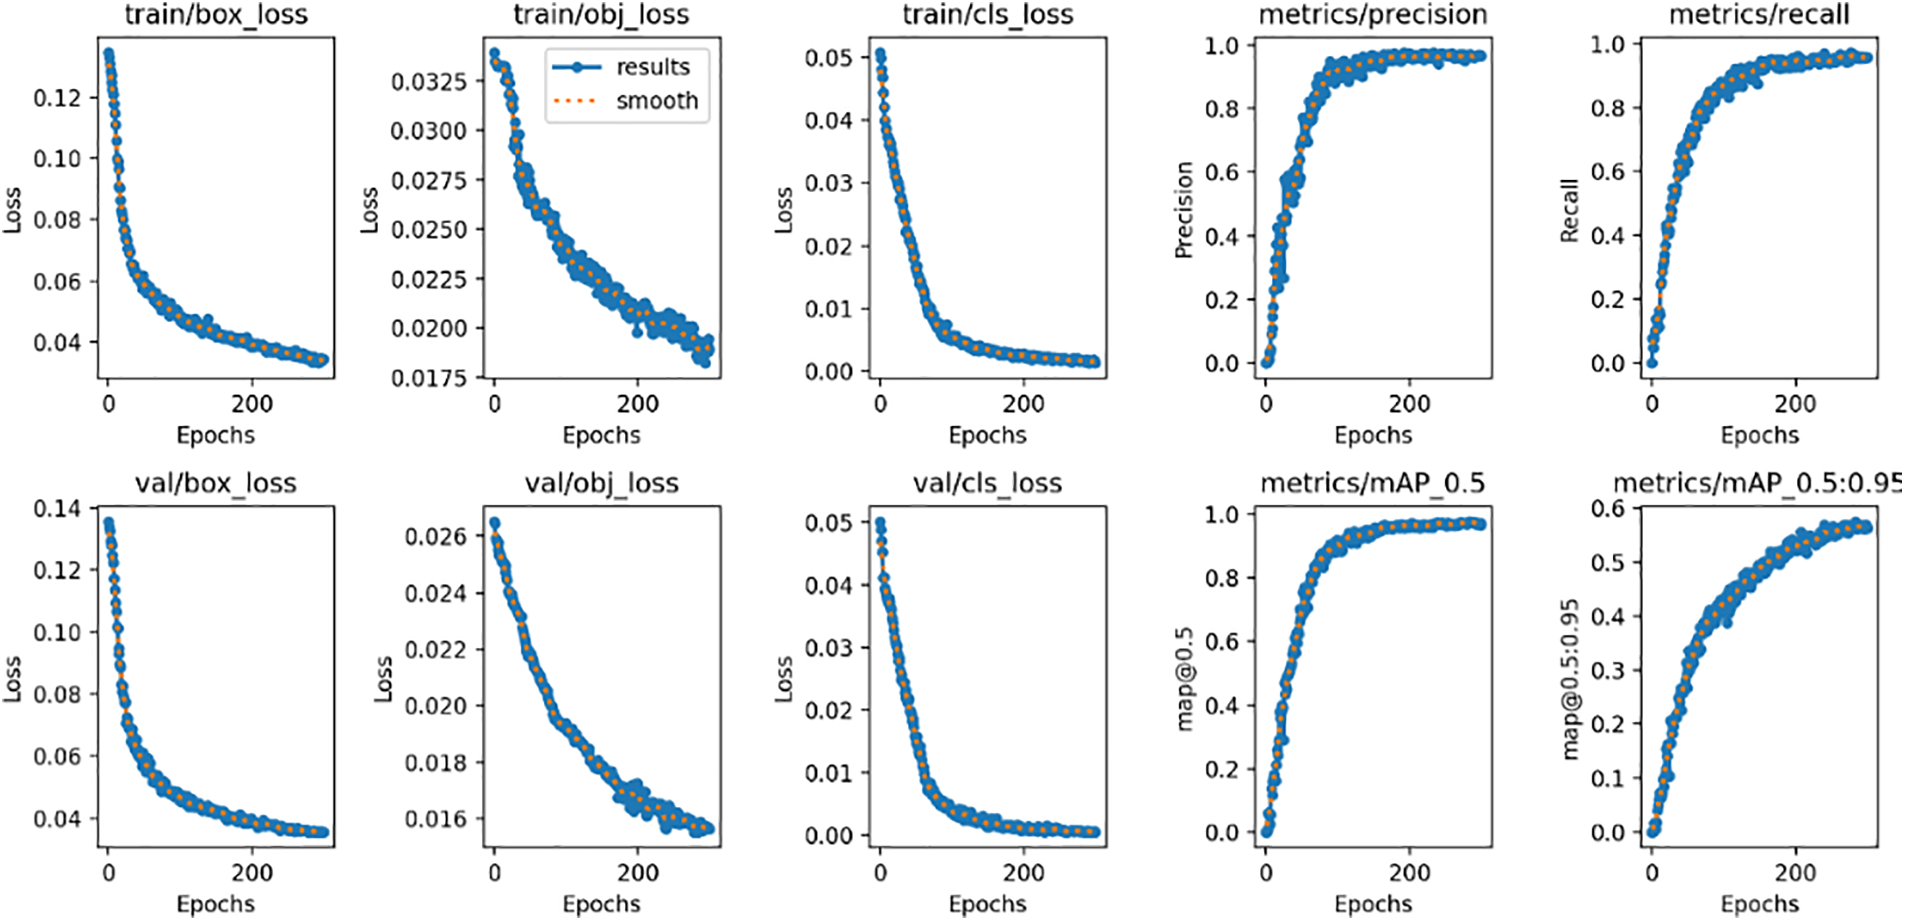
Figure 10: Example of the PKU-Market-PCB dataset
As shown in Fig. 11, both the YOLOv5-S model and YOLO-RLC model can successfully detect all defects in 200 × 200 low-pixel single targets, indicating that they have good detection performance on low-pixel single class defect targets. However, in the case of multiple different types of targets, there is a significant difference in the detection performance between the YOLOv5-S model and the YOLO-RLC model, as shown in Fig. 12. YOLO-RLC successfully detected all targets, while YOLOv5-S lost two targets. The results indicate that the YOLO-RLC model performs better in multiple types of defect targets.
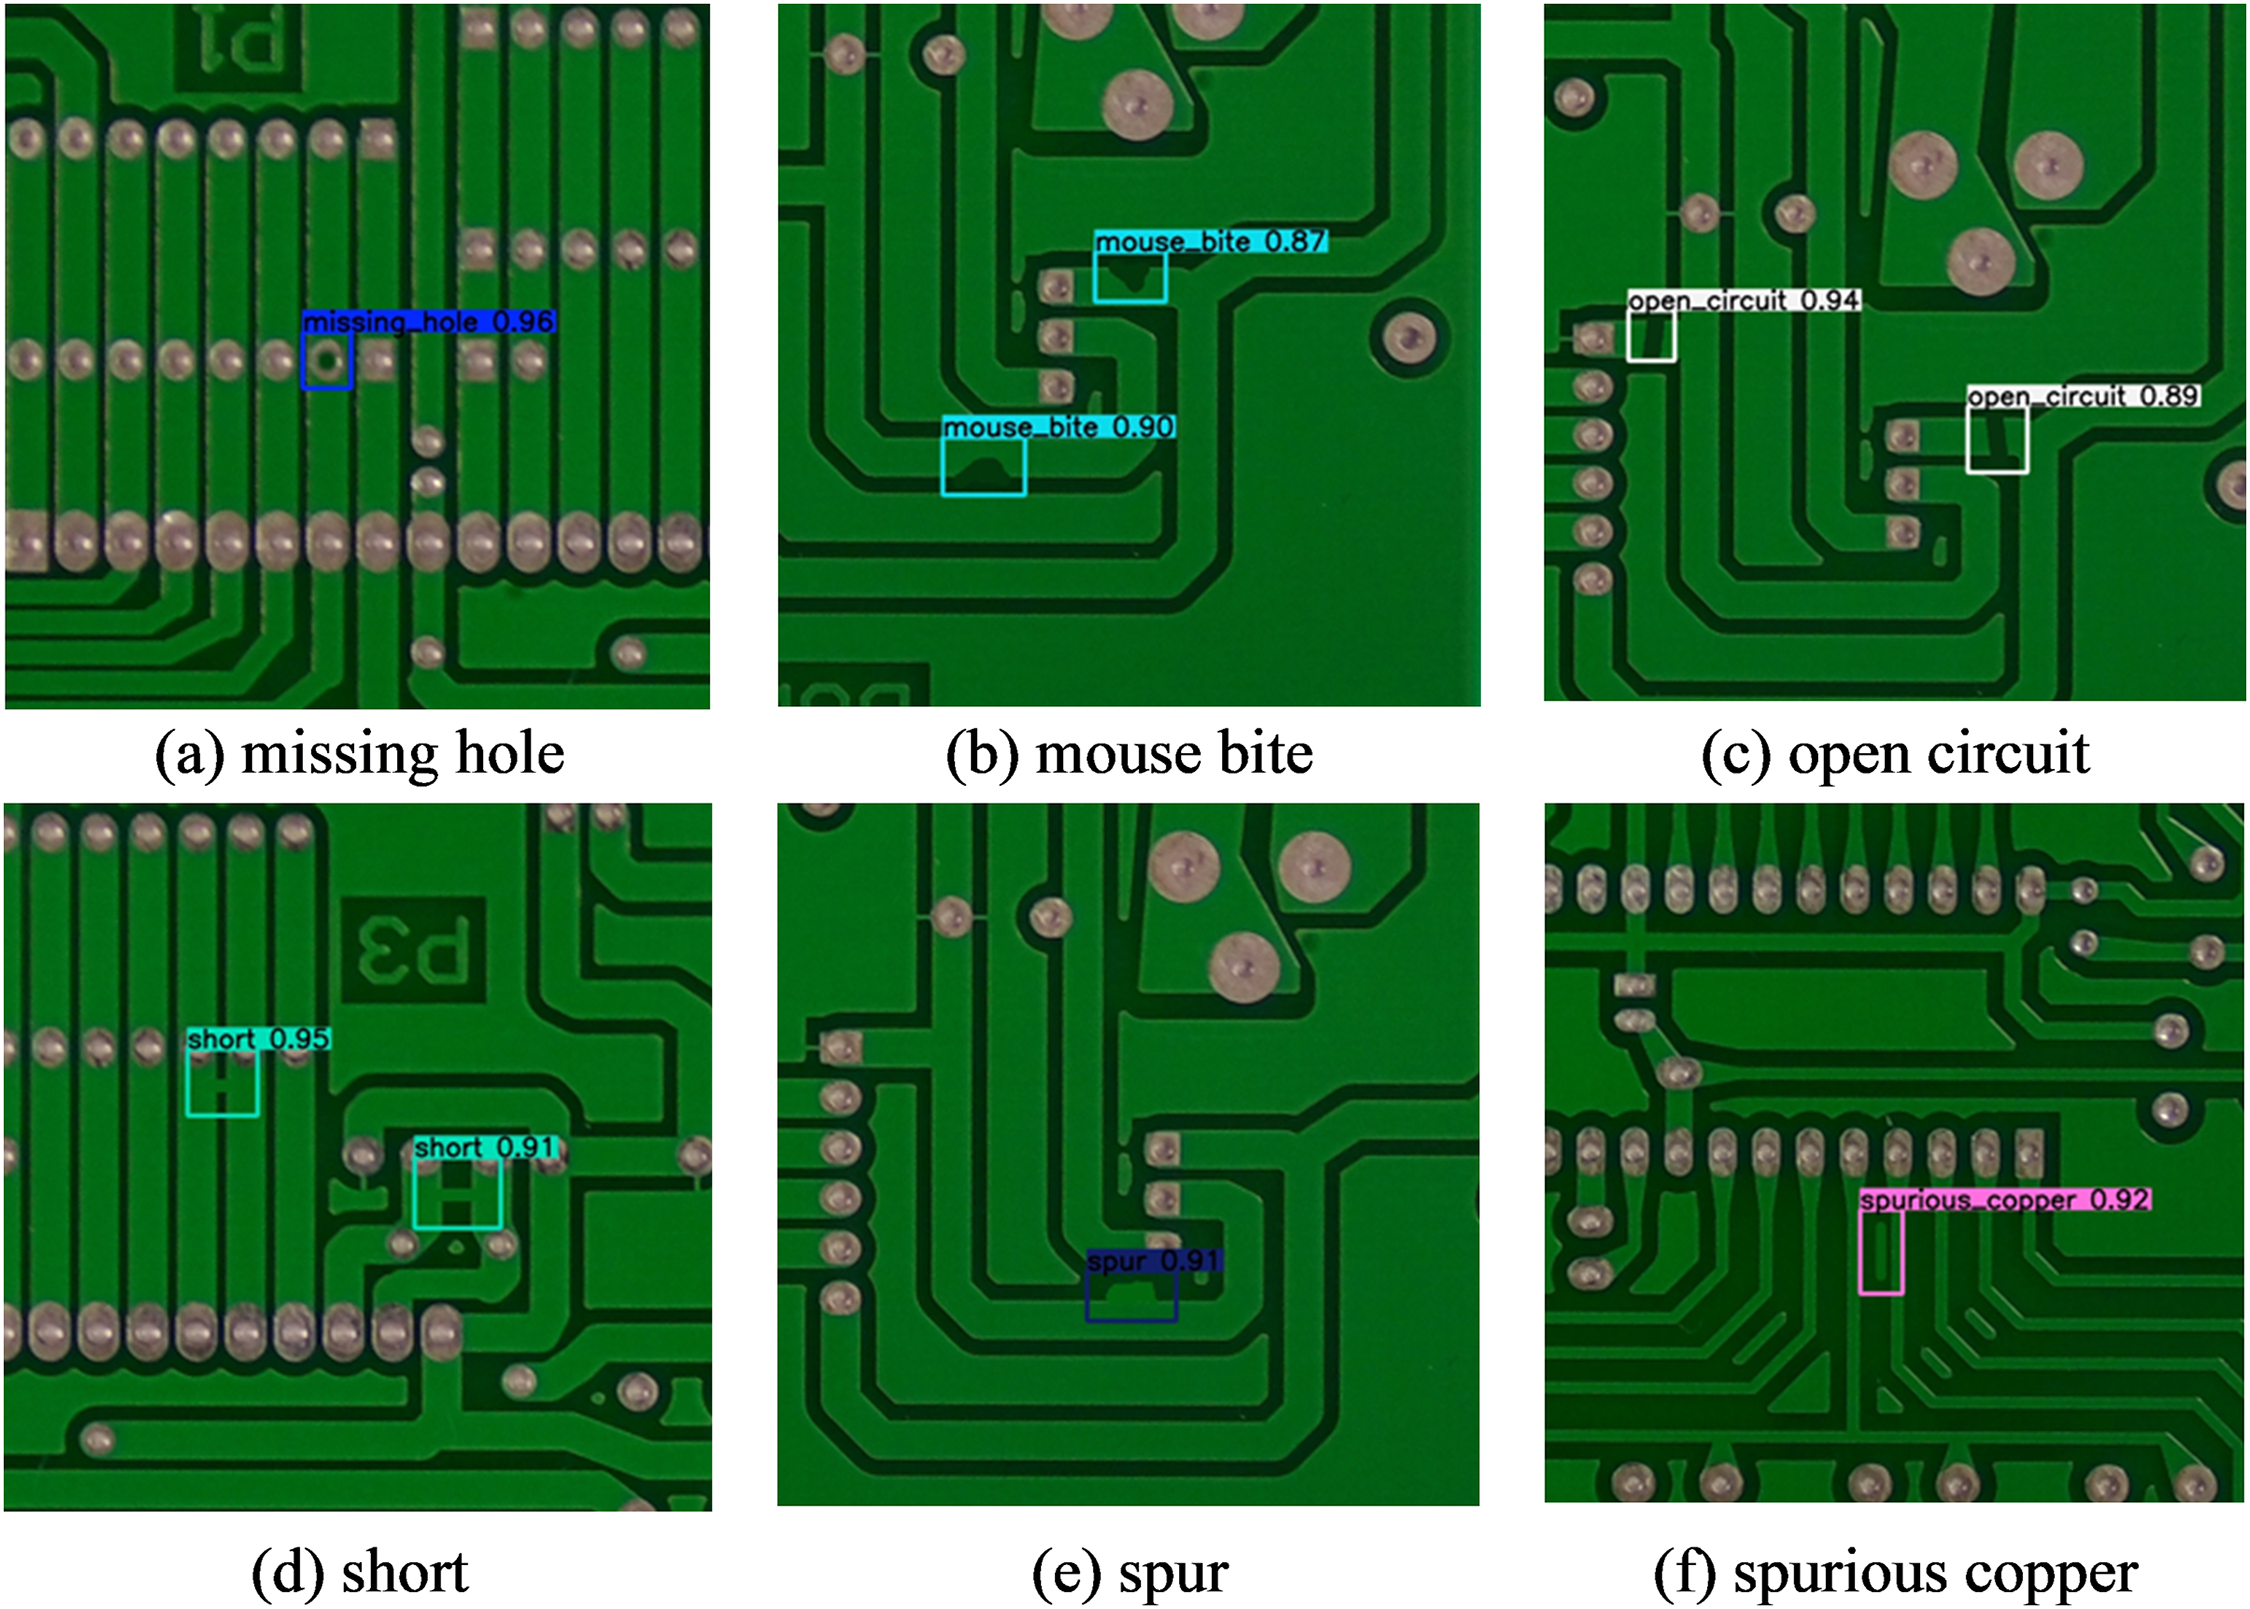
Figure 11: Single defect detection results for small-sized (200 × 200) images
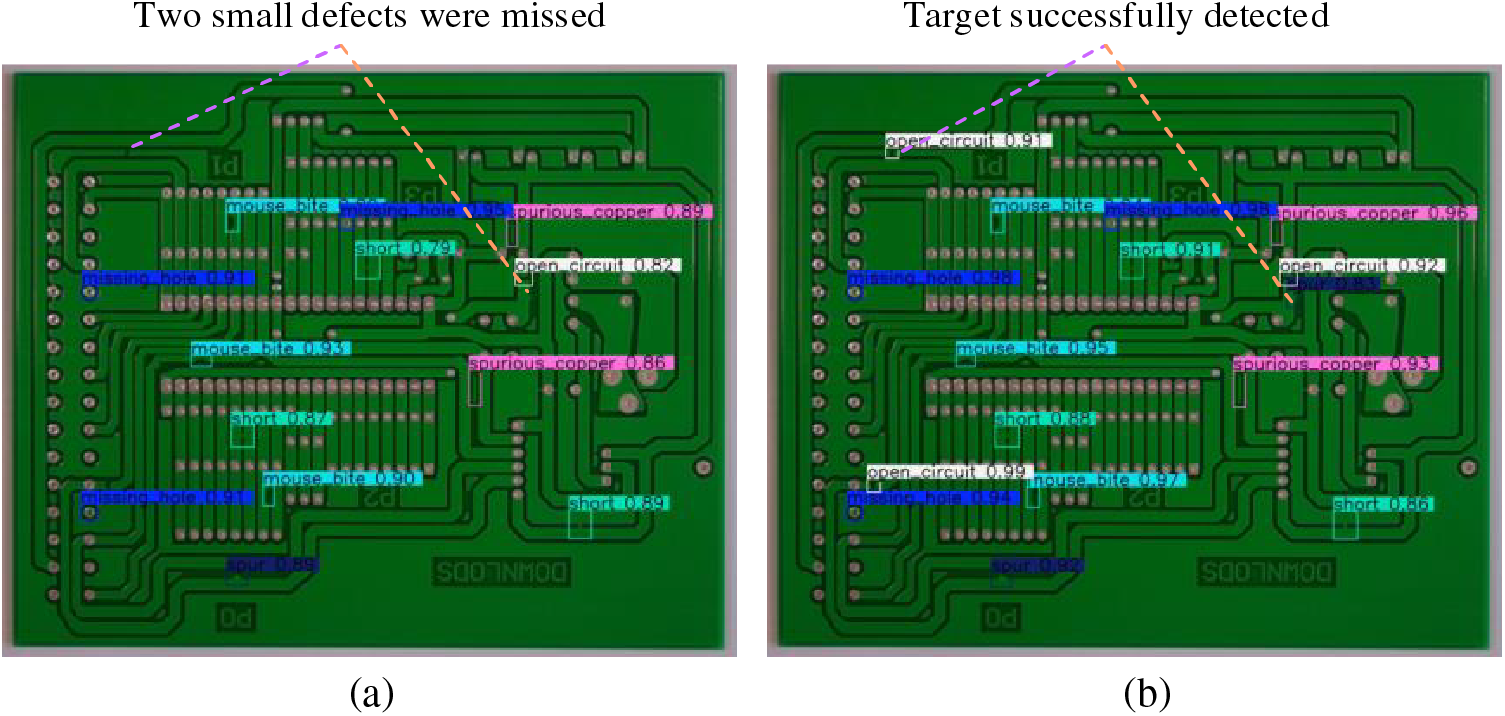
Figure 12: The detection results of YOLOv5-S and YOLO-RLC on multi-class defect images. (a) YOLOv5-S test result. (b) YOLO-RLC test result
4.3.2 Comparison Results between YOLO-RLC Algorithm and Other Typical Object Detection Algorithms Based on Dataset PKU Market PCB
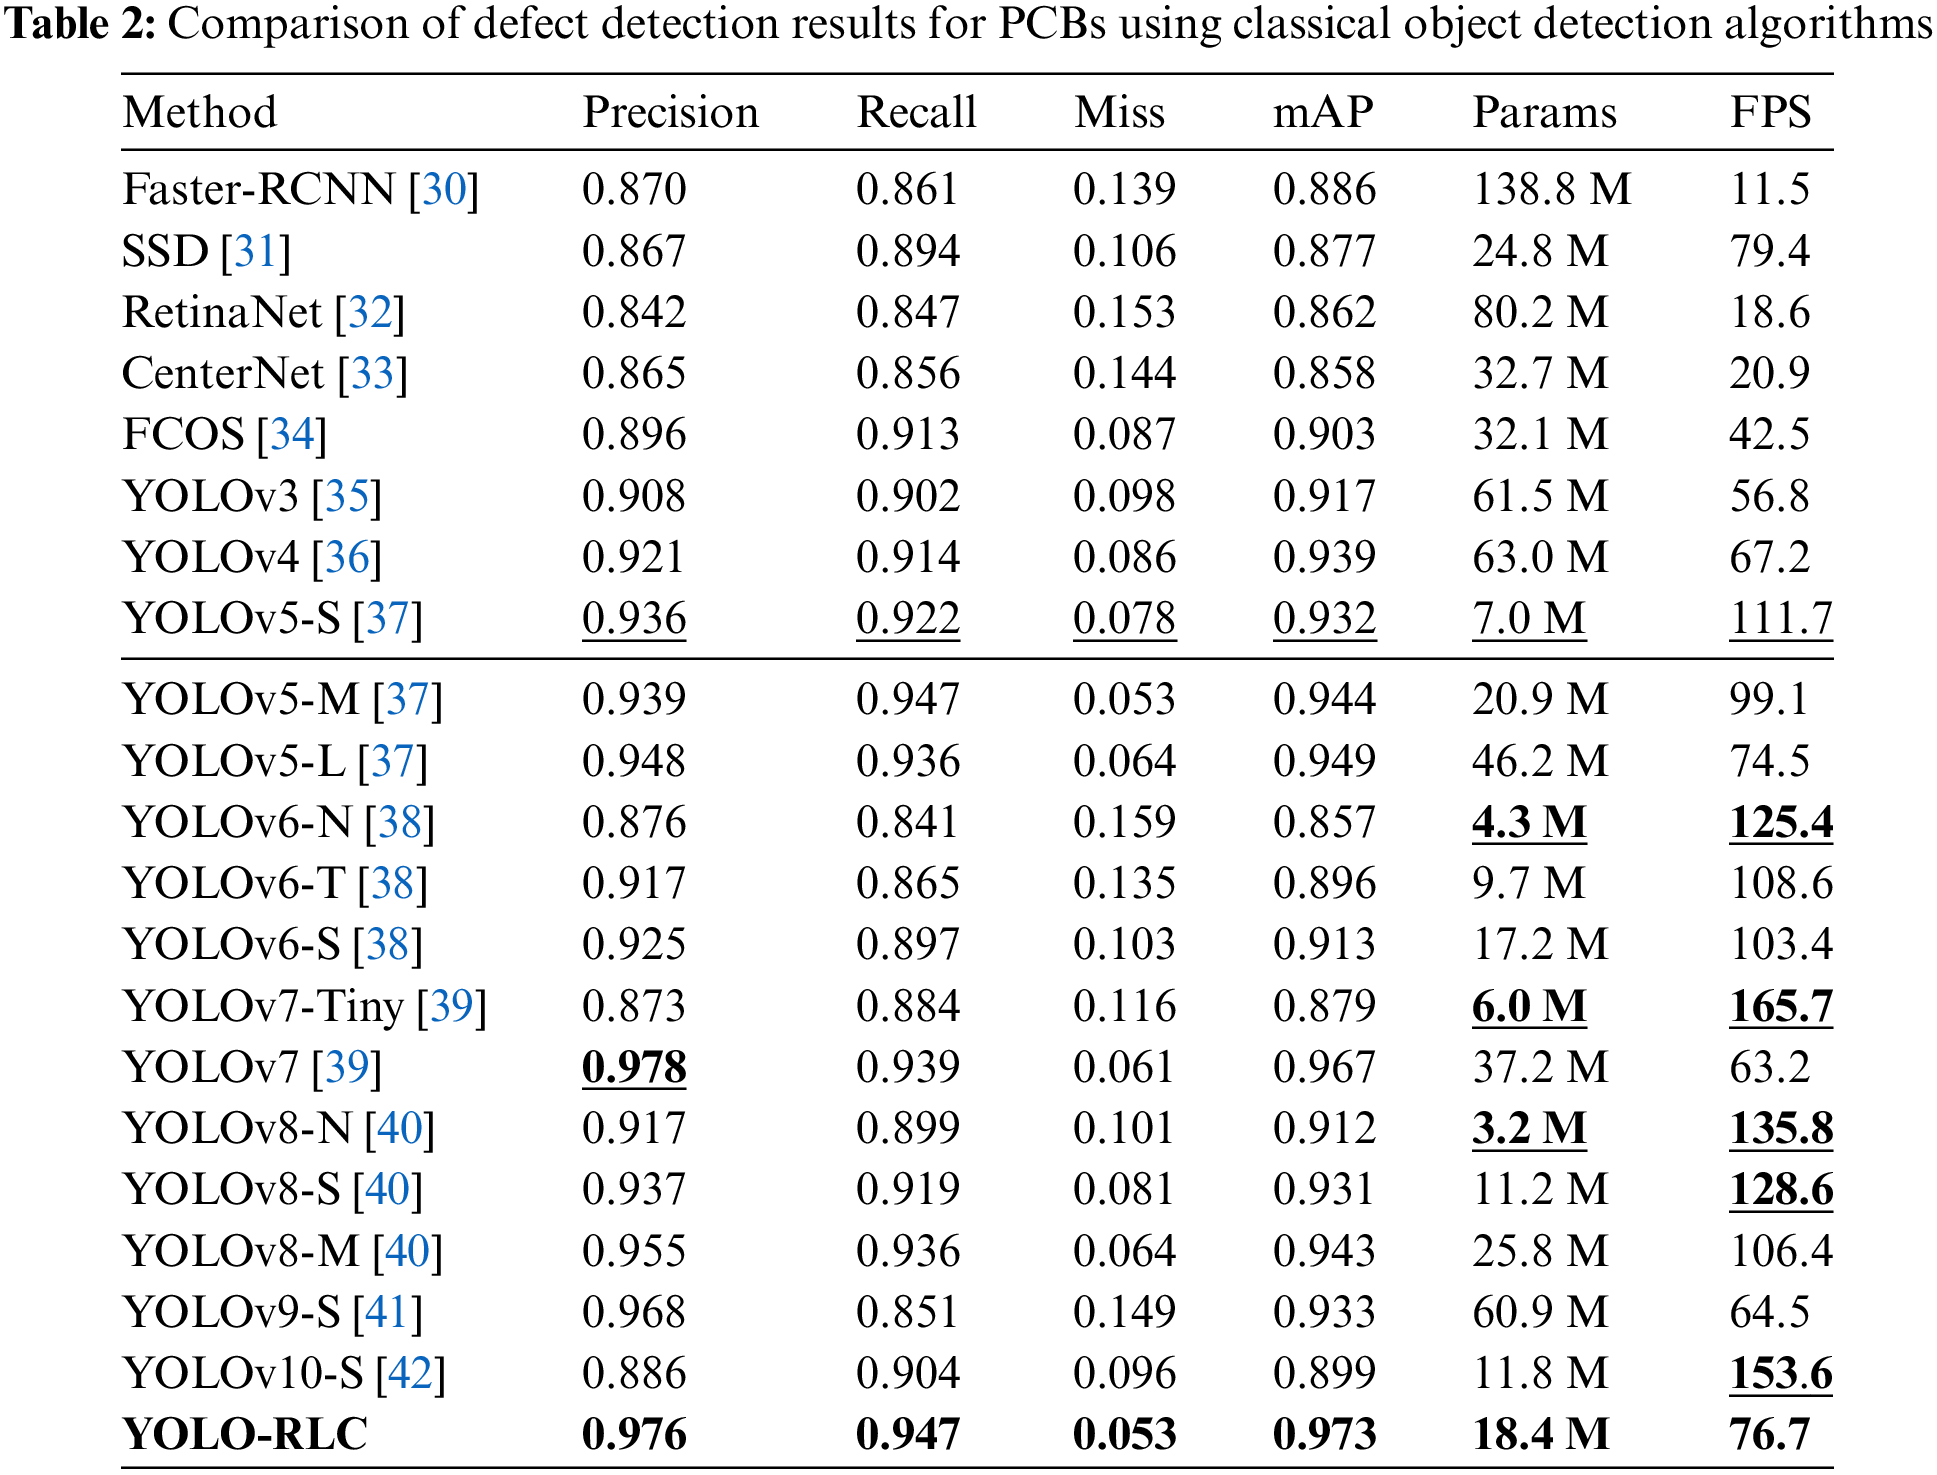
We compared the defect detection results of several typical PCB object detection models, and the specific comparative experimental data is shown in Table 2. The comparison results show that compared with several mainstream models, YOLO-RLC has an mAP of 97.3%, which is significantly better than other object detection methods in the table. YOLO-RLC was initially improved based on YOLOv5-S, with an accuracy increase of 4 percentage points compared to the original model. In addition, from the data analysis in the table, it was found that the detection accuracy of YOLOv7 model is slightly higher than our algorithm model, but the mAP, model size, and FPS of YOLOv7s are lower than YOLO-RLC. Although YOLOv7-Tiny, YOLOv8-S, and YOLOv8-N have fewer parameters and a very fast detection speed, their detection accuracy is very poor compared to YOLO-RLC. In addition, we introduced the latest YOLO algorithms YOLOv9 and YOLOv10 for comparison. Based on the experimental results, they did not have an advantage in defect detection. We analyzed the reasons and found that YOLOv9’s innovative work is to optimize the training process, while YOLOv10 focuses more on low consumption for widespread deployment on mobile devices.
4.3.3 Comparison between Algorithm YOLO-RLC and Other Advanced Algorithms Improved on Dataset PKU-Market-PCB
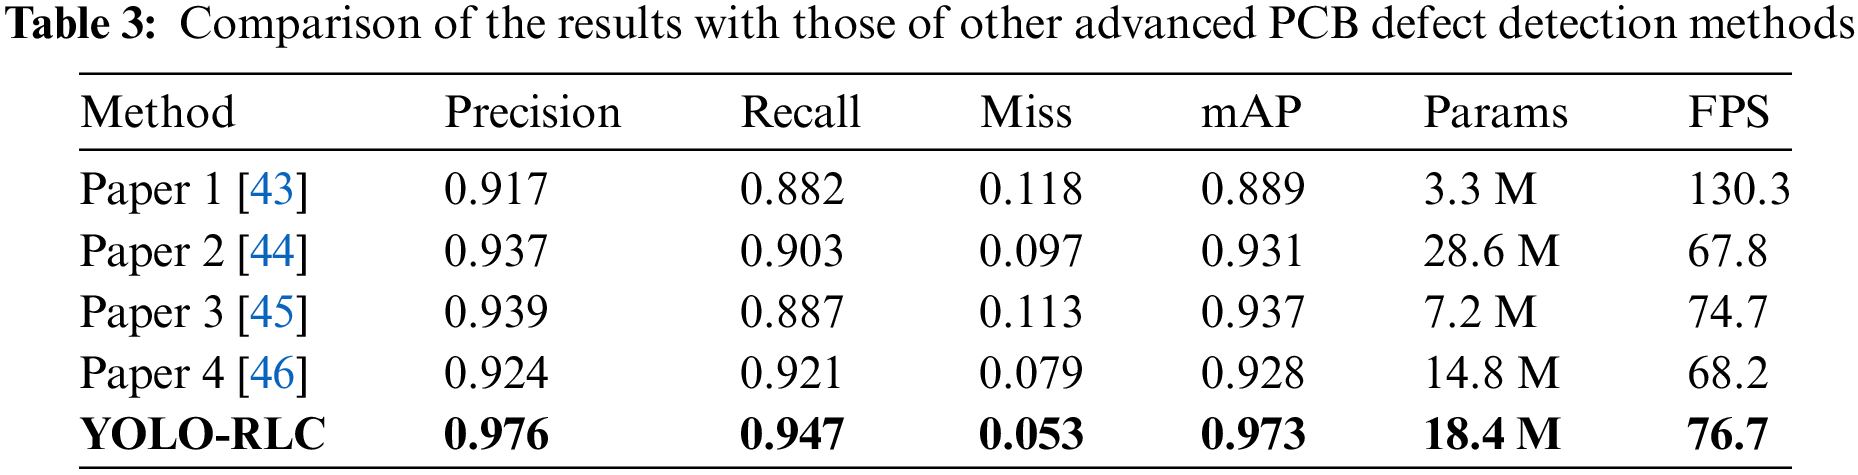
In order to evaluate the performance of YOLO-RLC in small target detection under complex texture interference, we first selected 4 advanced models Paper 1 [43], Paper 2 [44], Paper 3 [45], Paper 4 [46] that also performed well in small target detection in PCB datasets. Five algorithms’ experimental results on the PCB dataset are shown in Table 3. We can observe that the detection results of our method for five types of defects: Spur, Short, Open circuit, Spurious copper, and Missing hole, are superior to those of other algorithms. Among them, the detection performance for the “Mouse bite” defect type is inferior to that of the algorithm presented in Paper 4, but it is comparable to the others. From the perspective of the comprehensive indicator MAP (mean average precision), it is significantly better than that of the other algorithms listed in the table. Compared with the algorithm proposed in Paper 1, our algorithm has some shortcomings in FPS (frame rate per second). However, the algorithm proposed in Paper 1 showed lower accuracy, with a MAP value of only 88.9%, while our algorithm achieved 97.3%. The algorithms proposed in Paper 2, Paper 3, and Paper 4 are on par with our algorithm in terms of FPS, but our algorithm accuracy is significantly better.
4.4 Performance of Algorithm YOLO-RLC on Dataset PKU-Market-PCB
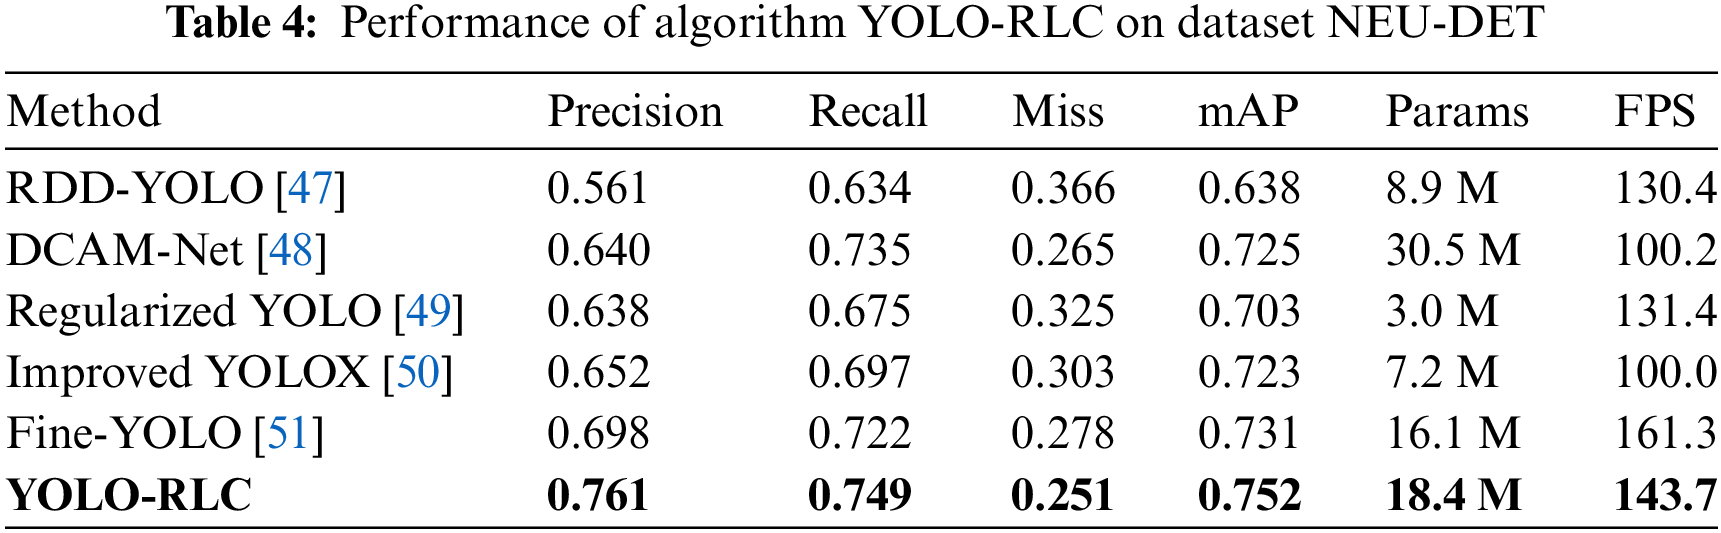
To comprehensively evaluate the scalability of YOLO-RLC on datasets in different fields and the effectiveness of the proposed improvements in handling complex environments and detecting small-sized targets. This article selected the NEU-DET dataset released by Northeastern University for comparative analysis. The NEU-DET dataset is a publicly available dataset that can be accessed through the following address: http://faculty.neu.edu.cn/songkechen/zh_CN/zdylm/263270/list/ (accessed on 02 April 2024). This dataset considers 1800 surface defect images of hot rolled strip steel, including six different types of defects (cracking, inclusion, patches, pitched surface, rolled-in-scale, and scratches). The same dataset is carefully divided into training, validation, and testing sets in a ratio of 8:1:1. No rotation, random cropping, or other methods were used to expand the dataset. Used Mosaic data augmentation technology and MixUp data augmentation technology. Examples of these 6 defects are shown in Fig. 13.

Figure 13: Example of the NEU-DET dataset
Conduct experiments using the NEU-DET dataset and compare the experimental results with the recently proposed model for defect detection. As shown in Table 4, the robust performance of our model in the field of small target defect detection has been verified. Note that our algorithm significantly improves detection while maintaining detection speed.
The ablation experiment was conducted on the Printed Circuit Board defect dataset to evaluate the effectiveness of each improvement, and the results are shown in Table 5. Starting from the YOLOv5-S model, the key modules introduced or constructed were compared. The research results showed that using RLCNet as the backbone network directly increased the mAP value by one percentage point, demonstrating the advantage of expanding the perspective brought by the large core network. On this basis, combined with the BiFPN architecture, the main framework of the algorithm was formed, with an accuracy of 95.9%.
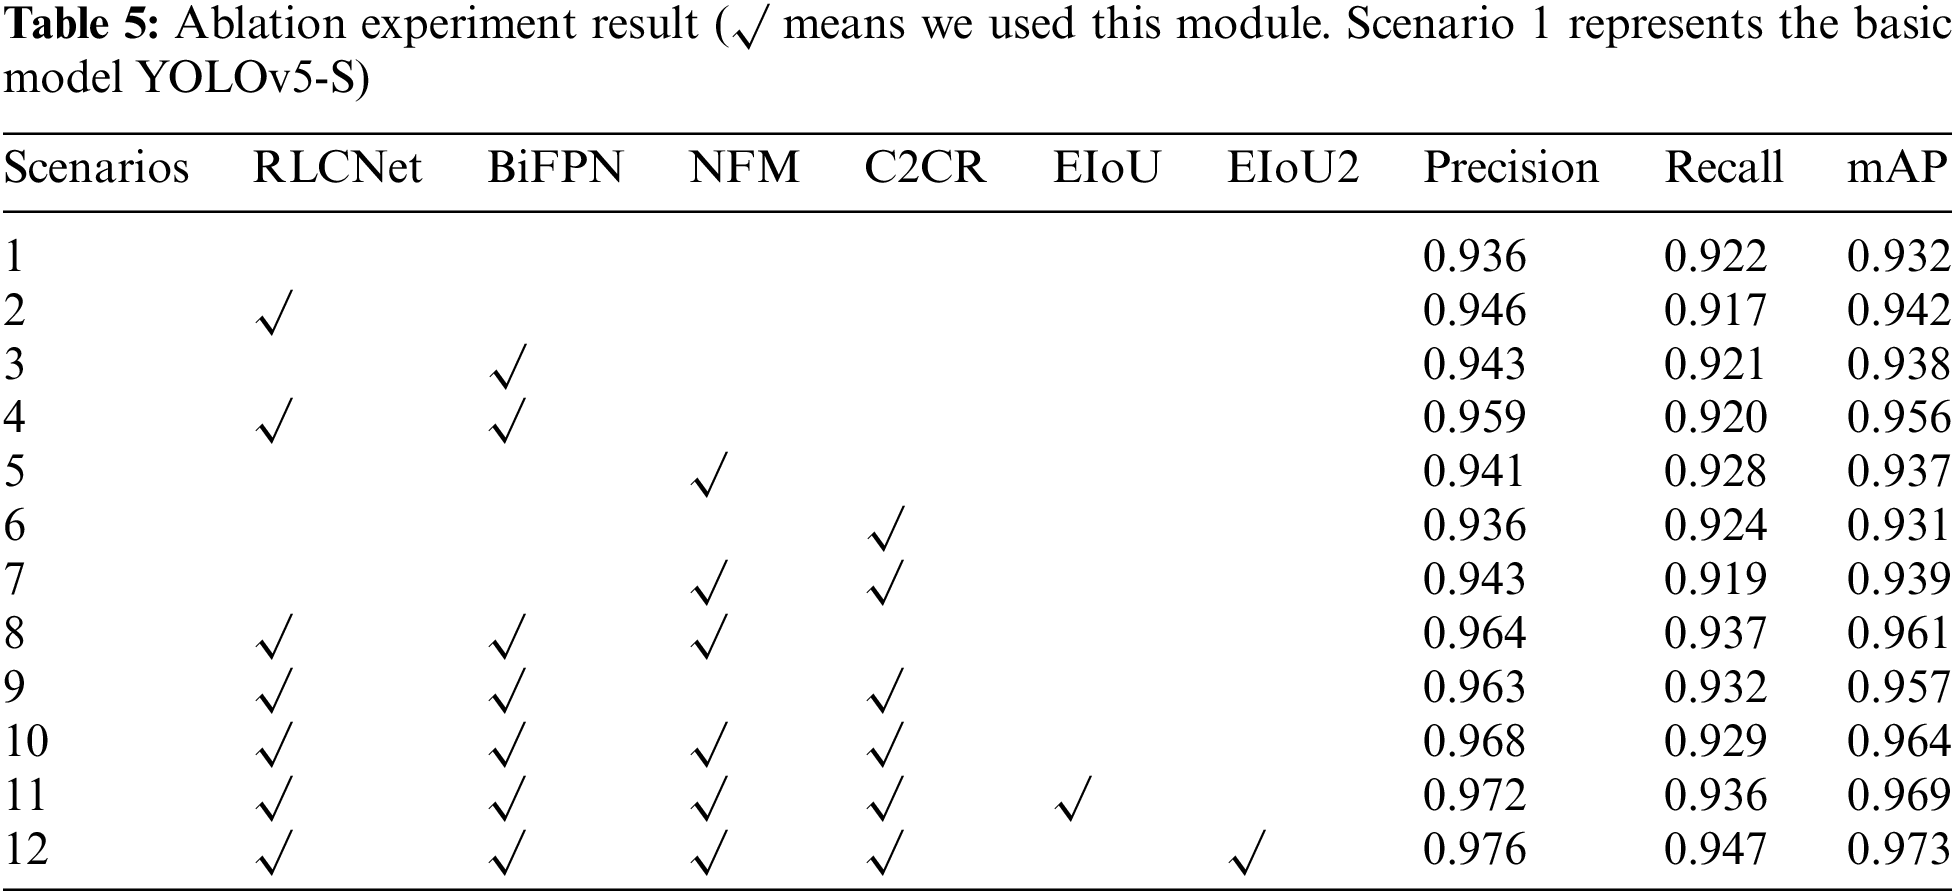
Both Scheme 5 and Scheme 8 have verified that threshold noise matching to some extent weakens irrelevant information brought by backbone branches and improves accuracy. In Scheme 6, YOLOv5-S replaces the C3 module with C2CR separately, which does not significantly improve the detection results. This may be due to the incompatibility of the C2CR module with the YOLOv5-S framework, or it may not have a significant effect on specific tasks. However, when used in combination with the NMS module, there is a significant improvement.
In addition, we first introduced EIoU to replace CIoU, which improved accuracy and mAP by 0.4% and 0.5%, respectively. Based on the clear definition of the advantages brought by aspect ratio, we improved EIoU to EIoU2 as a loss of localization specificity, resulting in an increase of 0.4% in both accuracy and mAP values.
Based on the above experimental results and analysis, it can be proven that the YOLO-RLC algorithm has significant high-precision detection performance for PCB defect detection. Specifically, in Fig. 12, we analyzed the defect of the open circuit lost by YOLOv5-S, which may be due to the insufficient effective field of view and the neglect of small feature information on image edges. However, we analyzed the loss of another target. As the target is located in a relatively dense area, noise affects the detection performance of YOLOv5-S. In contrast, our YOLO-RLC can successfully detect defects through noise filtering and feature enhancement in feature fusion. From Tables 2 and 3, it can be seen that typical object detection algorithms and advanced PCB defect detection algorithms lack accuracy in detecting subtle target objects. Even though some algorithms have very fast detection speeds, lightweight processes can seriously sacrifice feature extraction capabilities. Note that the auxiliary validation conducted on the NEU-DET dataset demonstrated the excellent detection performance of YOLO-RLC, demonstrating its expansion in defect detection in other fields.
Although our proposed method has achieved excellent results, there are still some defects that are not accurately detected. We pulled through the failure cases and identified three main reasons why these test results were unsatisfactory. First, the defect is an area, when the defect area is very small, the inconsistency within the defect makes it difficult to distinguish each defect in stance. Second, complex background interference makes it difficult to distinguish defect categories. Spur-type defects are very similar to Spurious copper defects when they are close to normal copper wires, leading to false detections. In addition, when the defect is at the zero boundary between the short circuit and non-short circuit, it is easy to be mistakenly detected as a short-type defect.
This article proposes a high-performance convolutional architecture, abbreviated as YOLO-RLC, for defect detection in PCBs. YOLO-RLC consists of three functional units: backbone network, feature fusion module, and detection head. Specifically, the YOLO-RLC backbone network combines large kernel convolution with small kernel convolution, and the backbone network introduces deep convolution, effectively reducing the problem of large parameter quantities caused by large kernel networks. The “shortcut” technique is used reasonably to solve the problem of shallow feature loss caused by increasing model depth. In addition, the backbone network combines multi-scale structure reparameterization technology, focusing on highlighting the differences in defect textures and improving the perception ability of the receptive field for defect detection in downstream tasks. Based on the feature fusion module of YOLOv5-S, the importance of channel features at different scales is studied, and combined with a powerful noise filtering module, task-oriented feature information can be focused on. In addition, design a feature enhancement module to verify the differences between different channel information and improve the quality of deep features. In addition, simplifying the calculation of localization loss alleviates the problem of inaccurate localization caused by specific target box position information. In addition, design high-resolution detection heads to improve the extraction quality of extremely small sizes. The experimental results show that the YOLOv5-RLC algorithm performs well and is competitive, achieving 97.3% mAP on the PCB dataset, 4.1% higher than YOLOv5-S, with an average accuracy of 97.6% and only 18.4 M parameter count. The comparative test also proves the practicability and progressiveness of YOLO-RLC in the small target defect detection task.
In future research, we will explore new advanced technologies to further improve the accuracy of defect detection. Specifically, first, we will study super-resolution technology to improve the detection of surface defects on PCBs with extremely small dimensions and complex background interference. Secondly, we will explore universally applicable methods for defect detection in other fields and explore weakly super-vised learning architectures to alleviate the need for model training with a large number of samples. Finally, we will focus on researching lightweight models to improve detection efficiency while maintaining high-accuracy detection.
Acknowledgement: Thank you to our researchers for their collaboration and technical assistance.
Funding Statement: This work was supported by the Ministry of Education Humanities and Social Science Research Project (No. 23YJAZH034), The Postgraduate Research and Practice Innovation Program of Jiangsu Province (Nos. SJCX24_2147, SJCX24_2148), National Computer Basic Education Research Project in Higher Education Institutions (Nos. 2024-AFCEC-056, 2024-AFCEC-057), Enterprise Collaboration Project (Nos. Z421A22349, Z421A22304, Z421A210045).
Author Contributions: Yuanyuan Wang developed the experimental plan and methodology. Yuanyuan Wang and Jialong Huang developed the model and performed the experiments, Md Sharid Kayes Dipu analyzed the experimental effect, Shangbing Gao and Haiyan Zhang performed the statistical analysis and figure generation, Pinrong Lv and Hu Zhao conducted the literature survey and data collection. All authors reviewed the results and approved the final version of the manuscript.
Availability of Data and Materials: All data generated or analyzed during this study are available. The PKU-Market-PCB dataset’s link: https://robotics.pkusz.edu.cn/resources/dataset/ (accessed on 16 December 2023). The NEU-DET dataset’s link: http://faculty.neu.edu.cn/songkechen/zh_CN/zdylm/263270/list/ (accessed on 19 February 2024). The code’s link: https://github.com/hjllovecv/Yolov5-ResCL (accessed on 19 February 2024).
Ethics Approval: Not applicable.
Conflicts of Interest: The authors declare that they have no conflicts of interest to report regarding the present study.
References
1. J. Onshaunjit and J. Srinonchat, “Algorithmic scheme for concurrent detection and classification of printed circuit board defects,” Comput. Mater. Contin., vol. 71, no. 1, pp. 355–367, Jan. 2022. doi: 10.32604/cmc.2022.017698. [Google Scholar] [CrossRef]
2. Y. Liu, H. Wu, Y. Xu, X. Liu, and X. Yu, “Automatic PCB sample generation and defect detection based on ControlNet and swin transformer,” Sensors, vol. 24, 2024, Art. no. 3473. doi: 10.3390/s24113473. [Google Scholar] [PubMed] [CrossRef]
3. D. Scherer, A. Müller, and S. Behnke, “Evaluation of pooling operations in convolutional architec-tures for object recognition,” in Proc. ICNN, Thessaloniki, Greece, Sep. 2010, pp. 92–101. [Google Scholar]
4. L. Li et al., “An interdigital electrode probe for detection, localization and evaluation of surface notch-type damage in metals,” Sensors, vol. 18, 2018, Art. no. 371. doi: 10.3390/s18020371. [Google Scholar] [PubMed] [CrossRef]
5. Y. Yang and Y. Xia, “Precision improvement of deep learning algorithm for PCB defect detection,” Electro Meas. Instru., vol. 37, pp. 1–10, 2023. [Google Scholar]
6. Y. Liu, C. Gao, B. Song, and S. Liang, “A surface defect detection algorithm for PCB based on MobileViT-YOLO,” in 2023 China Autom. Congress (CAC), Chongqing, China, 2023, pp. 6318–6323. doi: 10.1109/CAC59555.2023.10450181. [Google Scholar] [CrossRef]
7. M. Yan, Y. Fan, Y. Jiang, and Z. Fang, “A fast detection algorithm for surface defects of bare PCB based on YOLOv8,” in 2023 3rd Int. Conf. Electronic Inform. Eng. Comput. Commun. (EIECC), Wuhan, China, 2023, pp. 559–564. doi: 10.1109/EIECC60864.20. [Google Scholar] [CrossRef]
8. Y. Pan, L. Zhang, and Y. Zhang, “Rapid detection of PCB defects based on YOLOx-Plus and FPGA,” IEEE Access, vol. 12, pp. 61343–61358, 2024. doi: 10.1109/ACCESS.2024.3387947. [Google Scholar] [CrossRef]
9. A. Liso et al., “A review of deep learning based anomaly detection strategies in Industry 4.0 focused on application fields, sensing equipment and algorithms,” IEEE Access, vol. 12, pp. 93911–93923, 2024. doi: 10.1109/ACCESS.2024.3424488. [Google Scholar] [CrossRef]
10. H. Tang, T. Lan, D. Hao, and L. Zhang, “Enhancing defect prediction with static-defect analysis,” in Proc. Internetware, Asia-Pacific, Nov. 2015, pp. 43–51. doi: 10.1145/2875913.2875922. [Google Scholar] [CrossRef]
11. F. G. Bulnes, D. F. García, F. J. De la Calle, R. Usamentiaga, and J. Molleda, “A non-invasive technique for online defect detection on steel strip surfaces,” Nonde. Eval., vol. 35, pp. 1–18, 2023. doi: 10.1007/s10921-016-0370-8. [Google Scholar] [CrossRef]
12. N. Sano, Y. Mori, and T. Suzuki, “Defect detection using two-dimensional moving range filter and unanimous vote among color component classifiers,” in Proc. MISNC, SocialInfor-Matics, Aug. 2016, pp. 1–4. doi: 10.1145/2955129.2955137. [Google Scholar] [CrossRef]
13. Z. Zhao, K. Gui, and P. Wang, “Fabric defect detection based on cascade faster R-CNN,” in Proc. 4th Int. Conf. Comput. Sci. Appl. Eng., Oct. 2020, pp. 1–6. doi: 10.1145/3424978.3425080. [Google Scholar] [CrossRef]
14. H. Huang, X. Tang, F. Wen, and X. Jin, “Small object detection method with shallow feature fusion network for chip surface defect detection,” Sci. Rep., vol. 12, no. 1, 2022, Art. no. 3914. doi: 10.1038/s41598-022-07654-x. [Google Scholar] [PubMed] [CrossRef]
15. K. Hu, E. W. Zhang, M. Xia, H. Q. Wang, X. L. Ye and H. F. Lin, “Cross-dimension feature attention aggregation network for cloud and snow recognition of high satellite images,” Neural. Comput. Appl., vol. 36, pp. 7779–7798, 2024. doi: 10.1007/s00521-024-09477-5. [Google Scholar] [CrossRef]
16. S. Li, S. Guo, Z. Han, C. Kou, B. Huang and M. Luan, “Aluminum surface defect detect-ion method based on a lightweight YOLOv4 network,” Sci. Rep., vol. 13, no. 1, 2023, Art. no. 11077. doi: 10.1038/s41598-023-38085-x. [Google Scholar] [PubMed] [CrossRef]
17. Z. Liu, J. Wang, C. Li, B. Li, and R. Yang, “Fabric defect detection using fully convolutional network with attention mechanism,” in Proc. 2019 8th Int. Conf. Comput. Pattern Recognit., Oct. 2019, pp. 134–140. doi: 10.1145/3373509.3373552. [Google Scholar] [CrossRef]
18. S. Wen, Y. Tao, and J. Chen, “Defect detection for mobile phone cases based on improved yolo model,” in Proc. 2021 7th Int. Conf. Comput. Artif. Intell., Apr. 2021, pp. 28–38. doi: 10.1145/3467707.3467712. [Google Scholar] [CrossRef]
19. K. Hu et al., “Overview of temporal action detection based on deep learning,” Artifi Intell. Rev., vol. 57, 2024, Art. no. 26. doi: 10.1007/s10462-023-10650-w. [Google Scholar] [CrossRef]
20. Y. Zang, J. Zhang, and M. M. Billah, “Defect detection of flexible circuit board based on convolutional neural network,” presented at 2nd Int. Conf. Comput. Data Sci., Nov. 1–5, 2021. [Google Scholar]
21. X. Ding, X. Zhang, J. Han, and G. Ding, “Scaling up your kernels to 31 × 31: Revisiting large kernel design in CNNs,” in Proc. IEEE/CVF Conf. Comput. Vis. Pattern Recognit., 2022, pp. 11963–11975. [Google Scholar]
22. M. Tan, R. Pang, and Q. V. Le, “EfficientDet: Scalable and efficient object detection,” in Proc. IEEE/CVF. Conf. Comput. Vis. Pattern Recognit., 2020, pp. 10781–10790. [Google Scholar]
23. X. Ding, X. Zhang, N. Ma, J. Han, G. Ding and G. J. Sun, “RepVGG: Making VGG-style ConvNets great again,” in Proc. IEEE/CVF. Conf. Comput. Vis. Pattern Recognit., 2021, pp. 13733–13742. [Google Scholar]
24. H. Huang, X. Zhou, J. Cao, R. He, and T. Tan, “Vision transformer with super token sampling,” in Proc. IEEE/CVF. Conf. Comput. Vis. Pattern Recognit., 2023, pp. 22690–22699. [Google Scholar]
25. F. Chollet, “Xception: Deep learning with depthwise separable convolutions,” in Proc. IEEE. Conf. Comput. Vis. Pattern Recognit., 2018, pp. 1251–1258. [Google Scholar]
26. Y. Wu and K. He, “Group normalization,” in Proc. Eur. Conf. Comput. Vis., 2018, pp. 3–19. [Google Scholar]
27. K. He, X. Zhang, S. Ren, and J. Sun, “Deep residual learning for image recognition,” in Proc. IEEE. Conf. Comput. Vis. Pattern Recognit., 2016, pp. 770–778. [Google Scholar]
28. Z. Zheng et al., “Enhancing geometric factors in model learning and inference for object detection and instance segmentation,” IEEE Trans. Cyber., vol. 52, no. 8, pp. 8574–8586, 2021. doi: 10.1109/TCYB.2021.3095305. [Google Scholar] [PubMed] [CrossRef]
29. Y. F. Zhang, W. Ren, Z. Zhang, Z. Jia, L. Wang and T. Tan, “Focal and efficient IOU loss for accurate bounding box regression,” Neurocomputing, vol. 506, pp. 146–157, 2022. doi: 10.1016/j.neucom.2022.07.042. [Google Scholar] [CrossRef]
30. S. Ren, K. He, R. Girshick, and J. Sun, “Faster R-CNN: Towards real-time object detection with region proposal networks,” IEEE Trans. Pattern. Anal. Mach. Intell., vol. 39, pp. 1137–1149, 2017. doi: 10.1109/TPAMI.2016.2577031. [Google Scholar] [PubMed] [CrossRef]
31. W. Liu et al., “SSD: Single shot MultiBox detector,” in Proc ECCV, Eur. Conf., Amsterdam, The Netherlands, Oct. 2016, pp. 11–14. [Google Scholar]
32. T. Y. Lin, P. Goyal, R. Girshick, K. He, and K. P. Dollar, “Focal loss for dense object detection,” in Proc. IEEE Int. Conf. Comput. Vis., Venice, Italy, Oct. 2017, pp. 22–29. [Google Scholar]
33. K. Duan, S. Bai, L. Xie, H. Qi, Q. Huang and Q. Tian, “CenterNet: Keypoint triplets for object detection,” in Proc. IEEE/CVF. ICCV, Seoul, Republic of Korea, Nov. 2019, pp. 6569–6578. [Google Scholar]
34. Z. Tian, C. Shen, H. Chen, and T. He, “FCOS: A simple and strong anchor-free object detector,” IEEE Trans. Pattern. Anal. Mach. Intell., vol. 44, pp. 1922–1933, 2022. [Google Scholar] [PubMed]
35. L. Zhao and S. Li, “Object detection algorithm based on improved YOLOv3,” Electronics, vol. 9, no. 3, 2020, Art. no. 537. doi: 10.3390/electronics9030537. [Google Scholar] [CrossRef]
36. J. Yu and W. Zhang, “Face mask wearing detection algorithm based on improved YOLO-v4,” Sensors, vol. 21, no. 9, 2021, Art. no. 3263. doi: 10.3390/s21093263. [Google Scholar] [PubMed] [CrossRef]
37. G. Jocher et al., “ultralytics/yolov5: v5. 0-YOLOv5-P6 1280 models, AWS, Supervisely and YouTube integrations,” Zenodo, Apr. 2021. doi: 10.5281/zenodo.4679653. [Google Scholar] [CrossRef]
38. C. Li et al., “YOLOv6: A single-stage object detection framework for industrial applications,” 2022, arXiv:2209.02976. [Google Scholar]
39. C. Y. Wang, A. Bochkovskiy, and H. Y. M. Liao, “YOLOv7: Trainable bag-of-freebies sets new state-of-the-art for real-time object detectors,” in Proc. IEEE/CVF. Conf. Comput. Vis. Pattern Recognit., Vancouver, BC, Canada, Jun. 2023, pp. 7464–7475. [Google Scholar]
40. M. Hussain, “YOLOv1 to v8: Unveiling each variant—A comprehensive review of YOLO,” IEEE Access, vol. 12, pp. 42816–42833, 2024. doi: 10.1109/ACCESS.2024.3378568. [Google Scholar] [CrossRef]
41. C. Y. Wang, I. H. Yeh, and H. Y. M. Liao, “YOLOv9: Learning what you want to learn using programmable gradient information,” 2024, arXiv:2402.13616. [Google Scholar]
42. A. Wang et al., “YOLOv10: Real-time end-to-end object detection,” 2024, arXiv:2405.14458. [Google Scholar]
43. M. Ye, H. Wang, and H. Xiao, “Light-YOLOv5: A lightweight algorithm for improved YOLOv5 in PCB defect detection,” presented at 2023 IEEE 2nd Int. Conf. Electr. Eng., Big Data Algorithms, IEEE, Feb. 2023, pp. 523–528. doi: 10.1109/EEBDA56825.2023.10090731. [Google Scholar] [CrossRef]
44. M. Liang, J. Wu, and H. Cao, “Research on PCB small target defect detection based on improved YOLOv5,” in 2022 Int. Conf. Sens., Meas. Data Anal. Era Artif. Intell., IEEE, Nov. 2022, pp. 1–5. doi: 10.1109/ICSMD57530.2022.10058458. [Google Scholar] [CrossRef]
45. J. Tang, S. Liu, D. Zhao, L. Tang, L. W. Zou and B. Zheng, “PCB-YOLO: An improved detection algorithm of PCB surface defects based on YOLOv5,” Sustainability, vol. 13, no. 7, 2023, Art. no. 5963. doi: 10.3390/su15075963. [Google Scholar] [CrossRef]
46. K. Xia et al., “Global contextual attention augmented YOLO with ConvMixer prediction heads for PCB surface defect detection,” Sci. Rep., vol. 13, no. 1, 2023, Art. no. 9805. doi: 10.1038/s41598-023-36854-2. [Google Scholar] [PubMed] [CrossRef]
47. C. Zhao, X. Shu, X. Yan, X. Zuo, and F. Zhu, “RDD-YOLO: A modified YOLO for detection of steel surface defects,” Measurement, vol. 214, 2023, Art. no. 112776. doi: 10.1016/j.measurement.2023.112776. [Google Scholar] [CrossRef]
48. H. Chen, Y. Du, Y. Fu, J. Zhu, and H. Zeng, “DCAM-Net: A rapid detection network for strip steel surface defects based on deformable convolution and attention mechanism,” IEEE Trans. Instrum. Meas., vol. 72, 2023, Art. no. 5005312. doi: 10.1109/TIM.2023.3238698. [Google Scholar] [CrossRef]
49. Y. Zou and Y. Fan, “An infrared image defect detection method for steel based on regularized YOLO,” Sensors, vol. 24, 2024, Art. no. 1674. doi: 10.3390/s24051674. [Google Scholar] [PubMed] [CrossRef]
50. C. Li, A. Xu, Q. Zhang, and Y. Cai, “Steel surface defect detection method based on improved YOLOX,” IEEE Access, vol. 12, pp. 37643–37652, 2024. doi: 10.1109/ACCESS.2024.3374869. [Google Scholar] [CrossRef]
51. Y. T. Zhou, K. Y. Cao, and J. C. Piao, “Fine-YOLO: A simplified X-ray prohibited object detection network based on feature aggre-gation and normalized wasserstein distance,” Sensors, vol. 24, no. 11, 2024, Art. no. 3588. doi: 10.3390/s24113588. [Google Scholar] [PubMed] [CrossRef]
Cite This Article
 Copyright © 2024 The Author(s). Published by Tech Science Press.
This work is licensed under a Creative Commons Attribution 4.0 International License , which permits unrestricted use, distribution, and reproduction in any medium, provided the original work is properly cited.
 Downloads
 Citation Tools