
 Submit a Paper
 Propose a Special lssue
 Open Access
ARTICLE

Diabetic Retinopathy Detection: A Hybrid Intelligent Approach
1 Department of Computer Science (CS), College of Computer Science and Information Technology (CCSIT), Imam Abdulrahman Bin Faisal University (IAU), P.O. Box 1982, Dammam, 31441, Saudi Arabia
2 Department of Computer Engineering (CE), College of Computer Science and Information Technology (CCSIT), Imam Abdulrahman Bin Faisal University (IAU), P.O. Box 1982, Dammam, 31441, Saudi Arabia
* Corresponding Author: Atta Rahman. Email:
(This article belongs to the Special Issue: Deep Learning in Medical Imaging-Disease Segmentation and Classification)
Computers, Materials & Continua 2024, 80(3), 4561-4576. https://doi.org/10.32604/cmc.2024.055106
Received 17 June 2024; Accepted 09 August 2024; Issue published 12 September 2024
 View Full Text
 Download PDF
Abstract
Diabetes is a serious health condition that can cause several issues in human body organs such as the heart and kidney as well as a serious eye disease called diabetic retinopathy (DR). Early detection and treatment are crucial to prevent complete blindness or partial vision loss. Traditional detection methods, which involve ophthalmologists examining retinal fundus images, are subjective, expensive, and time-consuming. Therefore, this study employs artificial intelligence (AI) technology to perform faster and more accurate binary classifications and determine the presence of DR. In this regard, we employed three promising machine learning models namely, support vector machine (SVM), k-nearest neighbors (KNN), and Histogram Gradient Boosting (HGB), after carefully selecting features using transfer learning on the fundus images of the Asia Pacific Tele-Ophthalmology Society (APTOS) (a standard dataset), which includes 3662 images and originally categorized DR into five levels, now simplified to a binary format: No DR and DR (Classes 1–4). The results demonstrate that the SVM model outperformed the other approaches in the literature with the same dataset, achieving an excellent accuracy of 96.9%, compared to 95.6% for both the KNN and HGB models. This approach is evaluated by medical health professionals and offers a valuable pathway for the early detection of DR and can be successfully employed as a clinical decision support system.Keywords
Diabetes can lead to a serious eye illness condition called diabetic retinopathy (DR). If left undiagnosed or untreated, DR can cause vision loss and even blindness [1]. Early detection is crucial for preventing vision impairment. However, traditional detection methods often involve ophthalmologists manually examining retinal images. This approach can be subjective, requires significant time from specialists, and is resource-heavy, particularly in regions lacking access to these experts [2]. Diabetes can damage blood vessels throughout the body, including those in the retina. When small blood vessels in the retina become blocked, fluid may leak or bleed, causing damage to the eye. In response to the blocked blood vessels, the eyes may produce new blood vessels that are less functional, increasing the risk of bleeding or leakage [3]. According to the study by [4], DR cases are forecast to rise significantly, with estimates suggesting an increase from 126.6 million in 2010 to 191.0 million by 2030. This increase is concerning, especially considering that 37 million cases of blindness are caused by DR globally, as reported by the World Health Organization (WHO) [2]. Although medical guidelines advise regular eye exams for diabetic patients, these exams often don’t happen as frequently as needed. As a result, many DR cases aren’t detected until the disease has reached more severe stages. Since existing DR treatments primarily focus on slowing or preventing vision loss, early detection through regular eye scans assisted by efficient computer systems becomes even more crucial [5].
In the last few years, the application of Artificial Intelligence (AI) has become a critical component, thanks to advancements in computing technology involving diverse Machine Learning (ML), and Deep Learning (DL) models.
The incorporation of training data into AI-powered learning algorithms has resulted in a more precise and accurate outcome, which can lead to fewer misdiagnoses and increased efficiencies. Ultimately, this can generate substantial savings in terms of time, effort, and resources [5]. This advancement is crucial for addressing the challenges of diagnosing DR and the limited accessibility of advanced imaging technologies. Leveraging AI through ML algorithms and DL models offers a promising solution. This study aims to harness AI techniques to enhance healthcare effectiveness, particularly in the early detection and management of DR. By utilizing large datasets and advanced learning algorithms, AI can significantly improve precision, reduce diagnostic errors, and optimize healthcare resource utilization. In this study, we adopt a binary classification approach to differentiate between two categories of retinal images: “No DR” (indicating no diabetic retinopathy) and “DR” (indicating diabetic retinopathy). The methodology involves utilizing a pre-trained CNN, ResNet-50, for feature extraction and classification using SVM, KNN, and Histogram Gradient Boosting (Histogram GB) classifiers. This integrated approach enhances diagnostic accuracy and efficiency, enables early intervention, and facilitates personalized treatment strategies, ultimately leading to improved healthcare outcomes for individuals at risk of diabetic retinopathy. The existing manual techniques are vulnerable to several issues such as imprecise diabetic catalogs that may result in inaccurate diagnosis. Moreover, the existing AI based techniques are vulnerable to classification error and need improvement in the accuracy of the models. Further, there is a need to employ advanced data preprocessing techniques to handle the image processing issues in this regard.
The study aims to achieve acceptable accuracy in diabetic retinopathy detection by leveraging the publicly available Asia Pacific Tele-Ophthalmology Society (APTOS) dataset. This widely recognized resource for identifying and grading diabetic retinopathy was featured on the Kaggle platform as part of a competition in 2019. Our approach shows promising potential to enhance the early detection of DR, thereby yielding improved clinical outcomes.
The rest of the paper is organized as follows: Section 2 is dedicated to related work in DR, data overview is given in Section 3. Section 4 provides the proposed methodology and results are given in Section 5. Section 6 provides discussion while Section 7 concludes the paper.
Pires et al. [6] successfully developed a reliable and accurate detector for diabetic retinopathy. CNNs were used to create the solution, including robust feature extraction augmentation, multi-resolution training, and data augmentation. Using a rigorous cross-dataset protocol intended to evaluate its generalizability, the suggested technique achieved an outstanding area under the ROC curve of 98.2% (95% CI: 97.4–98.9%). The Kaggle competition dataset was used for the training phase, and the Messidor-2 dataset was used for testing. In a study by Dekhil et al. [7], they aimed to create a tool for diagnosing DR using CNNs to categorize fundus images into five stages. To avoid overfitting, they used a dataset from the ImageNet database for pre-training the model, followed by testing with the APTOS dataset. Their CNN architecture consisted of five-stage convolutional layers, rectified linear units, pooling, and three fully connected layers. They used transfer learning to enhance generalization. Their approach resulted in 77% testing accuracy and a 78% quadratic weighted kappa score. This demonstrates promising potential for early diagnosis and staging of DR. However, their study had limitations because it relied on pre-trained models and required further validation in diverse clinical settings.
In the study on detecting DR using CNNs and red lesion localization, Zago et al. [8] aimed to enhance diagnostic accuracy while reducing model complexity. The study utilized seven different datasets in their experiments: the Standard Diabetic Retinopathy Database, Calibration Level 0 (DIARETDB0), and Calibration Level 1 (DIARETDB1), along with Kaggle, Messidor, Messidor-2, the Indian Diabetic Retinopathy Image Dataset (IDRiD), and DDR. Their methodology focused on a patch-based approach with CNNs, specifically targeting challenging examples during training to improve detection performance. The model classified images into two classes (0 and 1), reflecting the presence or absence of diabetic retinopathy. The results showed a high area under the receiver operating characteristic curve of 0.912 and a sensitivity of 0.940, indicating competitive performance with existing methods. However, the study acknowledged limitations related to the generalization of the model due to the use of a specific dataset and the absence of extensive external validation. In a paper by Gayathri et al. [9], the authors describe a unique CNN approach for extracting features from retinal images to improve classification performance. The proposed system feeds multiple machine learning classifiers with CNN’s output features. The model is tested using different classifiers like Support Vector Machine (SVM), AdaBoost, Naive Bayes, Random Forest, and J48 on images from IDRiD, MESSIDOR, and KAGGLE datasets. To evaluate the effectiveness of each classifier, they compare specificity, precision, recall, false-positive rate (FPR), Kappa-score, and accuracy scores. On the three datasets, the results show that combining the proposed feature extraction method with the J48 classifier surpasses the other classifiers, achieving an average accuracy of 99.59% for multiclass classification and 99.89% for binary classification.
Revathy et al. [10] have proposed an approach to detect DR using machine learning and retinal image analysis. Their study utilized a dataset of 122 images containing DR and 122 normal images selected from the Kaggle dataset. The research primarily aimed to identify crucial DR indicators such as exudates, hemorrhages, and microaneurysms. The authors employed image processing techniques for feature extraction, specifically targeting exudate, hemorrhage, and microaneurysm detection. They evaluated machine learning classifiers, including SVM, K-Nearest Neighbors (KNN), and Random Forest, with Random Forest achieving the highest accuracy at 90%. Revathy et al. proposed a hybrid classifier combining SVM, KNN, and Random Forest to enhance performance. This hybrid approach achieved an accuracy of 82% on the testing set and demonstrated improved precision, recall, and F-measure scores compared to individual classifiers. A study by Manjula et al. [11] discussed an ensemble-based machine learning technique for DR. The approach outperformed individual algorithms in terms of sensitivity and accuracy. The study utilized machine learning algorithms such as Decision Tree, Random Forest, KNN, Adaboost Classifier, J48graft classifier, and Logistic Regression. Using Kaggle’s image dataset, the approach achieved a remarkable accuracy of 96.34%, a significant step toward the early detection of diabetic retinopathy.
Abdelsalam et al. [12] investigated a new method for early DR detection using macular Optical Coherence Tomography Angiography (OCTA) images. Their study focused on developing a precise and efficient algorithm based on multifractal geometry analysis, a technique commonly used in physics and biology to classify complex shapes and branching patterns. The dataset comprised 170 eye images obtained and approved by the Mansoura University, Egypt Ophthalmology Center. The researchers employed the SVM algorithm to improve diagnostic accuracy. Results revealed that SVM achieved an impressive accuracy rate of 98.5%.
Research by Adriman et al. [13] provided an automated approach for the detection of DR, the primary cause of vision loss in diabetics. This approach makes use of retinal fundus images from the publicly accessible APTOS dataset. Throughout a two-step process, features are extracted using Local Binary Patterns (LBP) and subsequently classified using cutting-edge deep learning architectures such as ResNet, DenseNet, and DetNet. According to the study’s results in binary classification, ResNet achieved the best accuracy of 96.35%, followed by DetNet (93.99%) and DenseNet (84.05%).
In research by Das et al. [14], the purpose is to introduce an algorithm for detecting and classifying DR by using CNNs. The study uses two datasets: the DIARETDB1 dataset and fundus scans obtained from a medical institution. These datasets consist of both affected and normal retinas. The study methodology begins by preparing the fundus scans through a pre-processing stage. This involves segmentation, a technique to isolate the blood vessels of interest. To achieve this, the method leverages maximal principal curvature. Following segmentation, the extracted blood vessels undergo further refinement. Adaptive histogram equalization improves the contrast of the vessels, while morphological opening removes any incorrectly identified regions. The proposed CNN architecture consists of a memory module and a central CNN. The memory module employs squeeze, excitation, and bottleneck units for feature extraction, reducing model complexity while maintaining performance. The results demonstrate that the model achieves an accuracy of 98.7% on the DIARETDB1 dataset, surpassing traditional schemes. The study suggests potential future enhancements, such as diversifying classification based on the duration of diabetic retinopathy, which could aid in personalized treatment strategies. The study does not mention any limitations.
Improved characteristics from fundus images can be preprocessed and used to categorize diabetic retinopathy. Many researchers have put forth different strategies for properly extracting and choosing characteristics and procedures for diagnosing DR. Jagan Mohan et al. [15] started with entropy image conversion to enhance the proposed deep model’s deep learning performance and classification outcomes on fundus images. Ample feature space is created by combining features after the pre-trained networks. The next stage proposes a four-step ensemble of filter-based feature selection strategies using Chi-Square tests, ReliefF, F-tests, Chi-redundancy, and maximum relevance (MRMR) to pick significant features. Lastly, they employ SVM, KNN, and Naïve Bayes classifiers—ML approaches. They are aiming for early detection of diabetic retinopathy. To do this, they use three datasets: IDRID, the Diabetic Retinopathy Detection dataset, and comments on a publicly available image dataset known as THE MESSIDOR DATABASE. With top-300 features, SVM classifiers have achieved a higher accuracy of 97.8% than NB and KNN classifiers. Compared to individual feature selection methods, the outcomes of ensemble features were superior. Additionally, there has been an improvement of 4%, 1.95%, 6.8%, and 5.6% in the sensitivity (Se), specificity (Sp), accuracy, and F1-score, respectively.
A study by Lahmar et al. [16] evaluated the performance of 28 deep hybrid architectures in automatically classifying referable DR using a binary classification approach. The APTOS dataset was used to train and assess each architecture for the previously mentioned comparisons. The outcomes show how deep learning and traditional machine learning methods can be combined to improve DR classification. The best-performing architecture achieved an accuracy of 88.80% by using an SVM classifier for final classification and MobileNet_V2 for feature extraction. Additionally, individual assessments showed that a hybrid model combining SVM and ResNet50 attained an accuracy of 75.80%, indicating that hybrid approach combinations call for more research. In a recent study, Khudaier et al. [17] investigated the performance of CNN architectures for binary classification tasks. The study evaluated transfer learning models for detecting DR using the APTOS dataset. Researchers implemented a MobileNet architecture, a type of CNN, for detecting DR (binary classification). This model benefits from pre-trained knowledge gained through prior training on a massive image dataset called ImageNet. The data indicates that the MobileNet CNN architecture is the most accurate and efficient model for addressing DR detection challenges. The metrics for the model are as follows: accuracy of 94.55%, precision of 94.651%, recall of 94.55%, F1-score of 94.556%, and Cohen Kappa score of 0.89083. Overall, the MobileNet CNN architecture is a good choice for detecting DR accurately and efficiently.
The literature on DR detection, as reviewed, highlights significant achievements using a variety of ML and DL techniques. Studies such as those by Gayathri et al. [9] and Jagan Mohan et al. [15] demonstrated high accuracies over 99% using CNNs with advanced feature extraction and ensemble feature selection strategies. For instance, Gayathri et al. [9] focused on combining CNN outputs with traditional classifiers to enhance accuracy, while Jagan Mohan et al. [15] employed a blend of feature selection techniques to optimize classifier performance. These approaches, however, were evaluated on different datasets than the one utilized in our study, APTOS.
On the other hand, Lahmar et al. [16] proposed a hybrid model like ours, combining SVM and ResNet50 trained on the APTOS dataset for binary classification. However, they attained an accuracy of 75.80%, which we aim to increase in the current study. Current study seeks to bridge these gaps by utilizing widely accessible ML models such as SVM, KNN, and Histogram GB, which have been rigorously tested on the APTOS dataset. The comprehensive demographic and pathological range of this dataset bolsters the robustness and generalizability of our models. By streamlining the classification process into a binary classification, the approach simplifies the integration into clinical workflows, accelerating the detection process and reducing reliance on specialist interpretations. Notably, the proposed models achieved promising accuracy, demonstrating that these simpler models can maintain high accuracy while offering greater adaptability for deployment in diverse clinical environments. This strategy enhances the practical application of DR screening tools, potentially improving patient outcomes by enabling earlier and more efficient detection of this condition.
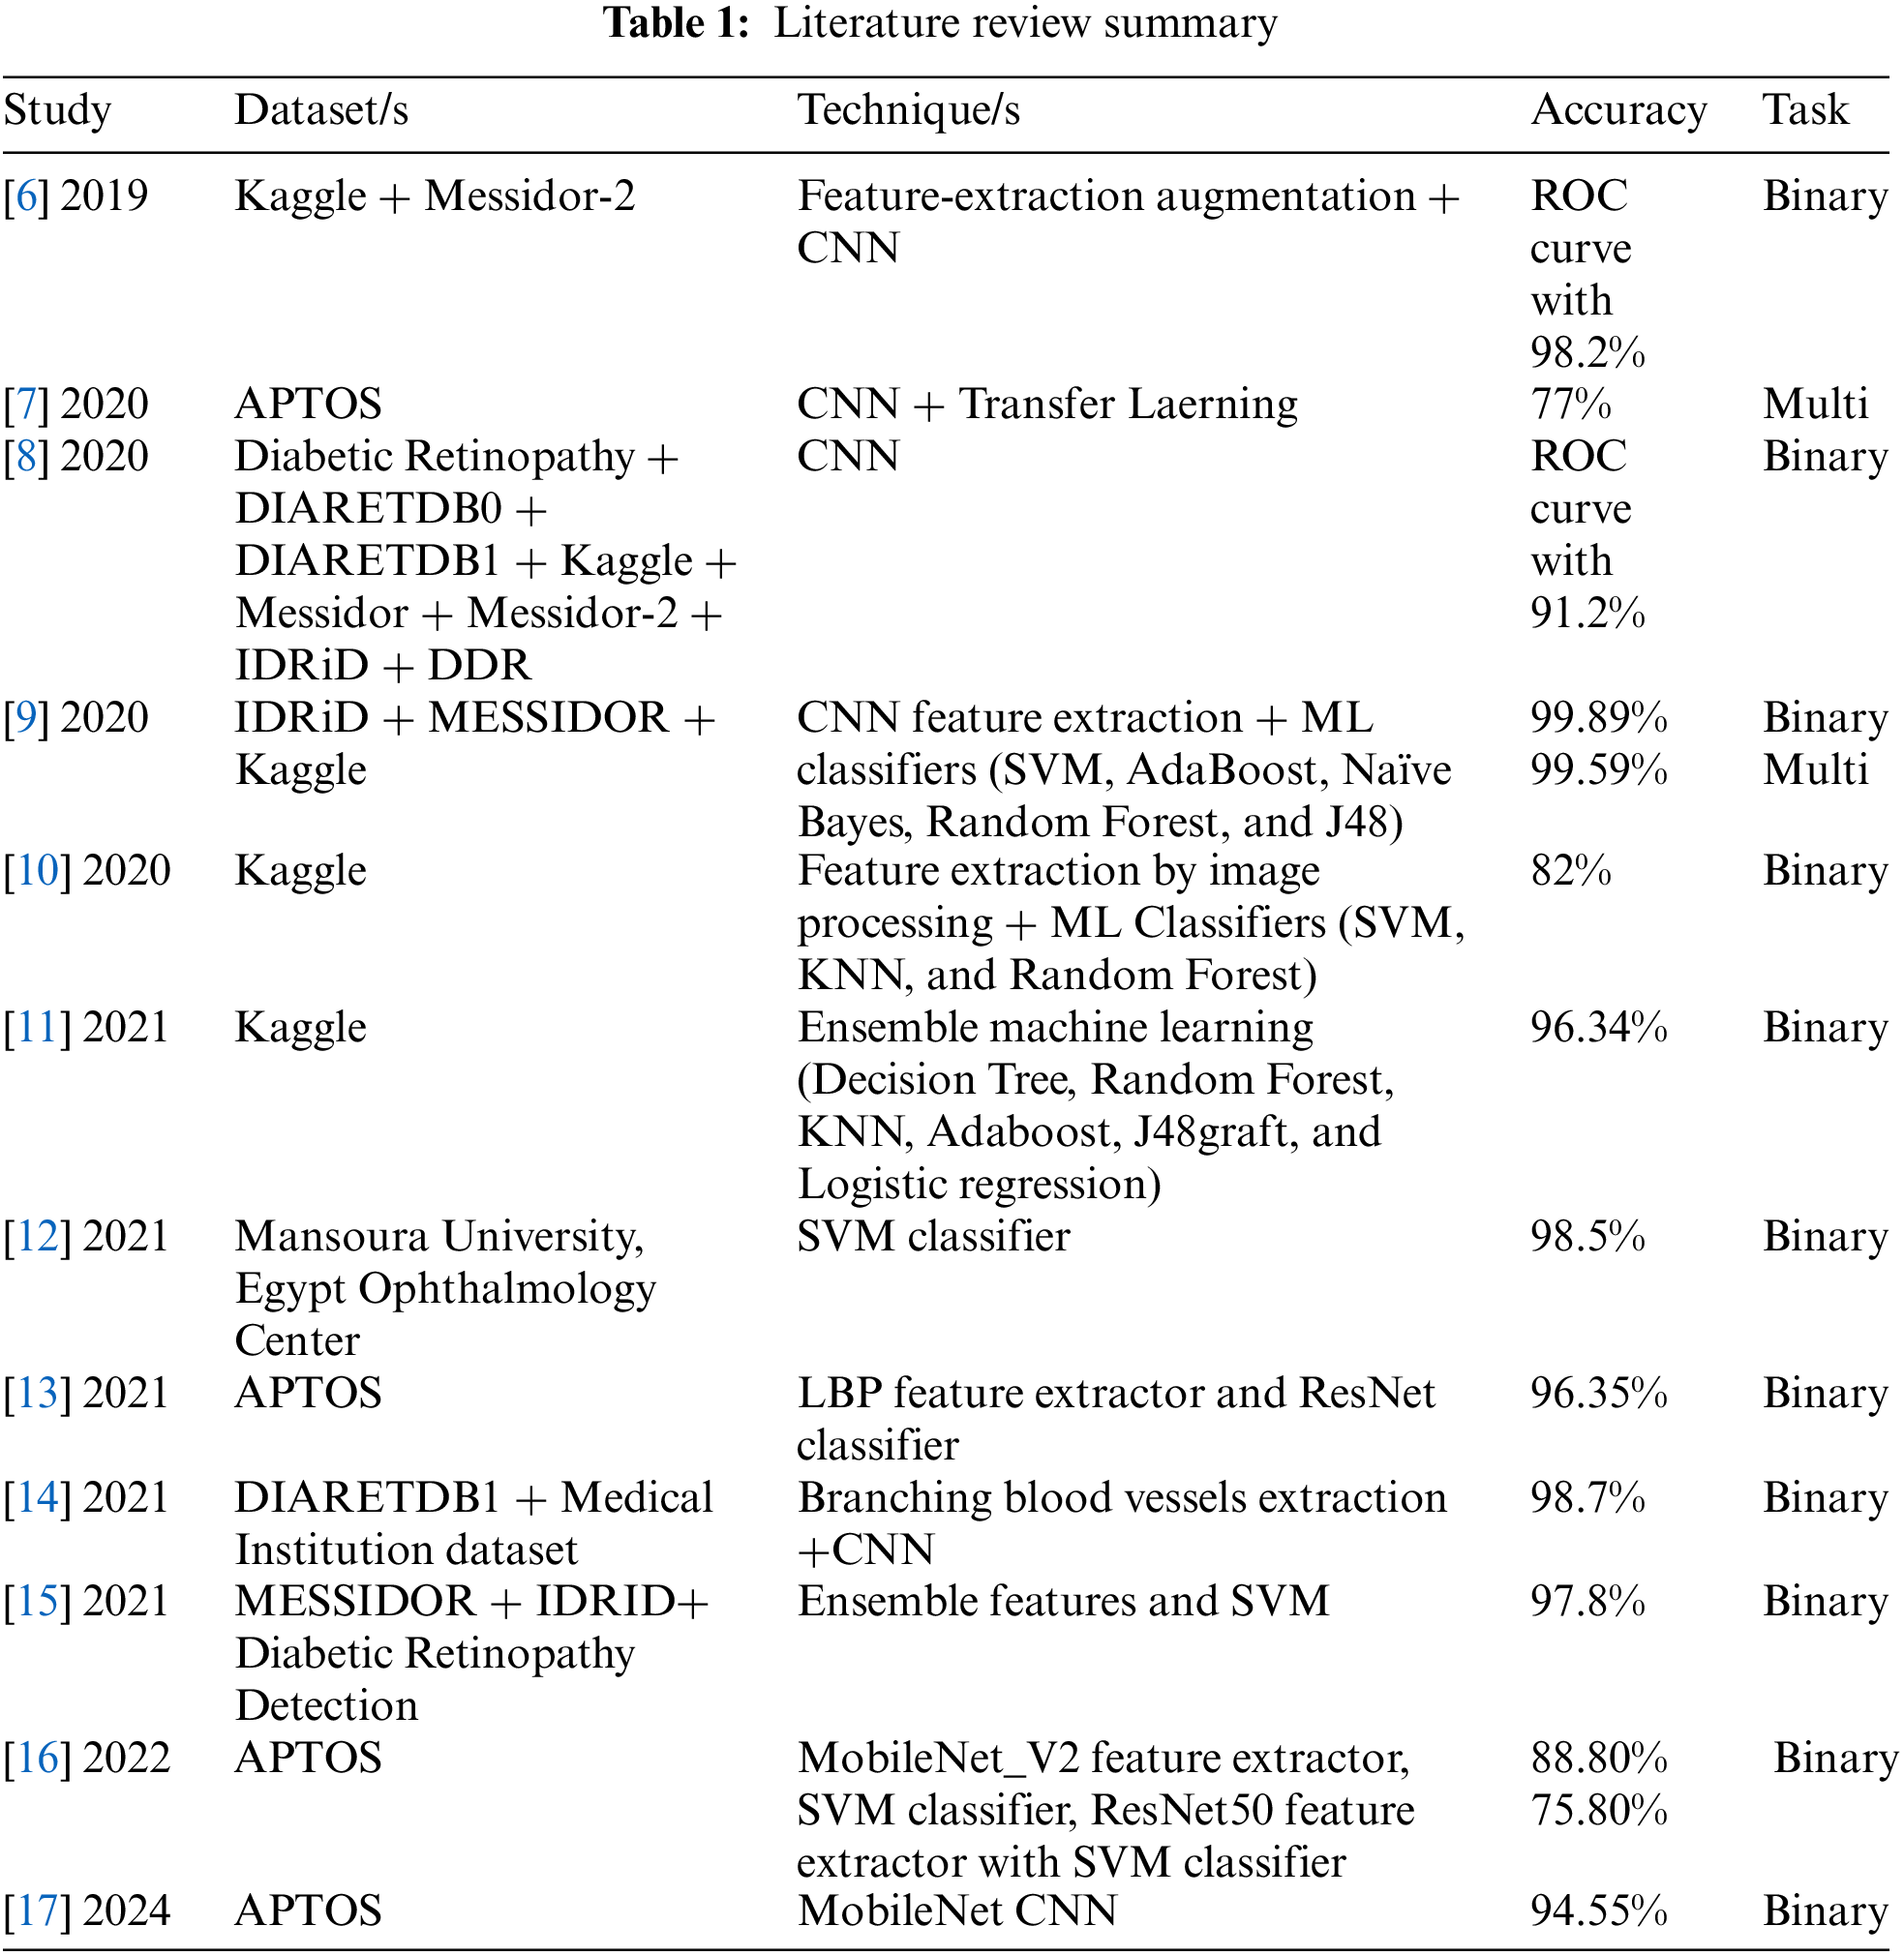
Table 1 provides a summary of the literature review by outlining the technique, dataset, and accuracy.
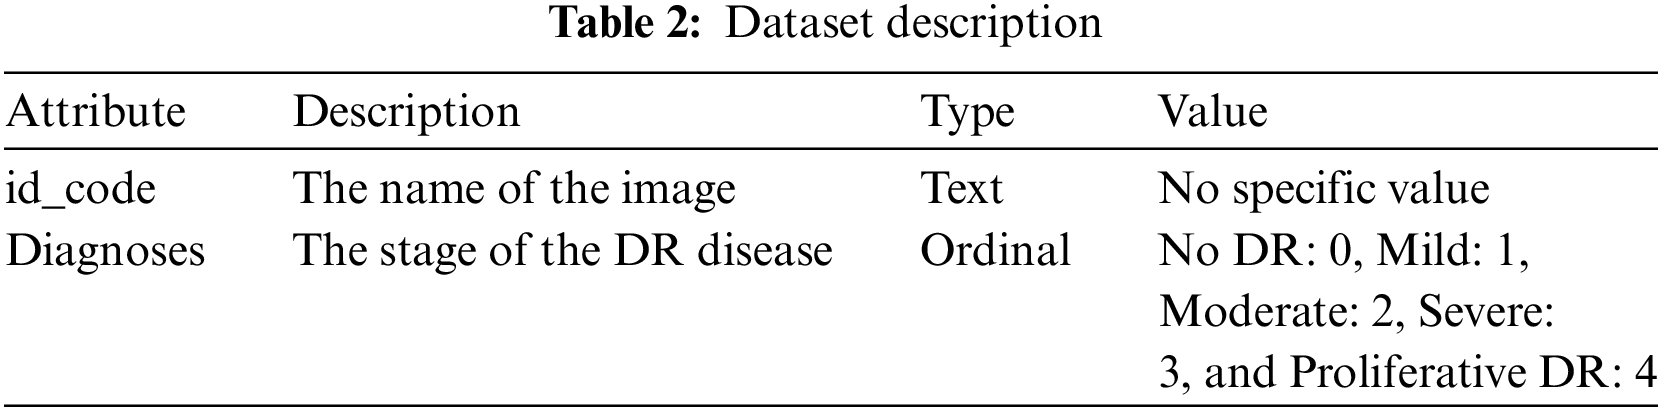
We obtained a dataset from Kaggle to analyze various aspects associated with DR. This project utilized the publicly available Asia Pacific Tele-Ophthalmology Society (APTOS) dataset to detect and analyze DR [18]. Comprising 3662 PNG images, each with a unique identifier (id_code) and its corresponding DR severity level (diagnosis). The severity of DR is classified on a scale from 0 to 4, with 0 indicating no DR, 1 indicating mild, 2 indicating moderate, 3 indicating severe, and 4 indicating proliferative DR. We adapted binary classification in this project to know the presence of DR, categorizing the data into two groups: with DR (Diagnoses 1–4) and without DR (Diagnosis 0). We conducted our analysis using the modified binary format. This approach allowed us to conduct in-depth analysis, develop advanced models, and comprehend, anticipate, and evaluate the presence of DR.
Table 2 presents the data features, including type, representation, and description.
Initially, the dataset categorized diabetic retinopathy (DR) into five levels: no DR, mild, moderate, severe, and proliferative DR. This categorization was in a multi-class format. However, the classification has been modified in the binary dataset, which is now divided into two groups: No DR and DR. The DR group includes Classes 1, 2, 3, and 4. Table 3 was used to count the data and determine its balance. It became more balanced after converting the dataset to binary, with only 62 image differences. Upon reviewing the data, it was found that all images and labels were present in the dataset.
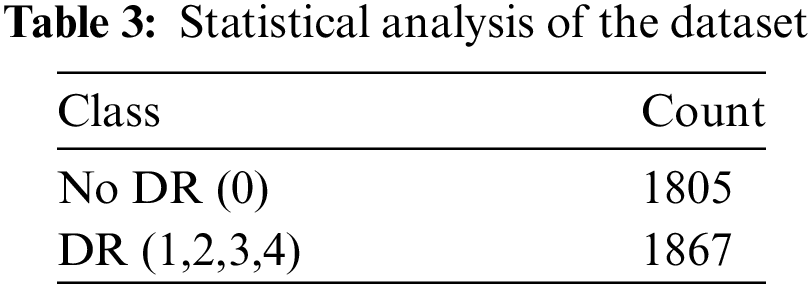
Fig. 1 represents the distribution of the five distinct classes in the original dataset. On the other hand, Fig. 2 displays the distribution of the same dataset after it was transformed into binary.
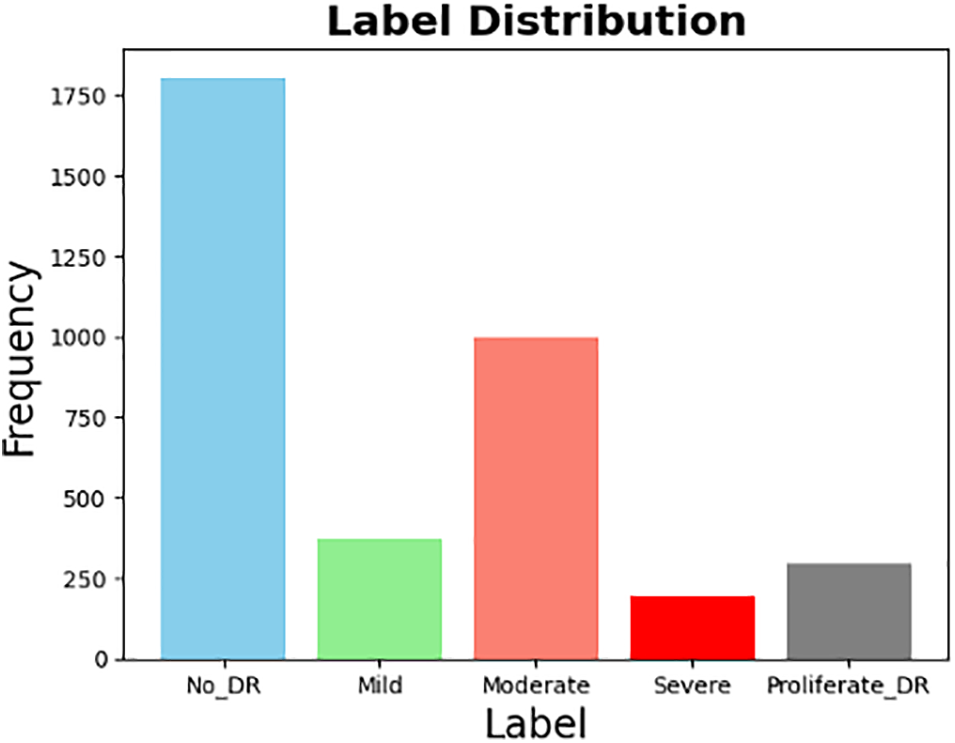
Figure 1: Original dataset distribution (5 classes)
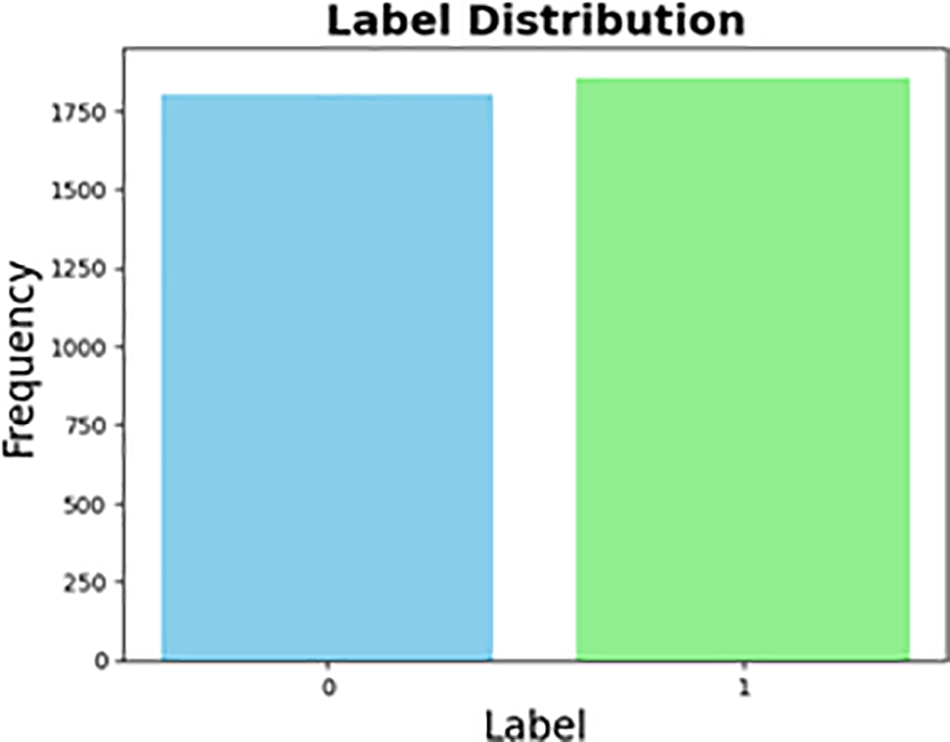
Figure 2: Transferred dataset distribution (From multi-class into binary)
In this section, we will describe the approach taken to develop the model. This comprises the techniques for preprocessing the images, feature extraction techniques for producing informative features, feature reduction techniques for efficient model training, and lastly, the ML models used.
The primary goal of data preprocessing is to eliminate any noise from the images to improve the quality of the analysis and modeling. For each image, we performed a series of preprocessing steps. It begins by resizing the image to a fixed size of 224 × 224 using bilinear interpolation (cv2.INTER_AREA) to ensure uniformity in image dimensions. Following this, it converts the resized image from RGB (Red, Green, and Blue) to LAB (Lightness (L), Green-Red (A), and Blue-Yellow (B)) color space (cv2.cvtColor), effectively separating the luminance (L) and chromaticity (A and B) components.
Then, it applies Contrast Limited Adaptive Histogram Equalization (CLAHE), specifically on the luminance channel (L), to enhance contrast. Subsequently, the LAB image is converted back to RGB color space. Next, the green channel is extracted from the final image. A Gaussian blur (cv2.GaussianBlur) is applied to the green channel to reduce noise. Finally, the blurred green channel is stacked three times to create a 3-channel image, a requirement for many pre-trained models that expect input images in RGB format. The purpose of preprocessing was to improve the quality and suitability of the dataset for subsequent analysis and modeling. Figs. 3 and 4 show a retina image before and after preprocessing, respectively.
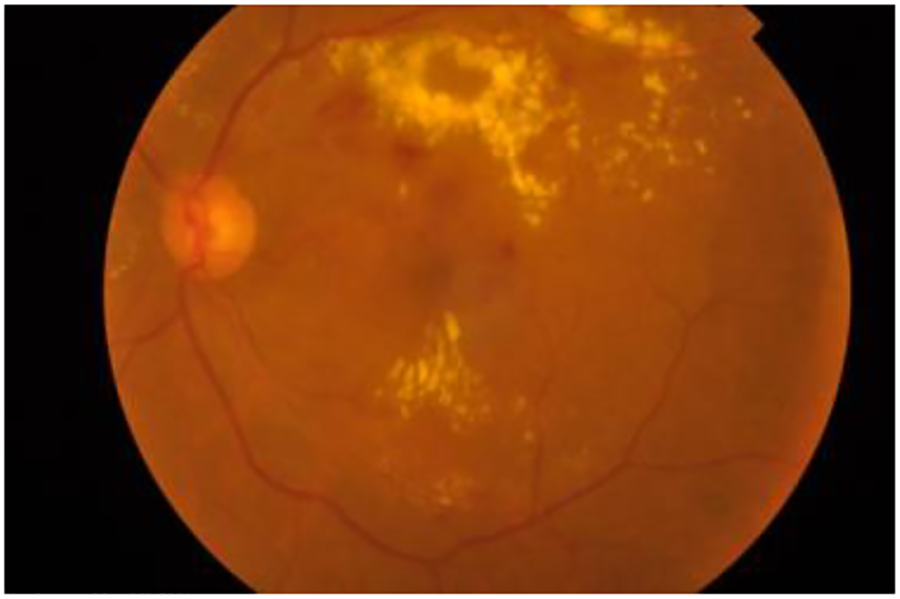
Figure 3: Original image
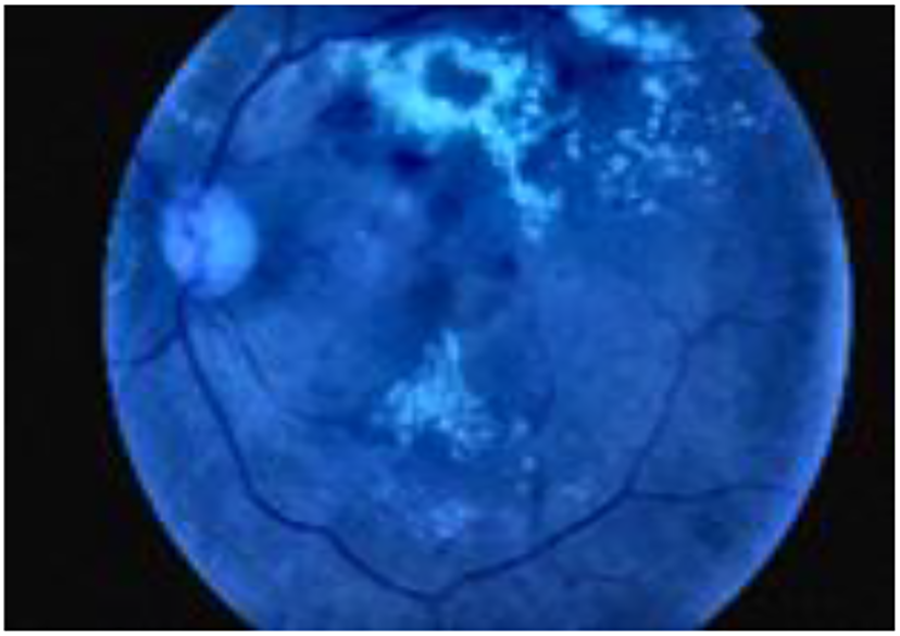
Figure 4: Preprocessed image
First, a pre-trained ResNet-50 convolutional neural network (CNN) is used for feature extraction. This robust model can extract high-level visual features from the input images because it was trained on a massive dataset. Using ResNet-50, we run the image data through its layers, excluding the final layer that deals with classification. In doing so, a rich feature vector containing the image’s content is extracted. Moreover, the extracted features were normalized using the standardization method to guarantee that each feature contributed equally to the model training process and to prevent biases from different scales.
The extracted features from the previous step could still be high-dimensional, though. We can use principal component analysis (PCA) on the retrieved features to increase efficiency and minimize noise. As a dimensionality reduction method, PCA finds the most important differences in the data. It obtains a compressed feature representation that preserves the most important information for classification by preserving a subset of the principal components. Ultimately, a machine learning classifier, like SVM, receives these reduced-dimension features. Accurate classification of images is made possible by the classifier’s use of these features to identify the decision boundary separating the various classes.
4.4 Machine Learning Models Employed
The preprocessed features from the previous step are now ready to be fed into a variety of machine learning algorithms. Typically, the features are represented in a two-dimensional array, with each row denoting an image (data point) and each column denoting a certain extracted feature. This study utilizes three machine learning classifiers to perform the classification task: SVM, KNN, and Histogram Gradient Boosting (Histogram GB).
SVM is one of the powerful supervised machine learning algorithms that are commonly used for classification tasks. The goal of SVMs is to maximize the margin between data points of various classes by locating an optimal hyperplane in a high-dimensional feature space. This margin refers to the distance between the hyperplane and the closest data points of each class, called support vectors. Even with complex datasets, SVMs achieve robust classification performance [19].
K-Nearest Neighbors (KNN) is a straightforward and efficient non-parametric classification algorithm. To classify a data point, KNN searches through the training data for its k-nearest neighbors. The number of neighbors considered, or the value of k, is an important parameter that can be adjusted to maximize classification performance [20].
Building on the idea of gradient boosting (GB), histogram gradient boosting (HGB) is a machine learning technique for classification tasks. Like other GB techniques, HGB uses decision trees for categorization. It does, however, bring about an increase in efficiency. When creating decision trees, traditional GB considers every potential split point inside a feature. HGB, on the other hand, discretizes the feature values using histograms. This makes it possible for the algorithm to concentrate on the data’s most informative areas, greatly accelerating training as compared to conventional techniques. HGB retains competitive classification performance despite this efficiency increase, which makes it especially useful for large datasets where training time becomes an important consideration [21].
Leveraging Python for development, the proposed system employed the Keras deep learning library, built on top of TensorFlow, to facilitate its development. Several experiments were carried out to evaluate the effectiveness of the three constructed classification models that were previously discussed in Section 4.4. To ensure the training and testing sets accurately reflect the distribution of classes in the original data, stratified splitting was employed. Two folds of data were randomly selected, with 80% going toward training and the remaining 20% going toward testing. Every model was applied to the same sets of training and testing data, and its performance was assessed.
To assess the effectiveness of the proposed scheme, the well-known metrics from the literature have been employed, namely, accuracy, precision, recall and F1-score [22–24].
Accuracy is a metric that assesses how frequently an outcome is properly predicted correctly using machine learning model.
True positive (TP), True negative (TN), False Positive (FP), False Negative (FN).
Precision is a metric that assesses how frequently a machine learning model predicts the positive class.
A machine learning model’s recall is a metric that expresses how frequently it properly selects positive examples, or true positives, out of all the real positive samples in the dataset.
The F1-score, commonly referred to as the F-measure, is a crucial metric for evaluating the performance of a Machine Learning model. This metric combines precision and recall. The F1-score simplifies the evaluation process, making it easier for data scientists to communicate the performance of their models to stakeholders.
After training the models for binary classification using the APTOS dataset, we evaluated their performance. Impressive results were obtained, with KNN achieving 95.6% accuracy with 95.6% precision, 95.6% recall, and 95.6% F1-score. Moreover, Histogram GB (HGB) did well with an accuracy of 95.6%, precision of 95.7%, recall of 95.6%, and F1-score of 95.6%. Finally, SVM achieved an accuracy of 96.9%, precision of 96.9%, recall of 96.9%, and F1-score of 96.9%. Based on a comparison of these findings, we conclude that SVM, with its highest accuracy and balanced metrics, is the best-performing model. The testing accuracy, precision, recall, and F1-score for each of the suggested models with binary class classification are displayed in Table 4 and Fig. 5.
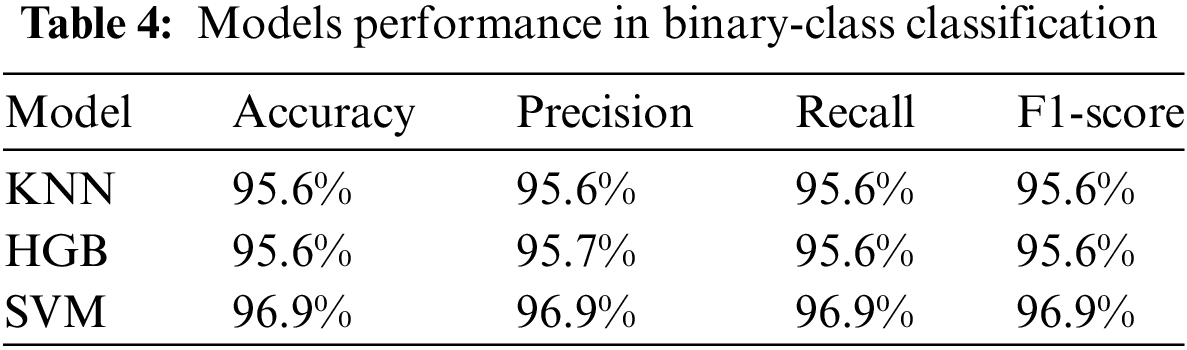
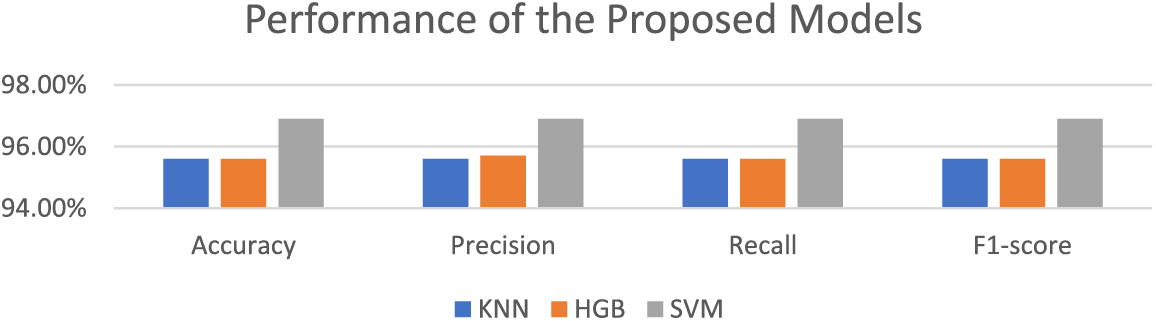
Figure 5: Performance of the proposed models
Figs. 6–8 show the confusion matrices for each of the proposed models.
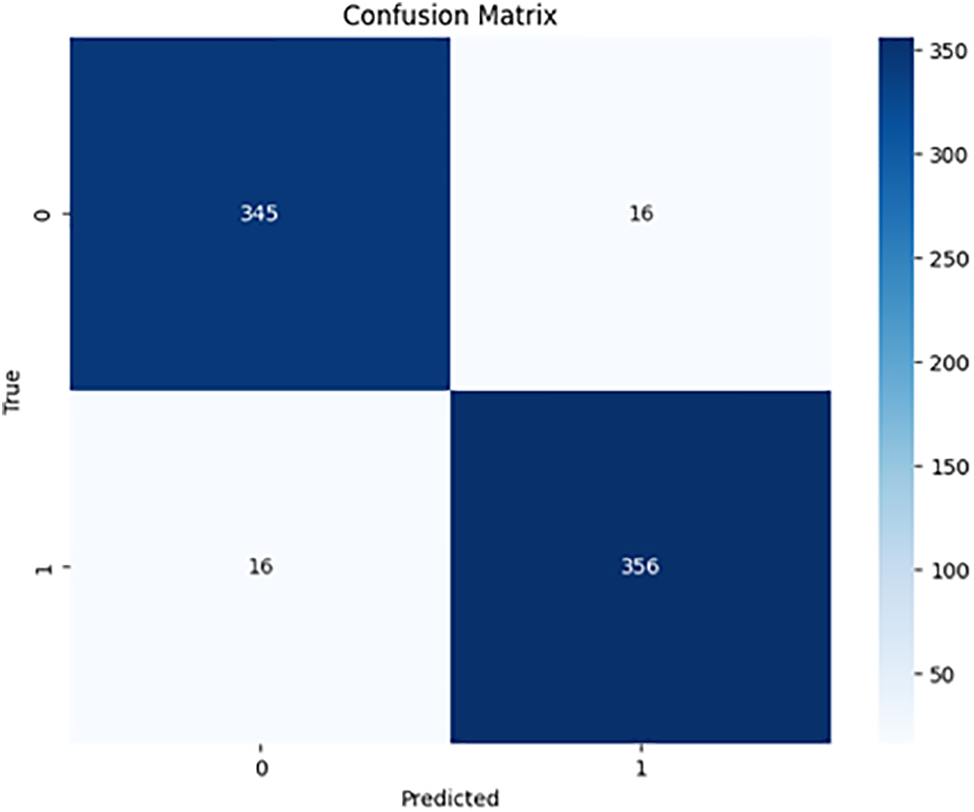
Figure 6: KNN confusion matrix
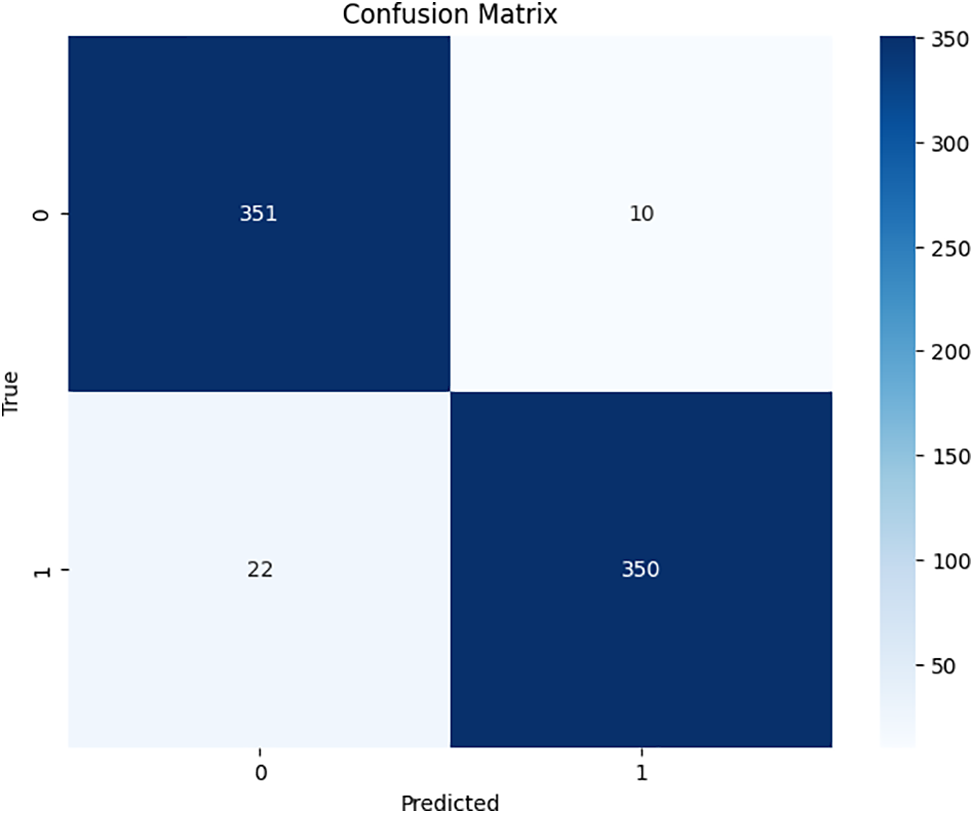
Figure 7: HGB confusion matrix

Figure 8: SVM confusion matrix
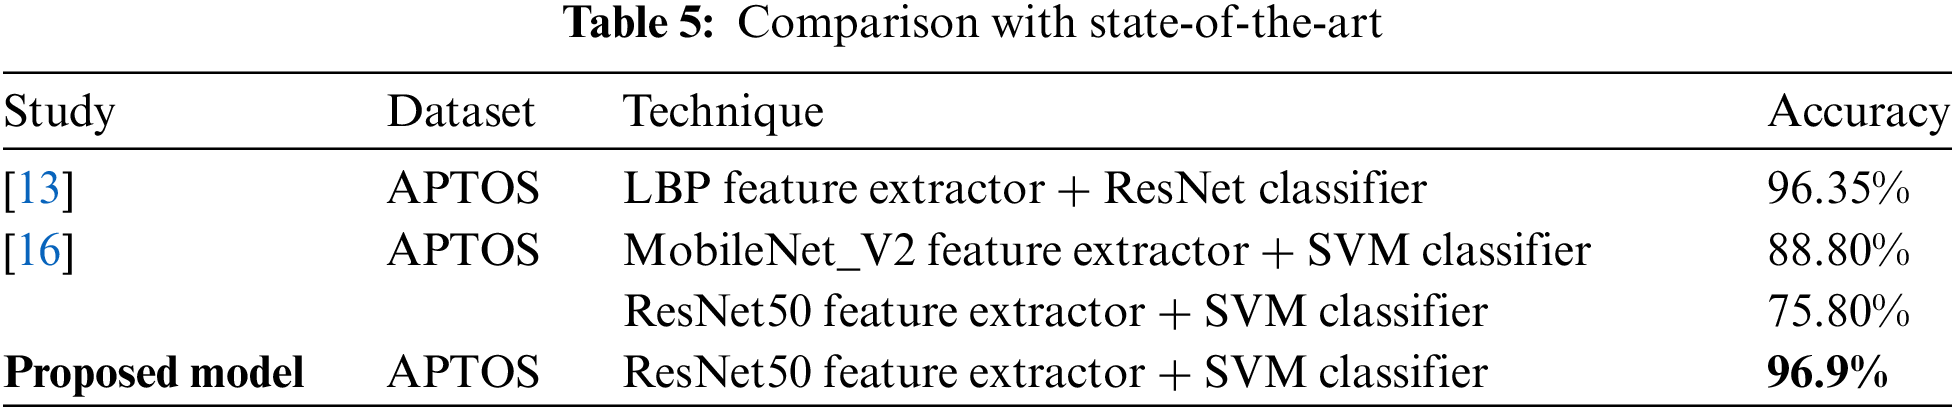
6.1 Comparison with State-of-the-Art
Utilizing the APTOS dataset, our suggested method of DR classification employing ResNet50 feature extraction with an SVM classifier (ResNet50-SVM) yielded an accuracy of 96.9%. When compared to prior studies using similar approaches in binary classification on the APTOS dataset, this result is encouraging. For instance, a prior study [16] that used the same dataset and the combination of ResNet50 and SVM was able to reach 75.80% accuracy. In the same study, a MobileNet_V2-SVM technique was also investigated, and an accuracy of 88.80% was attained. Another study [13] used LBP feature extraction with a ResNet classifier and reported an accuracy of 96.35% on the APTOS dataset. This comparison demonstrates the effectiveness of the proposed approach over state-of-the-art [25]. This study offers insightful information, but its applicability to other populations or settings is limited due to its reliance on a single dataset. It is essential to bear in mind that the accuracy of DR classification is an evolving area of study, and additional investigation is required to ascertain whether our results apply to other datasets. A clear comparison is shown in Table 5.
6.2 Computational Complexity Analysis
The overall computational complexity of the proposed image classification pipeline might change at different stages and is dependent on a number of factors, including:
In this phase, because it processes each image one at a time, it has a linear complexity of O(n) relative to the number of images (n).
6.2.2 Feature Extraction and Reduction
The complexity of this step depends on the selected model architecture and the number of PCA components utilized for dimensionality reduction. ResNet50’s precise complexity can vary based on the implementation, but a CNN is typically estimated to be O(L ∗ F ∗ n2), where L is the number of layers, F is the number of filters in each layer, and n is the size of the input image [26]. For a dataset of size n with p features, the PCA calculation complexity is O(p2n + p3) [27].
The complexity of SVM with a polynomial kernel is typically O(n * p * d), where n is the number of images, p is the number of features, and d is the polynomial’s degree. The phase that takes the longest will ultimately determine how efficient the approach is overall. Using the ResNet50 model to extract features appears to be the challenge in this instance, where it has a complexity of O(LFn2). However, it may be hard to estimate the computational cost precisely using Big-O notation without knowing the exact values of L, F, and n. The model development process was carried out in a Python environment, using the power of GPUs (Graphics Processing Units) made available by Google Colab and Kaggle Kernels. This allowed us to effectively train computationally complex models employing libraries such as TensorFlow.
7 Conclusions (and Future Work)
In conclusion, the study addressed the pressing need for improved diagnostic methodologies in the context of diabetic retinopathy (DR), a severe complication of diabetes mellitus. By integrating techniques of machine learning (ML) algorithms and deep learning (DL) models, this study aimed to enhance the efficiency and accuracy of DR detection, mainly focusing on the binary classification used to identify the disease to mitigate the risk of vision impairment and blindness. The findings of this research underscore the potential of applying ML and DL approaches to revolutionize DR diagnosis and management. The adoption of a pre-trained ResNet-50 convolutional neural network (CNN) for feature extraction, coupled with three various machine learning classifiers such as Support Vector Machine (SVM), K-Nearest Neighbors (KNN), and Histogram Gradient Boosting (Histogram GB), has yielded promising results in discerning retinal images with and without DR. The models have demonstrated remarkable accuracy, attributed to image preprocessing, feature extraction, reduction, and classification. Notably, the SVM classifier exhibited the highest level of accuracy, achieving a 96.9% accuracy rate. It demonstrated superior accuracy and balance as compared to other evaluated methods. Future research may include more datasets to investigate any changes in performance across various scenarios and offer a more thorough comprehension of the generalizability. Furthermore, clinical validation studies will be employed to guarantee practical deployment in clinical settings.
Acknowledgement: Authors would like to acknowledge CCSIT at IAU for using the resources.
Funding Statement: The authors received no specific funding for this study.
Author Contributions: Conceptualization, Mustafa Youldash and Atta Rahman; Data curation, Manar Alsayed and Noor Aljishi; Formal analysis, Ghaida Alshammari; Methodology, Manar Alsayed, Abrar Sebiany, Joury Alzayat and Mona Alqahtani; Resources, Mustafa Youldash; Software, Manar Alsayed, Abrar Sebiany, Noor Aljishi, Ghaida Alshammari and Mona Alqahtani; Supervision, Mustafa Youldash and Atta Rahman; Validation, Joury Alzayat; Writing—original draft, Abrar Sebiany, Joury Alzayat, Noor Aljishi, Ghaida Alshammari and Mona Alqahtani; Writing—review & editing, Atta Rahman. All authors reviewed the results and approved the final version of the manuscript.
Availability of Data and Materials: The data that support the findings of this study are available at https://www.kaggle.com/competitions/aptos2019-blindness-detection (accessed on 12 December 2023).
Ethics Approval: Not applicable.
Conflicts of Interest: The authors declare that they have no conflicts of interest to report regarding the present study.
References
1. “Diabetes,” Accessed: Oct. 09, 2023. [Online]. Available: https://www.who.int/news-room/fact-sheets/detail/diabetes [Google Scholar]
2. G. N. Gelcho and F. S. Gari, “Time to diabetic retinopathy and its risk factors among diabetes mellitus patients in Jimma University Medical Center, Jimma, Southwest Ethiopia,” Ethiop J. Health Sci., vol. 32, no. 5, pp. 937–946, Sep. 2022. doi: 10.4314/ejhs.v32i5.9. [Google Scholar] [PubMed] [CrossRef]
3. “Diabetic retinopathy | National eye institute,” Accessed: Oct. 09, 2023. [Online]. Available: https://www.nei.nih.gov/learn-about-eye-health/eye-conditions-and-diseases/diabetic-retinopathy [Google Scholar]
4. Y. Zheng, M. He, and N. Congdon, “The worldwide epidemic of diabetic retinopathy,” Indian J. Ophthalmol, vol. 60, no. 5, p. 428, Sep. 2012. doi: 10.4103/0301-4738.100542. [Google Scholar] [PubMed] [CrossRef]
5. W. L. Alyoubi, M. F. Abulkhair, and W. M. Shalash, “Diabetic retinopathy fundus image classification and lesions localization system using deep learning,” Sensors, vol. 21, no. 11, Jun. 2021, Art. no. 3704. doi: 10.3390/S21113704. [Google Scholar] [PubMed] [CrossRef]
6. R. Pires, S. Avila, J. Wainer, E. Valle, M. D. Abramoff and A. Rocha, “A data-driven approach to referable diabetic retinopathy detection,” Artif. Intell. Med, vol. 96, no. 6, pp. 93–106, May 2019. doi: 10.1016/j.artmed.2019.03.009. [Google Scholar] [PubMed] [CrossRef]
7. O. Dekhil, A. Naglah, M. Shaban, M. Ghazal, F. Taher and A. Elbaz, “Deep learning based method for computer aided diagnosis of diabetic retinopathy,” in 2019 IEEE Int. Conf. Imaging Syst. Techniq. (IST), Abu Dhabi, United Arab Emirates, 2019, pp. 1–4, doi: 10.1109/IST48021.2019.9010333. [Google Scholar] [CrossRef]
8. G. T. Zago, R. V. Andreão, B. Dorizzi, and E. O. Teatini Salles, “Diabetic retinopathy detection using red lesion localization and convolutional neural networks,” Comput. Biol. Med., vol. 116, Jan. 2020, Art. no. 103537. doi: 10.1016/j.compbiomed.2019.103537. [Google Scholar] [PubMed] [CrossRef]
9. S. Gayathri, V. P. Gopi, and P. Palanisamy, “A lightweight CNN for Diabetic Retinopathy classification from fundus images,” Biomed. Signal Process. Control, vol. 62, no. 7, Sep. 2020, Art. no. 102115. doi: 10.1016/j.bspc.2020.102115. [Google Scholar] [CrossRef]
10. R. Revathy, B. S. Nithya, J. J. Reshma, S. S. Ragendhu, and M. D. Sumithra, “Diabetic retinopathy detection using machine learning,” Int. J. Eng. Res., vol. 9, no. 6, pp. 122–126, Jun. 2020. doi: 10.17577/IJERTV9IS060170. [Google Scholar] [CrossRef]
11. J. Manjula, S. Radharani, N. H. Rao, and Y. Madhulika, “An ensemble classification techniques based on ‘Ml’ model for automatic diabetic retinopathy detection,” Turk. Online J. Qual. Inq., vol. 12, no. 3, pp. 1002–1010, Jun. 2021. [Google Scholar]
12. M. M. Abdelsalam and M. A. Zahran, “A novel approach of diabetic retinopathy early detection based on multifractal geometry analysis for OCTA Macular images using support vector machine,” IEEE Access, vol. 9, no. 1, pp. 22844–22858, 2021. doi: 10.1109/ACCESS.2021.3054743. [Google Scholar] [CrossRef]
13. R. Adriman, K. Muchtar, and N. Maulina, “Performance evaluation of binary classification of diabetic retinopathy through deep learning techniques using texture feature,” Proc. Comput. Sci., vol. 179, no. 1, pp. 88–94, Jan. 2021. doi: 10.1016/j.procs.2020.12.012. [Google Scholar] [CrossRef]
14. S. Das, K. Kharbanda, M. Suchetha, R. Raman, and E. Dhas, “Deep learning architecture based on segmented fundus image features for classification of diabetic retinopathy,” Biomed. Signal Process. Control, vol. 68, no. 1, Jul. 2021, Art. no. 102600. doi: 10.1016/j.bspc.2021.102600. [Google Scholar] [CrossRef]
15. N. Jagan Mohan, R. Murugan, T. Goel, S. Mirjalili, and P. Roy, “A novel four-step feature selection technique for diabetic retinopathy grading,” Phys. Eng. Sci. Med., vol. 44, no. 4, pp. 1351–1366, Dec. 2021. doi: 10.1007/s13246-021-01073-4. [Google Scholar] [PubMed] [CrossRef]
16. C. Lahmar and A. Idri, “Classifying diabetic retinopathy using CNN and machine learning,” in Proc. 15th Int. Joint Conf. Biomed. Eng. Syst. Technol., SCITEPRESS-Science and Technology Publications, 2022, pp. 52–62. [Google Scholar]
17. A. H. Khudaier and A. M. Radhi, “Binary classification of diabetic retinopathy using CNN architecture,” Iraqi J. Sci., vol. 65, no. 2, pp. 963–978, Feb. 2024. doi: 10.24996/ijs.2024.65.2.31. [Google Scholar] [CrossRef]
18. “APTOS 2019 blindness detection | Kaggle,” Accessed: Apr. 28, 2024. [Online]. Available: https://www.kaggle.com/c/aptos2019-blindness-detection [Google Scholar]
19. C. Cortes, V. Vapnik, and L. Saitta, “Support-vector networks editor,” Mach. Learn., vol. 20, no. 1, pp. 273–297, 1995. doi: 10.1007/BF00994018. [Google Scholar] [CrossRef]
20. G. James, D. Witten, T. Hastie, R. Tibshirani, and J. Taylor, “Classification,” in An Introduction to Statistical Learning, Springer Link, Heidelberg, New York, 2023. doi: 10.1007/978-3-031-38747-0. [Google Scholar] [CrossRef]
21. A. Guryanov, “Histogram-based algorithm for building gradient boosting ensembles of piecewise linear decision trees,” in Lecture Notes in Computer Science, vol. 11832, pp. 39–50, 2019. [Google Scholar]
22. M. I. B. Ahmed, “Early detection of diabetic retinopathy utilizing advanced fuzzy logic techniques,” Math. Modell. Eng. Problem., vol. 10, no. 6, pp. 2086–2094, 2023. doi: 10.18280/mmep.100619. [Google Scholar] [CrossRef]
23. N. A. Sajid, “Single vs. multi-label: The issues, challenges and insights of contemporary classification schemes,” Appl. Sci., vol. 13, no. 11, 2023, Art. no. 6804. doi: 10.3390/app13116804. [Google Scholar] [CrossRef]
24. L. Dai et al., “A deep learning system for predicting time to progression of diabetic retinopathy,” Nat. Med., vol. 30, no. 1, pp. 358–359, 2024. doi: 10.1038/s41591-023-02742-5. [Google Scholar] [PubMed] [CrossRef]
25. W. L. Alyoubi, W. M. Shalash, and M. F. Abulkhair, “Diabetic retinopathy detection through deep learning techniques: A review,” Inform. Med. Unlocked, vol. 20, no. 1, 2020, Art. no. 100377. doi: 10.1016/j.imu.2020.100377. [Google Scholar] [CrossRef]
26. A. Bilal et al., “DeepSVDNet: A deep learning-based approach for detecting and classifying vision-threatening diabetic retinopathy in retinal fundus images,” Comput. Syst. Sci. Eng., vol. 48, no. 2, pp. 511–528, Jan. 2024. doi: 10.32604/csse.2023.039672. [Google Scholar] [CrossRef]
27. “Does curse of dimensionality also affect principal component analysis calculations?,” Accessed: Jul. 15, 2024. [Online]. Available: https://stats.stackexchange.com/questions/389609/does-curse-of-dimensionality-also-affect-principal-component-analysis-calculation [Google Scholar]
Cite This Article
 Copyright © 2024 The Author(s). Published by Tech Science Press.
This work is licensed under a Creative Commons Attribution 4.0 International License , which permits unrestricted use, distribution, and reproduction in any medium, provided the original work is properly cited.
 Downloads
 Citation Tools