
 Submit a Paper
 Propose a Special lssue
 Open Access
ARTICLE

Phenotypic Image Recognition of Asparagus Stem Blight Based on Improved YOLOv8
College of Information Science and Engineering, Shandong Agricultural University, Tai’an, 271000, China
* Corresponding Author: Chao Zhang. Email:
Computers, Materials & Continua 2024, 80(3), 4017-4029. https://doi.org/10.32604/cmc.2024.055038
Received 14 June 2024; Accepted 19 July 2024; Issue published 12 September 2024
 View Full Text
 Download PDF
Abstract
Asparagus stem blight, also known as “asparagus cancer”, is a serious plant disease with a regional distribution. The widespread occurrence of the disease has had a negative impact on the yield and quality of asparagus and has become one of the main problems threatening asparagus production. To improve the ability to accurately identify and localize phenotypic lesions of stem blight in asparagus and to enhance the accuracy of the test, a YOLOv8-CBAM detection algorithm for asparagus stem blight based on YOLOv8 was proposed. The algorithm aims to achieve rapid detection of phenotypic images of asparagus stem blight and to provide effective assistance in the control of asparagus stem blight. To enhance the model’s capacity to capture subtle lesion features, the Convolutional Block Attention Module (CBAM) is added after C2f in the head. Simultaneously, the original CIoU loss function in YOLOv8 was replaced with the Focal-EIoU loss function, ensuring that the updated loss function emphasizes higher-quality bounding boxes. The YOLOv8-CBAM algorithm can effectively detect asparagus stem blight phenotypic images with a mean average precision (mAP) of 95.51%, which is 0.22%, 14.99%, 1.77%, and 5.71% higher than the YOLOv5, YOLOv7, YOLOv8, and Mask R-CNN models, respectively. This greatly enhances the efficiency of asparagus growers in identifying asparagus stem blight, aids in improving the prevention and control of asparagus stem blight, and is crucial for the application of computer vision in agriculture.Keywords
Asparagus is ranked among the world’s top ten famous dishes, and enjoys the reputation of “King of Vegetables” at home and abroad [1]. Asparagus is popular for its rich nutrients and many health benefits such as moisturizing the lungs, relieving cough, aiding in expectoration, and inhibiting tumor growth. Asparagus stem blight, also known as “asparagus cancer”, is a serious disease with regional characteristics [2], which is very prone to occur in humid and hot climates. In contrast, the main asparagus-growing regions in Europe and the United States generally enjoy a cool environment, which largely avoids the appearance of stem blight. In comparison, asparagus cultivation in Asian countries such as China, Thailand, Indonesia, and Japan is generally facing the challenge of stem blight, especially in China. In China, the major asparagus-producing provinces are generally at risk of stem blight. In particular, in the south, the damage of stem blight is relatively more serious because the climatic conditions are more humid and sultry than in the north. In fields that are less affected by the disease, the growth of asparagus plants is impaired, resulting in reduced yield and quality; in fields where the disease is severe, large numbers of number of infected plants will die prematurely, causing the entire field to suffer a devastating blow. Currently, the detection of asparagus stem blight still relies mainly on manual identification, a traditional method that is not only wasteful of labour but also prone to misjudgment. Given this, it is urgent to find an accurate and rapid disease identification method.
Before deep learning technology became popular, scholars at home and abroad mainly used machine learning technology and traditional image processing technology to study crop disease problems [3,4]. In the study by Song [5], they first converted the color of apple leaves from RGB to LAB color space. Then, they take the K-Means Clustering Algorithm (K-Means) for preliminary classification, and then used an optimized maximum inter-class variance method to further separate the diseased areas on the leaves. Finally, by using the Support Vector Machine [6] (SVM) technology, they achieved effective identification of leaf diseases. Liu et al. [7] successfully segmented the diseased area on the leaves by applying the K-Means, extracted color, texture, and shape features from these segmented parts, and optimized these features. They then used a SVM for classification and obtained 94.4% accuracy in the experiment. In their study, Chakraborty et al. [8] employed Otsu’s thresholding and histogram equalization methods for preprocessing the image data, and integrated them with SVM classification to accurately segment the diseased size of apple leaves. This approach enhanced the detection rate of apple leaf diseases to 96%.
As deep learning techniques continue to evolve in the realm of image recognition, convolutional neural network (CNN) in deep learning have been extensively utilized due to their excellent performance in this area. Many domestic and foreign scholars have applied convolutional neural networks to plant disease recognition and achieved remarkable recognition effects [9]. Based on the number of detection steps, target detection models can be classified into two categories. The initial approach is the two-stage detection method represented by Fast R-CNN [10] and Faster R-CNN [11]. In this approach, a Region Proposal Network (RPN) is employed to suggest potential target areas. Subsequently, in the second stage, classification and bounding box regression analysis are conducted on these proposed regions to derive the final detection outcomes. Mao et al. [12] improved the Faster-RCNN model to identify wheat stripe rust and yellow dwarf disease. The deep residual network was optimized by decomposing the convolution kernel and adopting a downsampling delay strategy, thereby simplifying the model parameters and improving the recognition accuracy. Following this enhancement, the model achieved an average accuracy of 98.74%. Nonetheless, due to its overly complex network structure and poor real-time performance, it limits its use in real-time detection applications. Ozguven et al. [13] introduced an enhanced Faster R-CNN method to identify beet leaves with leaf spot disease and achieved a high accuracy of 95.5%. Rehman et al. [14] utilized enhanced images of apple leaf diseases to train the R-CNN model. After training, the model attained an average recognition rate of 86.1% for three apple leaf diseases (black scab, black rot, and rust). Another mainstream target detection method is a single-stage target detection algorithm, exemplified by the YOLO [15] series algorithm and the SSD [16] algorithm. This type of method simplifies the target detection process, directly generates multiple candidate boxes on the original image, and simultaneously regresses and predicts the categories and positions of the objects in these boxes. Due to the reduction in processing steps, this type of method is usually faster than the two-stage detection algorithm, but may be slightly less accurate. Chen et al. [17] used an improved YOLOv5 object detection network to identify rubber tree diseases. The model achieved an accuracy of 86.5% in identifying powdery mildew and 86.8% in identifying anthracnose. Liu et al. [18] improved the YOLOv3 network by introducing multi-scale feature detection of image pyramids, dimensional clustering of object bounding boxes, and a multi-scale training strategy. These improvements enabled the model to achieve an accuracy of 92.39% in detecting tomatoes. Sun et al. [19] developed a tea disease detection model utilizing an enhanced version of YOLOv4, which can quickly and accurately identify three common tea diseases in natural environments. Pang et al. [20] introduced a rice disease detection approach based on the improved YOLOv8. By combining the BiFPN pyramid structure, GAM (global attention mechanism) and WIOU loss function, the recognition accuracy of BGW-YOLOv8n was improved to 91.6%. Wen et al. [21] enhanced the YOLOv8 algorithm by introducing multiple attention mechanisms and WIOU-V3 loss function, achieving a peak accuracy of 90.5% in crop disease monitoring, and increasing the average precision from 50% to 95% and from 68.7% to 73.6%, significantly outperforming the original algorithm and other cutting-edge detection models. Yang et al. [22] proposed a new method for automatic tomato detection by introducing modules such as depth separable convolution and feature enhancement in the YOLOv8 model, the model size was reduced to 16 M and higher recognition speed was achieved, the improved algorithm meets the rapid detection of tomato in real environment. Solimani et al. [23] proposed a novel data balancing method, which significantly improved the performance of detecting individual parts of tomato plants in complex environments by combining the YOLOv8 model and the squeeze-excitation block attention module.
Although the above studies have achieved good results, there is no research on the recognition of asparagus stem blight phenotypic images. YOLOv8 is currently a more advanced target detection algorithm, so it is chosen as the research object. Addressing the issue of low detection accuracy in the original model, improvements are made on it, and a YOLOv8-CBAM deep learning algorithm is proposed. The improved model’s performance and effectiveness were evaluated by comparing it with YOLOv5, YOLOv7, YOLOv8, and Mask R-CNN models.
3.1 Asparagus Stem Blight Image Collection
The dataset utilized in this study was acquired from the asparagus plantation in Xiazhang Town, Daiyue District, Tai’an City, Shandong Province, China. The acquisition equipment is Cannon R100 camera and Redmi K60 mobile phone, and the shooting time is September. The shooting time was September. The images with occlusion and blur were removed, leaving a total of 200 images.
3.2 Data Augmentation and Annotation
Since the original data set is too small, in order to prevent overfitting and improve generalization ability, the original data set is enhanced. The data set is expanded by four methods: image translation, rotation, contrast enhancement, and brightness enhancement. As shown in Fig. 1, the dataset is expanded to 600 images. The dimensions of the images in the dataset are standardized to 640 * 640 pixels to meet the needs of model training. Finally, the open source annotation tool labelme is used for annotation.

Figure 1: Enhanced processing of asparagus stem blight image
3.3 YOLOv8 Network Architecture
The YOLOv8 model builds on the achievements of earlier YOLO series models, further improving performance by introducing innovative features. These innovations mainly include significant changes to the backbone network, detection head structure, and loss function. The architecture of the YOLOv8 model is mainly composed of four components: the initial component serves as the input terminal, which is responsible for receiving the raw image data; secondly, the backbone network, which plays the role of extracting image features; Then there is the neck network, which further processes the feature map; Finally, there is the head network, where the features are processed in the last stage to produce the final output. The input of the YOLOv8 model uses a variety of techniques to enhance detection performance, including mosaic data augmentation, which increases the diversity of scenes by splicing images of different sizes; using adaptive anchor box calculations as a method to optimize the size and scale of anchor points; and adaptive grayscale padding to increase the robustness of the model to grayscale changes. The role of the backbone network is to extract comprehensive high-level semantic features from the original image, which contain the shape, texture and context information of the object. The neck network is responsible for merging feature maps at different sizes so that the model can accurately recognize objects of various scales. Finally, the head network receives the fused feature map, where accurate object detection is performed. The latest single-target detection algorithm adopts the Anchor-Free method and no longer relies on Anchor Boxes. This change solves the problems of inaccurate positioning and imbalanced distribution of positive and negative samples in the anchor box method. The YOLOv8 series provides five different scale model versions according to different practical application requirements: n, s, l, m, x. The network depth and detection accuracy of these models increase with the increase of version numbers. Among these five models, YOLOv8n is designed with the fewest parameters, providing the fastest detection speed. In view of this, in order to balance the algorithm’s ability to process data quickly while controlling the number of parameters in the model, this study selected the lightweight YOLOv8n version. The YOLOv8 network architecture is depicted in Fig. 2.

Figure 2: YOLOv8 network architecture
This research aims to enhance the initial YOLOv8 algorithm in two specific aspects. Firstly, the CBAM attention mechanism is added to each of the first two C2f modules of the head network to enhance the extraction of important feature information for lesions. After that, the Focal-EIoU loss function is used instead of the YOLOv8 default loss function. This loss function incorporates the advantageous features of the CIoU loss function while prioritizing higher quality bounding boxes, which enhances the model’s detection accuracy and accelerates its convergence. The research named the improved model YOLOv8-CBAM and Fig. 3 illustrate the structure of the model.
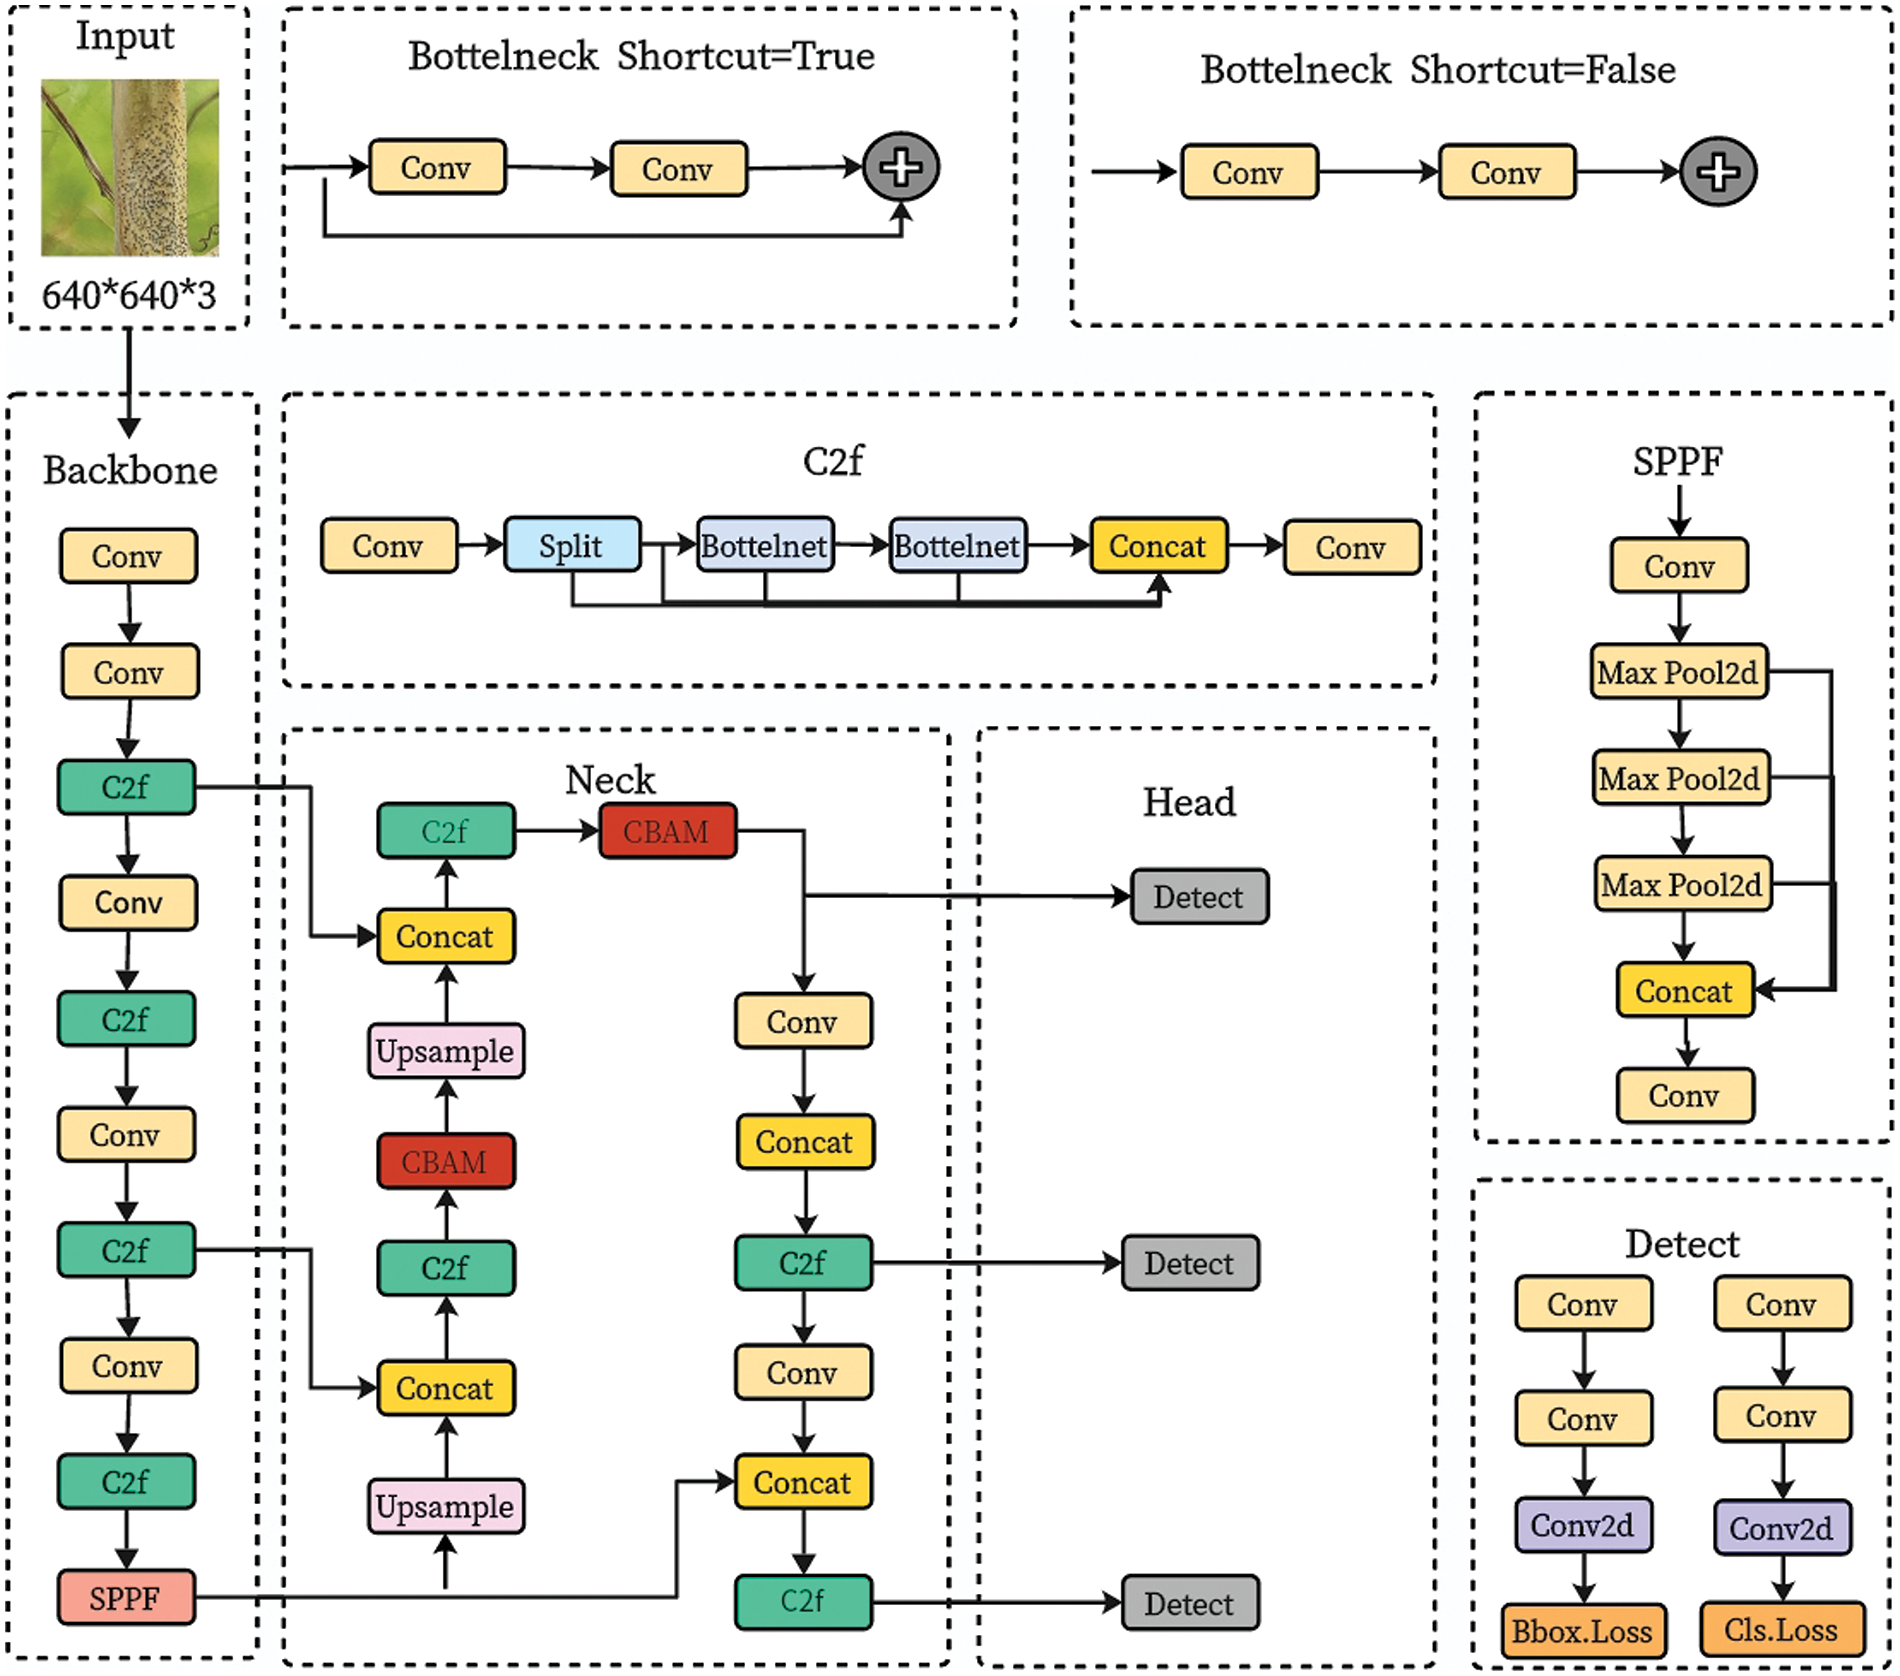
Figure 3: YOLOv8-CBAM network architecture
3.4.1 CBAM Attention Mechanism
The attention mechanism is an efficient information processing strategy that draws on the characteristics of how humans focus their attention when processing information. Through this mechanism, deep learning networks can prioritize the key parts of the input data, which significantly enhances the efficiency of neural networks. Currently, it is widely used in computer vision. In the detection of asparagus stem blight, the important feature of the stem blight phenotype image is the presence of dense black spots, but the stems around the black spots also show yellow features. In order to prevent other diseases from having yellow features and being misdetected as stem blight, the attention mechanism is added to enhance the ability of the network to refine stem features and reduce interference from irrelevant features, thereby improving the ability to recognize stem blight phenotype image features. CBAM is a typical representative of the attention mechanism, which aims to enhance the recognition of features by CNN. Fig. 4 shows its network structure. In the CBAM module, the input feature map F is first processed to generate a channel attention feature map Mc(F). Specifically, after the feature maps undergo global average pooling (AvgPool) and global maximum pooling (MaxPool) operations, their respective outputs are fed into a Multi-Layer Perceptron (MLP). Next, the output of the MLP is summed element-wise, and the sigmoid activation function is applied to obtain the final channel attention feature map Mc(F), which is calculated as follows:
where

Figure 4: CBAM attention mechanism framework diagram
After obtaining Mc(F), it is multiplied with the original input feature map one by one to obtain a new feature map
3.4.2 Focal-EIoU Loss Function
The original YOLOv8 uses the CIoU to optimize bounding box predictions. This loss function calculates the loss value by incorporating the intersection area, the distance between centroid points, and the aspect ratio of the predicted and actual bounding boxes. However, when two bounding boxes do not intersect, CIoU cannot effectively measure the distance between them; in addition, the CIoU is also limited in the precision of expressing the overlap between the two boxes. The CIoU formula is as follows:
Here,
CIoU employs the variable v to represent the aspect ratio difference instead of separately capturing the specific variations between width and height and their ground truth values. Therefore, this may sometimes limit the effectiveness of the model in optimizing similarity. CIoU is replaced by Focal-EIoU. Focal-EIoU is proposed based on EIoU combined with Focal Loss. Focal Loss is proposed to mitigate the problem of unequal sample data in bounding box regression, thereby ensuring the regression process prioritizes higher quality anchor frames, The following shows the formula for Focal-EIoU:
Here, IoU = |A ∩ B|/|A ∪ B|, γ is a parameter that controls the degree of outlier suppression, and its value is typically set to 0.5. The Focal in this loss function is different from the traditional Focal Loss. The traditional Focal Loss mainly assigns larger loss values difficult to classify samples, which can promote the model to learn difficult samples better. The loss function here is adjusted to: when the IoU value is higher, the loss is also correspondingly larger, which is equivalent to applying a greater weight to a more precise regression target, which helps to improve the precision of the regression task.
4 Training Parameters and Evaluation Indicators
The environment used in this study is CUDA11.6.2 built on a 64-bit Windows operating system, the programming platform is Pycharm, the deep learning framework is pytorch1.13.1 and python3.8, and the GPU is Tesla T4. The training rounds are 200, the batch-size is 16, the image size is the default 640 * 640, the initial learning rate of the model is set to 0.01 and the IoU threshold is set to 0.6, which indicates that the intersection and concurrency ratio between the true and predicted frames is considered correct when it is greater than 0.6. The labeled dataset is transformed into a txt file and split into training, validation, and test sets at an 8:1:1 ratio.
This research employs Precision (P), Recall (R), mean average precision (mAP), and F1 score as evaluation metrics for assessing the model performance. In the mean average precision indicator, m represents the mean. mAP@0.5 denotes the average of the AP@0.5 values for all categories, which indicates the general trend of model accuracy with recall. The higher the value of mAP@0.5, the better the ability of the model to maintain high precision despite high recall. mAP@0.5–0.95 denotes the average value of mAP calculated at different IoU thresholds (from 0.5 to 0.95 in steps of 0.05). The formulas for these evaluation metrics are shown below:
In the above equation, TP are those samples which are actually positive classes and which the model also correctly identifies as such, FP are those samples that are actually in the negative category but are incorrectly identified as positive by the model, FN are samples that are actually positive classes but are incorrectly identified as negative classes by the model, APi denotes the average accuracy of detecting type i targets, AP is the area under the PR curve, and mAP indicates the average value of each AP.
To assess the impact of the proposed enhancements on model performance, two experimental setups were devised for comparative analysis. The first set of experiments aims to explore the specific contribution of each component to the performance through ablation tests. The second set of experiments uses other versions of the YOLO family of models and currently popular target detection models to compare with the improved model in this paper to validate the effectiveness of the model in this paper.
This paper designs an ablation test based on the original YOLOv8 to verify the impact of adding CBAM module and Focal-EIoU loss function, taking precision, recall, average precision and F1 as indicators. The original YOLOv8n model is recorded as Experiment 1, the model with CBAM added but the loss function not changed is recorded as Experiment 2, the model without CBAM added but the loss function replaced by Focal-EIoU is recorded as Experiment 3, and Experiment 4 is the method proposed in this study. Table 1 shows the results of the ablation experiments.
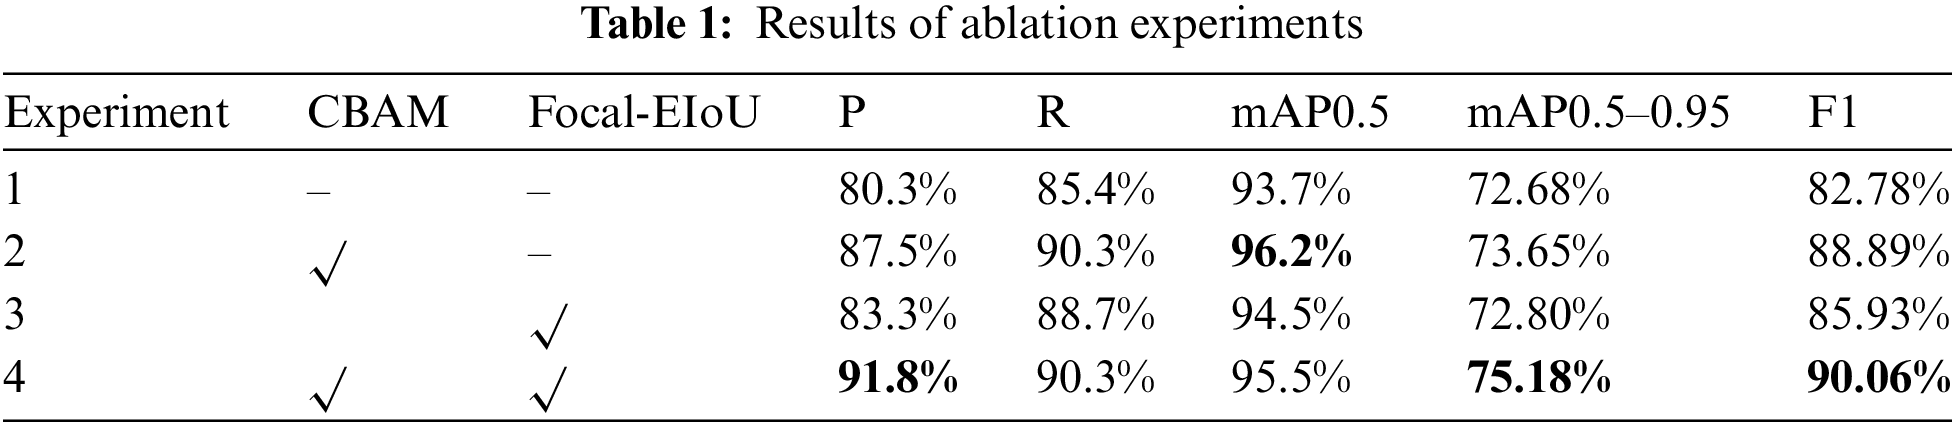
After integrating the CBAM attention mechanism in Experiment 2, the model exhibited notable improvements: precision of the model rose by 7.19%, the recall rose by 4.92%, and the mAP rose by 2.46%, the mAP0.5–0.95 rose by 0.97%, and the F1 score rose by 6.11%, this suggests that with the addition of the CBAM module, the model focuses more on the main characteristics of asparagus stem blight. In Experiment 3, after replacing the original CIoU with the Focal-EIoU, the model’s accuracy rose by 3.02%, the recall rose by 3.3%, and the mAP rose by 0.76%, the mAP0.5–0.95 rose by 0.12%, and F1 score rose by 3.15%, which suggests that the model focuses more on higher quality anchor frames after using Focal-EIoU. Experiment 4 adds the CBAM module and adopts the Focal-EIoU to the model YOLOv8-CBAM. The evaluation results of the improved model are improved compared with Experiments 1 and 3. Compared with Experiment 2, the precision is rose by 4.3%, the recall is the same, and the mAP is reduced by 0.69%, the mAP0.5–0.95 rose by 1.53%, and the F1 score rose by 1.17%.
By comparing the results of YOLOv8n with those of the method in this study, it is demonstrated that the method presented in this study can effectively improve the detection results. The mAP0.5 curves of the models pre- and post-improvement, along with the detection effect diagram of the validation set model, are depicted in Figs. 5 and 6. The study demonstrates that the YOLOv8-CBAM model presented in this study has a good recognition ability for asparagus stem blight.

Figure 5: mAP0.5 curve of the model before and after improvement

Figure 6: Model detection effect diagram (a) Manual labeling; (b) YOLOv8n; (c) This method
5.2 Comparison with Current Advanced Algorithms
To showcase the performance of the model in the target detection task, we chose a variety of models for performance comparison, including Mask R-CNN, YOLOv5, YOLOv7, YOLOv8. Table 2 lists the precision, recall and average precision of different models.
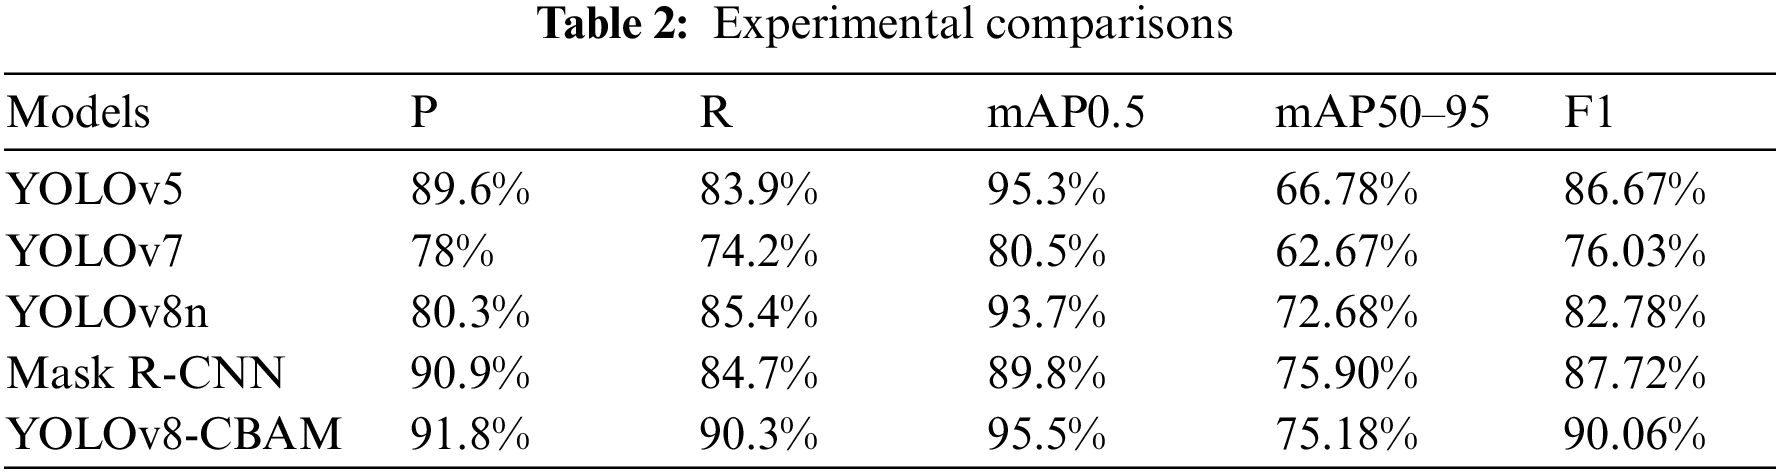
From Table 2, we can see the P, R, mAP, and F1 score of YOLOv8-CBAM are higher than those of other target detection algorithms. The P value is 2.14%, 13.83%, 11.49% and 0.89% higher than YOLOv5, YOLOv7, YOLOv8 and Mask R-CNN, respectively, and the R value is 6.45%, 16.13%, 4.92% and 5.57% higher than YOLOv5, YOLOv7, YOLOv8 and Mask R-CNN, respectively. The mAP is 0.22%, 14.99%, 1.77% and 5.71% higher than YOLOv5, YOLOv7, YOLOv8 and Mask R-CNN, respectively. The mAP0.5–0.95 is 8.4%, 12.51% and 2.5% higher than YOLOv5, YOLOv7 and YOLOv8, respectively, and 0.72% lower than Mask R-CNN. The F1 score is 3.39%, 14.03%, 7.28%, and 2.24% higher than that of YOLOv5, YOLOv7, YOLOv8, and Mask R-CNN, respectively.
This study proposes a YOLOv8-CBAM target detection model. Add the CBAM module after the C2f module in the head, which enhanced the model’s ability to capture small features of lesions. The introduction of Focal-EIoU instead of the initial CIoU helps the model to converge quickly and improves the detection accuracy Experimental results indicate that the YOLOv8-CBAM model can precisely recognize and detect asparagus stem blight. The improved object detection model has a precision of 91.8%, a recall of 90.3%, an mAP0.5 of 95.5%, an mAP0.5–0.95 of 75.18%, and an F1 score of 90.06%, which are 11.49%, 4.92%, 1.77%, 2.5%, and 7.28% higher than the unimproved model, respectively. The method proposed in this study can quickly and accurately identify asparagus stem blight lesions. By analyzing the shape, size, color and distribution of the lesions, this method can preliminarily diagnose whether asparagus stem blight has occurred and recommend prevention and control strategies in a timely manner. This has extremely important practical value for managing and controlling diseases in asparagus plantations.
At present, the algorithm has not been deployed in embedded devices to achieve real-time detection of asparagus stem blight. The next step will be to promote research in this area and conduct effective detection in the early stages of asparagus disease so that prevention and control measures can be taken to avoid losses caused by large-scale outbreaks.
Acknowledgement: We sincerely thank the Feicheng Artificial Intelligence Robot and Smart Agriculture Service Platform for providing the necessary financial support for this research.
Funding Statement: This work was supported by the Feicheng Artificial Intelligence Robot and Smart Agriculture Service Platform (381387).
Author Contributions: The authors confirm contribution to the paper as follows: study conception and design: Chao Zhang, Shunshun Ji, Jiajun Sun; data collection: Shunshun Ji, Jiajun Sun; analysis and interpretation of results: Chao Zhang, Shunshun Ji; draft manuscript preparation: Shunshun Ji, Jiajun Sun. All authors reviewed the results and approved the final version of the manuscript.
Availability of Data and Materials: The data that support the findings of this study are available from the corresponding author, Chao Zhang, upon reasonable request.
Ethics Approval: Not applicable.
Conflicts of Interest: The authors declare that they have no conflicts of interest to report regarding the present study.
References
1. K. J. Liu, Y. J. Lu, Y. X. Chen, and S. J. Li, “Biological characteristics of asparagus stem blight pathogen,” (in Chinese), Acta Phytopathologica Sinica, no. 6, pp. 299–304, 1994. [Google Scholar]
2. Y. Q. Yang, X. M. Li, F. Meng, B. Lan, and J. Zhang, “Identification of pathogens causing asparagus stem blight and analysis of regional differences,” (in Chinese), Acta Phytophylacica Sinica, vol. 39, no. 4, pp. 315–320, 2012. [Google Scholar]
3. D. Wang and X. J. Chai, “Application of machine learning in plant disease identification research,” (in Chinese), J. Chinese Agri. Mech., vol. 40, no. 9, pp. 171–180, 2019. [Google Scholar]
4. U. Khan and A. Oberoi, “Plant disease detection techniques: A review,” Int. J. Comput. Sci. and Mobile Comput., vol. 8, no. 4, pp. 59–68, 2019. [Google Scholar]
5. S. Song, “Research on image recognition method of apple leaf disease in the Loess Plateau,” M.S. dissertation, Northwest Agriculture and Forestry University, Xianyang, China, 2017. [Google Scholar]
6. C. Corinna and V. Vapnik, “Support-vector networks,” Mach. Learn., vol. 20, no. 3, pp. 273–297, 1995. doi: 10.1007/BF00994018. [Google Scholar] [CrossRef]
7. C. C. Liu, T. Yang, J. J. Ma, F. C. Sun, and X. X. Li, “Ophiopogon japonicus leaf disease recognition system based on PCA-SVM,” (in Chinese), Chinese J Agr. Mech., vol. 40, no. 8, pp. 132–136, 2019. [Google Scholar]
8. S. Chakraborty, S. Paul, and M. Rahat-uz-Zaman, “Prediction of apple leaf diseases using multiclass support vector machine,” in 2021 2Nd Int. Conf. Robot., Elect. Signal Process. Tech. (ICREST), Dhaka, Bangladesh, 2021, pp. 147–151. [Google Scholar]
9. Y. Wan, “Rice disease recognition based on convolutional neural network,” M.S. dissertation, Jiangxi Agricultural University, China, 2021. [Google Scholar]
10. R. Girshick, “Fast R-CNN,” in Proc. IEEE Int. Conf. Comput. Vis., Santiago, Chile, 2015, pp. 1440–1448. [Google Scholar]
11. S. Ren, K. He, R. Girshick, and J. Sun, “Faster R-CNN: Towards real-time object detection with region proposal networks,” IEEE Trans. Pattern Anal. Mach. Intell., vol. 39, no. 6, pp. 1137–1149, 2017. doi: 10.1109/TPAMI.2016.2577031. [Google Scholar] [PubMed] [CrossRef]
12. R. Mao et al., “Recognizing stripe rust and yellow dwarf of wheat using improved Faster R-CNN,” (in Chinese), Transact. Chinese Soc. Agri. Eng., vol. 38, no. 17, pp. 176–185, 2022. [Google Scholar]
13. M. M. Ozguven and K. Adem, “Automatic detection and classification of leaf spot disease in sugar beet using deep learning algorithms,” Physica A: Stat. Mech. Appl., vol. 535, no. 1, pp. 122537–122544, 2019. doi: 10.1016/j.physa.2019.122537. [Google Scholar] [CrossRef]
14. Z. Rehman et al., “Recognizing apple leaf diseases using a novel parallel real-time processing framework based on MASK RCNN and transfer learning: An application for smart agriculture,” IET Image Process., vol. 15, no. 10, pp. 2157–2168, 2021. doi: 10.1049/ipr2.12183. [Google Scholar] [CrossRef]
15. J. Redmon, S. Divvala, R. Girshick, and A. Farhadi, “You only look once: Unified, real-time object detection,” in Proc. IEEE Conf. Comput. Vis. Pattern Recognit., Las Vegas, NV, USA, 2016, pp. 779–788. [Google Scholar]
16. W. Liu et al., “SSD: Single shot multibox detector,” in Computer Vision–ECCV 2016, 2016, vol. 9905, pp. 21–37. doi: 10.1007/978-3-319-46448-0_2. [Google Scholar] [CrossRef]
17. Z. Y. Chen et al., “Plant disease recognition model based on improved YOLOv5,” Agronomy, vol. 12, no. 2, 2022, Art. no. 365. doi: 10.3390/agronomy12020365. [Google Scholar] [CrossRef]
18. J. Liu and X. W. Wang, “Tomato diseases and pests detection based on improved Yolo V3 convolutional neural network,” Front. Plant Sci., vol. 11, 2020, Art. no. 898. doi: 10.3389/fpls.2020.00898. [Google Scholar] [PubMed] [CrossRef]
19. D. Z. Sun, H. Liu, J. Y. Liu, Z. Ding, J. X. Xie and W. X. Wang, “Recognition of tea diseases based on improved YOLOv4 model,” (in Chinese), J. Northwest AF Univ. (Nat. Sci. Ed.), vol. 51, no. 9, pp. 145–154, 2023. [Google Scholar]
20. C. Pang, C. A. Wang, Y. Su, and Z. J. Zhang, “Rice disease detection method based on improved YOLOv8,” (in Chinese), J. Inner Mongolia Agri. Univ. (Nat. Sci. Ed.), vol. 45, pp. 62–68, 2024. [Google Scholar]
21. G. Wen and M. Li, “An improved YOLOv8 algorithm for leaf disease detection,” in 2023 Int. Conf. Artif. Intell. and Automat. Control (AIAC), Xiamen, China, 2023, pp. 21–24. [Google Scholar]
22. G. L. Yang, J. X. Wang, Z. L. Nie, H. Yang, and S. Y. Yu, “A lightweight YOLOv8 tomato detection algorithm combining feature enhancement and attention,” Agronomy, vol. 13, no. 7, 2023, Art. no. 1824. doi: 10.3390/agronomy13071824. [Google Scholar] [CrossRef]
23. F. Solimani et al., “Optimizing tomato plant phenotyping detection: Boosting YOLOv8 architecture to tackle data complexity,” Comput. Electron. Agric., vol. 218, no. 6, 2024, Art. no. 108728. doi: 10.1016/j.compag.2024.108728. [Google Scholar] [CrossRef]
Cite This Article
 Copyright © 2024 The Author(s). Published by Tech Science Press.
This work is licensed under a Creative Commons Attribution 4.0 International License , which permits unrestricted use, distribution, and reproduction in any medium, provided the original work is properly cited.
 Downloads
 Citation Tools