
 Submit a Paper
 Propose a Special lssue
 Open Access
ARTICLE

Guided-YNet: Saliency Feature-Guided Interactive Feature Enhancement Lung Tumor Segmentation Network
1 School of Computer Science and Engineering, North Minzu University, Yinchuan, 750021, China
2 School of Medical Information & Engineering, Ningxia Medical University, Yinchuan, 750004, China
3 Key Laboratory of Image and Graphics Intelligent Processing of State Ethnic Affairs Commission, North Minzu University, Yinchuan, 750021, China
* Corresponding Author: Yunfeng Pan. Email:
(This article belongs to the Special Issue: Deep Learning in Medical Imaging-Disease Segmentation and Classification)
Computers, Materials & Continua 2024, 80(3), 4813-4832. https://doi.org/10.32604/cmc.2024.054685
Received 05 June 2024; Accepted 19 August 2024; Issue published 12 September 2024
 View Full Text
 Download PDF
Abstract
Multimodal lung tumor medical images can provide anatomical and functional information for the same lesion. Such as Positron Emission Computed Tomography (PET), Computed Tomography (CT), and PET-CT. How to utilize the lesion anatomical and functional information effectively and improve the network segmentation performance are key questions. To solve the problem, the Saliency Feature-Guided Interactive Feature Enhancement Lung Tumor Segmentation Network (Guide-YNet) is proposed in this paper. Firstly, a double-encoder single-decoder U-Net is used as the backbone in this model, a single-coder single-decoder U-Net is used to generate the saliency guided feature using PET image and transmit it into the skip connection of the backbone, and the high sensitivity of PET images to tumors is used to guide the network to accurately locate lesions. Secondly, a Cross Scale Feature Enhancement Module (CSFEM) is designed to extract multi-scale fusion features after downsampling. Thirdly, a Cross-Layer Interactive Feature Enhancement Module (CIFEM) is designed in the encoder to enhance the spatial position information and semantic information. Finally, a Cross-Dimension Cross-Layer Feature Enhancement Module (CCFEM) is proposed in the decoder, which effectively extracts multimodal image features through global attention and multi-dimension local attention. The proposed method is verified on the lung multimodal medical image datasets, and the results show that the Mean Intersection over Union (MIoU), Accuracy (Acc), Dice Similarity Coefficient (Dice), Volumetric overlap error (Voe), Relative volume difference (Rvd) of the proposed method on lung lesion segmentation are 87.27%, 93.08%, 97.77%, 95.92%, 89.28%, and 88.68%, respectively. It is of great significance for computer-aided diagnosis.Keywords
With the rapid development of computer hardware and massive data sharing. Deep learning is widely used in various fields. Especially in the field of medical image processing, and good results are achieved in the computer-aided diagnostics of skin cancer, breast cancer, lung cancer, and other diseases [1]. Ronneberger et al. [2] proposed the U-Net deep learning model in 2015. Due to its excellent structural features, it is widely used in the field of medical image segmentation and has achieved good results in the clinical auxiliary diagnosis of major diseases such as brain tumors, lung cancer, liver tumors, and teeth [3]. To improve the accuracy of medical image segmentation, many scholars have carried out further research on U-Net. Zhang et al. [4] proposed the Transformer U-Net and local binary energy function model (TUNet-LBF), which delivers the global information obtained by TUNet (Transformer U-Net) as prior knowledge into the segmentation stage and realizes the high-quality segmentation of retinal blood vessels. Oktay et al. [5] proposed the Attention U-Net, which uses the attention-gate mechanism to automatically learn target structures of different shapes and sizes and achieves a remarkable segmentation effect on CT abdominal datasets.
Although remarkable achievements are obtained by U-Net and its improved network in medical image segmentation. At present, most of the U-Net-based Encoding-decoding networks are applied to single modal image segmentation, which improves the segmentation performance [6]. However, the single modal medical image cannot reflect the lesion information completely and accurately and may lead to diagnostic errors [7]. In multimodal medical image segmentation, such as PET/CT, PET, and CT, the high sensitivity in detecting tumor metabolism of PET is utilized to do the diagnosis, staging, and evaluation of tumors, the high sensitivity in detecting tumor anatomical information of CT is utilized to locate the lesion position, analysis the structure and space relation with other tissues [8].
Usually, medical images are affected by the image acquisition equipment, resulting in problems, such as low contrast and difficult identification of boundary areas [9]. In multimodal medical image segmentation, different modal images contain different lesion information, and interactive enhancement of different modal images can complement the lesion’s different modalities information, which can accurately segment lesions. A clinical knowledge-driven brain tumor segmentation model was proposed by Lin et al. [10], in which a modal correlation cross-attention module is designed in the encoder to enhance multi-modal features interactively and a Trans&CNN (Convolutional Neural Network) feature calibration module is designed behind the bottleneck layer to further enhance global and local information fusion capabilities. In addition, the ability of local feature representation and long-distance feature extraction is improved. A cross-modal feature fusion strategy for dual spatial maps was devised by Xu et al. [11] in the bottleneck layer of the U-Net, which integrated deep features from multiple modalities at a global and semantic level. Furthermore, the context information is effectively obtained and feature differences among different modes are alleviated. Yang et al. [12] proposed a flexible multimodal segmentation fusion network. The cross-modal feature enhancement module was designed in the encoder to facilitate the interaction and enhancement of features from different modalities. In the decoder, a multimodal collaborative module was designed to fuse specific modality encoder information with decoder information, effectively extracting modality-specific information from the encoder for high-performance segmentation. Wang et al. [13] introduced a structured learning approach. In the decoder, a context-aware dense connection mechanism was designed to enhance the feature propagation along the target decoder paths, effectively improving feature propagation in the decoder and enhancing segmentation results. However, existing multimodal image segmentation networks have not thoroughly considered the complementarity of information among different modality images. And the utilization of multi-modal image information is still not sufficient.
In the context of the U-Net-based encoder-decoder network structure, skip connection can alleviate the semantic gap between the encoder and decoder to some degree. Therefore, it is an effective method to transmit appropriate information to these skip connections, which can effectively guide the network to achieve precise lesion segmentation. Furthermore, in the field of multimodal medical image segmentation, there are differences in feature information among different modal images. It can reduce segmentation accuracy that inappropriately using features with differences. However, different modalities of images also exhibit semantic correlations. The rational and effective utilization of features from different modalities is a challenge in improving segmentation accuracy. To solve the aforementioned problems, this paper proposes the Guide-YNet. The main contributions are as follows:
1. The lesion position information in PET images is introduced in the skip connection, which utilize the high sensitivity of PET images to tumors to locate lesions.
2. The Cross Scale Feature Enhancement Module (CSFEM) is proposed to enhance the feature extraction capability in the encoder and fuse the features of two modalities.
3. The Cross-Layer Interactive Feature Enhancement Module (CIFEM) is designed in the encoder, which effectively acquires multi-resolution feature fusion information from deep and shallow layers by serially integrating self-attention mechanisms to fuse spatial, semantic, and their fused information.
4. The Cross-Dimension Cross-Layer Feature Enhancement Module (CCFEM) is constructed in the decoder to effectively extract multi-modal image feature information through global attention and multi-dimension local attention.
In the Encoding-decoding network, downsampling in the encoder is a process of losing information, while upsampling in the decoder is a process of recovering information. It is difficult to recover high-resolution spatial information based on low-resolution semantic information alone. Hence, it is important to complete the valid information in the U-Net skip connection to improve the segmentation accuracy. Zhou et al. [14] proposed a U-Net++ network in 2018, which combines U-Net of different layers in a nested manner redesigned skip connection, and achieved better segmentation results. Li et al. [15] proposed that the Transformer and information bottlenecks based on the U-Net model (IB-TransUNet) use a multi-resolution fusion mechanism in skip connection to endow high-resolution feature map spatial and semantic information. Ding et al. [16] proposed a multi-scale channel attention network that embeds a multi-scale channel self-attention module in the skip connection to recalibrate the multilayer feature map and achieve good results on the public dataset. Hung et al. [17] proposed a cross-sectioning attention mechanism and embedded in skip connections to systematically learn multi-scale cross-sectioning information of lesions, which improved the accuracy of segmentation in the surrounding region. In the above work, the skip connection is used to enhance the decoder information in different layers and achieve better segmentation performance. Although the skip connection is improved to some degree, only the information of the encoder is enhanced.
However, some saliency information is ignored to guide how to improve network segmentation accuracy. CT images provide the lesion anatomical information, which is the lesion edge information. While PET images provide the lesion metabolic information. The rational use of lesion metabolic information in PET images can assist the network locate the lesion accurately. PET/CT Images are obtained by the fusion of PET images and CT images, which not only contained the lesion anatomical information, but also contained the lesion metabolic information. However, the structure of the image is not fine, the target is not clear after fusion, and the true texture details cannot be recovered [18]. Therefore, in the skip connection, the saliency PET position information is introduced to guide the network in this paper.
In addition, it is important to extract multiscale features for medical image segmentation in U-Net [19]. Wang et al. [20] proposed a non-local multi-scale Transformer module, which effectively captures multi-scale non-local features with long-distance dependencies and improves the ability of the model to learn multi-semantic global context information. Khan et al. [21] proposed a pyramidical multi-scale encoder-decoder network (PMED-Net) for medical image segmentation, in which 6 different scale images of the same source image are used as input in the 6 pyramid levels of the network, which increases the network’s ability to extract detailed information at different scales from the image. Compared with these works, in this paper, multi-scale features are extracted in each layer of the encoder. And the spatial information lost in downsampling is maximally preserved.
Not only that, in the medical image segmentation based on the U-Net network, the shallow features contain the spatial information of the lesion, while the deep features contain the semantic information of the lesion. Shallow features are important for extracting edge information, and deep features are important for target recognition [22]. Therefore, it is the key to effectively extracting the multi-scale deep-shallow features, which improves the segmentation accuracy. Zhang et al. [23] proposed a Swin Transformer boosted U-Net (ST-UNet) segmentation network and designed a cross-layer feature enhancement module in the skip connection to integrate the features of different perception levels, which enhance the sensitivity of the model to the target object. In the automatic tumor segmentation method of PET/CT image based on context coordination and boundary perception proposed by Luo et al. [24], a context coordination module is designed to optimize the fusion information of the deep and shallow layers and enhance the tumor boundary segmentation. Although methods based on convolutional neural networks have powerful local modeling capabilities, their performance in learning long-distance dependencies is limited to the inherent locality of convolutional operations [25]. The Conformer proposed by Peng et al. [26] combined CNN-based local features with Transformer-based global representation, which enhances representation learning and retains local features and global representations to the greatest extent. Lin et al. [27] proposed the Dual Swin Transformer U-Net (DS-TransUNet) model, which integrates the layered Swin Transformer into the encoding and decoding layers of the U-Net network, that can effectively model non-local dependencies and multi-scale contexts and improve the effect of the model on segmentation of different medical images. Chen et al. [28] proposed the Transformer U-Net (TransUNet) model, which uses a hybrid CNN-Transformer structure as an encoder to accurately locate lesions with high-resolution spatial information from CNNs and global context encoded information from Transformers. Compared with these works, in this paper the shallow spatial information is used to determine lesion shape and deep semantic information is used to identify lesions. These two kinds of information are fused to segment the lesion more accurately.
The paper proposes a Saliency Feature-Guided Interactive Feature Enhancement Segmentation Network, and its structure is shown in Fig. 1.

Figure 1: Structure of saliency feature-guided interactive feature enhancement segmentation network
In this model, there are two couple U-Net, the first structure is a two-encoder and one-decoder U-Net and named backbone U-Net, the second structure is a one-encoder and one-decoder U-Net and named guided U-Net. In the backbone U-Net, there are two encoders, first is PET/CT image encoder, second is the CT image encoder. It is divided into four stages: Stage 1, Stage 2, Stage 3, and Stage 4. There are three modules in Stage 1, first is the feature extraction module of PET/CT images, second is the feature extraction module of CT images, third is the feature enhancement fusion module of two-modal images. In the guided U-Net, there is a PET image encoder, the encoder is also divided into four stages, and the guidance information of different scales L1, L2, L3, L4 are obtained from the downsampling of the decoder output results. The structure of these four stages is the same, and the other stages are not described here. The Cross Scale Feature Enhancement Module (CSFEM) is used to enhance the downsampling results and fuse the features from PET/CT and CT images, as shown in Fig. 1A. In the latter 3 stages of the encoder, the CIFEM is used to combine deep-layer features from the current stage with shallow-layer features from the previous stage, as shown in Fig. 1B. The bottleneck layer structure is similar to the last three layers of the encoder. In the skip connection of the first stage, FS1 is obtained by adding the fusion information of CSFEM1 and the guidance information L1. In the skip connection of the second stage, FS2 is obtained by adding the fusion information of CSFEM2 and the guidance information L2. In the skip connection of the third stage, FS3 is obtained by adding the fusion information of CSFEM3 and the guidance information L3. In the skip connection of the fourth stage, FS4 is obtained by adding the fusion information of CSFEM4 and the guidance information L4. Each stage in the decoder is consisted by a CCFEM and a convolutional block. The position of CCFEM is shown in Fig. 1C. The shallow feature FSi, i ∈ {1, 2, 3, 4} and deep feature FDi, i ∈ {1, 2, 3, 4} are enhanced and fused in the CCFEM module, then transmit it into the convolutional block. The pseudocode of the Guided-YNet is shown in Algorithm 1.

3.1 Cross-Scale Feature Enhancement Module
In this model, there are two same branches, using the cross-scale attention mechanism to extract PET/CT image and CT image features, respectively. The structure is shown in Fig. 2. The CSFEM module is used to extract multi-scale features of PET/CT and CT images, and the multi-scale information of different layers in the encoder is captured by the Cross-Scale Attention module (CAM) mechanism, which effectively alleviated the problem of degrading segmentation accuracy caused by different lesion shapes, appearances, and sizes. Because the Cross-Scale Attention module (CAM) of both branches is the same, only one of the CAM modules is introduced here. Firstly, the feature map of different scales Fm ∈ RC × H × W, m ∈ {1, 2, 3, 4} is obtained by the convolution operation with a convolution kernel size of 1, 3, 5 and 7. It is summed to obtain the feature map F ∈ RC × H × W, where H and W represent the height and width of the feature map, and C represents the number of channels of the feature map, respectively.

Figure 2: Structure of cross scale feature enhancement module
Secondly, the global average pooling function is used to compress F into one-dimensional feature information S ∈ {s1, ..., sk, ..., sC}, S ∈ RC × 1 × 1 at the channel dimension. The full connection layer operation is used to compress S to Z ∈ RC/r × 1 × 1, r is the reduction rate, here is 16. Finally, the dimensions are extended to C × 1 × 1 by using unsqueeze operation, respectively. The attention weight Cm is obtained by using the Softmax function for each branch, and then Cm is multiplied with corresponding inputs to obtain weighted feature information Um ∈ RC × H × W. Finally, the elements of Um are summed to obtain U ∈ RC × H × W. The calculation process of four different scale convolution operations is shown in Eqs. (1)–(3).
3.2 Cross-Layer Interactive Feature Enhancement Module
In convolutional neural networks, shallow features contain spatial information, such as shape, edge, texture, etc., while deep features contain semantic information, which is suitable for recognizing lesion regions, lacking spatial details.
Therefore, the Cross-Layer Interactive Feature Enhancement Module (CIFEM) is designed to interactively enhance shallow and deep features, as shown in Fig. 3. In CIFEM, the Cross-Fusion Attention (CA) module is used to fuse the deep and shallow features, and then the self-attention mechanism and the strip pooling self-attention mechanism are used to extract the global features. The fusion features are enhanced by local and global methods. FF_S ∈ R2C × H/2 × W/2 and FF_D ∈ R2C × H/2 × W/2 represent the two inputs of CIFEM. Firstly, FF_S and FF_D are transmitted into the Cross-Fusion Attention (CA) module to fully utilize the deep-shallow features and enhance the network’s ability to learn lesion features. Secondly, the results FF_SA, FF_DA, and FF_SDF of the CA module are used as Q, K, and V of self-attention, respectively. Finally, the result FG of self-attention is used as the input of strip pooling self-attention module, and the result FGSP is obtained. The long-distance dependence of lesion information is fully obtained through two cascaded self-attention. The calculation process is shown in Eqs. (4)–(6).
where FG ∈ R2C × H/2 × W/2, FGSP ∈ R2C × H/2 × W/2, “CA” represents the Cross-Fusion Attention module, “SelfAtt” represents the self-attention, “StripPoolingAtt” represents the self-attention with strip pooling.

Figure 3: Structure of cross-layer interactive feature enhancement module
3.3 Cross-Dimension Cross-Layer Feature Enhancement Module
In multimodal medical image segmentation, there is complementarity among different modal images. Basic fusion operations such as add and concatenation cannot take advantage of the complementarity of different modal lesion information and will also reduce the segmentation accuracy. Therefore, the CCFEM module is designed in the decoder to enhance the skip connection and decoder information. The module structure is shown in Fig. 4. In CCFEM, the features in the three dimensions of FS are extracted to obtain the semantic features in different dimensions. Then, it is stitched with global features to enhance the feature of fusing PET image information. Finally, FS and FD are fused and enhanced by the cross-layer attention module. In this way, the features of the fused image and the complementarity between different modal images are fully extracted.

Figure 4: Structure of cross-dimension cross-layer feature enhancement module
In the Cross-Dimension Attention module, as shown in Fig. 4a. Firstly, Fs is transformed into the feature map FC ∈ RC × H × W, FH ∈ RH × W × C, FW ∈ RW × C × H along the Channel, Height, and Width dimensions respectively through the transpose operation. Spatial and channel attention is used for feature maps along Channel dimensions, and spatial attention is used for feature maps along Height and Width dimensions to capture semantic information of different dimensions. After that, the transpose operation is performed to restore the original dimension, and the attention map FC_A ∈ RC × H × W, FH_A ∈ RC × H × W, and FW_A ∈ RC × H × W are obtained. Since the feature map along the Channel dimension is composed of H × W feature maps of C channels, it is useful to use channel attention for FC. Secondly, inspired by Reference [29], the attention map FG_A ∈ RC × H × W is obtained by capturing the long-distance dependencies using permute attention operations. This operation encodes feature representations in the height and width dimensions in a linear mapping, so long-distance dependencies can be captured while avoiding the process of building self-attention in the Transformer. The attention map of the three dimensions is added by elements and then concatenated with the global attention map, and then concatenated with FS to get the enhanced feature map FSA ∈ RC × H × W.
In the Cross-Layer Attention module, as shown in Fig. 4b. Firstly, the feature maps FSA and FD are fused through the Deep-Shallow Feature Fusion module. The spatial attention mechanism is used to generate the spatial attention weight γS for FSA, and the channel attention mechanism is used to generate the channel attention weight γD for FD. Secondly, The deep feature FD and γS are multiplied to enhance the detail representation ability of the deep feature. The shallow features FSA and γD are multiplied to guide the shallow features with the deep features that contain abundant semantic information. Finally, the results of cross-multiplication are concatenated to obtain the multi-dimension attention map FDSF. The calculation process of multidimensional local attention is shown in Eqs. (7) and (8).
where “CrossDimension_Att” represents the Cross-Dimension Attention module, “CrossLayer_Att” represents the Cross-Layer Attention module.
4.1 Datasets and Evaluation Indicators
The Multimodal Lung Tumors (MLT) dataset [30] is a private dataset and it was adopted in our previous work. In this dataset, the training set contains 2025 PET, CT, and PET/CT images each, and the test set contains 405 PET, CT, and PET/CT image images each. All images in this dataset are from a Class III Grade A hospital in Ningxia, and personal tags in the images are removed to protect privacy.
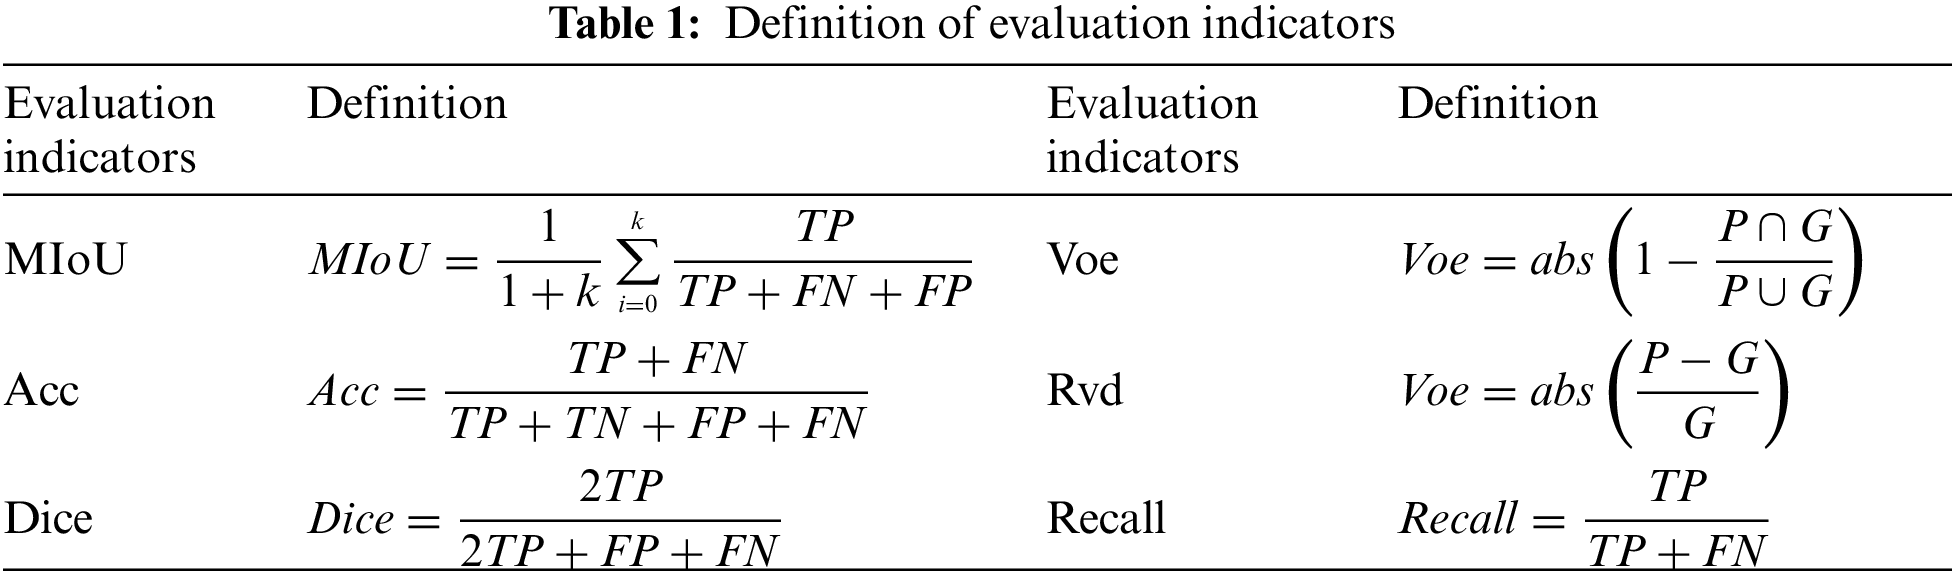
The evaluation indicators used in this experiment are Mean Intersection over Union (MIoU), Accuracy (Acc), Dice Similarity Coefficient (Dice), Volumetric overlap error (Voe), Relative volume difference (Rvd), and Recall, where the values of Voe and Rvd are represented by 1 subtract the values of Voe and Rvd. In medical image segmentation, MIoU, Dice, Acc, Recall, Voe and Rvd are commonly used evaluation indicators. The overlap degree between the predicted segmentation and the ground truth can be directly measured by MIoU, which is an intuitive evaluation of the segmentation results. Compared with accuracy and other indicators, MIoU is more robust to class imbalance. Dice is used to measure the similarity between the predicted segmentation and the ground truth. It is especially suitable for the case that the proportion of the target area is small. Acc represents the proportion of predicted positive samples in the total samples. It can intuitively reflect the overall performance of the model on the entire dataset. Recall represents the proportion of predicted positive samples among all actual positive samples. Voe measures the overlap error between the segmentation result and the ground truth, which intuitively reflects the segmentation performance. Rvd measures the volume difference between the predicted segmented region and the ground truth. These indicators are often combined in practice to provide a comprehensive assessment of segmentation performance. The evaluation indicator formula is defined as shown in Table 1, where True Positive (TP) means that the lesion area is predicted as the lesion area, and True Negative (TF) means that the normal tissue area is predicted as the normal tissue area. False Negative (FN) means that the lesion area is predicted to be a normal tissue area, and False Positive (FP) means that the normal tissue area is predicted to be a lesion area. P represents the target pixel predicted by the model, and G represents the target pixel of the label (Ground truth).
The experimental environment of this model is as follows: Hardware environment: processor Intel(R) Xeon(R) Gold 6154 CPU (Central Processing Unit), memory 64 GB, graphics card NVIDIA TITAN V, memory 24 GB; Software environment: Windows Server 2019 Datacenter 64-bit OS, Python 3.9, PyTorch1.7.0, CUDA (Compute Unified Device Architecture) Version 11.1.106. In the process of model training, the Adam optimizer is used to ensure the convergence speed and the model performance. Set the number of iterations to 120, the learning rate to 0.0001, and the batch size to 4. The binary cross entropy loss function is used to evaluate the difference between the predicted value and the actual value. In order to verify the effectiveness of the model proposed in this paper, experiments are conducted from the following four aspects: Experiment 1 shows the influence of the models on the segmentation results in different scales, dimensions, and depths and their interactions; Experiment 2 proves the validity of the internal structure of the three modules; Experiment 3 shows the comparison of the model proposed in this paper with existing models; Experiment 4 proves the effectiveness of adding PET image guidance to model segmentation in multimodal image segmentation.
1) Inter-module ablation experiment
A total of 7 experiments are designed to prove the validity of the proposed model at different scales, dimensions, depths, and interactions. The results are shown in Table 2. When the model focuses only on scale or dimension or depth, the effect in the case of focusing only on dimension is significantly better than in the other two cases. Similarly, when the model combines scale and dimension, scale and depth, and dimension and depth, the result of combining scale and dimension and dimension and depth is better than that of combining scale and depth. The results of Acc, Dice, MIoU, Recall, Voe and Rvd are 0.2%, 0.65%, 1.07%, 0.19%, 0.53% and 0.55% higher than those of the sub-optimal results. It is 1.17%, 3.9%, 5.99%, 5.37%, 3.31%, and 4.54% higher than the worst result. As shown in Fig. 5b, segmentation white points and lesion segmentation breaks will occur when the model focuses on scale or depth or dimension, such as Row 2 and Column 6, Row 4 and Column 7. In the case of combining the two concerns, the result of combining scale and dimension is superior to the other results on the whole, but there is still a subtle under-segmentation phenomenon, and the situation of focusing on scale, depth, and dimension at the same time alleviates the above problem, proving the effectiveness of the network model to perform high-precision lesion segmentation with the simultaneous effect of scale, depth, and dimension.
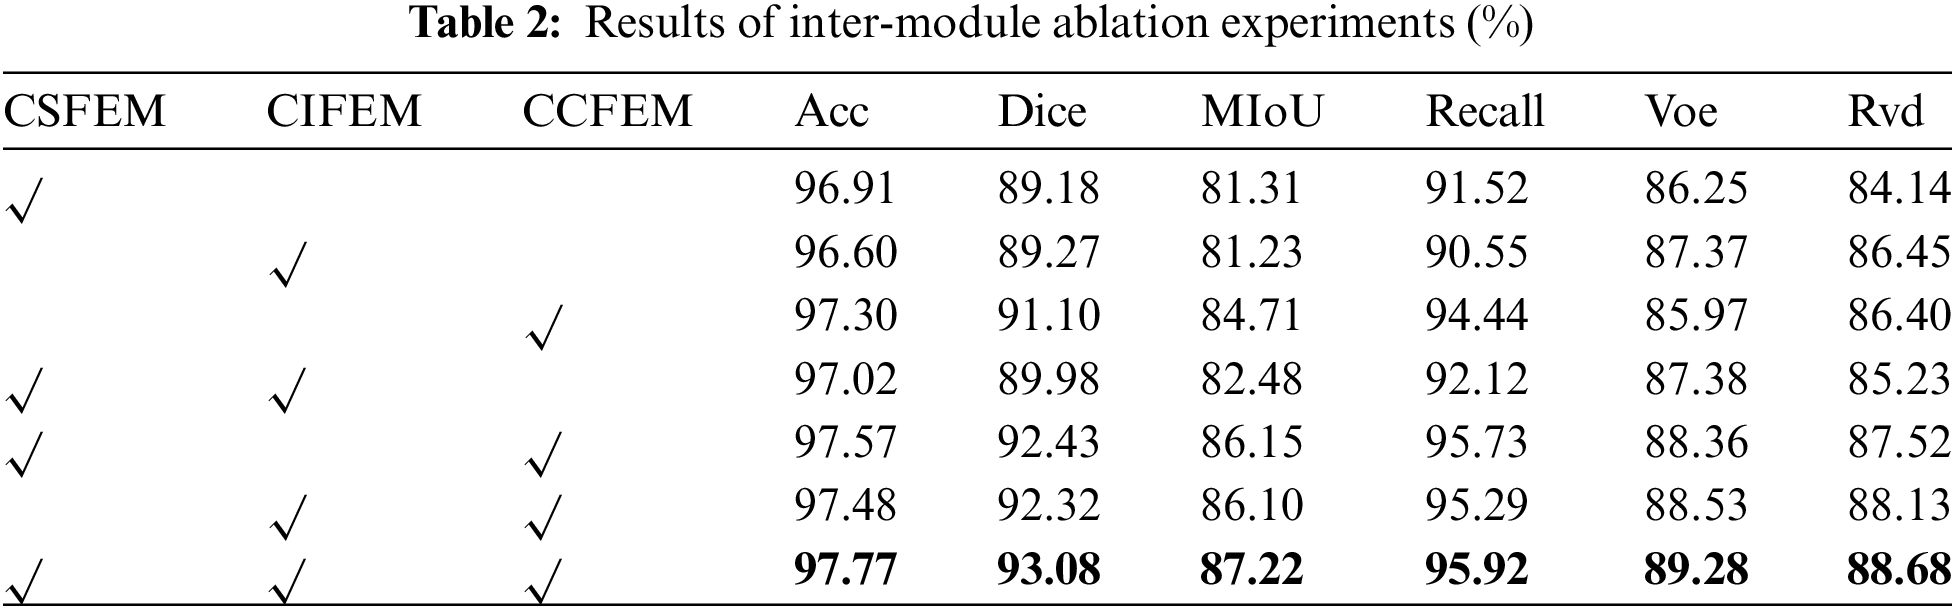

Figure 5: Radar chart (a) and visual segmentation results (b) of inter-module ablation experiments
2) In-module ablation experiment
Three sets of sub-experiments are designed in this group. The first set of sub-experiments verified the validity of four different scale branches designed in CSFEM module, the second set of sub-experiments verified the validity of multi-dimension local attention and global attention in CCFEM module, and the third set of sub-experiments verified the validity of strip pooling and CA submodules in CIFEM module. In Table 3, 2-Branch indicates that the CSFEM module uses two branches of Scales 3 and 5; 3-Branch indicates that the CSFEM module uses three branches of Scale 3, 5, and 7; 4-Branch indicates that the CSFEM module uses four branches of Scales 1, 3, 5 and 7. As shown in Table 3, the results of the four branches on Acc, Dice, MIoU, Voe, and Rvd are 0.3%, 0.85%, 1.46%, 1.06%, and 1.09% higher than those of the sub-optimal results, and 0.6%, 1.55%, 2.59%, 2.26% and 2.89% higher than those of the worst results. From the radar diagram in Fig. 6a, it can be intuitively seen that CSFEM results using four different scale branches are superior to the other results. In addition, using 2 branches and 3 branches will result in segmentation white dots, as shown in Column 5 and Column 6 of Row 2 of the segmentation results Fig. 6b. In Table 4, StripePool represents the result of adding strip pooling to the second self-attention in the CIFEM module, and CA represents the result of adding the cross-fusion attention operation at the beginning of the CIFEM module. As shown in Table 4, Acc, Dice, Miou, Voe, and Rvd using strip pooling and cross fusion was 0.47%, 1.07%, 1.75%, 1.44%, and 1.96% higher than the sub-optimal results, and 0.57%, 2.55%, 3.27%, 4.45%, and 3.03% higher than the worst results. Also, it can be seen from the visual segmentation results in Fig. 7b that incomplete segmentation and false positive segmentation around lesions occurred when only self-attention with strip pooling was used, while the results of combined application of self-attention with strip pooling and cross-fusion attention significantly improved the above problems, as shown in Columns 6 and 7 of Rows 2 and 6 and 7 of Row 4 in Fig. 7.
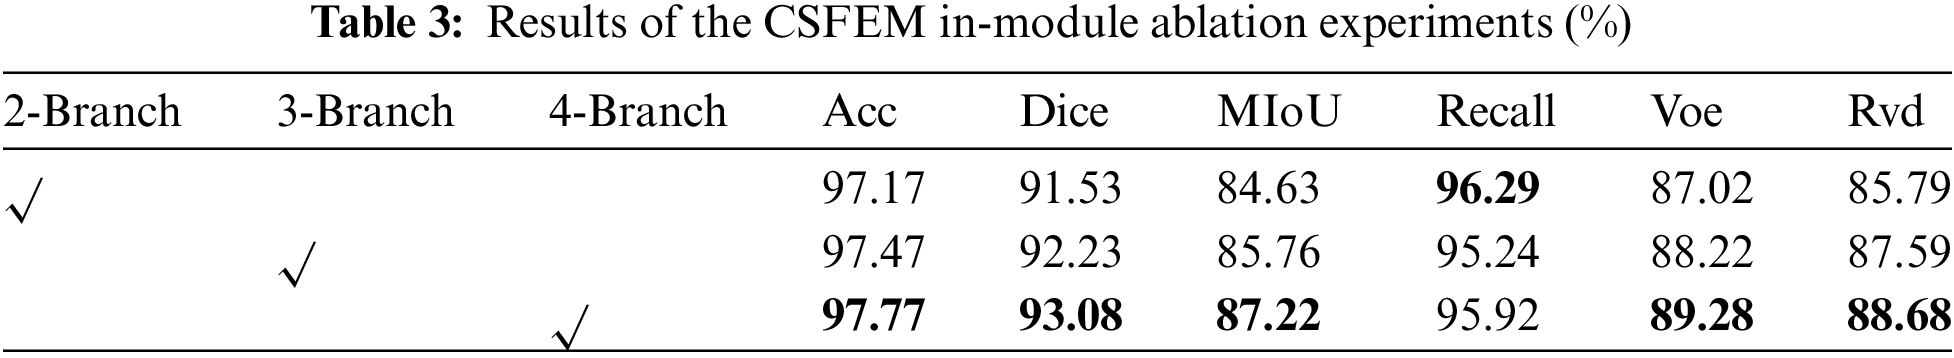

Figure 6: Radar chart (a) and visual segmentation results (b) of the CSFEM in-module ablation experiments
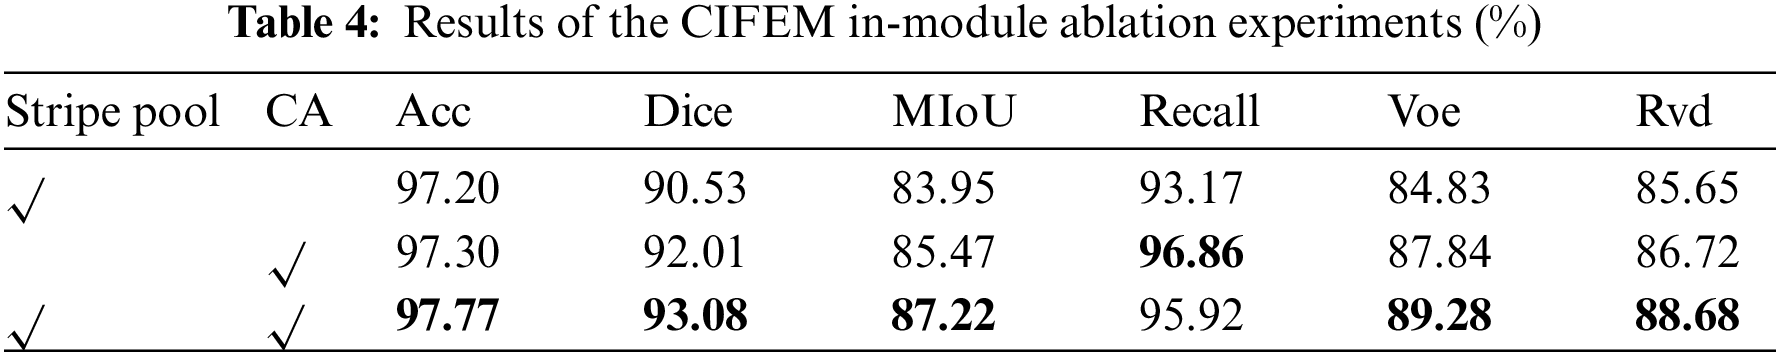

Figure 7: Radar chart (a) and visual segmentation results (b) of the CIFEM in-module ablation experiments
In Table 5, 3-Branch means that the CCFEM module only uses branches of attention with three different dimensions; 4-Branch means that the CCFEM module uses branches of attention with three different dimensions and branches of global attention; 5-Branch means that the CCFEM module uses branches of attention with three different dimensions, branches of global attention and branches of original information. As shown in Fig. 8, undersegmentation is observed in both 3-Branch and 4-Branch. And 5-Branch effectively solved this problem.
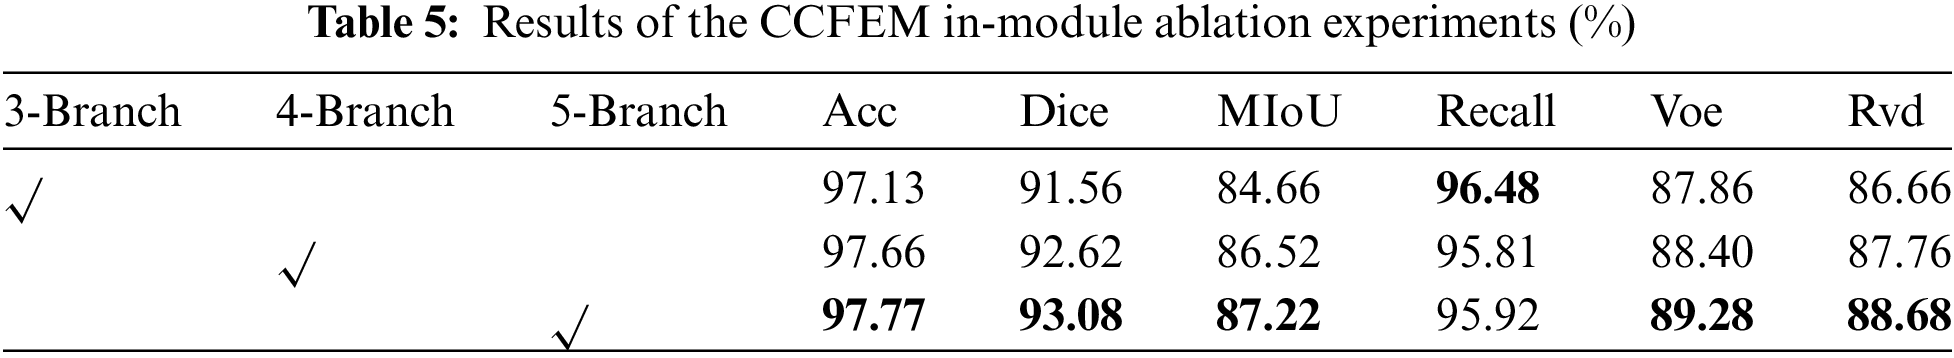

Figure 8: Radar chart (a) and visual segmentation results (b) of the CCFEM in-module ablation experiments
As shown in Table 5, it is effective to combine the global information obtained by the global attention mechanism with the local information obtained by the local attention mechanism. The identification of lesions as normal tissues and the identification of normal tissues as lesions are effectively alleviated. The results of 5-Branch on Acc, Dice, MIoU, Voe, and Rvd are 0.11%, 0.46%, 0.7%, 0.88%, and 0.92% higher than those of the sub-optimal results, and 0.64%, 1.52%, 2.56%, 1.42% and 2.02% higher than those of the worst results.
3) Comparative experiments
This group of experiments proves the effectiveness of the proposed model by comparing 6 classical and advanced networks, and the experimental results are shown in Table 6. U-Net, U-Net++, Attention U-Net, and multi-scale transformer global attention network (MsTGANet) are single-modal segmentation networks.
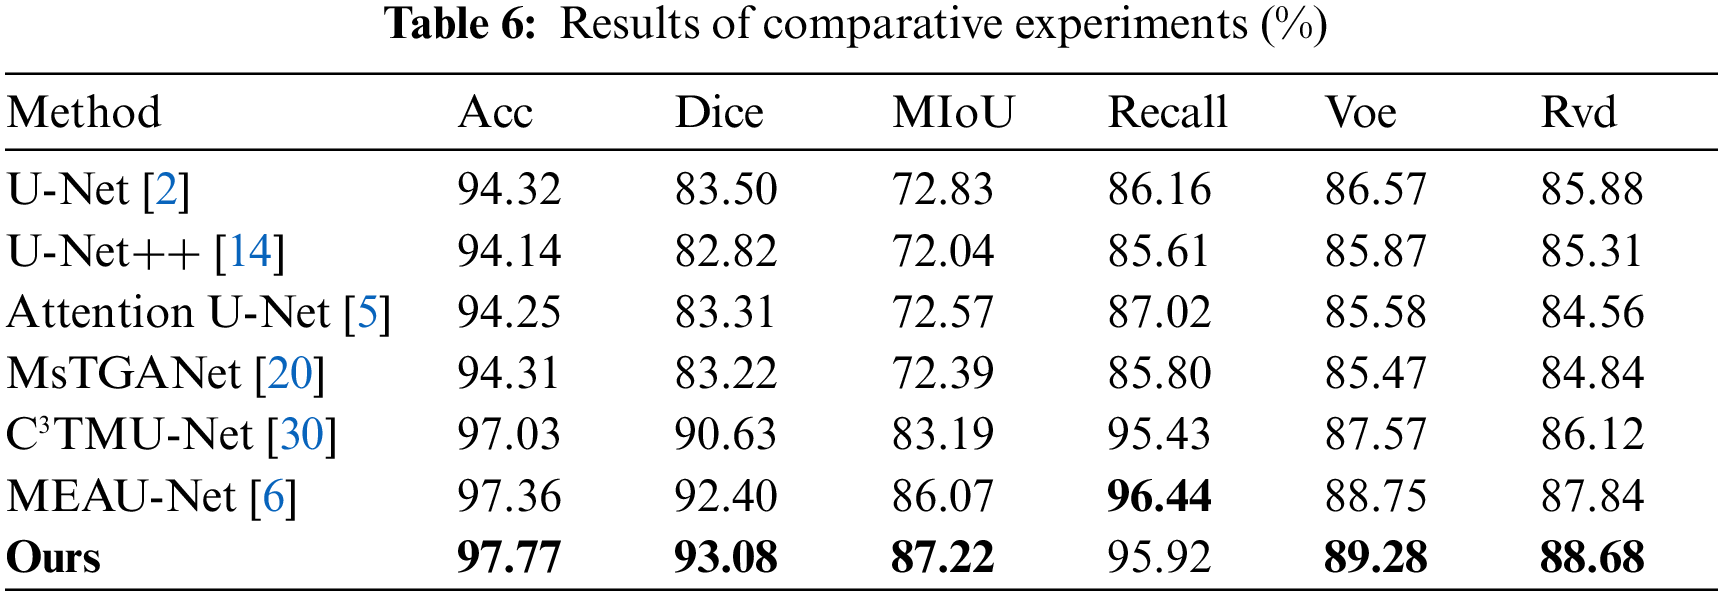
C3TMU-Net and MEAU-Net [6] are multi-modal segmentation networks. As shown in Fig. 9b, incomplete segmentation of lesions occurred in the U-Net++ network, as shown in Row 4 and Column 6. Although MsTGANet does not have incomplete segmentation of large areas of lesions, it does have segmentation white spots, as shown in Row 1 and Column 8. MEAU-Net and C3TMU-Net are multi-modal segmentation networks in which 3-modal images are used as input. There is also the phenomenon of incomplete segmentation, as shown in Row 5, Column 9, and Column 10. In summary, the segmentation ability of a single-modal image segmentation network is weaker than that of a multi-modal image segmentation network. Table 6 shows the experimental results of the comparison between this network and the other 6 networks. Compared with the sub-optimal results, the results of Acc, Dice, MIoU, Voe, and Rvd were higher by 0.41%, 0.68%, 1.15%, 0.53%, and 0.84%, respectively, and the Recall index was lower by 0.52% than the optimal results. Compared with the worst results, the results of Acc, Dice, MIoU, Recall, Voe, and Rvd are 3.63%, 10.26%, 15.18%, 10.31%, 3.81%, and 4.12%, respectively.

Figure 9: Radar chart (a) and visual segmentation results (b) of the comparative experiments
4) PET image feature-guided experiments
To verify the effectiveness of segmentation with PET image guidance model, the results without PET image guidance are compared with those with PET image guidance. The results are shown in Fig. 10. The first column is the CT image, the second column is the PET/CT image, the third column is the PET image, the fourth column is the corresponding ground truth, the fifth column is the heat map of attention map with PET image guidance, the sixth column is the heat map of attention map without PET image guidance, and the last column is the heat map of PET attention map. The addition of PET image guidance effectively suppressed the background noise. Moreover, it can be seen from Fig. 10 that incomplete segmentation and false positive segmentation exist in the results without PET image guidance.

Figure 10: Radar chart (a) and visual segmentation results (b) of the PET image feature-guided experiments
For example, some lesion areas are segmented into normal tissue areas in the attention map of Row 2 and Column 4. The attention map in Row 2 and Column 10 divides some normal tissue areas into focal areas. As shown in Table 7, the results in Acc, Dice, MIoU, Voe, and Rvd guided by PET significant information are 0.21%, 0.52%, 0.84%, 0.9%, and 1.11% higher than those without guided results. Therefore, it is effective to add the significant feature information of PET images to guide network segmentation to improve the segmentation accuracy of the network.
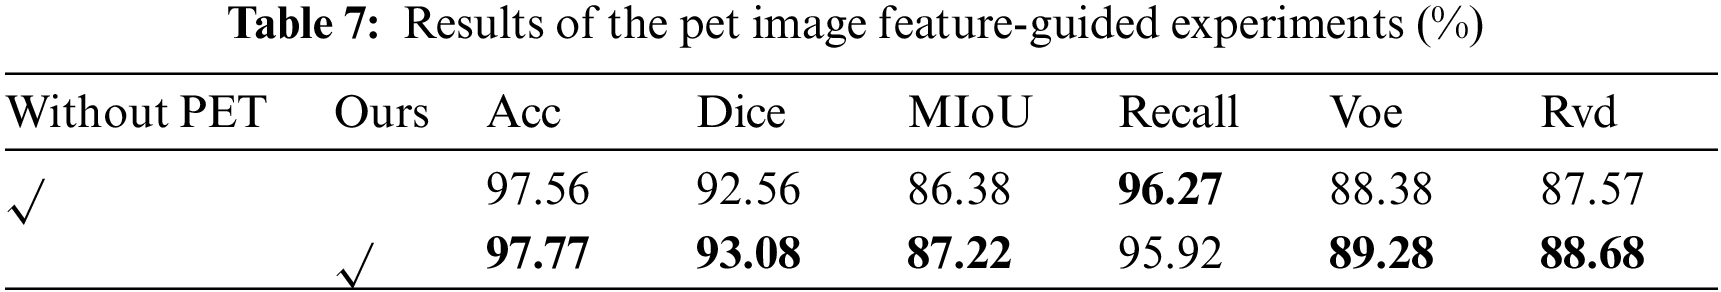
In this paper, PET image features that contain lesion position information are introduced into the skip connection, which not only alleviates the semantic gap between encoder and decoder but also improves the accuracy of network segmentation. As shown in Table 7, the segmentation results guided by PET saliency information are 0.21%, 0.52%, 0.84%, 0.9%, and 1.11% higher than those without guidance in Acc, Dice, MIoU, Voe, and Rvd. In addition, a cross-scale feature enhancement module is designed in the encoder to extract multi-scale feature information in different models, and a cross-layer interactive feature enhancement module is designed to fuse spatial location information and semantic information to enhance the feature extraction ability of the encoder. In the decoder, a cross-dimensional cross-layer feature enhancement module is designed to enhance interactive ability between deep and shallow features, which effectively utilizes the anatomical and functional information of multi-modal medical images, and effectively complements the differences among different modal medical images. As shown in Table 2, the results of the model on Acc, Dice, MIoU, Recall, Voe, and Rvd are 97.77%, 93.08%, 87.27%, 95.92%, 89.28%, and 88.68%, respectively. In the evaluation indicators. A high Acc indicates that the system performs well overall. A high MIoU indicates that the model performs well in the segmentation task. It helps to locate the lesion accurately. A high Dice indicates that the model performs better in distinguishing the lesion from normal tissue. A high Recall indicates that the model can identify most positive cases, which is of great significance for the early detection and treatment of the disease. A Low Voe is helpful to improve the accuracy of segmentation results and improve the reliability of clinical decisions. A Low Rvd is beneficial for tumor volume assessment and tumor treatment monitoring.
Compared with single-modal medical images, multi-modal medical images provide complementary lesion features. It is of great significance to make full use of multi-modal medical image features for precise lesion segmentation. In the future, it can also be studied from the following aspects: a) Low-quality medical image segmentation. The datasets used in this multimodal image segmentation method are PET, CT, and PET/CT. However, there are many other models of medical images, such as MRI (Magnetic Resonance Imaging), fMRI (functional magnetic resonance imaging), X-ray images, ultrasound images, etc., especially ultrasound images, which are fast, cheap, and have wide application in medical institutions. However, there are some problems, such as strong noise, weak boundary information, and difficult location of the interest region. It is a challenge how to segment ultrasound images and others. In future work, the idea of information guidance can be incorporated into the model, and the medical order (text modality) data can be used as a guide to segment single-modal images such as MRI or ultrasound. b) Generalization of the segmentation algorithm. The features of different organs and lesions in different medical images are different. It is unreasonable to generalize the segmentation method of certain organs and lesions in one medical image to other medical images. It is unreasonable to generalize the segmentation method of certain organs and lesions in one medical image to other organs and lesions will lead to the decrease of segmentation accuracy. Hence, how to improve the generalization performance of medical image segmentation is a difficult question. Guided-YNet is a multimodal image segmentation network. For the segmentation of other organs and lesions, PET, CT, and PET/CT images need to be obtained and registered. Secondly, the registered PET, CT and PET/CT images are used as the training set. Finally, the segmentation result is obtained. c) Segmentation of 3D medical images. There are stronger space and depth perception abilities in 3D medical images. It can provide the shape features, spatial position, and relative position relationship with surrounding tissues. Hence, how to precisely segment organs and lesions in 3D medical images is a challenging task. The 3D convolutional neural network is often used to process 3D image data, where 3D convolution and 3D pooling are the keys. Therefore, in future work, 3D data of multiple modalities can be obtained, and 3D convolution and pooling can be applied to the current network to realize the processing of 3D images.
Acknowledgement: The authors would like to thank the anonymous editors and reviewers for their critical and constructive comments and suggestions.
Funding Statement: This work was supported in part by the National Natural Science Foundation of China (Grant No. 62062003), Natural Science Foundation of Ningxia (Grant No. 2023AAC03293).
Author Contributions: Tao Zhou: Conceptualization; Writing–original draft, including substantive translation; Data curation; Supervision. Yunfeng Pan: Development of methodology, creation of models; Designing computer programs, implementation of the computer code; Writing original draft, including substantive translation. Pei Dang: Verification of experimental design, result verification; Testing of existing code components; Writing review & editing. Yujie Guo: Organize references; Validation, including chart drawing. Yaxing Wang: Formal analysis; Test existing programs; Visualization, including visual presentation of data. Huiling Lu: Data collection; Writing review & editing, preparing the content of the paper, including comments, notes, and revisions. All authors reviewed the results and approved the final version of the manuscript.
Availability of Data and Materials: Due to ethical and privacy concerns, it is not convenient to share this data and material.
Ethics Approval: This research was conducted with human volunteers, and all participating human volunteers provided informed consent. The research received approval from the North Minzu University and Ningxia Medical University. The research ethics certificate numbers are Nos. 2024-17 and 2024-G253, respectively.
Conflicts of Interest: The authors declare that they have no conflicts of interest to report regarding the present study.
References
1. J. Peng, H. Y. Luo, G. S. Zhao, C. C. Lin, X. H. Yi and S. J. Chen, “Review of medical image segmentation algorithms under deep learning,” Comput. Eng. Appl., vol. 57, no. 3, pp. 44–57, Feb. 2021. [Google Scholar]
2. O. Ronneberger, P. Fischer, and T. Brox, “U-Net: Convolutional networks for biomedical image segmentation,” in Medical Image Computing and Computer-Assisted Intervention, Munich, Germany, 5–9 Oct 2015, pp. 234–241. [Google Scholar]
3. S. B. Hou, T. Zhou, Y. C. Liu, P. Dang, H. L. Lu and H. B. Shi, “Teeth U-Net: A segmentation model of dental panoramic X-ray images for context semantics and contrast enhancement,” Comput. Biol. Med., vol. 152, no. 2, Jan. 2023, Art. no. 106296. doi: 10.1016/j.compbiomed.2022.106296. [Google Scholar] [PubMed] [CrossRef]
4. H. Y. Zhang, W. H. Ni, Y. Luo, Y. N. Feng, R. X. Song and X. H. Wang, “TUnet-LBF: Retinal fundus image fine segmentation model based on transformer net network and LBF,” Comput. Biol. Med., vol. 159, no. 2, Jun. 2023, Art. no. 106937. doi: 10.1016/j.compbiomed.2023.106937. [Google Scholar] [PubMed] [CrossRef]
5. O. Oktay et al., “Attention U-Net: Learning where to look for the pancreas,” Mar. 2024, arXiv:1804.03999. [Google Scholar]
6. T. Zhou et al., “Cross-modality multi-encoder hybrid attention u-net for lung tumors images segmentation,” Acta Photonica Sin., vol. 51, no. 4, May 2022. [Google Scholar]
7. T. Zhou, Q. R. Cheng, H. L. Lu, Q. Li, X. X. Zhang and S. Qiu, “Deep learning methods for medical image fusion: A review,” Comput. Biol. Med., vol. 160, Jun. 2023, Art. no. 106959. doi: 10.1016/j.compbiomed.2023.106959. [Google Scholar] [PubMed] [CrossRef]
8. A. Gallamini, C. Zwarthoed, and A. Borra, “Positron emission tomography (PET) in oncology,” Cancers, vol. 6, no. 4, pp. 1821–1889, Sep. 2014. doi: 10.3390/cancers6041821. [Google Scholar] [PubMed] [CrossRef]
9. J. Shao, S. Chen, J. Zhou, H. Zhu, Z. Wang and M. Brown, “Application of U-Net and optimized clustering in medical image segmentation: A review,” Comput. Model. Eng. Sci., vol. 136, no. 3, pp. 2173–2219, Mar. 2023. doi: 10.32604/cmes.2023.025499. [Google Scholar] [CrossRef]
10. J. Lin et al., “CKD-TransBTS: Clinical knowledge-driven hybrid transformer with modality-correlated cross-attention for brain tumor segmentation,” IEEE Trans. Med. Imaging, vol. 42, no. 8, pp. 2451–2461, Aug. 2023. doi: 10.1109/TMI.2023.3250474. [Google Scholar] [PubMed] [CrossRef]
11. C. Xu, Q. Li, X. Jiang, D. Yu, and Y. Zhou, “Dual-space graph-based interaction network for RGB-thermal semantic segmentation in electric power scene,” IEEE Trans. Circuits Syst. Video Technol., vol. 33, no. 4, pp. 1577–1592, Apr. 2023. doi: 10.1109/TCSVT.2022.3216313. [Google Scholar] [CrossRef]
12. H. Yang, T. Zhou, Y. Zhou, Y. Zhang, and H. Fu, “Flexible fusion network for multi-modal brain tumor segmentation,” IEEE J. Biomed. Health Inform., vol. 27, no. 7, pp. 3349–3359, Jul. 2023. doi: 10.1109/JBHI.2023.3271808. [Google Scholar] [PubMed] [CrossRef]
13. M. Wang, H. Jiang, T. Shi, and Y. D. Yao, “SCL-Net: Structured collaborative learning for PET/CT based tumor segmentation,” IEEE J. Biomed. Health Inform., vol. 27, no. 2, pp. 1048–1059, Feb. 2023. doi: 10.1109/JBHI.2022.3226475. [Google Scholar] [PubMed] [CrossRef]
14. Z. Zhou, M. M. R. Siddiquee, N. Tajbakhsh, and J. Liang, “UNet++: A nested U-Net architecture for medical image segmentation,” in Deep Learning in Medical Image Analysis and Multimodal Learning for Clinical Decision Support, Granada, Spain, 20 Sep. 2018, pp. 3–11. [Google Scholar]
15. G. J. Li, D. H. Jin, Q. Yu, and M. Qi, “IB-TransUNet: Combining information bottleneck and transformer for medical image segmentation,” J. King Saud Univ.-Comput. Inf. Sci., vol. 35, no. 3, pp. 249–258, Mar. 2023. doi: 10.1016/j.jksuci.2023.02.012. [Google Scholar] [CrossRef]
16. M. Ding, Z. Lin, C. H. Lee, C. H. Tan, and W. Huang, “A multi-scale channel attention network for prostate segmentation,” IEEE Trans. Circuits Syst. II, vol. 70, no. 5, pp. 1754–1758, May 2023. doi: 10.1109/TCSII.2023.3257728. [Google Scholar] [CrossRef]
17. A. L. Y. Hung, H. Zheng, Q. Miao, S. S. Raman, D. Terzopoulos and K. Sung, “CAT-Net: A cross-slice attention transformer model for prostate zonal segmentation in MRI,” IEEE Trans. Med. Imaging, vol. 42, no. 1, pp. 291–303, Jan. 2023. doi: 10.1109/TMI.2022.3211764. [Google Scholar] [PubMed] [CrossRef]
18. J. Liu, J. Shang, R. Liu, and X. Fan, “Attention-guided global-local adversarial learning for detail-preserving multi-exposure image fusion,” IEEE Trans. Circuits Syst. Video Technol., vol. 32, no. 8, pp. 5026–5040, Aug. 2022. doi: 10.1109/TCSVT.2022.3144455. [Google Scholar] [CrossRef]
19. H. Wang, P. Cao, J. Wang, and O. R. Zaiane, “UCTransNet: Rethinking the skip connections in U-Net from a channel-wise perspective with transformer,” in Proc. AAAI Conf. Artif. Intell., Feb. 22 2022–Mar. 1 2022, pp. 2441–2449. [Google Scholar]
20. M. Wang et al., “MsTGANet: Automatic drusen segmentation from retinal OCT images,” IEEE Trans. Med. Imaging, vol. 41, no. 2, pp. 394–406, Feb. 2022. doi: 10.1109/TMI.2021.3112716. [Google Scholar] [PubMed] [CrossRef]
21. A. Khan, H. Kim, and L. Chua, “PMED-Net: Pyramid based multi-scale encoder-decoder network for medical image segmentation,” IEEE Access, vol. 9, pp. 55988–55998, Apr. 2021. doi: 10.1109/ACCESS.2021.3071754. [Google Scholar] [CrossRef]
22. Y. Pang, Y. Li, J. Shen, and L. Shao, “Towards bridging semantic gap to improve semantic segmentation,” in Proc. IEEE/CVF Int. Conf. Comput. Vision, Republic of Korea, Oct. 27–Nov. 2 2019, pp. 4230–4239. [Google Scholar]
23. J. Zhang, Q. G. Qin, Q. Ye, and T. Ruan, “ST-Unet: Swin transformer boosted U-Net with cross-layer feature enhancement for medical image segmentation,” Comput. Biol. Med., vol. 153, no. 1, Feb. 2023, Art. no. 106516. doi: 10.1016/j.compbiomed.2022.106516. [Google Scholar] [PubMed] [CrossRef]
24. S. J. Luo, H. Y. Jiang, and M. Wang, “C2BA-UNet: A context-coordination multi-atlas boundary-aware UNet-like method for PET/CT images based tumor segmentation,” Comput. Med. Imaging Graph, vol. 103, no. 2, Jan. 2023, Art. no. 102159. doi: 10.1016/j.compmedimag.2022.102159. [Google Scholar] [PubMed] [CrossRef]
25. W. Luo, Y. Li, R. Urtasun, and R. Zemel, “Understanding the effective receptive field in deep convolutional neural networks,” in NIPS’16: Proc. 30th Int. Conf. Neural Inform. Process. Syst., Barcelona, Spain, Dec. 5–10, 2016, pp. 4905–4913. [Google Scholar]
26. Z. Peng et al., “Conformer: Local features coupling global representations for recognition and detection,” IEEE Trans. Pattern Anal. Mach. Intell., vol. 45, no. 8, pp. 9454–9468, Aug. 2023. doi: 10.1109/TPAMI.2023.3243048. [Google Scholar] [PubMed] [CrossRef]
27. A. Lin, B. Chen, J. Xu, Z. Zhang, G. Lu and D. Zhang, “DS-TransUNet: Dual swin transformer U-Net for medical image segmentation,” IEEE Trans. Instrum. Meas., vol. 71, pp. 1–15, May 2022. doi: 10.1109/TIM.2022.3178991. [Google Scholar] [CrossRef]
28. J. N. Chen et al., “TransUNet: Transformers make strong encoders for medical image segmentation,” Feb. 2021, arXiv:2102.04306. [Google Scholar]
29. Q. Hou, Z. Jiang, L. Yuan, M. M. Cheng, S. Yan and J. Feng, “Vision permutator: A permutable MLP-like architecture for visual recognition,” IEEE Trans. Pattern Anal. Mach. Intell., vol. 45, no. 1, pp. 1328–1334, Jan. 2023. doi: 10.1109/TPAMI.2022.3145427. [Google Scholar] [PubMed] [CrossRef]
30. T. Zhou, P. Dang, H. L. Lu, S. B. Hou, C. Y. Peng and H. B. Shi, “A transformer segmentation model for PET/CT images with cross-modal, cross-scale and cross-dimensional,” J. Elect. & Inform. Technol., vol. 45, no. 10, pp. 3529–3537, Oct. 2023. [Google Scholar]
Cite This Article
 Copyright © 2024 The Author(s). Published by Tech Science Press.
This work is licensed under a Creative Commons Attribution 4.0 International License , which permits unrestricted use, distribution, and reproduction in any medium, provided the original work is properly cited.
 Downloads
 Citation Tools